

Polyphenol-Rich Cranberry Beverage Positively Affected Skin Health, Skin Lipids, Skin Microbiome, Inflammation, and Oxidative Stress in Women in a Randomized Controlled Trial

 , and
, and
Abstract
:1. Introduction
2. Materials and Methods
2.1. Study Beverages
2.2. Power Analysis
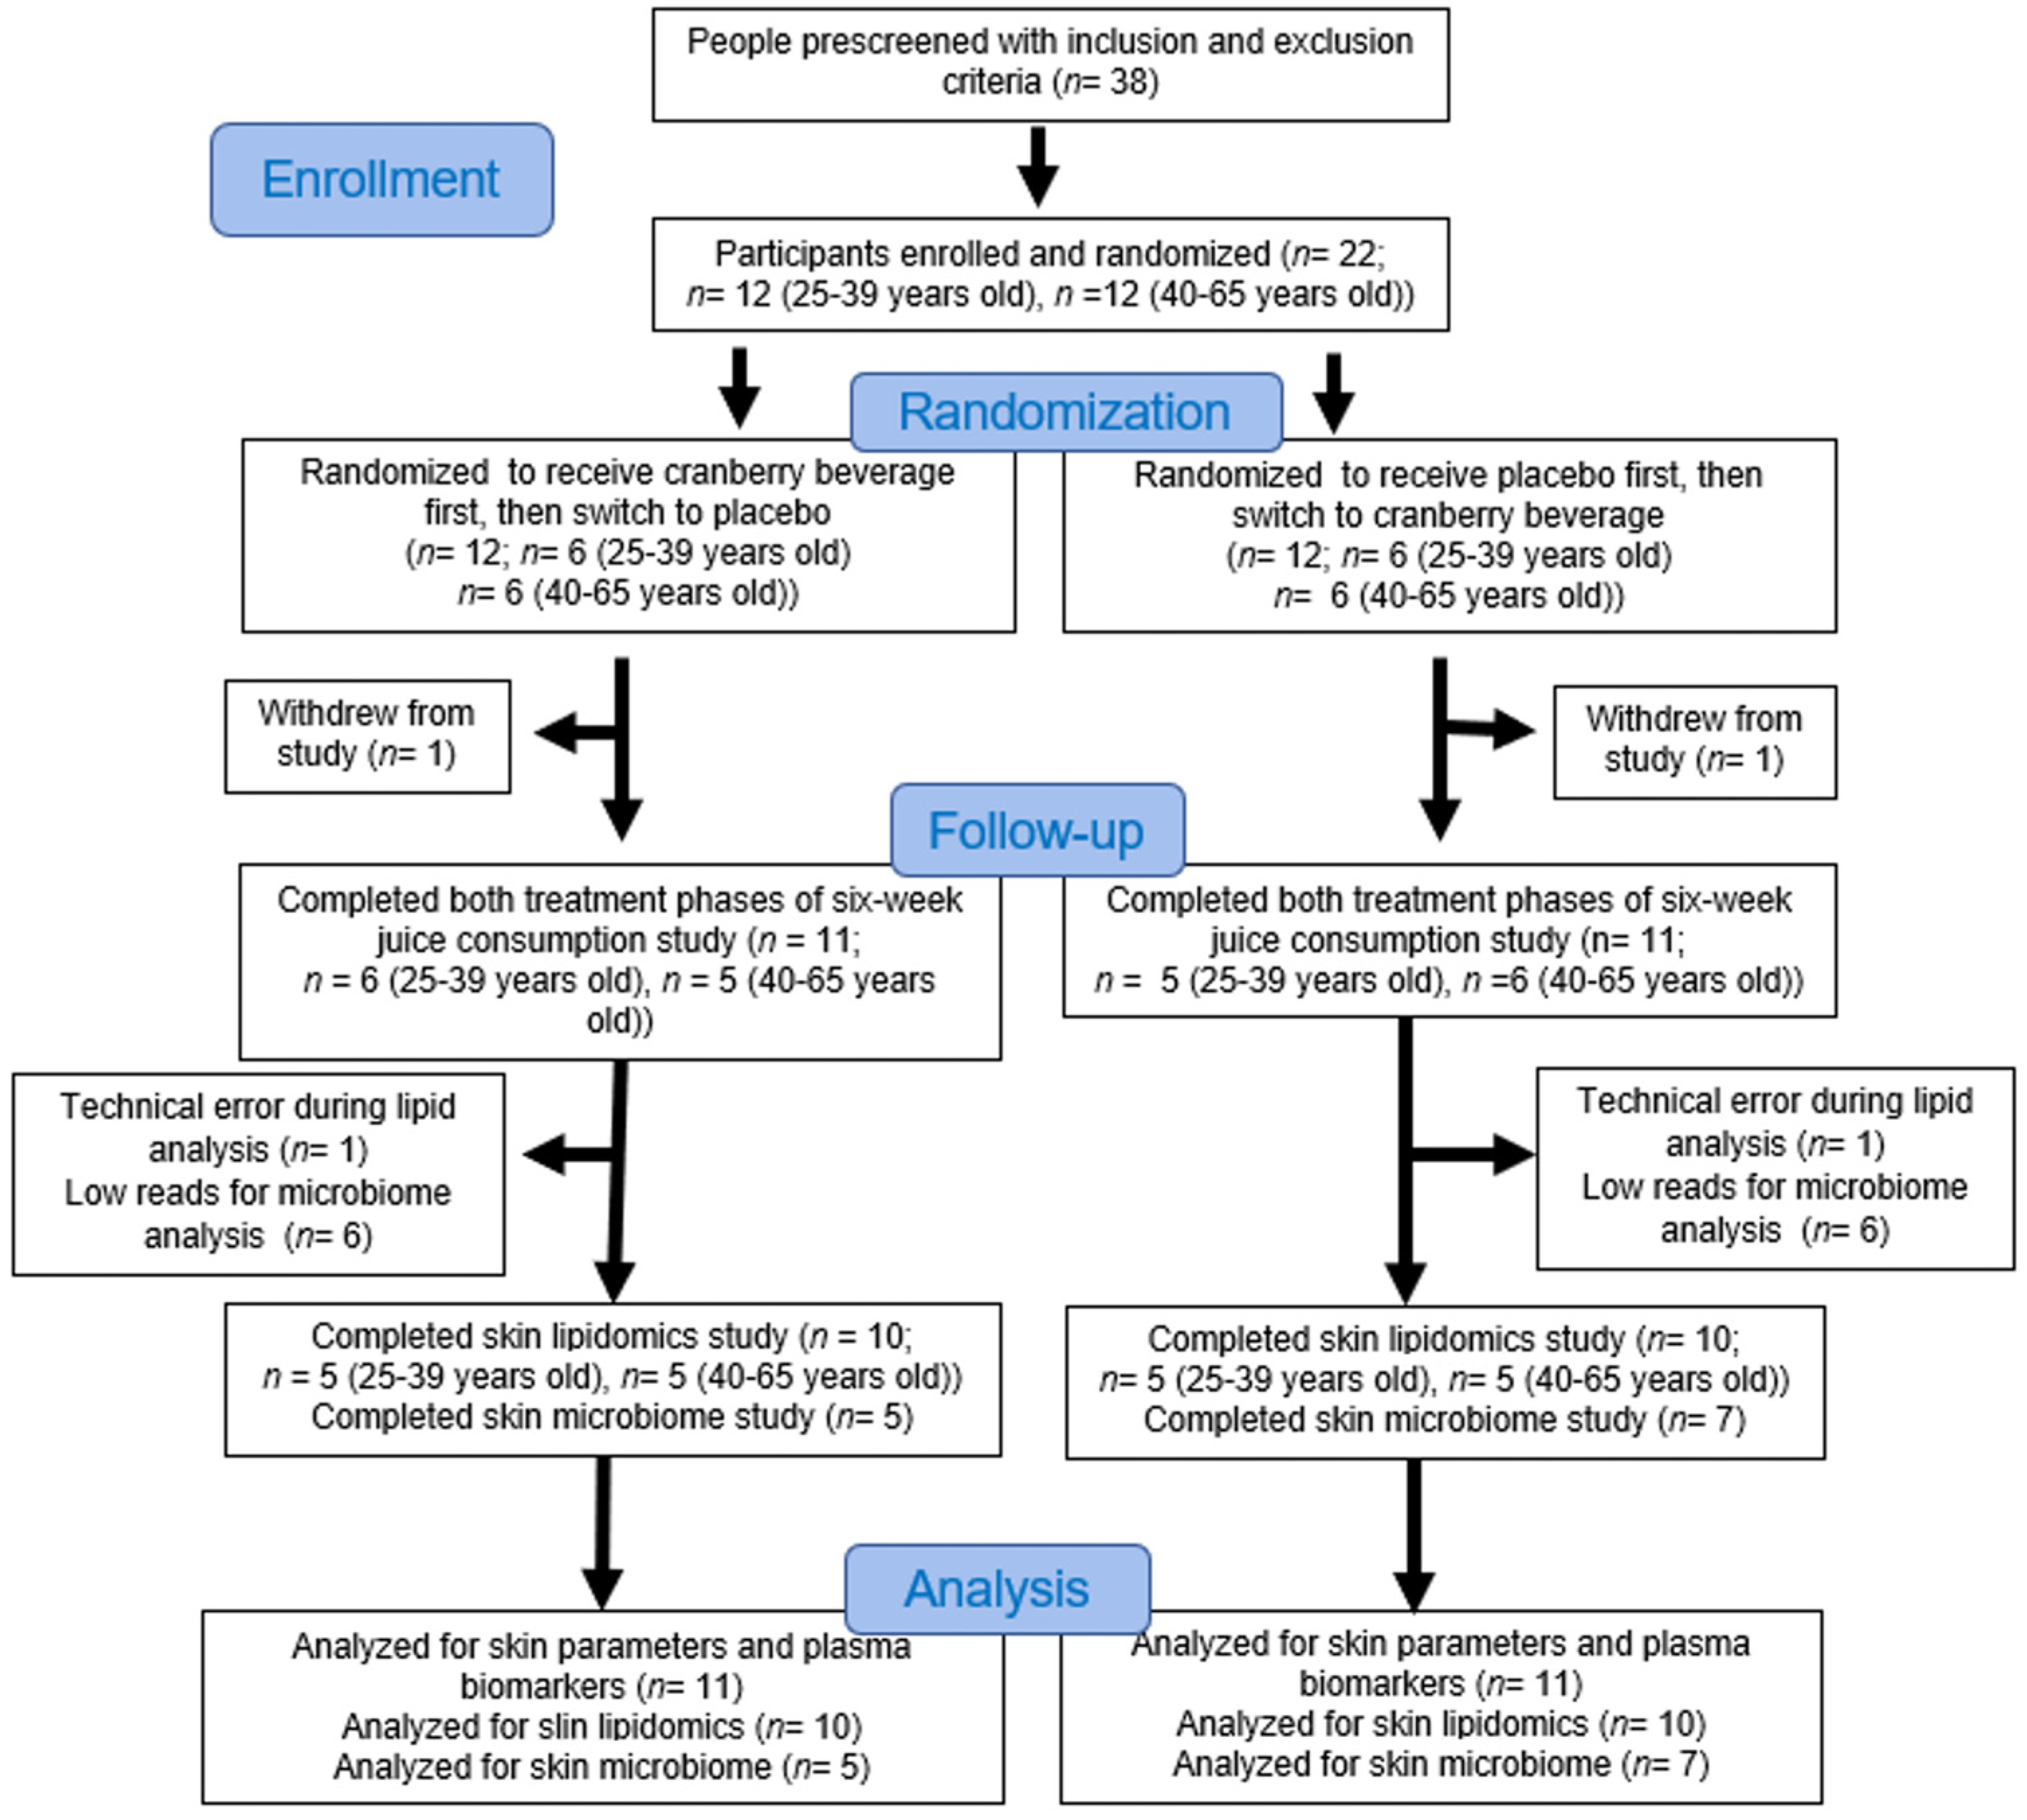
2.3. Study Design
2.4. Blood Samples
2.5. UV-Induced Skin Erythema
2.6. Skin Parameter Testing
2.7. Blood Inflammatory and Oxidative Stress Markers
2.8. Skin Lipid Sampling and Analysis
2.9. Cutaneous Microbiota Sampling and Analysis
2.10. Shotgun Metagenomic Data Analysis
2.11. Statistics
3. Results
3.1. Characteristics of Subjects at Baseline
3.2. Cranberry Beverage Protected against UV Irradiation
3.3. Cranberry Beverage Improved Net Elasticity and Smoothness on the Face
3.4. Cranberry Beverage Improved Gross Elasticity and Net Elasticity on the Forearm
3.5. Cranberry Beverage Modulated Inflammatory and Oxidative Stress Biomarkers
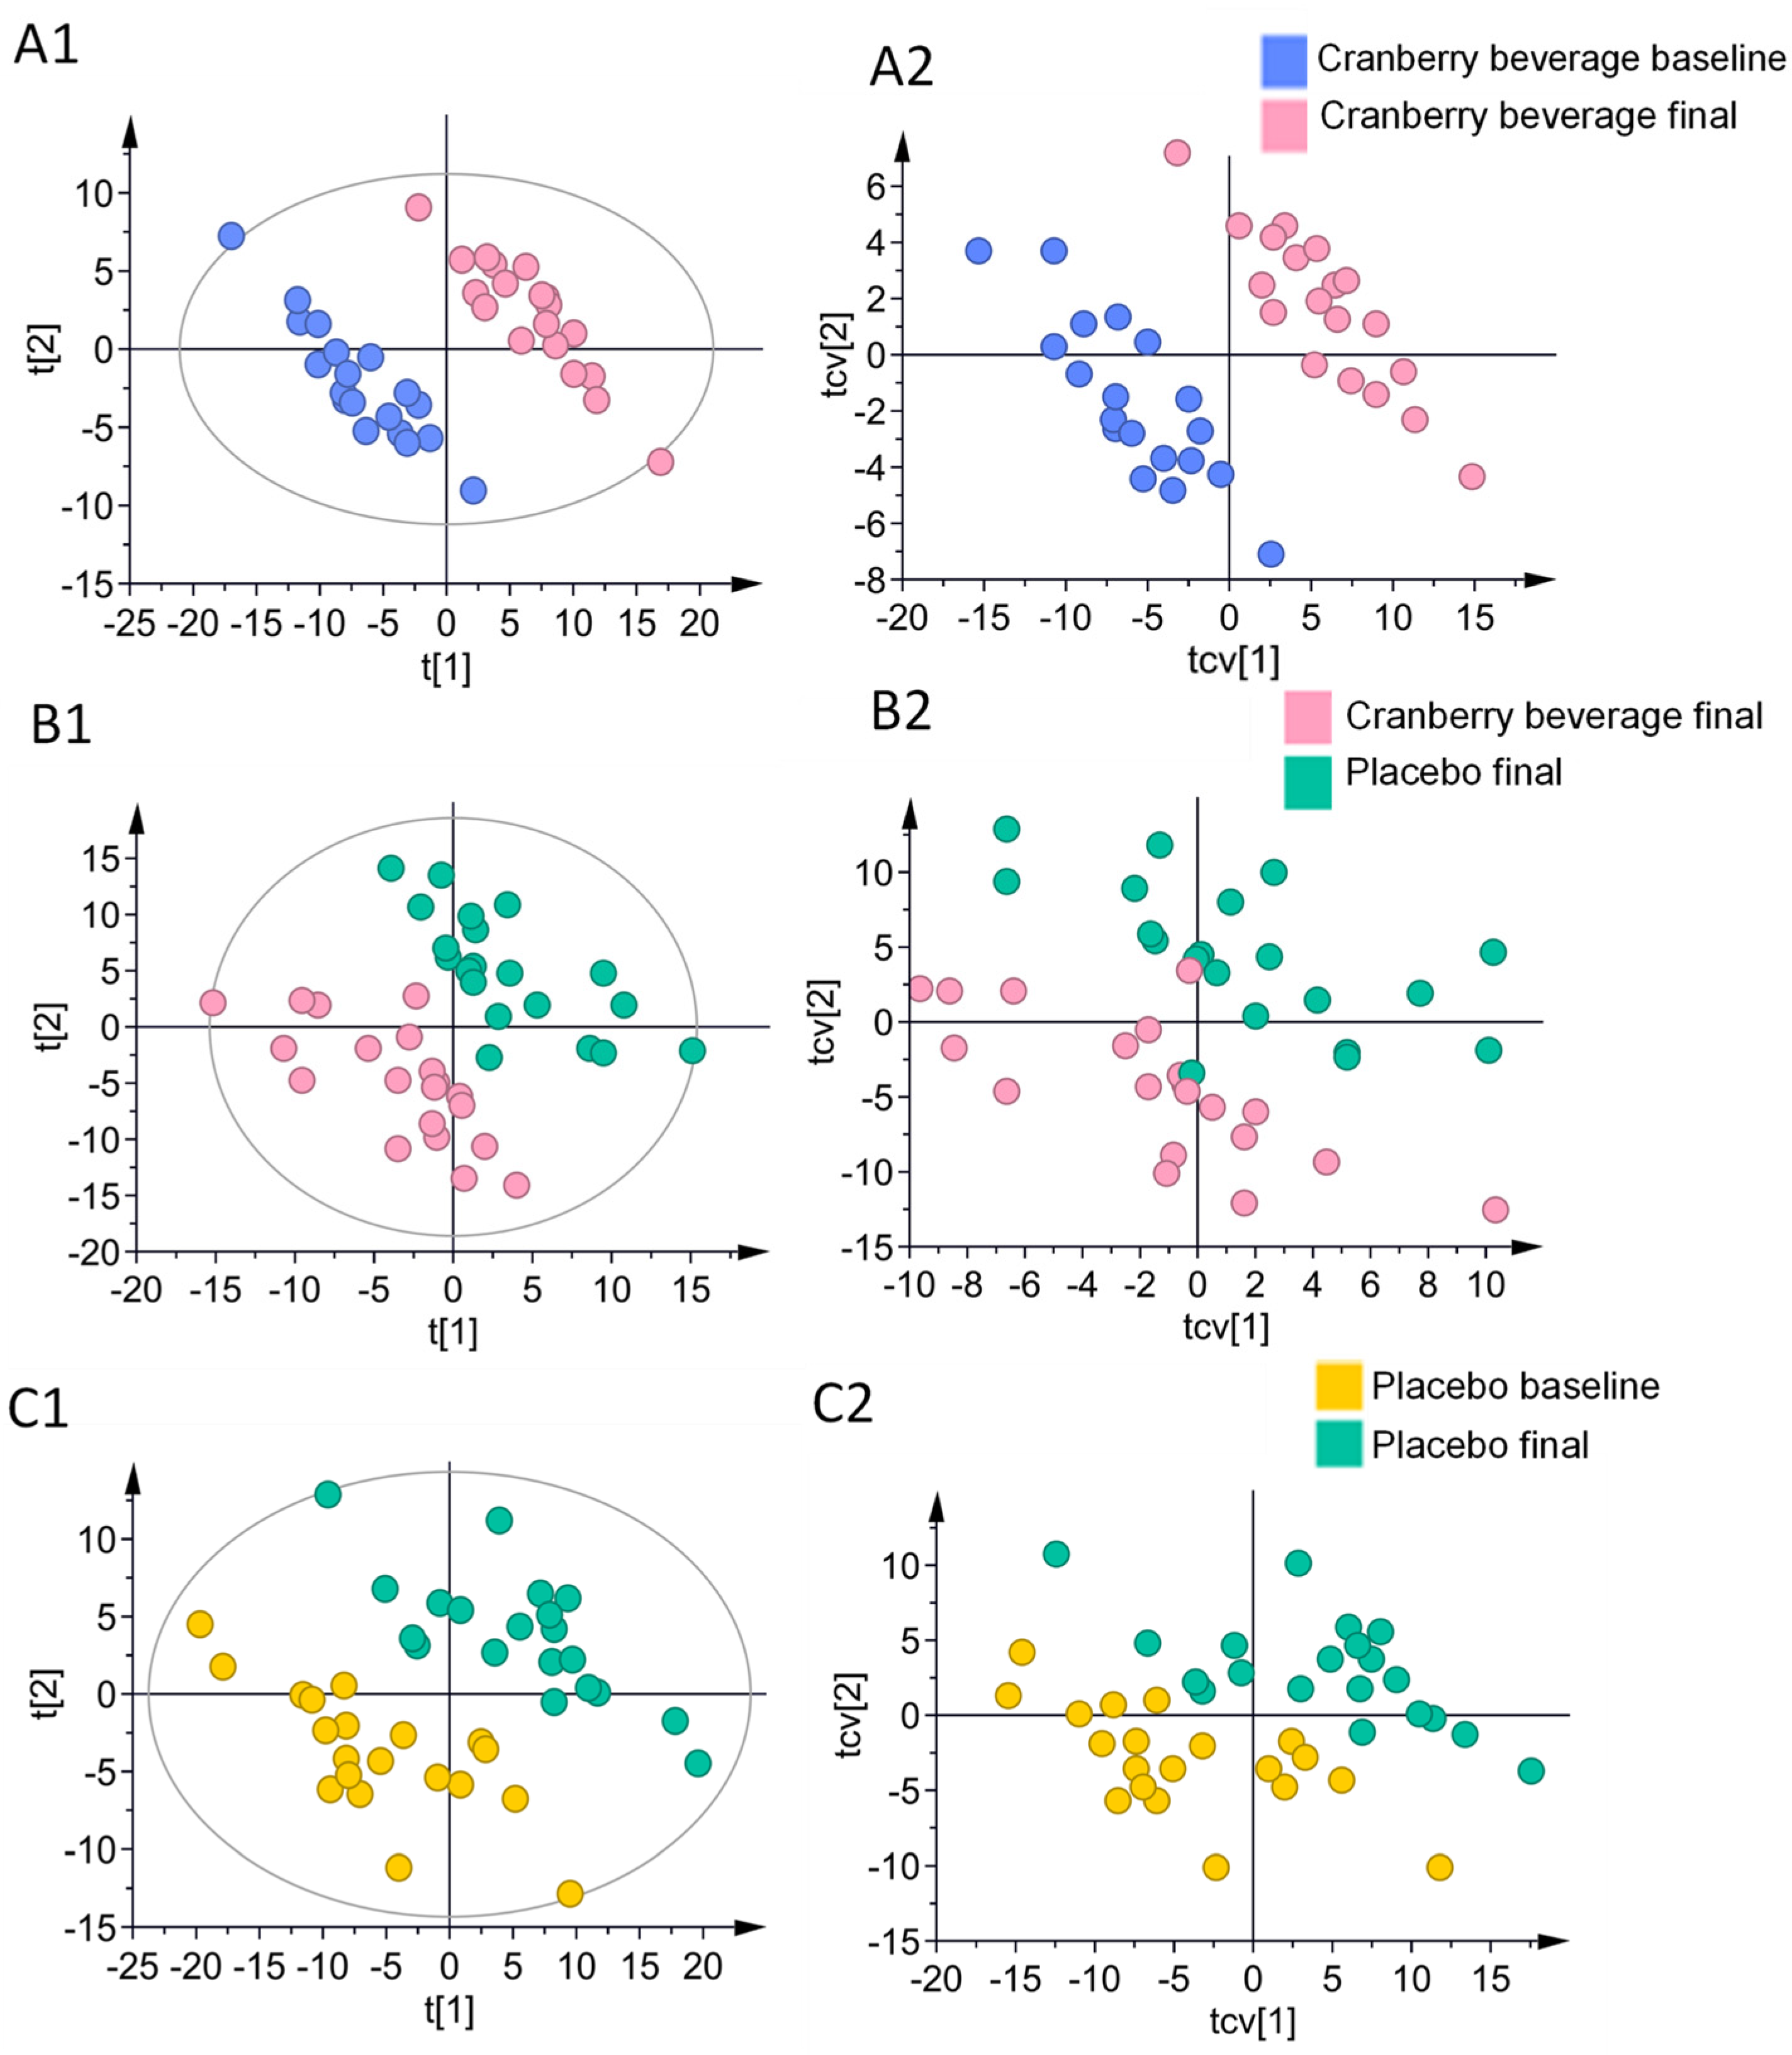
3.6. Multivariate Analysis of Skin Lipids
3.7. Discriminant Skin Lipids after Cranberry Beverage and Placebo Consumption
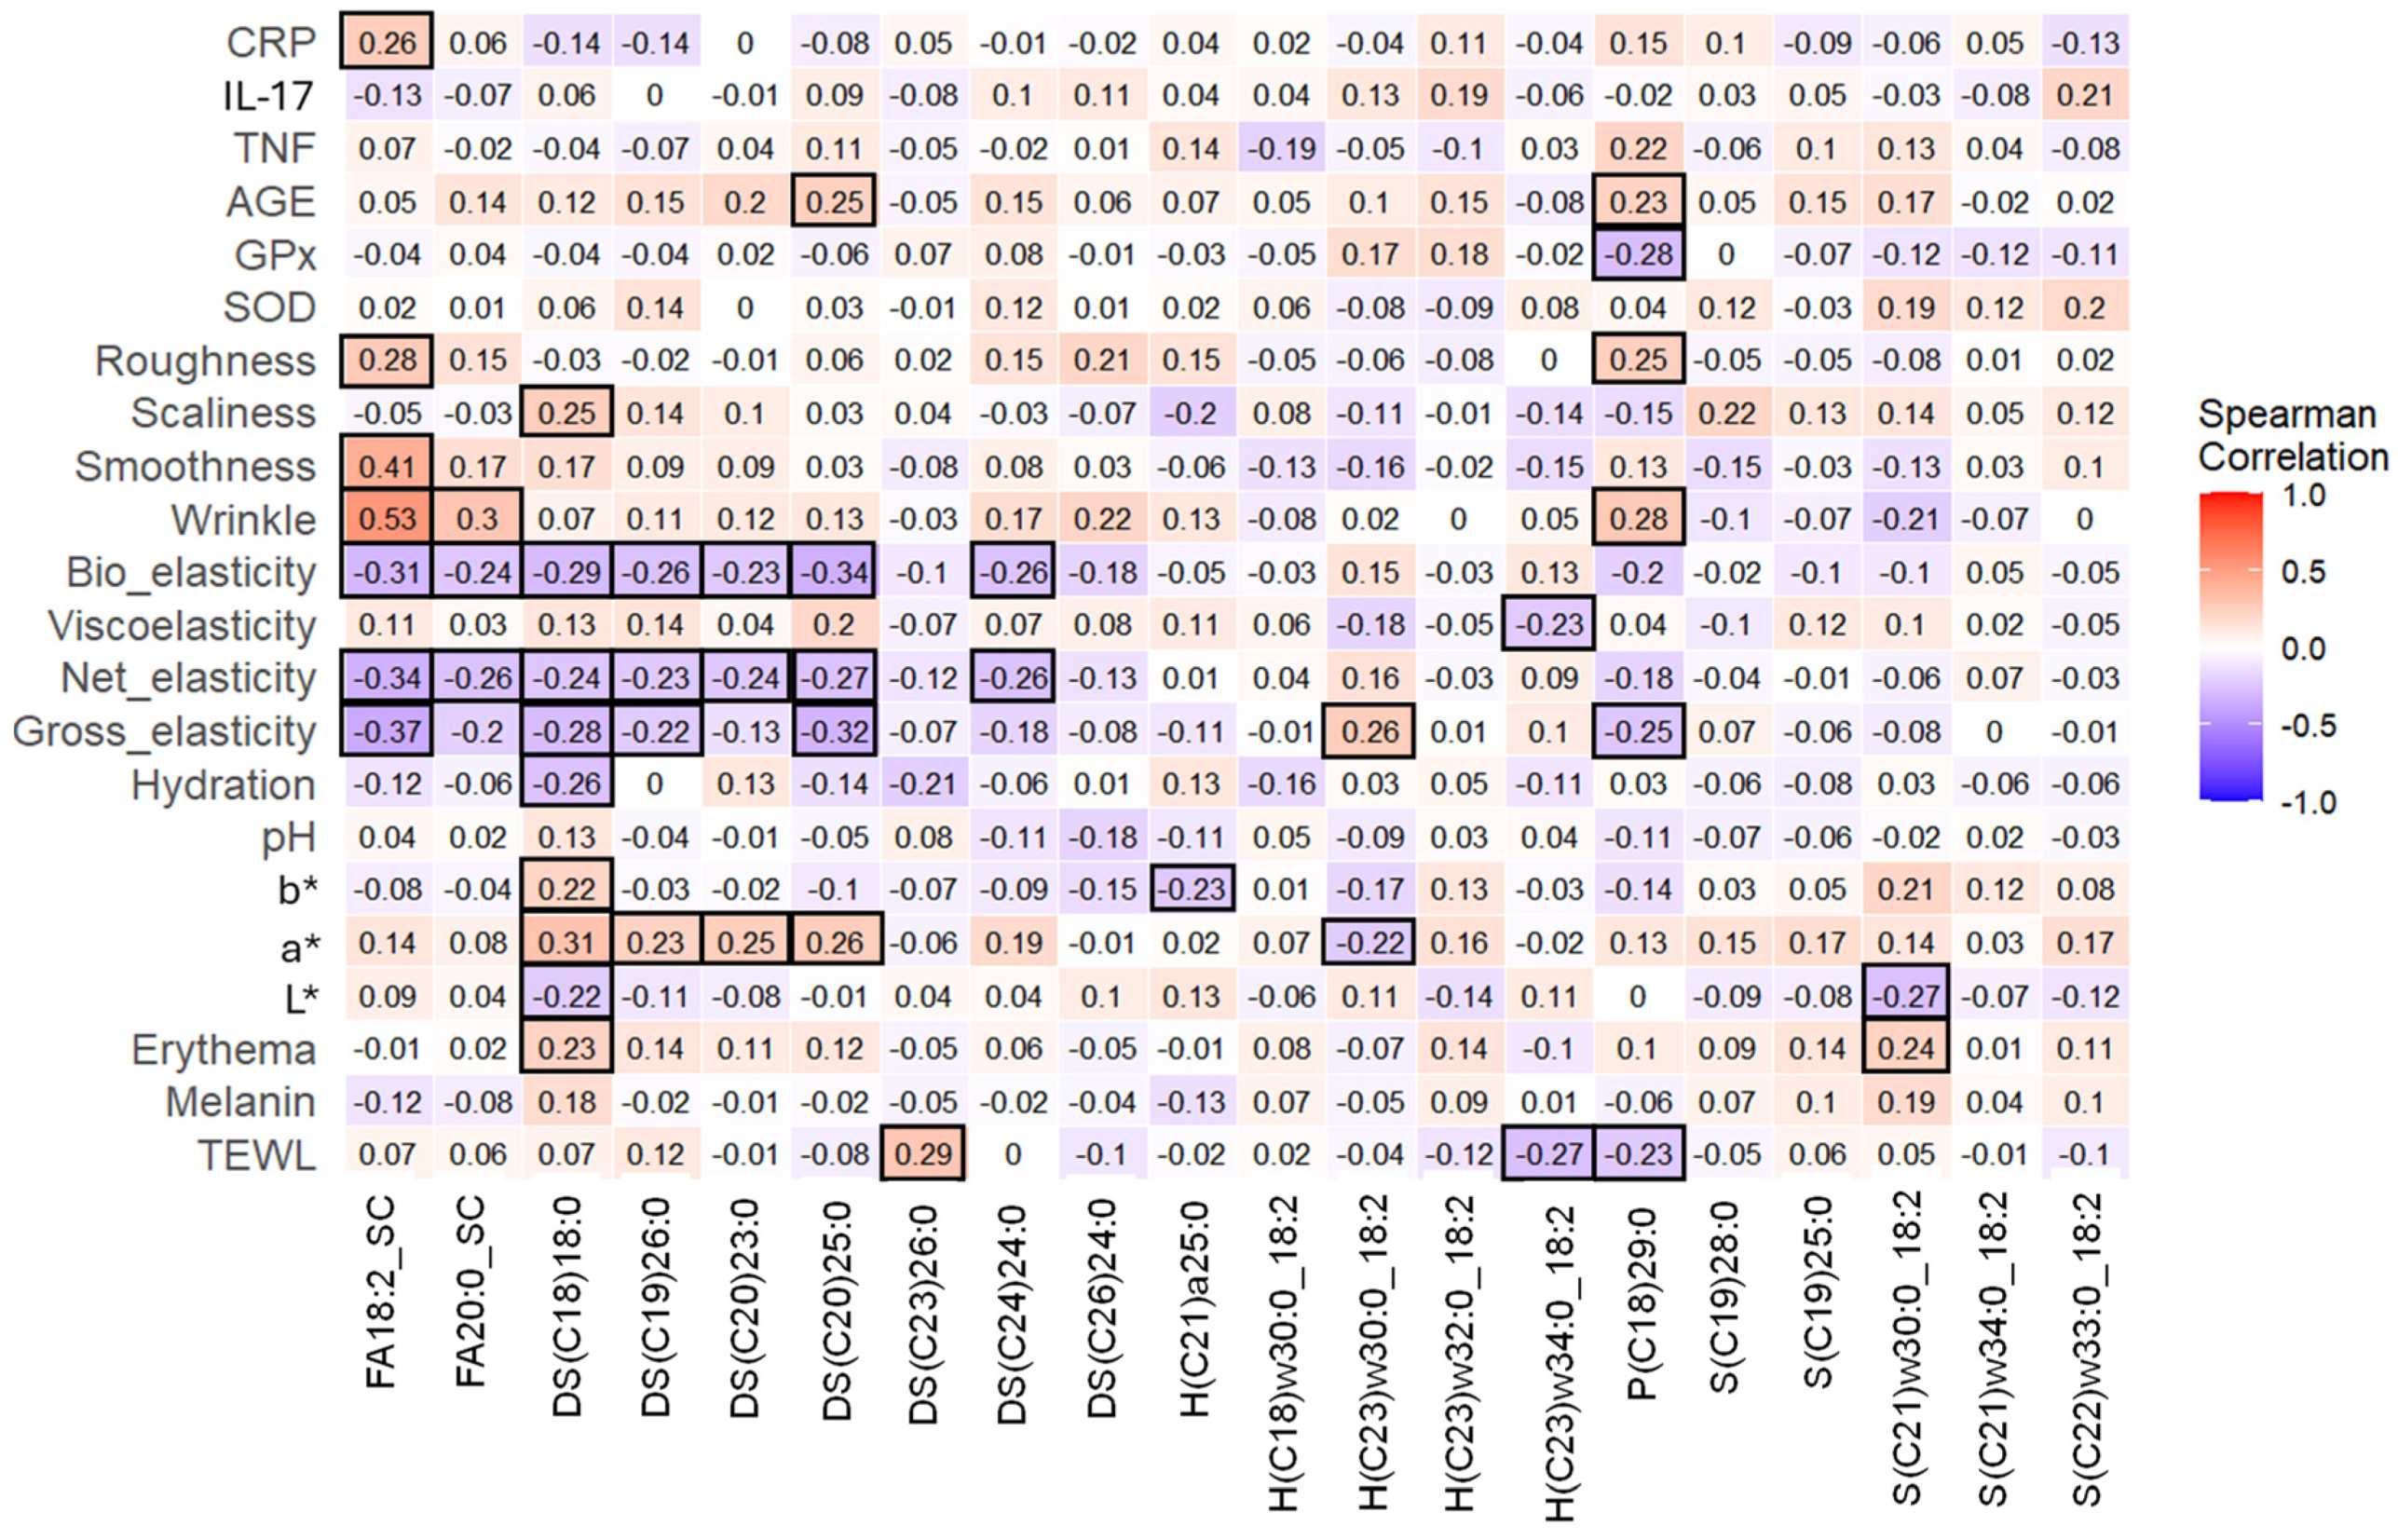
3.8. Discriminant Skin Lipids Correlated with Some Skin Parameters
3.9. Cranberry Beverage Did Not Affect Skin Microbial Diversity
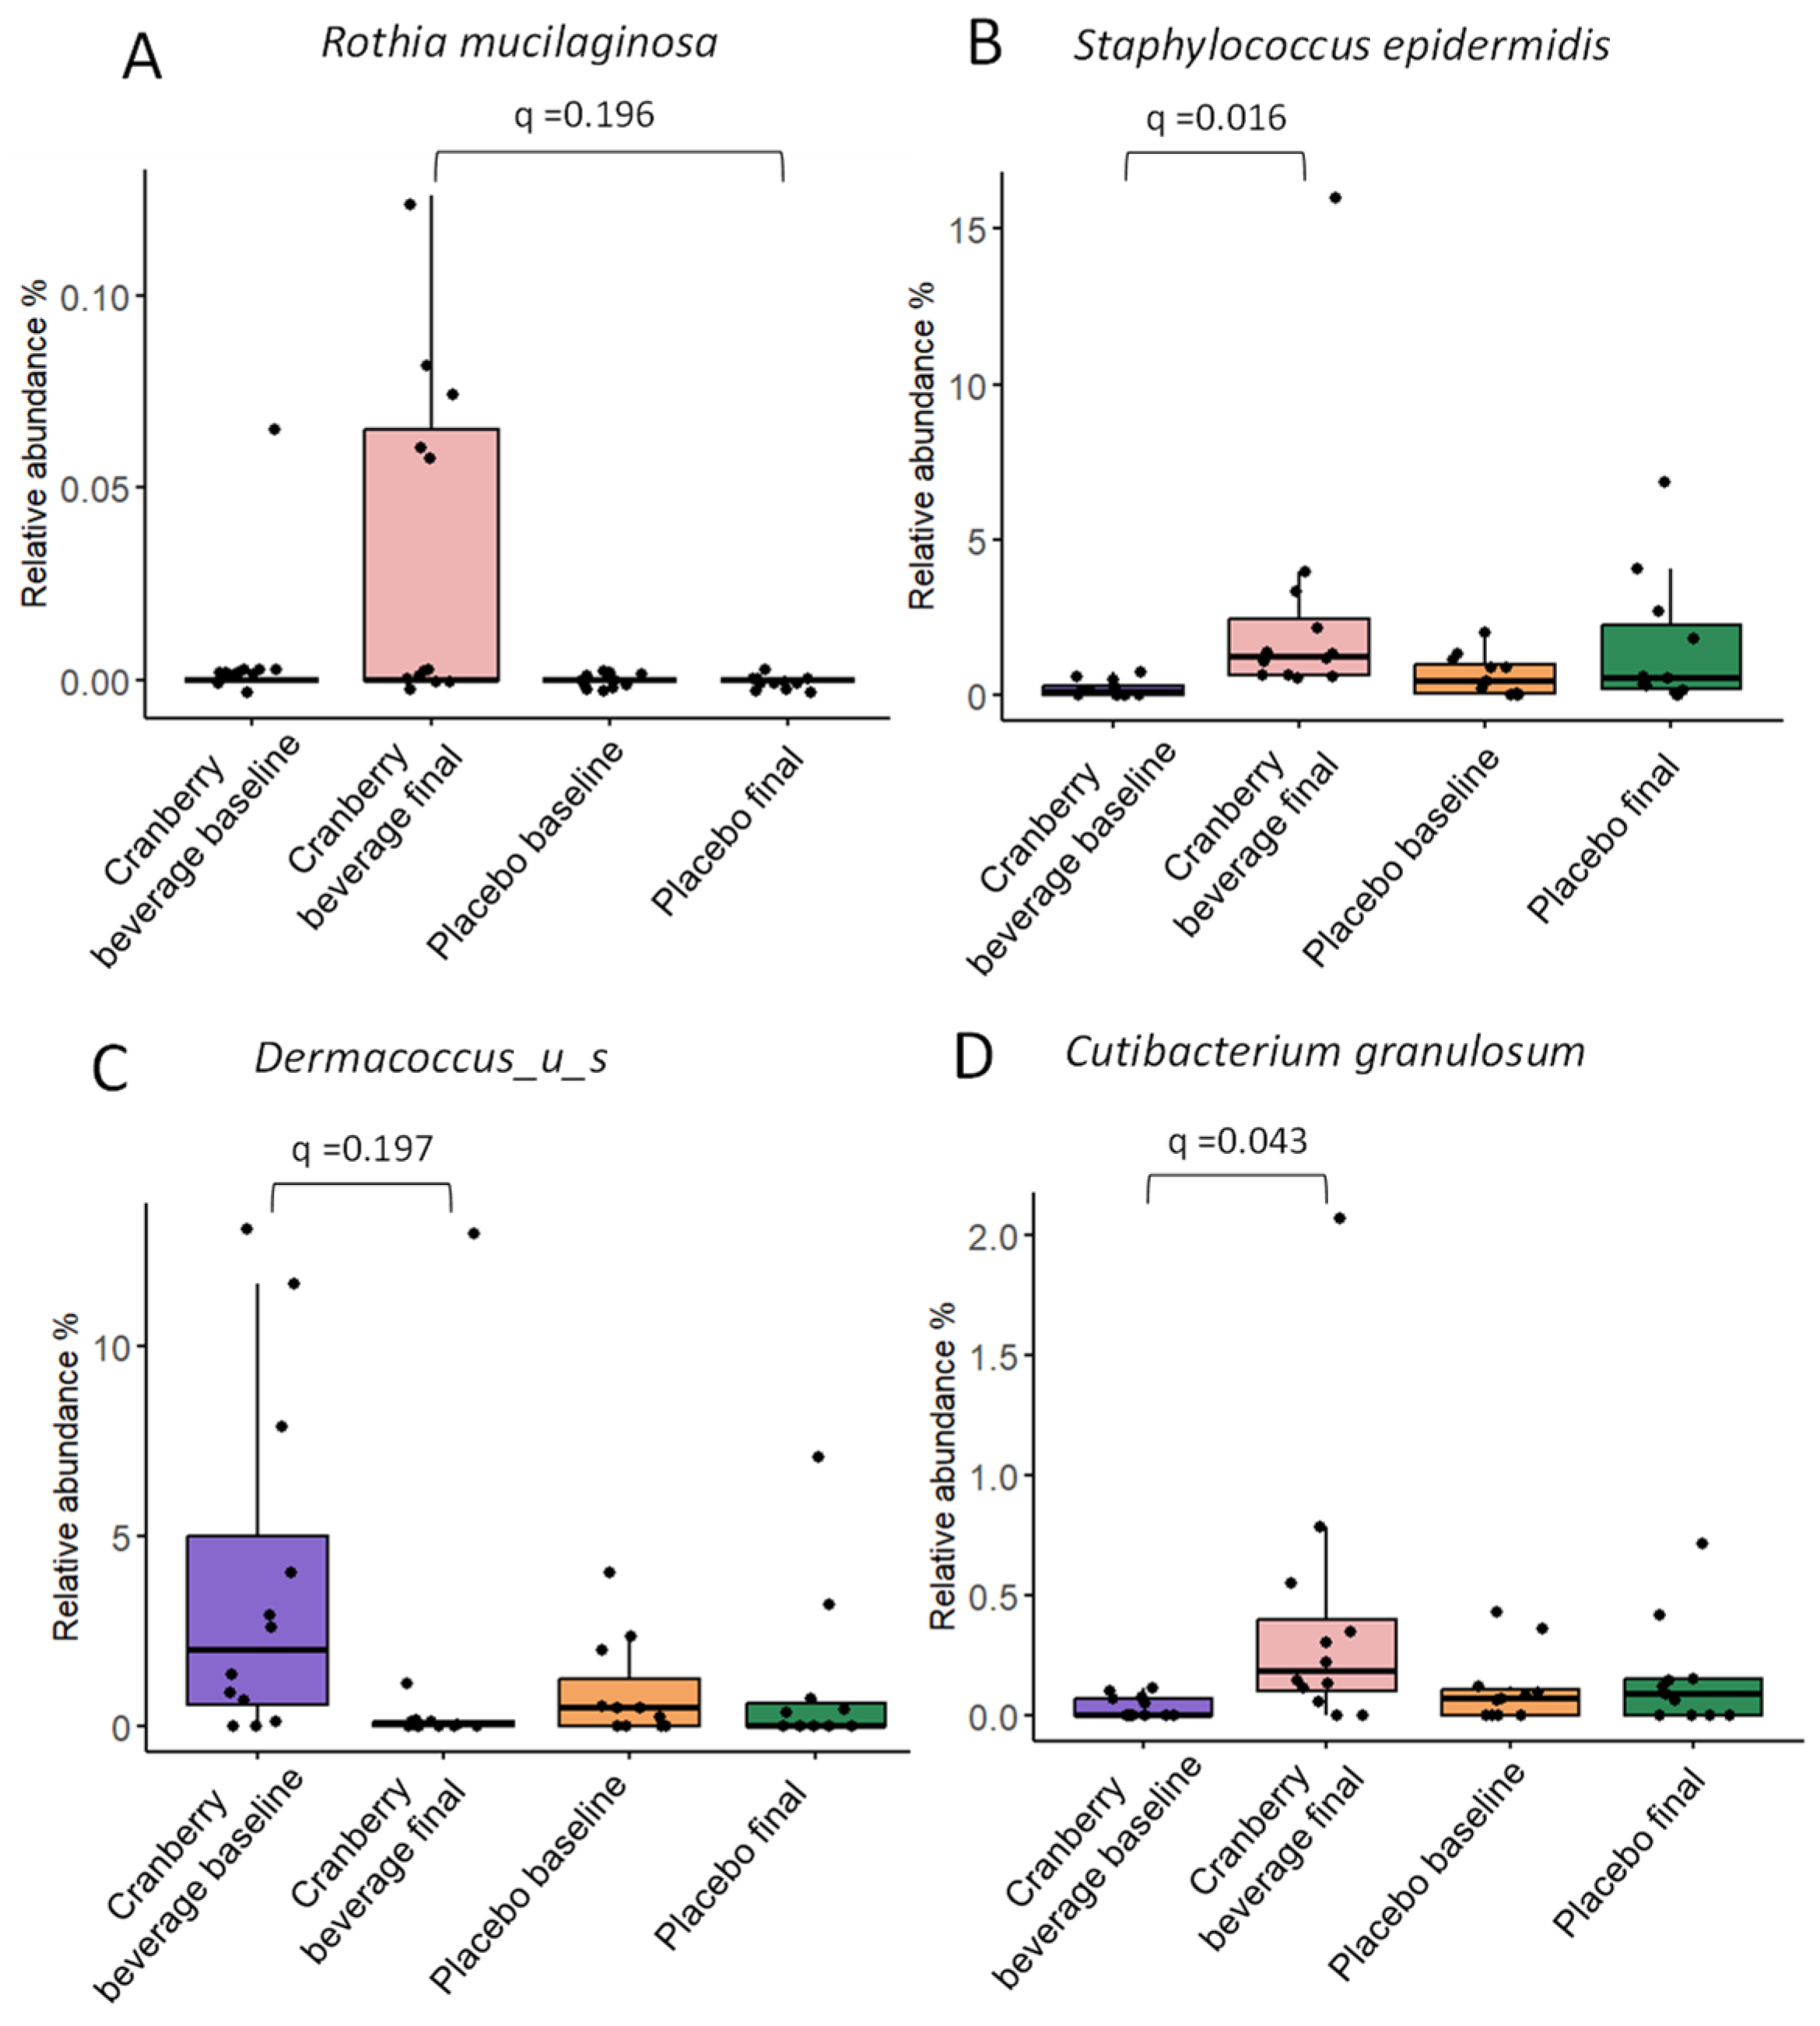
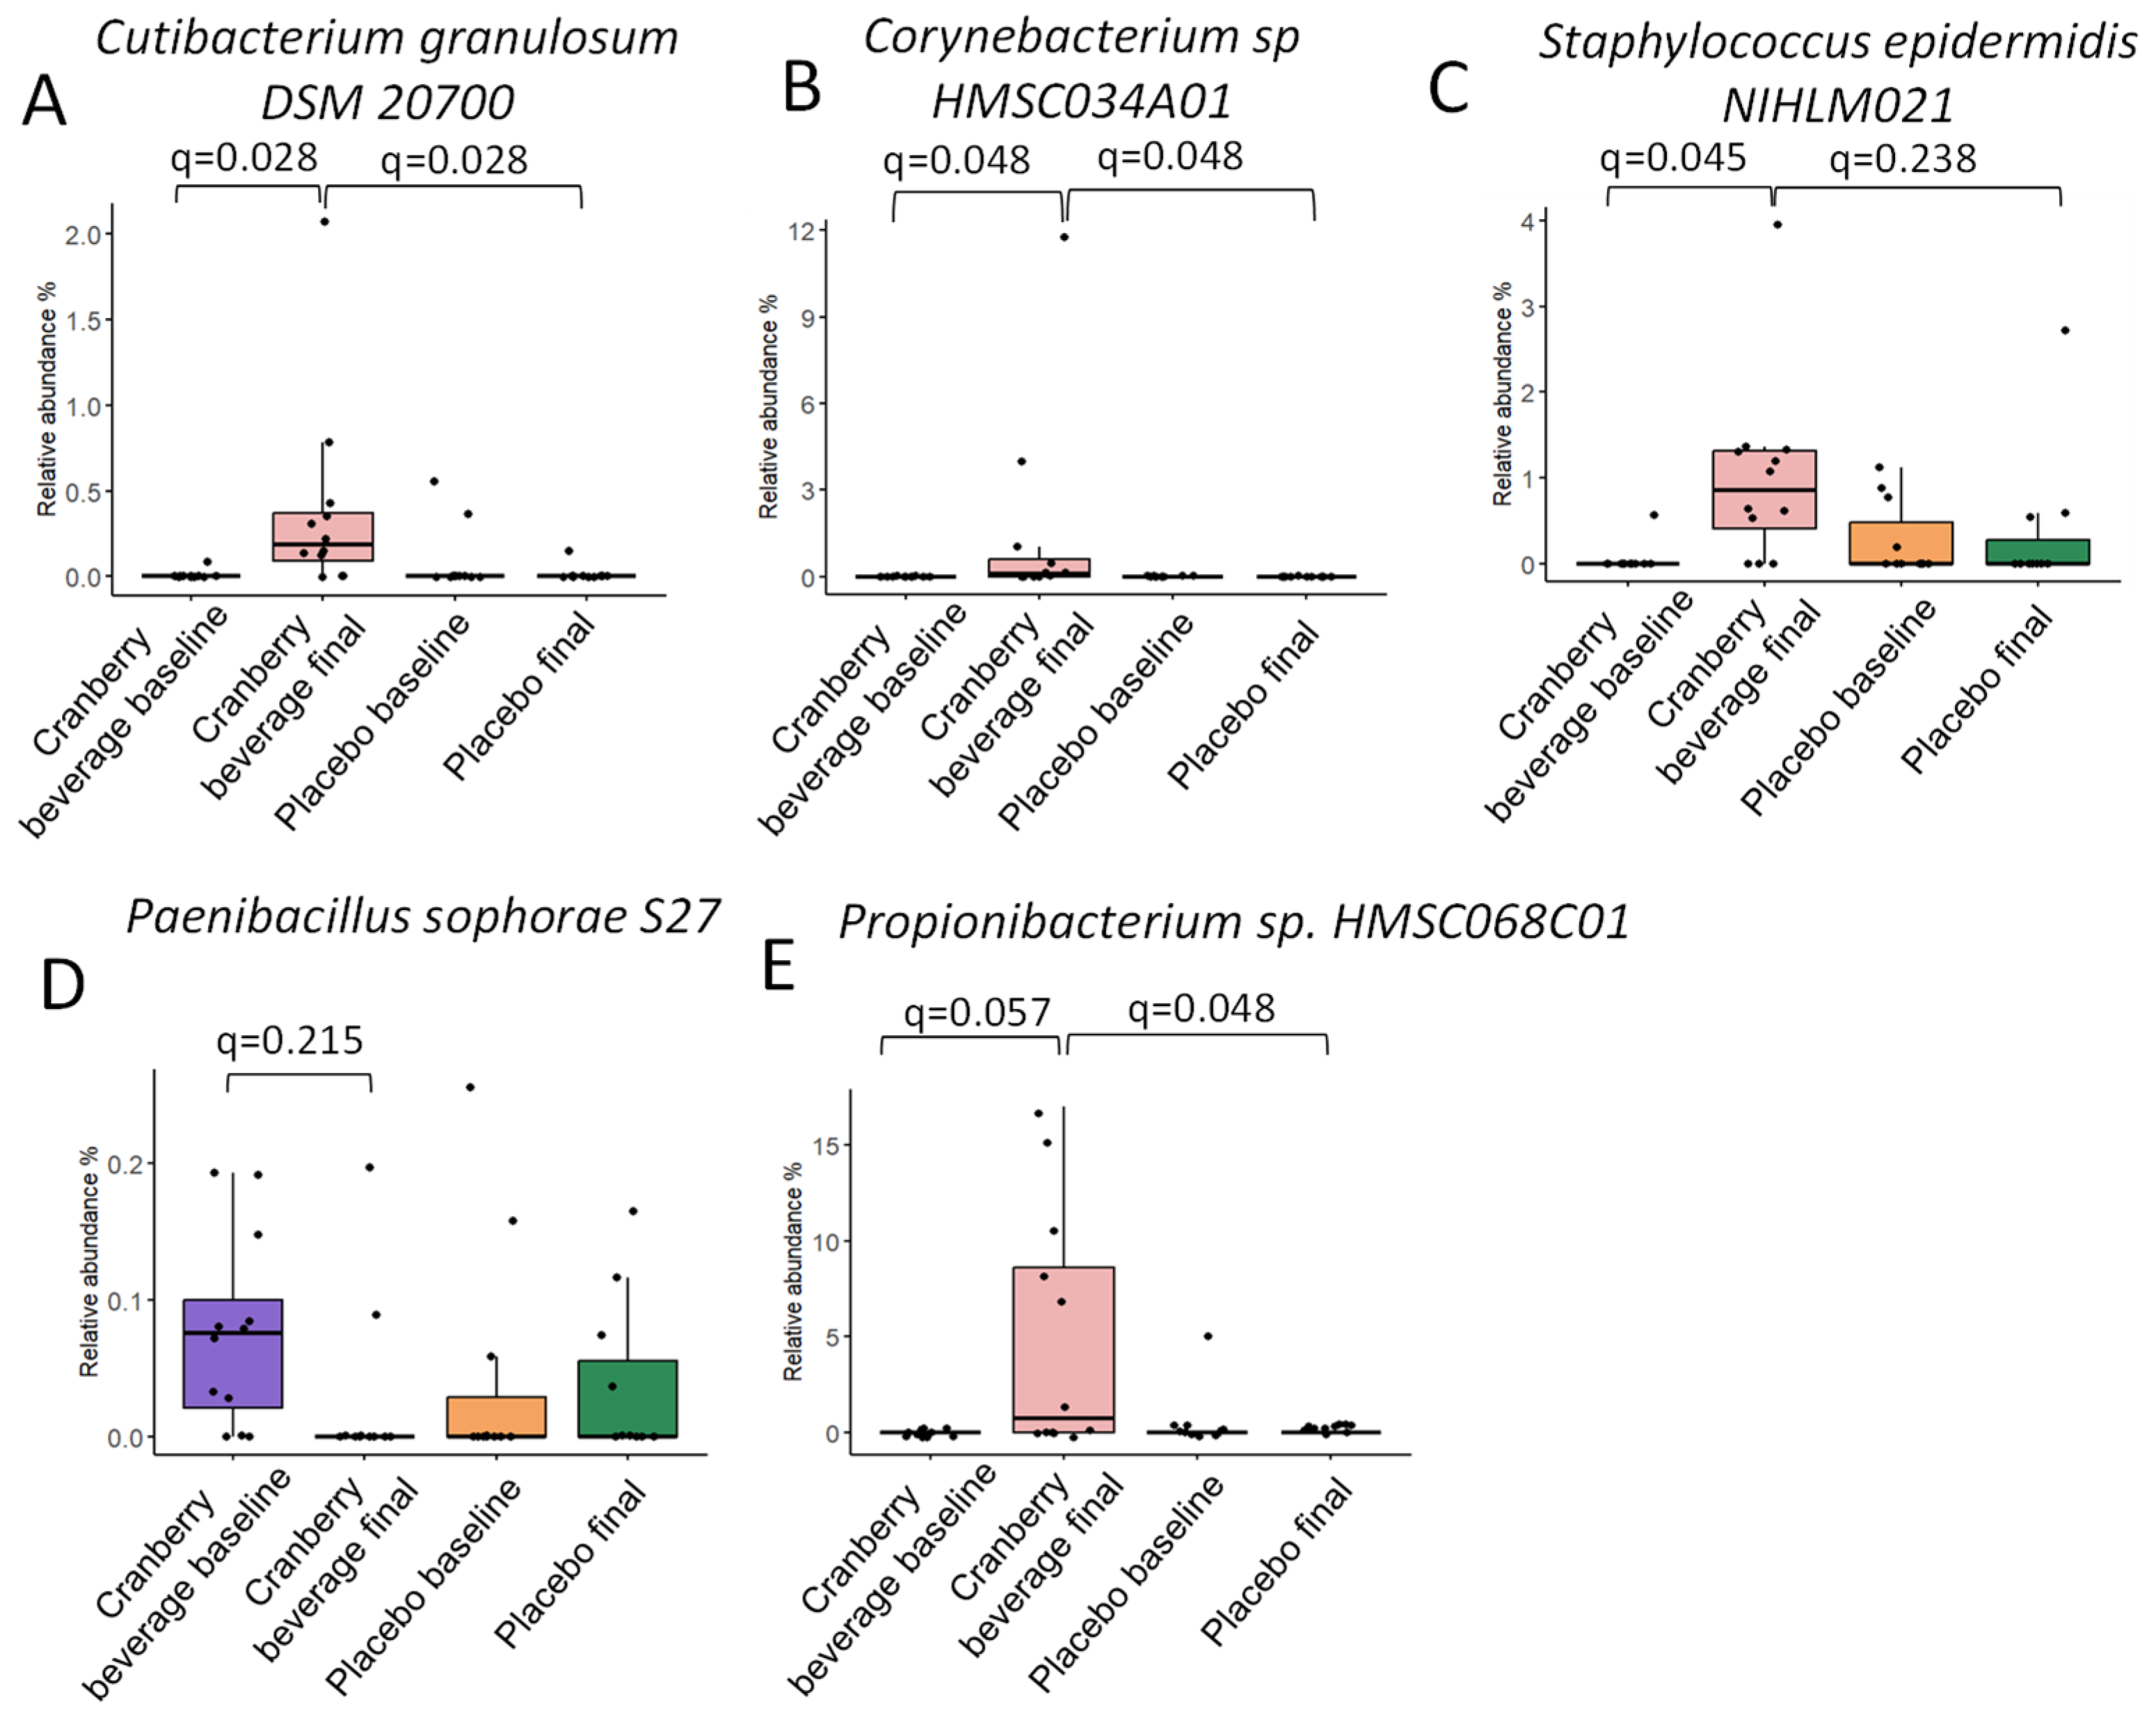
3.10. Cranberry Beverage Modulated Skin Microbiota Composition at Species and Strain Level
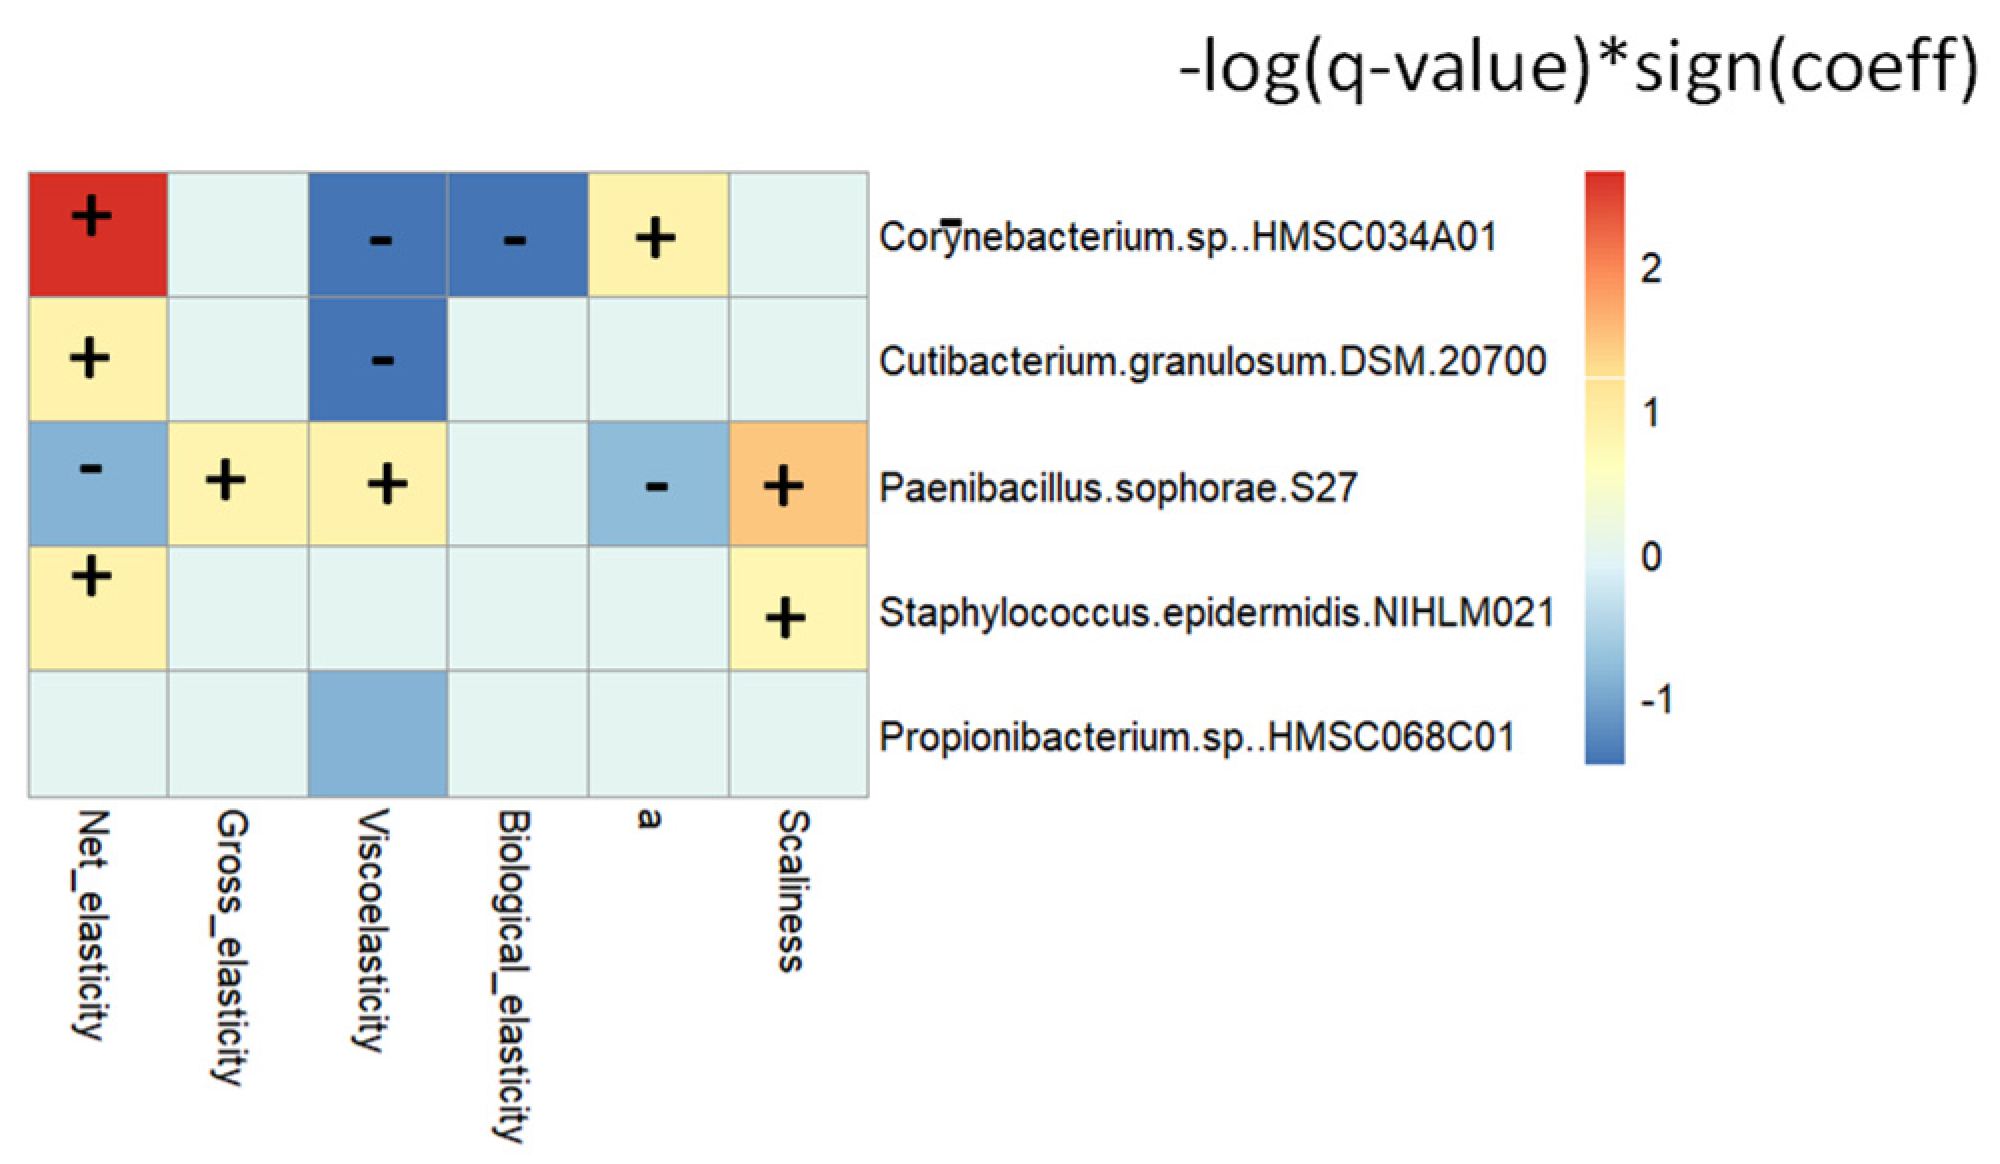
3.11. Skin Microbiota Correlated with Skin Parameters
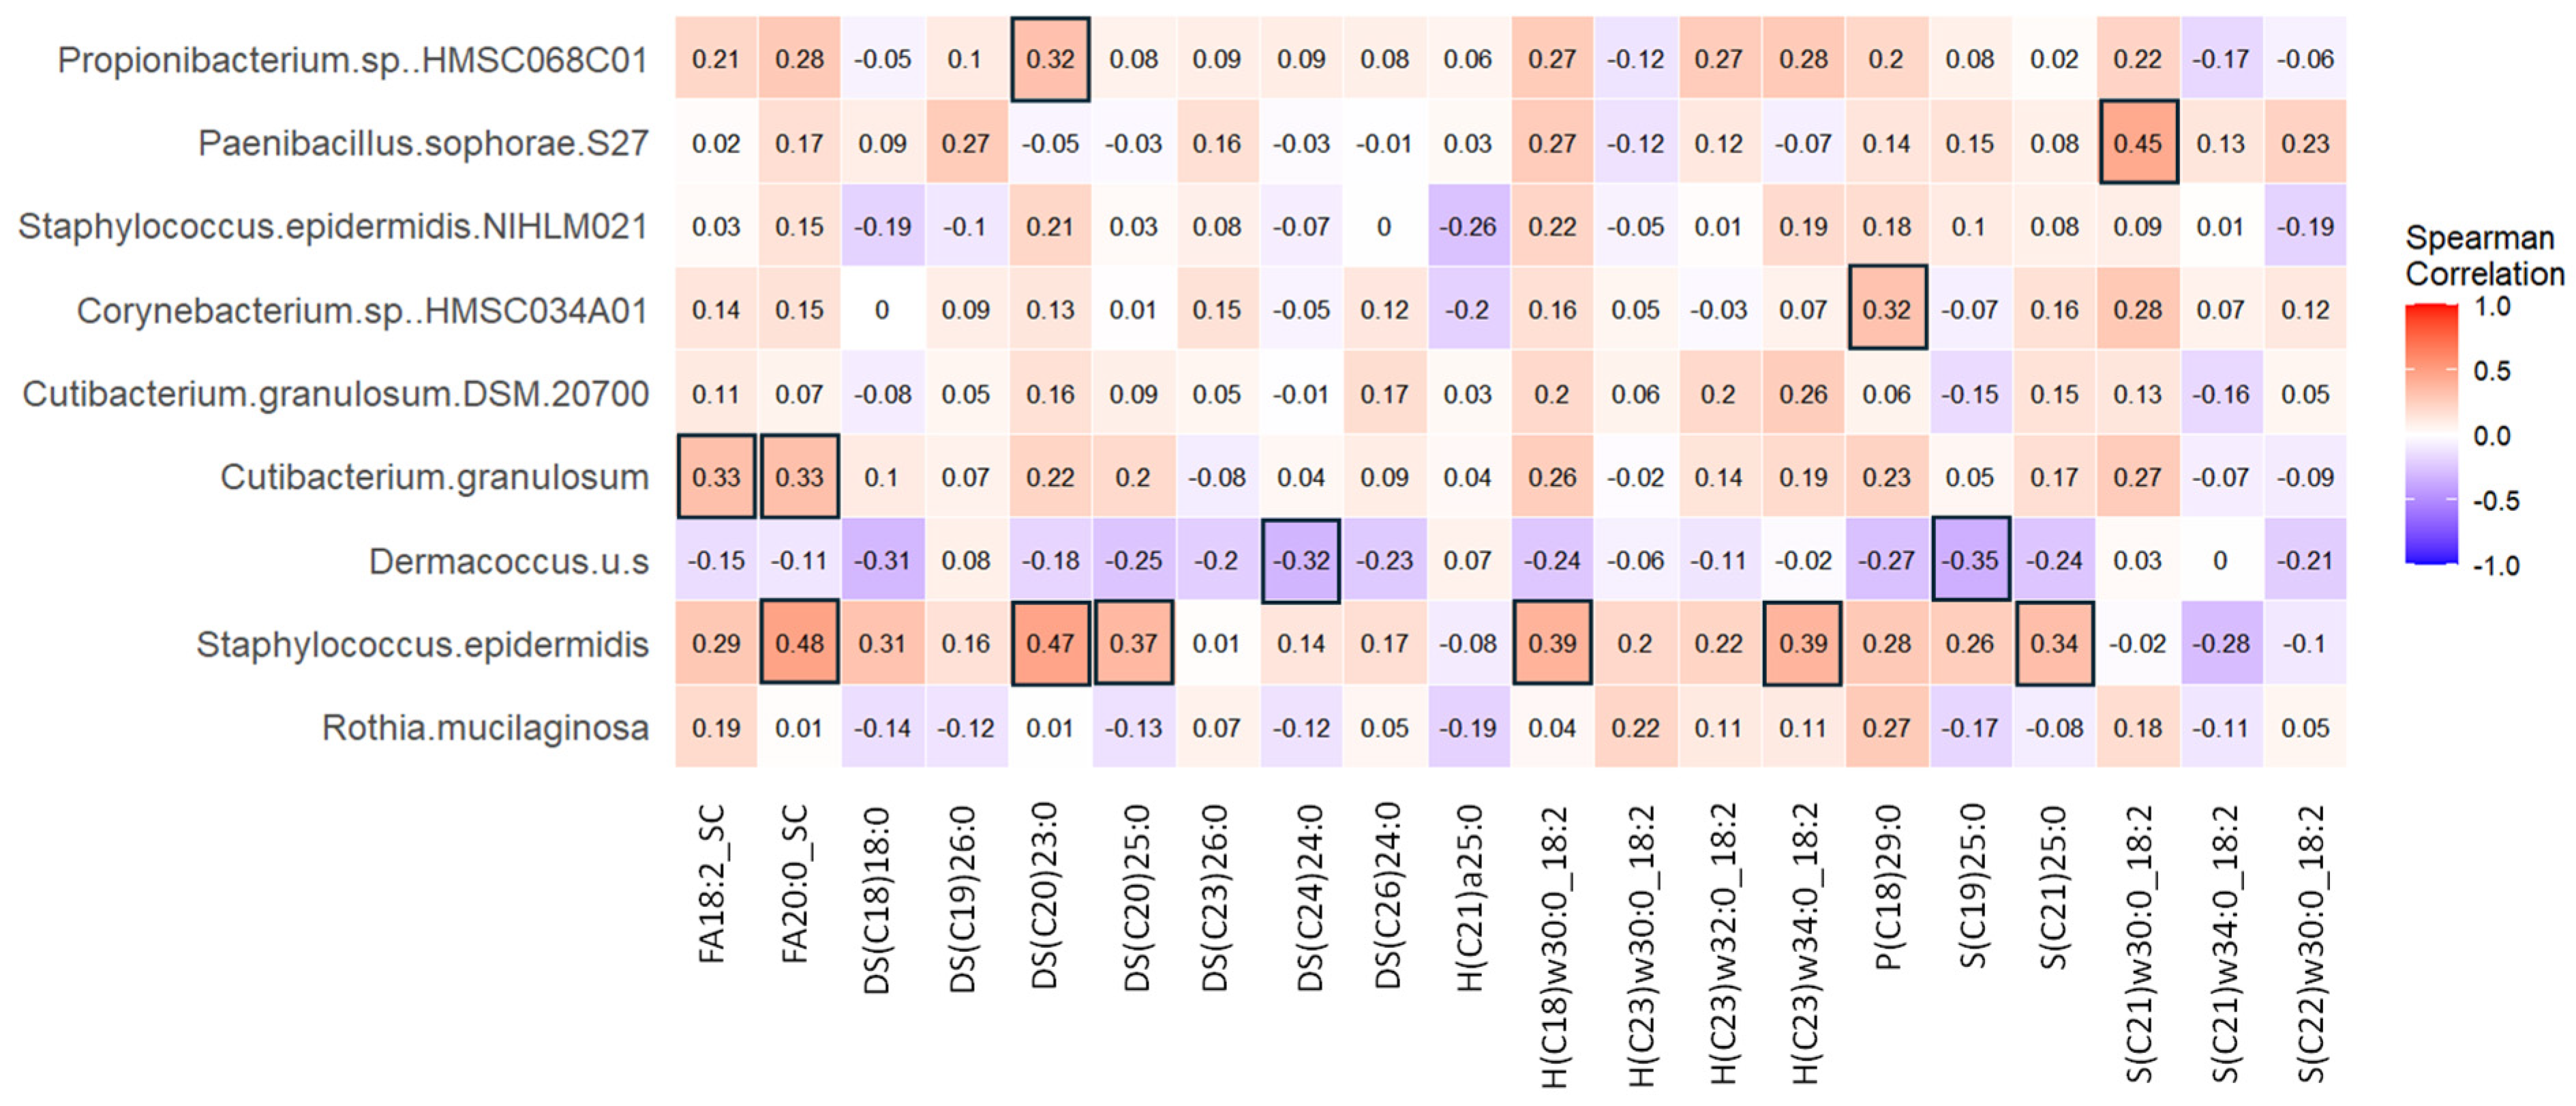
3.12. Skin Microbiota Correlated with Discriminant Skin Lipids
4. Discussion
5. Conclusions
Supplementary Materials
Author Contributions
Funding
Informed Consent Statement
Data Availability Statement
Conflicts of Interest
Abbreviations
| ADS | α-hydroxy-dihydrosphingosine |
| AGE | Advanced glycation products |
| AH | α-hydroxy-6-hydroxy-sphingosine |
| AP | α-hydroxy-phytoceramide |
| AS | α-hydroxy-sphingosine |
| BMI | Body mass index |
| ELISA | Enzyme-linked immunosorbent assay |
| EOH | Ester-linked-omega-hydroxy-6-hydroxy-sphingosine |
| EOS | Ester-linked-omega-hydroxy-sphingosine |
| GPx | Glutathione peroxide |
| Hs-CRP | High-sensitivity C-reactive protein |
| IL | Interleukin |
| MED | Minimal erythema dose |
| NP | Non-hydroxy-phytoceramide |
| NS | Non-hydroxy-sphingosine |
| PCA | Principal component analysis |
| PLS-DA | Partial least squares discriminant analysis |
| ROSs | Reactive oxygen species |
| SC | Stratum corneum |
| SOD | superoxide dismutase |
| TEWL | Transepidermal water loss |
| TNF-α | Tumor necrosis factor-α |
| UVB | Ultraviolet B |
References
- Fisher, G.; Kang, S.; Varani, J.; Bata-Csorgo, Z.; Wan, Y.; Datta, S.; Voorhees, J.J. Mechanisms of photoaging and chronological skin aging. Arch. Dermatol. 2002, 138, 1462–1470. [Google Scholar] [CrossRef] [PubMed]
- Byrd, A.L.; Belkaid, Y.; Segre, J.A. The human skin microbiome. Nat. Rev. Microbiol. 2018, 16, 143–155. [Google Scholar] [CrossRef] [PubMed]
- Carmona-Cruz, S.; Orozco-Covarrubias, L.; Sáez-de-Ocariz, M. The human skin microbiome in selected cutaneous diseases. Front. Cell. Infect. Microbiol. 2022, 12, 834135. [Google Scholar] [CrossRef] [PubMed]
- Zheng, Y.; Hunt, R.L.; Villaruz, A.E.; Fisher, E.L.; Liu, R.; Liu, Q.; Cheung, G.Y.C.; Li, M.; Otto, M. Commensal Staphylococcus epidermidis contributes to skin barrier homeostasis by generating protective ceramides. Cell Host Microbe 2022, 30, 301–313.e9. [Google Scholar] [CrossRef]
- Pappas, A. Epidermal surface lipids. Dermatoendocrinol 2009, 1, 72–76. [Google Scholar] [CrossRef]
- Jia, Y.; Gan, Y.; He, C.; Chen, Z.; Zhou, C. The mechanism of skin lipids influencing skin status. J. Dermatol. Sci. 2018, 89, 112–119. [Google Scholar] [CrossRef]
- Howard, B.; Bascom, C.C.; Hu, P.; Binder, R.L.; Fadayel, G.; Huggins, T.G.; Jarrold, B.B.; Osborne, R.; Rocchetta, H.L.; Swift, D.; et al. Aging-associated changes in the adult human skin microbiome and the host factors that affect skin microbiome composition. J. Investig. Dermatol. 2022, 142, 1934–1946.e21. [Google Scholar] [CrossRef]
- Shibagaki, N.; Suda, W.; Clavaud, C.; Bastien, P.; Takayasu, L.; Iioka, E.; Kurokawa, R.; Yamashita, N.; Hattori, Y.; Shindo, C.; et al. Aging-related changes in the diversity of women’s skin microbiomes associated with oral bacteria. Sci. Rep. 2017, 7, 10567. [Google Scholar] [CrossRef]
- Heinrich, U.; Moore, C.E.; De Spirt, S.; Tronnier, H.; Stahl, W. Green tea polyphenols provide photoprotection, increase microcirculation, and modulate skin properties of women. J. Nutr. 2011, 141, 1202–1208. [Google Scholar] [CrossRef]
- Heinrich, U.; Neukam, K.; Tronnier, H.; Sies, H.; Stahl, W. Long-term ingestion of high flavanol cocoa provides photoprotection against UV-induced erythema and improves skin condition in women. J. Nutr. 2006, 136, 1565–1569. [Google Scholar] [CrossRef]
- Henning, S.M.; Yang, J.; Lee, R.-P.; Huang, J.; Hsu, M.; Thames, G.; Gilbuena, I.; Long, J.; Xu, Y.; Park, E.H.; et al. Pomegranate juice and extract consumption increases the resistance to UVB-induced erythema and changes the skin microbiome in healthy women: A randomized controlled trial. Sci. Rep. 2019, 9, 14528. [Google Scholar] [CrossRef] [PubMed]
- Côté, J.; Caillet, S.; Doyon, G.; Sylvain, J.F.; Lacroix, M. Analyzing cranberry bioactive compounds. Crit. Rev. Food Sci. Nutr. 2010, 50, 872–888. [Google Scholar] [CrossRef] [PubMed]
- Gu, L.; Kelm, M.A.; Hammerstone, J.F.; Beecher, G.; Holden, J.; Haytowitz, D.; Prior, R.L. Screening of foods containing proanthocyanidins and their structural characterization using LC-MS/MS and thiolytic degradation. J. Agric. Food Chem. 2003, 51, 7513–7521. [Google Scholar] [CrossRef] [PubMed]
- Ruel, G.; Pomerleau, S.; Couture, P.; Lemieux, S.; Lamarche, B.; Couillard, C. Low-calorie cranberry juice supplementation reduces plasma oxidized LDL and cell adhesion molecule concentrations in men. Br. J. Nutr. 2008, 99, 352–359. [Google Scholar] [CrossRef] [PubMed]
- Mathison, B.D.; Kimble, L.L.; Kaspar, K.L.; Khoo, C.; Chew, B.P. Consumption of cranberry beverage improved endogenous antioxidant status and protected against bacteria adhesion in healthy humans: A randomized controlled trial. Nutr. Res. 2014, 34, 420–427. [Google Scholar] [CrossRef]
- Auguste, S.; Yan, B.; Magina, R.; Xue, L.; Neto, C.; Guo, M. Cranberry extracts and cranberry polyphenols induce mitophagy in human fibroblast cells. Food Biosci. 2024, 57, 103549. [Google Scholar] [CrossRef]
- Chang, H.; Johnson, E.; Khoo, C.; Wang, W.; Gu, L. Cranberry Juice Polyphenols Inhibited the Formation of Advanced Glycation End Products in Collagens, Inhibited Advanced Glycation End Product-Induced Collagen Crosslinking, and Cleaved the Formed Crosslinks. J. Agric. Food Chem. 2022, 70, 15560–15569. [Google Scholar] [CrossRef]
- Heckman, C.J.; Chandler, R.; Kloss, J.D.; Benson, A.; Rooney, D.; Munshi, T.; Darlow, S.D.; Perlis, C.; Manne, S.L.; Oslin, D.W. Minimal Erythema Dose (MED) testing. J. Vis. Exp. 2013, 75, e50175. [Google Scholar] [CrossRef]
- Broglio, K. Randomization in Clinical Trials. JAMA 2018, 319, 2223–2224. [Google Scholar] [CrossRef]
- Schröder, H.; Benitez Arciniega, A.; Soler, C.; Covas, M.-I.; Baena-Díez, J.M.; Marrugat, J.; REGICOR investigators; HERMES investigators. Validity of two short screeners for diet quality in time-limited settings. Public Health Nutr. 2012, 15, 618–626. [Google Scholar] [CrossRef]
- Ogai, K.; Nagase, S.; Mukai, K.; Iuchi, T.; Mori, Y.; Matsue, M.; Sugitani, K.; Sugama, J.; Okamoto, S. A comparison of techniques for collecting skin microbiome samples: Swabbing versus tape-stripping. Front. Microbiol. 2018, 9, 2362. [Google Scholar] [CrossRef] [PubMed]
- Lax, S.; Smith, D.P.; Hampton-Marcell, J.; Owens, S.M.; Handley, K.M.; Scott, N.M.; Gibbons, S.M.; Larsen, P.; Shogan, B.D.; Weiss, S.; et al. Longitudinal analysis of microbial interaction between humans and the indoor environment. Science 2014, 345, 1048–1052. [Google Scholar] [CrossRef] [PubMed]
- Ottesen, A.; Ramachandran, P.; Reed, E.; White, J.R.; Hasan, N.; Subramanian, P.; Ryan, G.; Jarvis, K.; Grim, C.; Daquiqan, N.; et al. Enrichment dynamics of Listeria monocytogenes and the associated microbiome from naturally contaminated ice cream linked to a listeriosis outbreak. BMC Microbiol. 2016, 16, 275. [Google Scholar] [CrossRef] [PubMed]
- Hillmann, B.; Al-Ghalith, G.A.; Shields-Cutler, R.R.; Zhu, Q.; Gohl, D.M.; Beckman, K.B.; Knight, R.; Knights, D. Evaluating the information content of shallow shotgun metagenomics. mSystems 2018, 3, e00069-18. [Google Scholar] [CrossRef] [PubMed]
- Mallick, H.; Rahnavard, A.; McIver, L.J.; Ma, S.; Zhang, Y.; Nguyen, L.H.; Tickle, T.L.; Weingart, G.; Ren, B.; Schwager, E.H.; et al. Multivariable association discovery in population-scale meta-omics studies. PLoS Comput. Biol. 2021, 17, e1009442. [Google Scholar] [CrossRef] [PubMed]
- Shoji, T.; Masumoto, S.; Moriichi, N.; Ohtake, Y.; Kanda, T. Administration of apple polyphenol supplements for skin conditions in healthy women: A randomized, double-blind, placebo-controlled clinical trial. Nutrients 2020, 12, 1071. [Google Scholar] [CrossRef]
- Carrascosa, J.-M.; Floriach, N.; Sala, E.; Aguilera, J. Increase in minimal erythemal dose following oral administration of an antioxidant complex based on a mix of carotenoids: Double-blind, placebo-controlled trial. Photodermatol. Photoimmunol. Photomed. 2017, 33, 284–286. [Google Scholar] [CrossRef]
- Palombo, P.; Fabrizi, G.; Ruocco, V.; Ruocco, E.; Fluhr, J.; Roberts, R.; Morganti, P. Beneficial long-term effects of combined oral/topical antioxidant treatment with the carotenoids lutein and zeaxanthin on human skin: A double-blind, placebo-controlled study. Skin Pharmacol. Physiol. 2007, 20, 199–210. [Google Scholar] [CrossRef]
- Campbell, K.J.; Chapman, N.R.; Perkins, N.D. UV stimulation induces nuclear factor kappaB (NF-kappaB) DNA-binding activity but not transcriptional activation. Biochem. Soc. Trans. 2001, 29, 688–691. [Google Scholar] [CrossRef]
- Liu, S.; You, L.; Zhao, Y.; Chang, X. Hawthorn polyphenol extract inhibits UVB-induced skin photoaging by regulating MMP expression and type I procollagen production in mice. J. Agric. Food Chem. 2018, 66, 8537–8546. [Google Scholar] [CrossRef]
- Heinz, A. Elastic fibers during aging and disease. Ageing Res. Rev. 2021, 66, 101255. [Google Scholar] [CrossRef] [PubMed]
- Henning, S.M.; Guzman, J.B.; Thames, G.; Yang, J.; Tseng, C.-H.; Heber, D.; Kim, J.; Li, Z. Avocado Consumption Increased Skin Elasticity and Firmness in Women—A Pilot Study. J. Cosmet. Dermatol. 2022, 21, 4028–4034. [Google Scholar] [CrossRef] [PubMed]
- Dolečková, I.; Čápová, A.; Machková, L.; Moravčíková, S.; Marešová, M.; Velebný, V. Seasonal variations in the skin parameters of Caucasian women from Central Europe. Skin Res. Technol. 2021, 27, 358–369. [Google Scholar] [CrossRef] [PubMed]
- Nisticò, S.P.; Greco, M.E.; Amato, S.; Bennardo, L.; Zappia, E.; Pignataro, E.; Pellacani, G. Evaluating the impact of oleocanthal and oleacein on skin aging: Results of a randomized clinical study. Medicina 2024, 60, 947. [Google Scholar] [CrossRef]
- Lee, M.J.; Agrahari, G.; Kim, H.-Y.; An, E.-J.; Chun, K.-H.; Kang, H.; Kim, Y.-S.; Bang, C.W.; Tak, L.-J.; Kim, T.-Y. Extracellular Superoxide Dismutase Prevents Skin Aging by Promoting Collagen Production through the Activation of AMPK and Nrf2/HO-1 Cascades. J. Investig. Dermatol. 2021, 141, 2344–2353.e7. [Google Scholar] [CrossRef]
- Lee, H.; Hong, Y.; Kim, M. Structural and functional changes and possible molecular mechanisms in aged skin. Int. J. Mol. Sci. 2021, 22, 12489. [Google Scholar] [CrossRef]
- Duthie, S.J.; Jenkinson, A.M.; Crozier, A.; Mullen, W.; Pirie, L.; Kyle, J.; Yap, L.S.; Christen, P.; Duthie, G.G. The effects of cranberry juice consumption on antioxidant status and biomarkers relating to heart disease and cancer in healthy human volunteers. Eur. J. Nutr. 2006, 45, 113–122. [Google Scholar] [CrossRef]
- Rogers, J.; Harding, C.; Mayo, A.; Banks, J.; Rawlings, A. Stratum corneum lipids: The effect of ageing and the seasons. Arch. Dermatol. Res. 1996, 288, 765–770. [Google Scholar] [CrossRef]
- Choi, E.-H.; Brown, B.E.; Crumrine, D.; Chang, S.; Man, M.-Q.; Elias, P.M.; Feingold, K.R. Mechanisms by which psychologic stress alters cutaneous permeability barrier homeostasis and stratum corneum integrity. J. Investig. Dermatol. 2005, 124, 587–595. [Google Scholar] [CrossRef]
- Sawada, E.; Yoshida, N.; Sugiura, A.; Imokawa, G. Th1 cytokines accentuate but Th2 cytokines attenuate ceramide production in the stratum corneum of human epidermal equivalents: An implication for the disrupted barrier mechanism in atopic dermatitis. J. Dermatol. Sci. 2012, 68, 25–35. [Google Scholar] [CrossRef]
- Straub, T.J.; Chou, W.-C.; Manson, A.L.; Schreiber, H.L.; Walker, B.J.; Desjardins, C.A.; Chapman, S.B.; Kaspar, K.L.; Kahsai, O.J.; Traylor, E.; et al. Limited effects of long-term daily cranberry consumption on the gut microbiome in a placebo-controlled study of women with recurrent urinary tract infections. BMC Microbiol. 2021, 21, 53. [Google Scholar] [CrossRef] [PubMed]
- Solch-Ottaiano, R.J.; Judkins, T.C.; Matott, S.H.; McDermott, C.E.; Nieves, C.; Wang, Y.; Colee, J.; Tagliamonte, M.S.; Dissanayake, U.; Mai, V.; et al. High polyphenolic cranberry beverage alters specific fecal microbiota but not gut permeability following aspirin challenge in healthy obese adults: A randomized, double-blind, crossover trial. J. Funct. Foods 2022, 99, 105332. [Google Scholar] [CrossRef]
- Barnard, E.; Shi, B.; Kang, D.; Craft, N.; Li, H. The balance of metagenomic elements shapes the skin microbiome in acne and health. Sci. Rep. 2016, 6, 39491. [Google Scholar] [CrossRef] [PubMed]
- Wanke, I.; Steffen, H.; Christ, C.; Krismer, B.; Götz, F.; Peschel, A.; Schaller, M.; Schittek, B. Skin commensals amplify the innate immune response to pathogens by activation of distinct signaling pathways. J. Investig. Dermatol. 2011, 131, 382–390. [Google Scholar] [CrossRef] [PubMed]
- Dobler, D.; Schmidts, T.; Wildenhain, S.; Seewald, I.; Merzhäuser, M.; Runkel, F. Impact of Selected Cosmetic Ingredients on Common Microorganisms of Healthy Human Skin. Cosmetics 2019, 6, 45. [Google Scholar] [CrossRef]
- van Rensburg, J.J.; Lin, H.; Gao, X.; Toh, E.; Fortney, K.R.; Ellinger, S.; Zwickl, B.; Janowicz, D.M.; Katz, B.P.; Nelson, D.E.; et al. The Human Skin Microbiome Associates with the Outcome of and Is Influenced by Bacterial Infection. MBio 2015, 6, e01315-15. [Google Scholar] [CrossRef]
- Williams, M.R.; Cau, L.; Wang, Y.; Kaul, D.; Sanford, J.A.; Zaramela, L.S.; Khalil, S.; Butcher, A.M.; Zengler, K.; Horswill, A.R.; et al. Interplay of staphylococcal and host proteases promotes skin barrier disruption in netherton syndrome. Cell Rep. 2020, 30, 2923–2933.e7. [Google Scholar] [CrossRef]
- Cau, L.; Williams, M.R.; Butcher, A.M.; Nakatsuji, T.; Kavanaugh, J.S.; Cheng, J.Y.; Shafiq, F.; Higbee, K.; Hata, T.R.; Horswill, A.R.; et al. Staphylococcus epidermidis protease EcpA can be a deleterious component of the skin microbiome in atopic dermatitis. J. Allergy Clin. Immunol. 2021, 147, 955–966.e16. [Google Scholar] [CrossRef]
- Watanabe, H.; Nakamura, I.; Mizutani, S.; Kurokawa, Y.; Mori, H.; Kurokawa, K.; Yamada, T. Minor taxa in human skin microbiome contribute to the personal identification. PLoS ONE 2018, 13, e0199947. [Google Scholar] [CrossRef]
- Sun, J.; Liang, F.; Bin, Y.; Li, P.; Duan, C. Screening non-colored phenolics in red wines using liquid chromatography/ultraviolet and mass spectrometry/mass spectrometry libraries. Molecules 2007, 12, 679–693. [Google Scholar] [CrossRef]
- Brown, P.N.; Shipley, P.R. Determination of anthocyanins in cranberry fruit and cranberry fruit products by high-performance liquid chromatography with ultraviolet detection: Single-laboratory validation. J. AOAC Int. 2011, 94, 459–466. [Google Scholar] [CrossRef]
- Cunningham, D.G.; Vannozzi, S.; O’Shea, E.; Turk, R. Analysis and standardization of cranberry products. In Quality Management of Nutraceuticals; Ho, C.-T., Zheng, Q.Y., Eds.; ACS Symposium Series; American Chemical Society: Washington, DC, USA, 2001; Volume 803, pp. 151–166. ISBN 9780841218840. [Google Scholar]
- Prior, R.L.; Gu, L. Occurrence and biological significance of proanthocyanidins in the American diet. Phytochemistry 2005, 66, 2264–2280. [Google Scholar] [CrossRef]


| Time Period | Placebo | Placebo Change from Baseline | Cranberry Beverage | Cranberry Change from Baseline | |
|---|---|---|---|---|---|
| ∆a* | Baseline | 8.8 ± 2.9 | 0.003 ± 3.2 | 9.3 ± 3.1 | −2.1 ± 2.8 & |
| 6 weeks | 8.8 ± 3.1 | 7.2 ± 3.5 #,^ |
| Skin Parameters | Time Period | Placebo | Change from Baseline | Cranberry Beverage | Change from Baseline |
|---|---|---|---|---|---|
| TEWL (g/h/m2) a | Baseline | 18.9 ± 5.4 | −1.6 ± 4.6 | 19.2 ± 4.7 | −2.8± 3.5 |
| 6 weeks | 17.3 ± 5.3 | 16.4 ± 4.5 # | |||
| Hydration a | Baseline | 38.1 ± 17.8 | −0.6 ± 14.7 | 36.7 ± 11.8 | 0.8 ± 14.9 |
| 6 weeks | 37.5 ± 14.8 | 37.4 ± 17.0 | |||
| pH b | Baseline | 6.0 ± 0.2 | 0.01 ± 0.43 | 6.0 ± 0.2 | 0.1 ± 0.3 |
| 6 weeks | 6.0 ± 0.3 | 6.1 ± 0.3 | |||
| Melanin Index | Baseline | 151.1 ± 41.9 | −7.9 ± 29.7 | 156.9 ± 46.0 | −7.3 ± 30.9 |
| 6 weeks | 143.2 ± 37.9 | 149.6 ± 46.3 | |||
| Erythema Index b | Baseline | 398.7 ± 112.8 | −3.2 ± 67.3 | 415.3 ± 108.2 | −25.3 ± 62.3 |
| 6 weeks | 395.5 ± 99.0 | 390.0 ± 120.0 | |||
| L* | Baseline | 59.8 ± 4.5 | −0.8 ± 3.1 | 59.2 ± 3.4 | -0.6 ± 2.6 |
| 6 weeks | 59.0 ± 3.7 | 58.7 ± 4.3 | |||
| a* | Baseline | 15.1 ± 3.1 | 0.3 ± 1.5 | 14.9 ± 1.8 | 0.6 ± 2.2 |
| 6 weeks | 15.4 ± 2.9 | 15.6 ± 2.9 | |||
| b* a | Baseline | 13.9 ± 2.5 | −0.2 ± 2.1 | 13.6 ± 2.7 | −0.1 ± 2.1 |
| 6 weeks | 13.6 ± 2.6 | 13.4 ± 2.7 | |||
| Gross Elasticity (%) | Baseline | 70.2 ± 9.7 | −0.1 ± 11.6 | 68.7 ± 10.5 | 4.1 ± 9.9 |
| 6 weeks | 70.0 ± 12.1 | 72.8 ± 9.6 | |||
| Net Elasticity a (%) | Baseline | 50.5 ± 11.6 | −0.2 ± 13.3 | 47.7 ± 10.8 | 8.1 ± 12.3 & |
| 6 weeks | 50.3 ± 13.0 | 55.7 ± 11.6 #,^ | |||
| Viscoelasticity | Baseline | 29.3 ± 7.5 | −2.7 ± 8.5 | 29.5 ± 5.3 | −2.7 ± 6.7 |
| 6 weeks | 26.6 ± 6.5 | 26.8 ± 4.1 | |||
| Biological Elasticity (%) | Baseline | 38.1 ± 8.5 | 2.4 ± 8.9 | 36.7 ± 8.7 | 5.8 ± 10.7 |
| 6 weeks | 40.5 ± 10.3 | 42.5 ± 11.1 # | |||
| Wrinkle a | Baseline | 115.2 ± 25.0 | −4.6 ± 20.4 | 116.3 ± 27.9 | −7.6 ± 12.9 |
| 6 weeks | 110.7 ± 20.8 | 108.7 ± 26.8 | |||
| Smoothness | Baseline | 292.5 ± 89.6 | −27.0 ± 60.6 | 267.8 ± 50.1 ^ | 5.5 ± 33.8 & |
| 6 weeks | 265.4 ± 49.0 # | 273.3 ± 59.8 | |||
| Roughness a | Baseline | 2.86 ± 0.64 | 0.44 ± 1.02 | 3.00 ± 0.94 | 0.03 ± 0.83 |
| 6 weeks | 3.30 ± 1.07 | 3.03 ± 0.97 | |||
| Scaliness | Baseline | 0.22 ± 0.44 | −0.09 ± 0.39 | 0.18 ± 0.32 | −0.04 ± 0.22 |
| 6 weeks | 0.14 ± 0.19 | 0.13 ± 0.19 |
| Skin Parameters | Time Period | Placebo | Change from Baseline | Cranberry Beverage | Change from Baseline |
|---|---|---|---|---|---|
| TEWL (g/h/m2) a | Baseline | 7.6 ± 3.5 | 0.4 ± 4.1 | 7.8 ± 2.8 | −1.3 ± 2.3 |
| 6 weeks | 8.1 ± 5.7 | 6.5 ± 1.6 | |||
| Hydration | Baseline | 39.1 ± 10.4 | 2.8 ± 10.8 | 38.7 ± 7.5 | 1.7 ± 7.2 |
| 6 weeks | 41.9 ± 9.7 | 40.4 ± 8.1 | |||
| pH | Baseline | 5.55 ± 0.54 | 0.004 ± 0.6 | 5.57 ± 0.45 | 0.1 ± 0.5 |
| 6 weeks | 5.55 ± 0.38 | 5.69 ± 0.51 | |||
| Melanin Index a | Baseline | 124.8 ± 39.3 | −1.9 ± 15.0 | 131.9 ± 42.5 | −4.6 ± 32.9 |
| 6 weeks | 122.9 ± 48.8 | 127.3 ± 44.4 | |||
| Erythema Index | Baseline | 199.0 ± 48.7 | −3.0 ± 43.6 | 203.5 ± 56.0 | 4.9 ± 33.1 |
| 6 weeks | 196.0 ± 69.5 | 208.4 ± 65.5 | |||
| L* a | Baseline | 65.2 ± 4.1 | 0.1 ± 1.7 | 65.2 ± 4.0 | −0.5 ± 1.8 |
| 6 weeks | 65.3 ± 4.5 | 64.7 ± 4.6 | |||
| a* | Baseline | 7.99 ± 1.33 | 0.1 ± 0.8 | 8.18 ± 1.37 | 0.3 ± 0.7 |
| 6 weeks | 8.13 ± 1.32 | 8.44 ± 1.33 | |||
| b* | Baseline | 13.9 ± 2.4 | 0.3 ± 1.2 | 13.7 ± 3.4 | 0.3 ± 1.1 |
| 6 weeks | 14.2 ± 3.1 | 14.0 ± 3.5 | |||
| Gross Elasticity a,b (%) | Baseline | 81.4 ± 9.3 | −0.6 ± 6.8 | 78.2 ± 9.9 ^ | 5.4 ± 6.1 & |
| 6 weeks | 80.8 ± 11.6 | 83.5 ± 7.2 #,^ | |||
| Net Elasticity (%) | Baseline | 78.2 ± 12.7 | 0.1 ± 7.5 | 76.1 ± 12.2 | 7.0 ± 9.1 & |
| 6 weeks | 78.3 ± 12.4 | 83.1 ± 9.0 #,^ | |||
| Viscoelasticity a,b | Baseline | 29.9 ± 5.4 | 0.2 ± 6.6 | 34.4 ± 14.6 | −5.9 ± 14.1 |
| 6 weeks | 30.2 ± 7.56 | 28.5 ± 7.2 # | |||
| Biological Elasticity b (%) | Baseline | 60.3 ± 10.2 | 0.4 ± 7.2 | 58.6 ± 12.4 | 4.5 ± 7.5 |
| 6 weeks | 60.7 ± 11.2 | 63.1 ± 9.3 # | |||
| Wrinkle | Baseline | 71.6 ± 16.2 | −2.9 ± 16.6 | 71.0 ± 19.9 | −2.6 ± 9.8 |
| 6 weeks | 68.7 ± 22.3 | 68.4 ± 18.3 | |||
| Smoothness a | Baseline | 218.0 ± 37.7 | −6.2 ± 48.6 | 229.3 ± 43.9 | −16.1 ± 45.5 |
| 6 weeks | 211.8 ± 55.7 | 213.2 ± 48.8 | |||
| Roughness | Baseline | 1.58 ± 0.64 | −0.04 ± 0.44 | 1.82 ± 1.14 | −0.15 ± 1.27 |
| 6 weeks | 1.55 ± 0.70 | 1.66 ± 0.81 | |||
| Scaliness a | Baseline | 0.17 ± 0.20 | 0.02 ± 0.18 | 0.18 ± 0.25 | −0.04 ± 0.11 |
| 6 weeks | 0.18 ± 0.22 | 0.14 ± 0.24 |
| Cranberry Beverage Baseline vs. Final | Placebo Baseline vs. Final | Cranberry Beverage Final vs. Placebo Final | ||||||||
|---|---|---|---|---|---|---|---|---|---|---|
| Class a | Lipids | VIP b | Change c | p-Value d | VIP b | Change c | p-Value d | VIP b | Change c | p-Value d |
| FA | FA18:2_SC | 0.58 | - | 0.13 | 1.65 | ↑ | <0.01 | 0.37 | - | 0.23 |
| FA | FA20:0_SC | 1.57 | ↑ | <0.01 | 2.08 | ↑ | <0.01 | 0.48 | - | 0.59 |
| NDS | DS(C18)18:0 | 0.92 | - | 0.66 | 1.69 | ↑ | <0.01 | 1.76 | - | 0.22 |
| NDS | DS(C19)26:0 | 0.33 | - | 0.40 | 0.18 | - | 0.73 | 1.57 | ↑ | 0.04 |
| NDS | DS(C20)23:0 | 2.01 | ↑ | <0.01 | 1.16 | - | 0.02 | 0.92 | - | 0.26 |
| NDS | DS(C20)25:0 | 1.78 | ↑ | <0.01 | 1.91 | ↑ | <0.01 | 0.96 | - | 0.82 |
| NDS | DS(C23)26:0 | 1.61 | ↑ | <0.01 | 1.27 | - | 0.59 | 0.96 | - | 0.25 |
| NDS | DS(C24)24:0 | 1.72 | ↑ | <0.01 | 1.2 | - | 0.56 | 0.95 | - | 0.40 |
| NDS | DS(C26)24:0 | 1.61 | ↑ | <0.01 | 0.91 | - | 0.36 | 1.11 | - | 0.15 |
| AH | H(C21)a25:0 | 1.51 | ↓ | 0.03 | 0.26 | - | 0.67 | 1.83 | - | 0.14 |
| EOH | H(C18)w30:0_18:2 | 1.52 | ↑ | <0.01 | 0.54 | - | 0.31 | 0.47 | - | 0.56 |
| EOH | H(C23)w30:0_18:2 | 1.86 | ↑ | <0.01 | 0.26 | - | 0.67 | 1.09 | - | 0.17 |
| EOH | H(C23)w32:0_18:2 | 1.79 | ↑ | <0.01 | 1.27 | - | 0.02 | 0.44 | - | 0.62 |
| EOH | H(C23)w34:0_18:2 | 1.67 | ↑ | 0.01 | 0.75 | - | 0.57 | 0.99 | - | 0.38 |
| NP | P(C18)29:0 | 0.45 | - | 0.95 | 1.34 | - | 0.02 | 1.80 | ↓ | 0.04 |
| NS | S(C19)28:0 | 1.11 | - | 0.07 | 1.91 | ↑ | <0.01 | 1.86 | - | 0.07 |
| NS | S(C21)25:0 | 1.52 | ↑ | <0.01 | 0.94 | - | 0.13 | 1.02 | - | 0.22 |
| EOS | S(C21)w32:0_18:2 | 1.01 | - | 0.39 | 1.55 | - | 0.13 | 1.65 | ↑ | 0.03 |
| EOS | S(C21)w34:0_18:2 | 1.52 | - | 0.13 | 2.03 | ↓ | <0.01 | 0.83 | - | 0.32 |
| EOS | S(C22)w30:0_18:2 | 0.31 | - | 0.90 | 2.19 | ↓ | 0.01 | 1.99 | ↑ | 0.01 |
Disclaimer/Publisher’s Note: The statements, opinions and data contained in all publications are solely those of the individual author(s) and contributor(s) and not of MDPI and/or the editor(s). MDPI and/or the editor(s) disclaim responsibility for any injury to people or property resulting from any ideas, methods, instructions or products referred to in the content. |
© 2024 by the authors. Licensee MDPI, Basel, Switzerland. This article is an open access article distributed under the terms and conditions of the Creative Commons Attribution (CC BY) license (https://creativecommons.org/licenses/by/4.0/).
Share and Cite
Christman, L.; De Benedetto, A.; Johnson, E.; Khoo, C.; Gu, L. Polyphenol-Rich Cranberry Beverage Positively Affected Skin Health, Skin Lipids, Skin Microbiome, Inflammation, and Oxidative Stress in Women in a Randomized Controlled Trial. Nutrients 2024, 16, 3126. https://doi.org/10.3390/nu16183126
Christman L, De Benedetto A, Johnson E, Khoo C, Gu L. Polyphenol-Rich Cranberry Beverage Positively Affected Skin Health, Skin Lipids, Skin Microbiome, Inflammation, and Oxidative Stress in Women in a Randomized Controlled Trial. Nutrients. 2024; 16(18):3126. https://doi.org/10.3390/nu16183126
Chicago/Turabian StyleChristman, Lindsey, Anna De Benedetto, Elizabeth Johnson, Christina Khoo, and Liwei Gu. 2024. "Polyphenol-Rich Cranberry Beverage Positively Affected Skin Health, Skin Lipids, Skin Microbiome, Inflammation, and Oxidative Stress in Women in a Randomized Controlled Trial" Nutrients 16, no. 18: 3126. https://doi.org/10.3390/nu16183126