
Follow-Up Period Affects the Association between Serum 25-Hydroxyvitamin D Concentration and Incidence of Dementia, Alzheimer’s Disease, and Cognitive Impairment


Abstract
1. Introduction
2. Materials and Methods

| Country | Mean Age (±SD) (yrs) | NT | ND | NAD | Author, yr, Ref. |
|---|---|---|---|---|---|
| USA | 74 ± 5 | 1658 | 171 | 102 | (Littlejohns, 2014) [12] |
| Germany | 84 ± 3 | 861 F, 473 M | 250 | 209 | (van Lent, 2022) [13] |
| Israel | 53 ± 17 | 2454 F, 1824 M | 133 | Kiderman, 2023) [14] | |
| UK | 64.6 | 13,486 | 283 | 101 | (Geng, 2022) [15] |
| USA | 72 ± 7 | 1663 | 267 | 208 | (Karakis, 2016) [16] |
| Norway | 78 | 790 F, 644 M | 324 | (Asante, 2023) [17] | |
| France | 73 ± 5 | 916 | 177 | 124 | (Féart, 2017) [18] |
| Sweden | 71 | 1182 M | 250 M | 116 M | (Olsson, 2017) [19] |
| The Netherlands | 69 ± 8 | 3462 F, 2625 M | 795 | 641 | (Licher, 2017) [20] |
| UK | 62 ± 3 | 140,857 F, 128,372 M | 7087 | 3616 | (Chen, 2024) [11] |
| Omitted | |||||
| Switzerland | 85 ± 7 | 147 F, 53 M | 46 | (Graf, 2014) [10] | |
| USA | 62 | 793 B, 859 W | 145 | (Schneider, 2014) [21] | |
| Finland | Cases: 69 ± 7 Noncases: 56 ± 10 | 2724 F, 2286 M | 100 F, 51 M | (Knekt, 2014) [22] | |
| USA | 57 ± 6 | 13,039 | 1323 | (Fashanu, 2019) [23] | |
| Denmark | 58 | 10,186 | 418 | 92 | (Afzal, 2014) [24] |
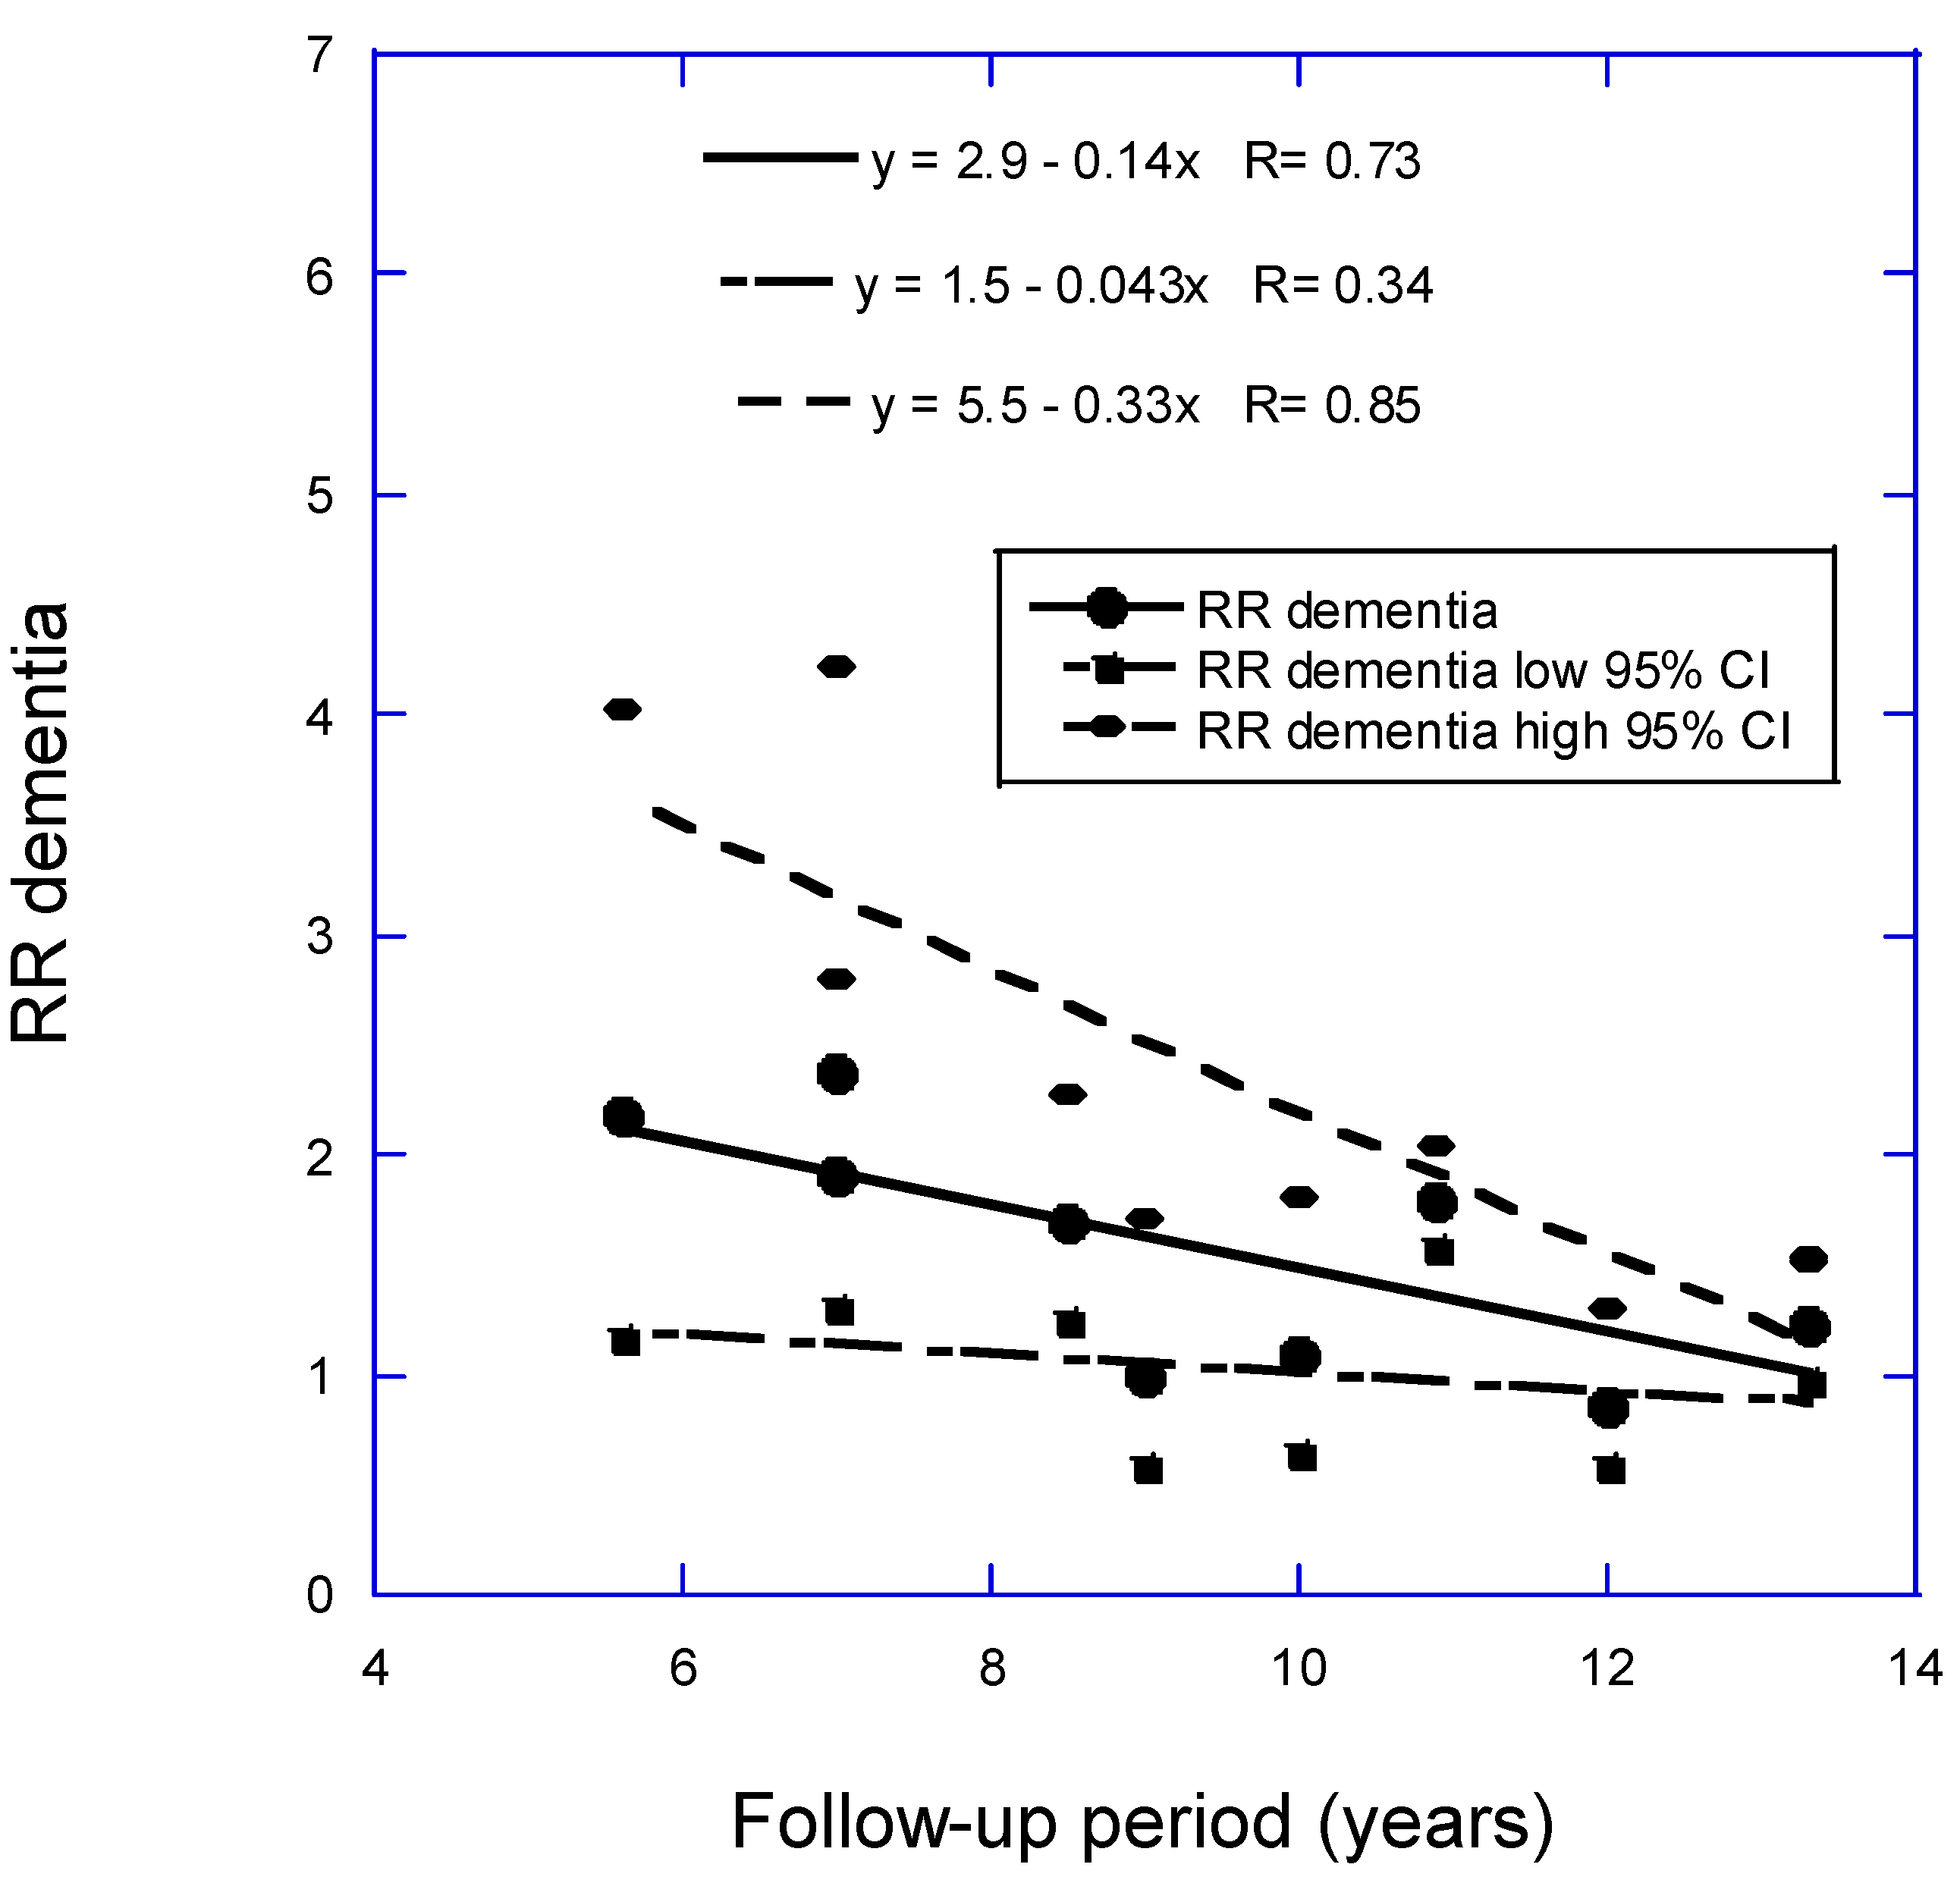
| Mean BMI (±SD) (kg/m2) | Mean 25(OH)D (±SD) (nmol/L) | 25(OH)D Comparison (nmol/L) | Mean Follow-Up (yrs) | RR (95% CI) | Author, yr, Ref. |
|---|---|---|---|---|---|
| 27 ± 5 | <25 vs. >50 | 5.6 | 2.18 (1.18–4.02) | (Littlejohns, 2014) [12] | |
| 27 ± 6 | 54 ± 24 | <25 vs. >50 | 7 | 2.38 (1.31–4.23) | Kiderman, 2023) [14] |
| 27 ± 5 | 63 ± 28 | 9 | 1.00 (0.58–1.72) | (Karakis, 2016) [16] | |
| 27 ± 3 | 50 ± 21 | <50 vs. >50 | 10 | 1.09 (0.64–1.83) | (Asante, 2023) [17] |
| 26 ± 4 | <50 vs. >50 | 11.4 | 2.12 (1.21–3.71) | (Féart, 2017) [18] | |
| 26 ± 3 | 69 ± 19 | <50 vs. ≥75 | 12 | 0.86 (0.58–1.30) | (Olsson, 2017) [19] |
| 27 ± 4 | 49 (IQR 30–69) | <25 vs. >50 | 13.3 | 1.22 (0.98–1.54) | (Licher, 2017) [20] |
| 27 ± 4 | 50 ± 21 | <50 vs. >50 | 13.6 | 1.25 (1.16–1.34) | (Chen, 2024) [11] |
| Omitted | from analysis due to long follow-up period | ||||
| 23 ± 4 | 32 ± 25 | <25 vs. >75 | 2 | 2.85 (0.45–17.95) | (Graf, 2014) [10] |
| 27 ± 5, W | 64 ± 20 W; | High vs. low tertile | 16.6 | 1.30 (0.62–2.71) | (Schneider, 2014) [21] |
| 30 ± 6, B | 43 ± 16 B | High vs. low tertile | 16.6 | 1.81 (0.33–6.50) | (Schneider, 2014) [21] |
| 26 ± 4 F | Cases: 40 ± 20 Noncases: 43 ± 17 | High vs. low quartile | 17 | 3.03 (1.37–6.69) | (Knekt, 2014) [22] |
| 26 ± 4 M | Cases: 40 ± 20 Noncases: 43 ± 17 | High vs. low quartile | 17 | 1.35 (0.53–3.44) | (Knekt, 2014) [22] |
| 28 ± 5 | 61 ± 22 | <25 vs. >50 | 20 | 1.24 (1.05–1.48) | (Fashanu, 2019) [23] |
| 25 ± 3 | 45 (M) 40 (F) | <25th vs. >50th percentile | 30 | 1.27 (1.01–1.60) | (Afzal, 2014) [24] |
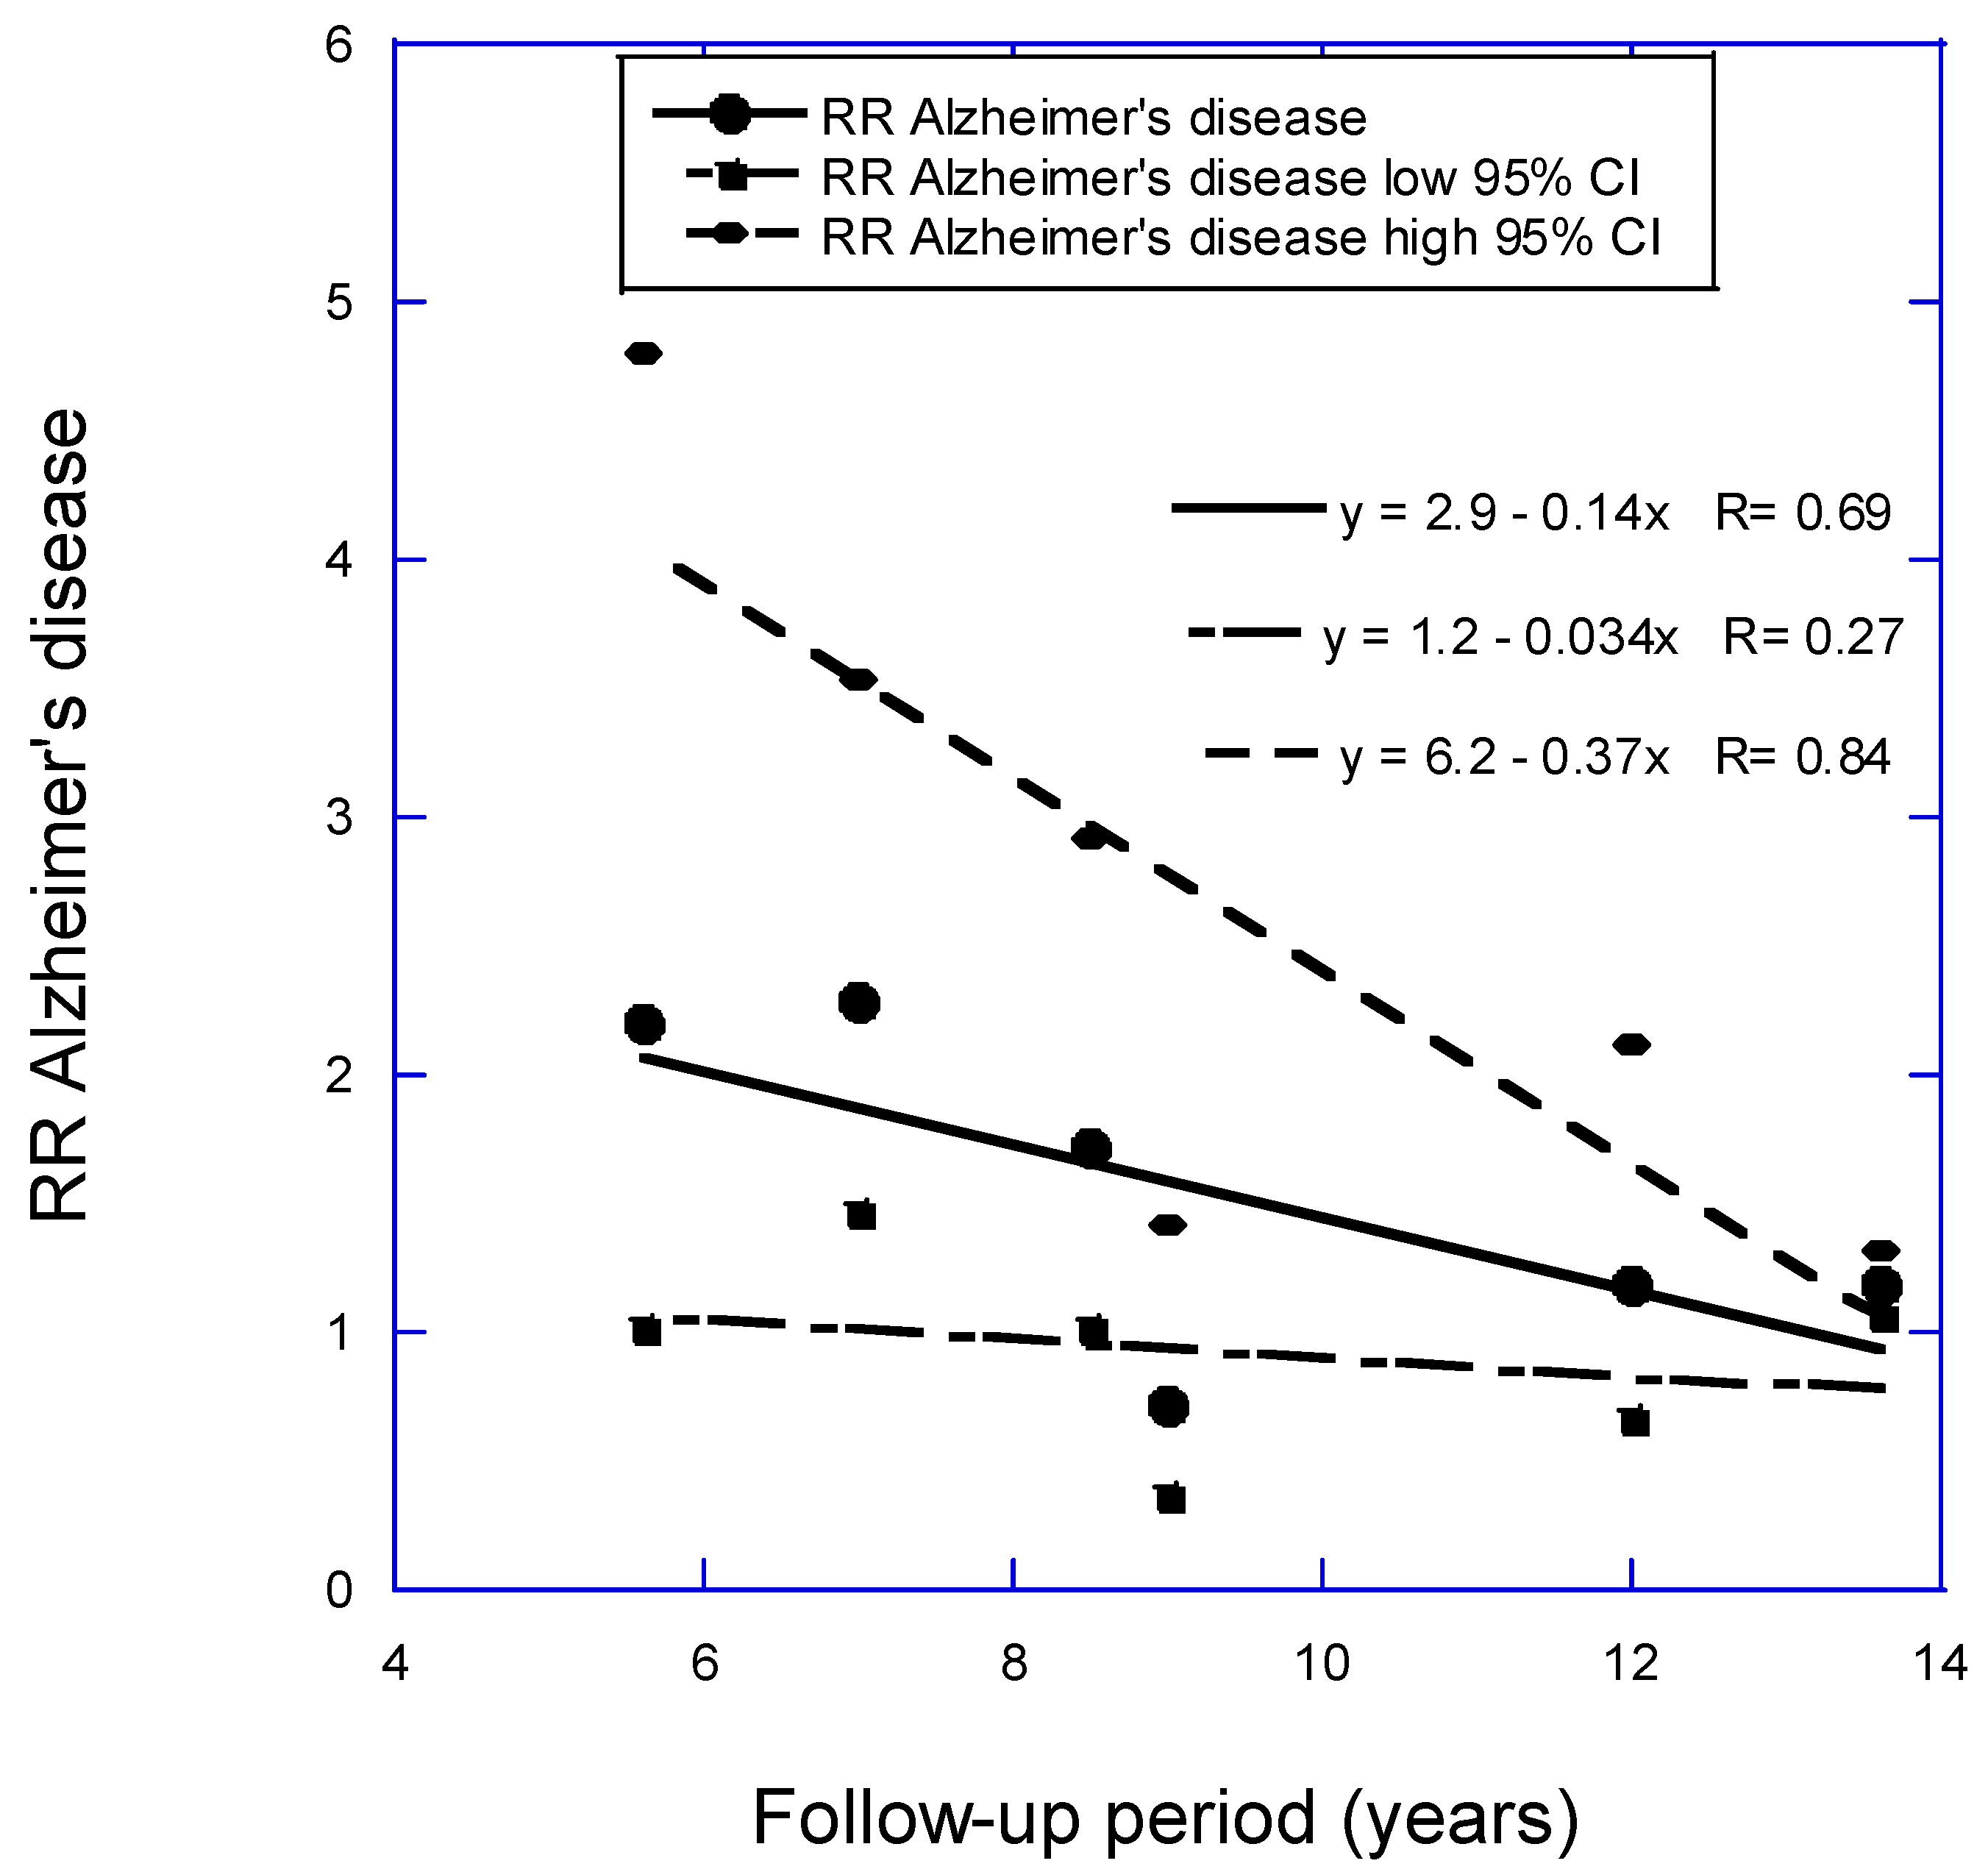
| Mean BMI (±SD) (kg/m2) | Mean 25(OH)D (±SD) (nmol/L) | 25(OH)D Comparison (nmol/L) | Mean Follow-Up (yrs) | RR (95% CI) | Author, yr, Ref. |
|---|---|---|---|---|---|
| 27 ± 5 | <25 vs. >50 | 5.6 | 2.20 (1.01–4.80) | (Littlejohns, 2014) [12] | |
| 26 ± 4 | 37 (IQR 25–58) | <25 vs. >50 | 7 | 2.28 (1.47–3.53) | (van Lent, 2022) [13] |
| 31 ± 5 | <25 vs. >50 | 8.5 | 1.72 (1.02–2.91) | (Geng, 2022) [15] | |
| 27 ± 5 | 63 ± 28 | 9 | 0.72 (0.37–1.42) | (Karakis, 2016) [16] | |
| 26 ± 4 | <50 vs. >50 | 11.4 | 2.85 (1.36–5.97) | (Féart, 2017) [18] | |
| 26 ± 3 | 69 ± 19 | <50 vs. ≥75 | 12 | 1.19 (0.67–2.12) | (Olsson, 2017) [19] |
| 27 ± 4 | 50 ± 21 | <50 vs. >50 | 13.6 | 1.19 (1.07–1.31) | (Chen, 2024) [11] |
| Omitted | from analysis due to long follow-up period | ||||
| Country | Mean Age (±SD) (yrs) | N | NCI | Test | Author, yr, Ref. |
|---|---|---|---|---|---|
| USA | 74 ± 5 | 1812 F | 446, 409 | MMSE, TMTB | (Slinin, 2012) [25] |
| Italy | 74 ± 7 | 1208 F, 719 M | 466 | MMSE | (Toffanello, 2014) [26] |
| USA | 74 ± 6 | 806 M | 126 | MMSE, TMTB | (Slinin, 2010) [27] |
| Italy | 74 ± 7 | 487 F, 370 M | MMSE | (Llewellyn, 2011) [28] | |
| USA | 72 ± 3 | 1750 F, 832 M | 324 | BVRT | (Kuzma, 2016 [CHS]) [2] |
| Chile | 67 ± 5 | 666 F, 289 M | 54 | MMSE | (Marquez, 2022) [29] |
| Norway | 78 | 790 F, 644 M | 717 | MoCA | (Asante, 2023) [17] |
| Sweden | 71 | 1182 M | 80 | MMSE | (Olsson, 2017) [19] |
| The Netherlands | 74 ± 6 | 1010 F, 820 M | 346 | RAVLT | (Kuzma, 2016 [LASA]) [2] |
| Assessment (yrs) | Mean BMI (±SD) (kg/m2) | Mean 25(OH)D (±SD) (nmol/L) | 25(OH)D Comparison (nmol/L) | Mean Follow-Up (yrs) | RR (95% CI) | Author, yr, Ref. |
|---|---|---|---|---|---|---|
| 2 and 4 | 26 ± 5, F | <25 vs. ≥75 | 4.0 | 1.45 (1.10–1.86) | (Slinin, 2012) [25] | |
| 4 | 27 ± 3 | 84 ± 54 | <50 vs. ≥75 | 4.4 | 1.36 (1.04–1.80) | (Toffanello, 2014) [26] |
| 4.6 | 27 ± 3, M | <50 vs. ≥75 | 4.6 | 1.29 (0.91–1.74) | (Slinin, 2010) [27] | |
| 3 and 6 | 52 ± 37 | <25 vs. ≥75 | 5.2 | 1.64 (1.20–2.05) | (Llewellyn, 2011) [28] | |
| Annual | 27 ± 5 | <25 vs. ≥50 | 6.5 | 1.73 (1.22–2.45) | (Kuzma, 2016 [CHS]) [2] | |
| ? | 29 ± 5, F 28 ± 4, M | Cases: 58 ± 32 Noncases: 71 ± 38 | 30–48 vs. >75 | 9.6 | 1.25 (0.64–2.85) | (Marquez, 2022) [29] |
| 27 ± 3 | 50 ± 21 | <50 vs. >50 | 10 | 1.06 (0.73–1.44) | (Asante, 2023) [17] | |
| 26 ± 3 | 69 ± 19 | <50 vs. ≥75 | 12 | 0.67 (0.31–1.36) | (Olsson, 2017) [19] | |
| Every 3–4 | 27 ± 4 | <25 vs. ≥50 | 13 | 1.12 (0.84–1.48) | (Kuzma, 2016 [LASA]) [2] |
3. Results
4. Discussion
5. Conclusions
Funding
Institutional Review Board Statement
Informed Consent Statement
Data Availability Statement
Conflicts of Interest
References
- Clarke, R.; Shipley, M.; Lewington, S.; Youngman, L.; Collins, R.; Marmot, M.; Peto, R. Underestimation of risk associations due to regression dilution in long-term follow-up of prospective studies. Am. J. Epidemiol. 1999, 150, 341–353. [Google Scholar] [CrossRef] [PubMed]
- Kuzma, E.; Soni, M.; Littlejohns, T.J.; Ranson, J.M.; van Schoor, N.M.; Deeg, D.J.; Comijs, H.; Chaves, P.H.; Kestenbaum, B.R.; Kuller, L.H.; et al. Vitamin D and Memory Decline: Two Population-Based Prospective Studies. J. Alzheimers Dis. 2016, 50, 1099–1108. [Google Scholar] [CrossRef] [PubMed]
- Grant, W.B. Effect of interval between serum draw and follow-up period on relative risk of cancer incidence with respect to 25-hydroxyvitamin D level: Implications for meta-analyses and setting vitamin D guidelines. Dermato-Endocrinology 2011, 3, 199–204. [Google Scholar] [CrossRef] [PubMed]
- Grant, W.B. Effect of follow-up time on the relation between prediagnostic serum 25-hydroxyvitamin D and all-cause mortality rate. Dermato-Endocrinology 2012, 4, 198–202. [Google Scholar] [CrossRef] [PubMed]
- Jorde, R.; Sneve, M.; Hutchinson, M.; Emaus, N.; Figenschau, Y.; Grimnes, G. Tracking of serum 25-hydroxyvitamin D levels during 14 years in a population-based study and during 12 months in an intervention study. Am. J. Epidemiol. 2010, 171, 903–908. [Google Scholar] [CrossRef] [PubMed]
- McCullough, M.L.; Zoltick, E.S.; Weinstein, S.J.; Fedirko, V.; Wang, M.; Cook, N.R.; Eliassen, A.H.; Zeleniuch-Jacquotte, A.; Agnoli, C.; Albanes, D.; et al. Circulating Vitamin D and Colorectal Cancer Risk: An International Pooling Project of 17 Cohorts. J. Natl. Cancer Inst. 2019, 111, 158–169. [Google Scholar] [CrossRef]
- Munoz, A.; Grant, W.B. Vitamin D and Cancer: An Historical Overview of the Epidemiology and Mechanisms. Nutrients 2022, 14, 1448. [Google Scholar] [CrossRef]
- Zhang, X.X.; Wang, H.R.; Meng, W.; Hu, Y.Z.; Sun, H.M.; Feng, Y.X.; Jia, J.J. Association of Vitamin D Levels with Risk of Cognitive Impairment and Dementia: A Systematic Review and Meta-Analysis of Prospective Studies. J. Alzheimers Dis. 2024, 98, 373–385. [Google Scholar] [CrossRef]
- Chen, H.; Xue, W.; Li, J.; Fu, K.; Shi, H.; Zhang, B.; Teng, W.; Tian, L. 25-Hydroxyvitamin D Levels and the Risk of Dementia and Alzheimer’s Disease: A Dose-Response Meta-Analysis. Front. Aging Neurosci. 2018, 10, 368. [Google Scholar] [CrossRef]
- Graf, C.E.; Rossi, C.; Giannelli, S.V.; Nobari, B.H.; Gold, G.; Herrmann, F.R.; Zekry, D. Vitamin D is not associated with cognitive status in a cohort of very old hospitalized patients. J. Alzheimers Dis. 2014, 42 (Suppl. S3), S53–S61. [Google Scholar] [CrossRef]
- Chen, L.J.; Sha, S.; Stocker, H.; Brenner, H.; Schottker, B. The associations of serum vitamin D status and vitamin D supplements use with all-cause dementia, Alzheimer’s disease, and vascular dementia: A UK Biobank based prospective cohort study. Am. J. Clin. Nutr. 2024, 119, 1052–1064. [Google Scholar] [CrossRef] [PubMed]
- Littlejohns, T.J.; Henley, W.E.; Lang, I.A.; Annweiler, C.; Beauchet, O.; Chaves, P.H.; Fried, L.; Kestenbaum, B.R.; Kuller, L.H.; Langa, K.M.; et al. Vitamin D and the risk of dementia and Alzheimer disease. Neurology 2014, 83, 920–928. [Google Scholar] [CrossRef]
- Melo van Lent, D.; Egert, S.; Wolfsgruber, S.; Kleineidam, L.; Weinhold, L.; Wagner-Thelen, H.; Stoffel-Wagner, B.; Bickel, H.; Wiese, B.; Weyerer, S.; et al. Low Serum Vitamin D Status Is Associated with Incident Alzheimer’s Dementia in the Oldest Old. Nutrients 2022, 15, 61. [Google Scholar] [CrossRef]
- Kiderman, D.; Ben-Shabat, N.; Tsur, A.M.; Anis, S.; Watad, A.; Cohen, A.D.; Paz, Z.; Amital, H. Vitamin D Insufficiency is Associated with Higher Incidence of Dementia, a Large Community-Based Retrospective Cohort Study. J. Geriatr. Psychiatry Neurol. 2023, 36, 511–518. [Google Scholar] [CrossRef] [PubMed]
- Geng, T.; Lu, Q.; Wan, Z.; Guo, J.; Liu, L.; Pan, A.; Liu, G. Association of serum 25-hydroxyvitamin D concentrations with risk of dementia among individuals with type 2 diabetes: A cohort study in the UK Biobank. PLoS Med. 2022, 19, e1003906. [Google Scholar] [CrossRef] [PubMed]
- Karakis, I.; Pase, M.P.; Beiser, A.; Booth, S.L.; Jacques, P.F.; Rogers, G.; DeCarli, C.; Vasan, R.S.; Wang, T.J.; Himali, J.J.; et al. Association of Serum Vitamin D with the Risk of Incident Dementia and Subclinical Indices of Brain Aging: The Framingham Heart Study. J. Alzheimers Dis. 2016, 51, 451–461. [Google Scholar] [CrossRef]
- Asante, E.O.; Mai, X.M.; Eldholm, R.S.; Skjellegrind, H.K.; Kolberg, M.; Brumpton, B.M.; Selbaek, G.; Chen, Y.; Sun, Y.Q. Vitamin D Status Over Time and Cognitive Function in Norwegian Older Adults: A Prospective Cohort of the HUNT Study. J. Nutr. Health Aging 2023, 27, 30–37. [Google Scholar] [CrossRef] [PubMed]
- Féart, C.; Helmer, C.; Merle, B.; Herrmann, F.R.; Annweiler, C.; Dartigues, J.F.; Delcourt, C.; Samieri, C. Associations of lower vitamin D concentrations with cognitive decline and long-term risk of dementia and Alzheimer’s disease in older adults. Alzheimers Dement. 2017, 13, 1207–1216. [Google Scholar] [CrossRef]
- Olsson, E.; Byberg, L.; Karlstrom, B.; Cederholm, T.; Melhus, H.; Sjogren, P.; Kilander, L. Vitamin D is not associated with incident dementia or cognitive impairment: An 18-y follow-up study in community-living old men. Am. J. Clin. Nutr. 2017, 105, 936–943. [Google Scholar] [CrossRef]
- Licher, S.; de Bruijn, R.; Wolters, F.J.; Zillikens, M.C.; Ikram, M.A.; Ikram, M.K. Vitamin D and the Risk of Dementia: The Rotterdam Study. J. Alzheimers Dis. 2017, 60, 989–997. [Google Scholar] [CrossRef]
- Schneider, A.L.; Lutsey, P.L.; Alonso, A.; Gottesman, R.F.; Sharrett, A.R.; Carson, K.A.; Gross, M.; Post, W.S.; Knopman, D.S.; Mosley, T.H.; et al. Vitamin D and cognitive function and dementia risk in a biracial cohort: The ARIC Brain MRI Study. Eur. J. Neurol. 2014, 21, 1211-e70. [Google Scholar] [CrossRef]
- Knekt, P.; Saaksjarvi, K.; Jarvinen, R.; Marniemi, J.; Mannisto, S.; Kanerva, N.; Heliovaara, M. Serum 25-hydroxyvitamin d concentration and risk of dementia. Epidemiology 2014, 25, 799–804. [Google Scholar] [CrossRef]
- Fashanu, O.E.; Zhao, D.; Schneider, A.L.C.; Rawlings, A.M.; Sharrett, A.R.; Lutsey, P.L.; Gottesman, R.F.; Gross, A.L.; Guallar, E.; Alonso, A.; et al. Mid-life serum Vitamin D concentrations were associated with incident dementia but not late-life neuropsychological performance in the Atherosclerosis Risk in Communities (ARIC) Study. BMC Neurol. 2019, 19, 244. [Google Scholar] [CrossRef]
- Afzal, S.; Bojesen, S.E.; Nordestgaard, B.G. Reduced 25-hydroxyvitamin D and risk of Alzheimer’s disease and vascular dementia. Alzheimers Dement. 2014, 10, 296–302. [Google Scholar] [CrossRef]
- Slinin, Y.; Paudel, M.; Taylor, B.C.; Ishani, A.; Rossom, R.; Yaffe, K.; Blackwell, T.; Lui, L.Y.; Hochberg, M.; Ensrud, K.E.; et al. Association between serum 25(OH) vitamin D and the risk of cognitive decline in older women. J. Gerontol. A Biol. Sci. Med. Sci. 2012, 67, 1092–1098. [Google Scholar] [CrossRef]
- Toffanello, E.D.; Coin, A.; Perissinotto, E.; Zambon, S.; Sarti, S.; Veronese, N.; De Rui, M.; Bolzetta, F.; Corti, M.C.; Crepaldi, G.; et al. Vitamin D deficiency predicts cognitive decline in older men and women: The Pro.V.A. Study. Neurology 2014, 83, 2292–2298. [Google Scholar] [CrossRef]
- Slinin, Y.; Paudel, M.L.; Taylor, B.C.; Fink, H.A.; Ishani, A.; Canales, M.T.; Yaffe, K.; Barrett-Connor, E.; Orwoll, E.S.; Shikany, J.M.; et al. 25-Hydroxyvitamin D levels and cognitive performance and decline in elderly men. Neurology 2010, 74, 33–41. [Google Scholar] [CrossRef]
- Llewellyn, D.J.; Lang, I.A.; Langa, K.M.; Melzer, D. Vitamin D and cognitive impairment in the elderly U.S. population. J. Gerontol. A Biol. Sci. Med. Sci. 2011, 66, 59–65. [Google Scholar] [CrossRef]
- Marquez, C.; Angel, B.; Lera, L.; Bendayan, R.; Sanchez, H.; Albala, C. Exploring the Association between Vitamin D and Changes in Cognitive Function in Chilean Older Adults: Evidence from the ALEXANDROS Cohort Study. J. Pers. Med. 2022, 12, 1078. [Google Scholar] [CrossRef]
- MacLaughlin, J.; Holick, M.F. Aging decreases the capacity of human skin to produce vitamin D3. J. Clin. Investig. 1985, 76, 1536–1538. [Google Scholar] [CrossRef]
- Chalcraft, J.R.; Cardinal, L.M.; Wechsler, P.J.; Hollis, B.W.; Gerow, K.G.; Alexander, B.M.; Keith, J.F.; Larson-Meyer, D.E. Vitamin D Synthesis Following a Single Bout of Sun Exposure in Older and Younger Men and Women. Nutrients 2020, 12, 2237. [Google Scholar] [CrossRef]
- Crowe, F.L.; Steur, M.; Allen, N.E.; Appleby, P.N.; Travis, R.C.; Key, T.J. Plasma concentrations of 25-hydroxyvitamin D in meat eaters, fish eaters, vegetarians and vegans: Results from the EPIC-Oxford study. Public. Health Nutr. 2011, 14, 340–346. [Google Scholar] [CrossRef]
- Raulio, S.; Erlund, I.; Mannisto, S.; Sarlio-Lahteenkorva, S.; Sundvall, J.; Tapanainen, H.; Vartiainen, E.; Virtanen, S.M. Successful nutrition policy: Improvement of vitamin D intake and status in Finnish adults over the last decade. Eur. J. Public Health 2017, 27, 268–273. [Google Scholar] [CrossRef]
- Ikonen, H.; Lumme, J.; Seppala, J.; Pesonen, P.; Piltonen, T.; Jarvelin, M.R.; Herzig, K.H.; Miettunen, J.; Niinimaki, M.; Palaniswamy, S.; et al. The determinants and longitudinal changes in vitamin D status in middle-age: A Northern Finland Birth Cohort 1966 study. Eur. J. Nutr. 2021, 60, 4541–4553. [Google Scholar] [CrossRef]
- Rooney, M.R.; Harnack, L.; Michos, E.D.; Ogilvie, R.P.; Sempos, C.T.; Lutsey, P.L. Trends in Use of High-Dose Vitamin D Supplements Exceeding 1000 or 4000 International Units Daily, 1999–2014. JAMA 2017, 317, 2448–2450. [Google Scholar] [CrossRef]
- Bernstein, A.M.; Song, M.; Zhang, X.; Pan, A.; Wang, M.; Fuchs, C.S.; Le, N.; Chan, A.T.; Willett, W.C.; Ogino, S.; et al. Processed and Unprocessed Red Meat and Risk of Colorectal Cancer: Analysis by Tumor Location and Modification by Time. PLoS ONE 2015, 10, e0135959. [Google Scholar] [CrossRef]
- Dawson-Hughes, B.; Staten, M.A.; Knowler, W.C.; Nelson, J.; Vickery, E.M.; LeBlanc, E.S.; Neff, L.M.; Park, J.; Pittas, A.G.; Group, D.d.R. Intratrial Exposure to Vitamin D and New-Onset Diabetes Among Adults With Prediabetes: A Secondary Analysis From the Vitamin D and Type 2 Diabetes (D2d) Study. Diabetes Care 2020, 43, 2916–2922. [Google Scholar] [CrossRef]
- Gezen-Ak, D.; Dursun, E. Vitamin D, a Secosteroid Hormone and Its Multifunctional Receptor, Vitamin D Receptor, in Alzheimer’s Type Neurodegeneration. J. Alzheimer’s Dis. 2023, 95, 1273–1299. [Google Scholar] [CrossRef]
- Nguyen, T.T.; Ta, Q.T.H.; Nguyen, T.T.D.; Le, T.T.; Vo, V.G. Role of Insulin Resistance in the Alzheimer’s Disease Progression. Neurochem. Res. 2020, 45, 1481–1491. [Google Scholar] [CrossRef]
- Szymczak-Pajor, I.; Sliwinska, A. Analysis of Association between Vitamin D Deficiency and Insulin Resistance. Nutrients 2019, 11, 794. [Google Scholar] [CrossRef]
- Wenclewska, S.; Szymczak-Pajor, I.; Drzewoski, J.; Bunk, M.; Sliwinska, A. Vitamin D Supplementation Reduces Both Oxidative DNA Damage and Insulin Resistance in the Elderly with Metabolic Disorders. Int. J. Mol. Sci. 2019, 20, 2891. [Google Scholar] [CrossRef]
- Lason, W.; Jantas, D.; Leskiewicz, M.; Regulska, M.; Basta-Kaim, A. The Vitamin D Receptor as a Potential Target for the Treatment of Age-Related Neurodegenerative Diseases Such as Alzheimer’s and Parkinson’s Diseases: A Narrative Review. Cells 2023, 12, 660. [Google Scholar] [CrossRef]
- SanMartin, C.D.; Henriquez, M.; Chacon, C.; Ponce, D.P.; Salech, F.; Rogers, N.K.; Behrens, M.I. Vitamin D Increases Abeta140 Plasma Levels and Protects Lymphocytes from Oxidative Death in Mild Cognitive Impairment Patients. Curr. Alzheimer Res. 2018, 15, 561–569. [Google Scholar] [CrossRef]
- Michaud, T.L.; Su, D.; Siahpush, M.; Murman, D.L. The Risk of Incident Mild Cognitive Impairment and Progression to Dementia Considering Mild Cognitive Impairment Subtypes. Dement. Geriatr. Cogn. Dis. Extra 2017, 7, 15–29. [Google Scholar] [CrossRef]
- Davis, M.; O’Connell, T.; Johnson, S.; Cline, S.; Merikle, E.; Martenyi, F.; Simpson, K. Estimating Alzheimer’s Disease Progression Rates from Normal Cognition Through Mild Cognitive Impairment and Stages of Dementia. Curr. Alzheimer Res. 2018, 15, 777–788. [Google Scholar] [CrossRef]
- Pettersen, J.A. Does high dose vitamin D supplementation enhance cognition?: A randomized trial in healthy adults. Exp. Gerontol. 2017, 90, 90–97. [Google Scholar] [CrossRef]
- Jia, J.; Hu, J.; Huo, X.; Miao, R.; Zhang, Y.; Ma, F. Effects of vitamin D supplementation on cognitive function and blood Abeta-related biomarkers in older adults with Alzheimer’s disease: A randomised, double-blind, placebo-controlled trial. J. Neurol. Neurosurg. Psychiatry 2019, 90, 1347–1352. [Google Scholar] [CrossRef]
- Wang, P.; Song, M.; Eliassen, A.H.; Wang, M.; Fung, T.T.; Clinton, S.K.; Rimm, E.B.; Hu, F.B.; Willett, W.C.; Tabung, F.K.; et al. Optimal dietary patterns for prevention of chronic disease. Nat. Med. 2023, 29, 719–728. [Google Scholar] [CrossRef]
- Kroll, M.H.; Bi, C.; Garber, C.C.; Kaufman, H.W.; Liu, D.; Caston-Balderrama, A.; Zhang, K.; Clarke, N.; Xie, M.; Reitz, R.E.; et al. Temporal relationship between vitamin D status and parathyroid hormone in the United States. PLoS ONE 2015, 10, e0118108. [Google Scholar] [CrossRef]
- Sempos, C.T.; Heijboer, A.C.; Bikle, D.D.; Bollerslev, J.; Bouillon, R.; Brannon, P.M.; DeLuca, H.F.; Jones, G.; Munns, C.F.; Bilezikian, J.P.; et al. Vitamin D assays and the definition of hypovitaminosis D: Results from the First International Conference on Controversies in Vitamin D. Br. J. Clin. Pharmacol. 2018, 84, 2194–2207. [Google Scholar] [CrossRef]
- Wang, L.; Qiao, Y.; Zhang, H.; Zhang, Y.; Hua, J.; Jin, S.; Liu, G. Circulating Vitamin D Levels and Alzheimer’s Disease: A Mendelian Randomization Study in the IGAP and UK Biobank. J. Alzheimers Dis. 2020, 73, 609–618. [Google Scholar] [CrossRef] [PubMed]
- Davey Smith, G.; Hemani, G. Mendelian randomization: Genetic anchors for causal inference in epidemiological studies. Hum. Mol. Genet. 2014, 23, R89–R98. [Google Scholar] [CrossRef] [PubMed]
- Mokry, L.E.; Ross, S.; Morris, J.A.; Manousaki, D.; Forgetta, V.; Richards, J.B. Genetically decreased vitamin D and risk of Alzheimer disease. Neurology 2016, 87, 2567–2574. [Google Scholar] [CrossRef] [PubMed]
- Navale, S.S.; Mulugeta, A.; Zhou, A.; Llewellyn, D.J.; Hypponen, E. Vitamin D and brain health: An observational and Mendelian randomization study. Am. J. Clin. Nutr. 2022, 116, 531–540. [Google Scholar] [CrossRef] [PubMed]
- Pludowski, P.; Grant, W.B.; Karras, S.N.; Zittermann, A.; Pilz, S. Vitamin D Supplementation: A Review of the Evidence Arguing for a Daily Dose of 2000 International Units (50 microg) of Vitamin D for Adults in the General Population. Nutrients 2024, 16, 391. [Google Scholar] [CrossRef]
- Jamka, M.; Wozniewicz, M.; Walkowiak, J.; Bogdanski, P.; Jeszka, J.; Stelmach-Mardas, M. The effect of vitamin D supplementation on selected inflammatory biomarkers in obese and overweight subjects: A systematic review with meta-analysis. Eur. J. Nutr. 2016, 55, 2163–2176. [Google Scholar] [CrossRef]

Disclaimer/Publisher’s Note: The statements, opinions and data contained in all publications are solely those of the individual author(s) and contributor(s) and not of MDPI and/or the editor(s). MDPI and/or the editor(s) disclaim responsibility for any injury to people or property resulting from any ideas, methods, instructions or products referred to in the content. |
© 2024 by the author. Licensee MDPI, Basel, Switzerland. This article is an open access article distributed under the terms and conditions of the Creative Commons Attribution (CC BY) license (https://creativecommons.org/licenses/by/4.0/).
Share and Cite
Grant, W.B. Follow-Up Period Affects the Association between Serum 25-Hydroxyvitamin D Concentration and Incidence of Dementia, Alzheimer’s Disease, and Cognitive Impairment. Nutrients 2024, 16, 3211. https://doi.org/10.3390/nu16183211
Grant WB. Follow-Up Period Affects the Association between Serum 25-Hydroxyvitamin D Concentration and Incidence of Dementia, Alzheimer’s Disease, and Cognitive Impairment. Nutrients. 2024; 16(18):3211. https://doi.org/10.3390/nu16183211
Chicago/Turabian StyleGrant, William B. 2024. "Follow-Up Period Affects the Association between Serum 25-Hydroxyvitamin D Concentration and Incidence of Dementia, Alzheimer’s Disease, and Cognitive Impairment" Nutrients 16, no. 18: 3211. https://doi.org/10.3390/nu16183211
APA StyleGrant, W. B. (2024). Follow-Up Period Affects the Association between Serum 25-Hydroxyvitamin D Concentration and Incidence of Dementia, Alzheimer’s Disease, and Cognitive Impairment. Nutrients, 16(18), 3211. https://doi.org/10.3390/nu16183211