Influence of Peanut Consumption on the Gut Microbiome: A Randomized Clinical Trial

 , , and
Abstract
:1. Introduction
2. Materials and Methods
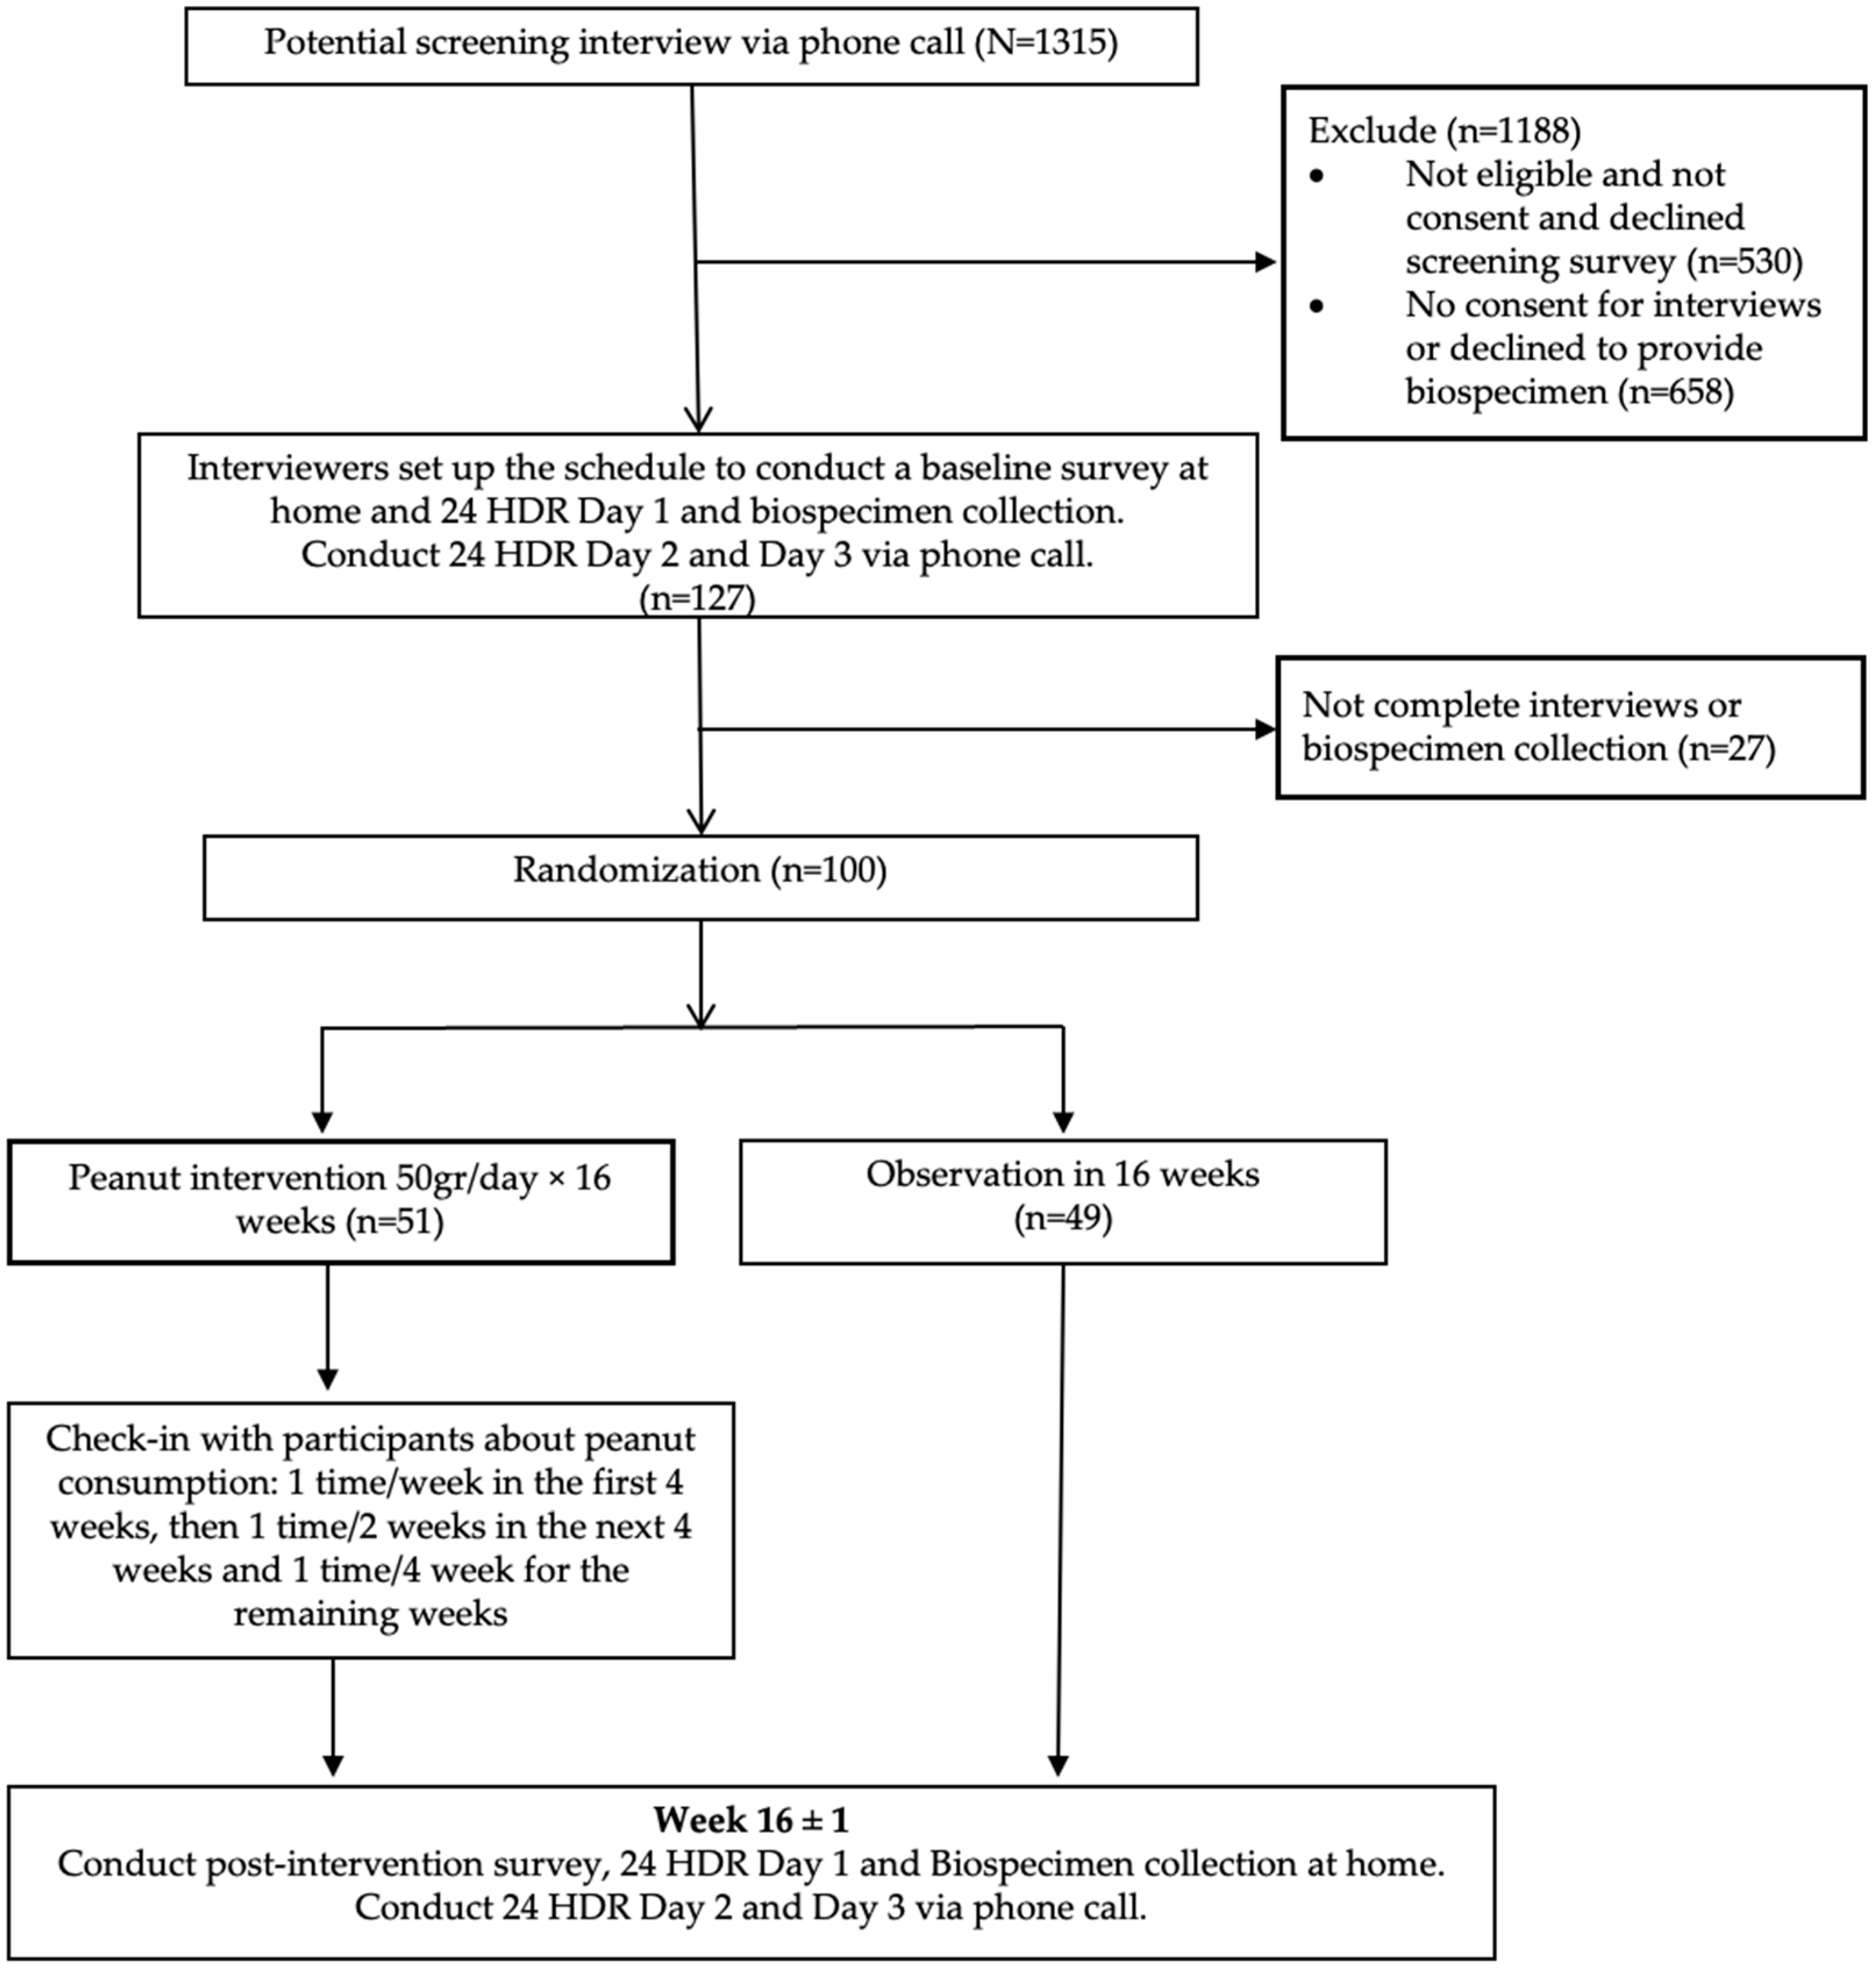
2.1. Study Population
2.2. Stool Sample Collection
2.3. Microbiome Profiling
2.3.1. DNA Extraction and Shotgun Metagenomic Sequencing
2.3.2. Sequencing Data Processing
2.4. Statistical Analysis
3. Results
4. Discussion
5. Conclusions
Supplementary Materials
Author Contributions
Funding
Institutional Review Board Statement
Informed Consent Statement
Data Availability Statement
Acknowledgments
Conflicts of Interest
Abbreviations
| 24-HDRs | 24 h dietary recalls |
| BMI | Body mass index |
| Clr | Centered log-ratio |
| DNA | Deoxyribonucleic acid |
| FDR | False discovery rate |
| FOBT | Fecal occult blood test |
| ITMCTR | International Traditional Medicine Clinical Trial Registry |
| LDA | Latent Dirichlet Allocation |
| LMM | Linear mixed-effects models |
| PERMANOVA | Permutational Multivariate Analysis of Variance |
| REDCap | Research Electronic Data Capture |
| SCFAs | Short-chain fatty acids |
| SD | Standard Deviation |
| SE | Standard Error |
| VinCAPR | Vietnam Colorectal Cancer and Polyps Research |
| VUMC | Vanderbilt University Medical Center |
| UHGG | Unified Human Gastrointestinal Genome |
References
- Ghadimi Nouran, M.; Kimiagar, M.; Abadi, A.; Mirzazadeh, M.; Harrison, G. Peanut consumption and cardiovascular risk. Public Health Nutr. 2010, 13, 1581–1586. [Google Scholar] [CrossRef] [PubMed]
- Guasch-Ferre, M.; Liu, X.; Malik, V.S.; Sun, Q.; Willett, W.C.; Manson, J.E.; Rexrode, K.M.; Li, Y.; Hu, F.B.; Bhupathiraju, S.N. Nut Consumption and Risk of Cardiovascular Disease. J. Am. Coll. Cardiol. 2017, 70, 2519–2532. [Google Scholar] [CrossRef] [PubMed]
- Ikehara, S.; Iso, H.; Kokubo, Y.; Yamagishi, K.; Saito, I.; Yatsuya, H.; Kimura, T.; Sawada, N.; Iwasaki, M.; Tsugane, S.; et al. Peanut Consumption and Risk of Stroke and Ischemic Heart Disease in Japanese Men and Women: The JPHC Study. Stroke 2021, 52, 3543–3550. [Google Scholar] [CrossRef]
- Appel, L.J.; Sacks, F.M.; Carey, V.J.; Obarzanek, E.; Swain, J.F.; Miller, E.R., 3rd; Conlin, P.R.; Erlinger, T.P.; Rosner, B.A.; Laranjo, N.M.; et al. Effects of protein, monounsaturated fat, and carbohydrate intake on blood pressure and serum lipids: Results of the OmniHeart randomized trial. JAMA 2005, 294, 2455–2464. [Google Scholar] [CrossRef] [PubMed]
- Bjermo, H.; Iggman, D.; Kullberg, J.; Dahlman, I.; Johansson, L.; Persson, L.; Berglund, J.; Pulkki, K.; Basu, S.; Uusitupa, M.; et al. Effects of n-6 PUFAs compared with SFAs on liver fat, lipoproteins, and inflammation in abdominal obesity: A randomized controlled trial. Am. J. Clin. Nutr. 2012, 95, 1003–1012. [Google Scholar] [CrossRef] [PubMed]
- Miura, K.; Stamler, J.; Brown, I.J.; Ueshima, H.; Nakagawa, H.; Sakurai, M.; Chan, Q.; Appel, L.J.; Okayama, A.; Okuda, N.; et al. Relationship of dietary monounsaturated fatty acids to blood pressure: The International Study of Macro/Micronutrients and Blood Pressure. J. Hypertens. 2013, 31, 1144–1150. [Google Scholar] [CrossRef]
- Guasch-Ferre, M.; Babio, N.; Martinez-Gonzalez, M.A.; Corella, D.; Ros, E.; Martin-Pelaez, S.; Estruch, R.; Aros, F.; Gomez-Gracia, E.; Fiol, M.; et al. Dietary fat intake and risk of cardiovascular disease and all-cause mortality in a population at high risk of cardiovascular disease. Am. J. Clin. Nutr. 2015, 102, 1563–1573. [Google Scholar] [CrossRef] [PubMed]
- Farvid, M.S.; Ding, M.; Pan, A.; Sun, Q.; Chiuve, S.E.; Steffen, L.M.; Willett, W.C.; Hu, F.B. Dietary linoleic acid and risk of coronary heart disease: A systematic review and meta-analysis of prospective cohort studies. Circulation 2014, 130, 1568–1578. [Google Scholar] [CrossRef] [PubMed]
- Luu, H.N.; Blot, W.J.; Xiang, Y.B.; Cai, H.; Hargreaves, M.K.; Li, H.; Yang, G.; Signorello, L.; Gao, Y.T.; Zheng, W.; et al. Prospective evaluation of the association of nut/peanut consumption with total and cause-specific mortality. JAMA Intern. Med. 2015, 175, 755–766. [Google Scholar] [CrossRef]
- van den Brandt, P.A.; Schouten, L.J. Relationship of tree nut, peanut and peanut butter intake with total and cause-specific mortality: A cohort study and meta-analysis. Int. J. Epidemiol. 2015, 44, 1038–1049. [Google Scholar] [CrossRef]
- Kris-Etherton, P.M.; Hu, F.B.; Ros, E.; Sabate, J. The role of tree nuts and peanuts in the prevention of coronary heart disease: Multiple potential mechanisms. J. Nutr. 2008, 138, 1746S–1751S. [Google Scholar] [CrossRef] [PubMed]
- Mingrou, L.; Guo, S.; Ho, C.T.; Bai, N. Review on chemical compositions and biological activities of peanut (Arachis hypogeae L.). J. Food Biochem. 2022, 46, e14119. [Google Scholar] [CrossRef] [PubMed]
- Musa-Veloso, K.; Paulionis, L.; Poon, T.; Lee, H.Y. The effects of almond consumption on fasting blood lipid levels: A systematic review and meta-analysis of randomised controlled trials. J. Nutr. Sci. 2016, 5, e34. [Google Scholar] [CrossRef] [PubMed]
- Sonnenburg, J.L.; Backhed, F. Diet-microbiota interactions as moderators of human metabolism. Nature 2016, 535, 56–64. [Google Scholar] [CrossRef] [PubMed]
- Gentile, C.L.; Weir, T.L. The gut microbiota at the intersection of diet and human health. Science 2018, 362, 776–780. [Google Scholar] [CrossRef] [PubMed]
- Campos, S.B.; Oliveira Filho, J.G.; Salgaco, M.K.; Jesus, M.H.; Egea, M.B. Effects of Peanuts and Pistachios on Gut Microbiota and Metabolic Syndrome: A Review. Foods 2023, 12, 4440. [Google Scholar] [CrossRef]
- Dzutsev, A.; Goldszmid, R.S.; Viaud, S.; Zitvogel, L.; Trinchieri, G. The role of the microbiota in inflammation, carcinogenesis, and cancer therapy. Eur. J. Immunol. 2015, 45, 17–31. [Google Scholar] [CrossRef]
- Kamada, N.; Chen, G.Y.; Inohara, N.; Nunez, G. Control of pathogens and pathobionts by the gut microbiota. Nat. Immunol. 2013, 14, 685–690. [Google Scholar] [CrossRef]
- Fulde, M.; Hornef, M.W. Maturation of the enteric mucosal innate immune system during the postnatal period. Immunol. Rev. 2014, 260, 21–34. [Google Scholar] [CrossRef]
- Ijssennagger, N.; Belzer, C.; Hooiveld, G.J.; Dekker, J.; van Mil, S.W.; Muller, M.; Kleerebezem, M.; van der Meer, R. Gut microbiota facilitates dietary heme-induced epithelial hyperproliferation by opening the mucus barrier in colon. Proc. Natl. Acad. Sci. USA 2015, 112, 10038–10043. [Google Scholar] [CrossRef] [PubMed]
- Reinhardt, C.; Bergentall, M.; Greiner, T.U.; Schaffner, F.; Ostergren-Lunden, G.; Petersen, L.C.; Ruf, W.; Backhed, F. Tissue factor and PAR1 promote microbiota-induced intestinal vascular remodelling. Nature 2012, 483, 627–631. [Google Scholar] [CrossRef] [PubMed]
- Neuman, H.; Debelius, J.W.; Knight, R.; Koren, O. Microbial endocrinology: The interplay between the microbiota and the endocrine system. FEMS Microbiol. Rev. 2015, 39, 509–521. [Google Scholar] [CrossRef]
- Canfora, E.E.; Jocken, J.W.; Blaak, E.E. Short-chain fatty acids in control of body weight and insulin sensitivity. Nat. Rev. Endocrinol. 2015, 11, 577–591. [Google Scholar] [CrossRef] [PubMed]
- Yano, J.M.; Yu, K.; Donaldson, G.P.; Shastri, G.G.; Ann, P.; Ma, L.; Nagler, C.R.; Ismagilov, R.F.; Mazmanian, S.K.; Hsiao, E.Y. Indigenous bacteria from the gut microbiota regulate host serotonin biosynthesis. Cell 2015, 161, 264–276. [Google Scholar] [CrossRef] [PubMed]
- Devlin, A.S.; Fischbach, M.A. A biosynthetic pathway for a prominent class of microbiota-derived bile acids. Nat. Chem. Biol. 2015, 11, 685–690. [Google Scholar] [CrossRef] [PubMed]
- Haiser, H.J.; Gootenberg, D.B.; Chatman, K.; Sirasani, G.; Balskus, E.P.; Turnbaugh, P.J. Predicting and manipulating cardiac drug inactivation by the human gut bacterium Eggerthella lenta. Science 2013, 341, 295–298. [Google Scholar] [CrossRef]
- Fitzgerald, E.; Lambert, K.; Stanford, J.; Neale, E.P. The effect of nut consumption (tree nuts and peanuts) on the gut microbiota of humans: A systematic review. Br. J. Nutr. 2021, 125, 508–520. [Google Scholar] [CrossRef] [PubMed]
- Mandalari, G.; Gervasi, T.; Rosenberg, D.W.; Lapsley, K.G.; Baer, D.J. Effect of Nuts on Gastrointestinal Health. Nutrients 2023, 15, 1733. [Google Scholar] [CrossRef] [PubMed]
- Wang, S.; Zhang, L.; Wang, D.; Huang, M.; Zhao, J.; Malik, V.; Liu, X.; Sun, L.; Lin, X.; Chen, Y. Gut Microbiota Composition is Associated with Responses to Peanut Intervention in Multiple Parameters among Adults with Metabolic Syndrome Risk. Mol. Nutr. Food Res. 2021, 65, e2001051. [Google Scholar] [CrossRef]
- Sapp, P.A.; Kris-Etherton, P.M.; Arnesen, E.A.; Chen See, J.R.; Lamendella, R.; Petersen, K.S. Peanuts as a nighttime snack enrich butyrate-producing bacteria compared to an isocaloric lower-fat higher-carbohydrate snack in adults with elevated fasting glucose: A randomized crossover trial. Clin. Nutr. 2022, 41, 2169–2177. [Google Scholar] [CrossRef]
- Tran, C.T.; Nguyen, M.V.; Tran, M.T.; Tuong, T.T.; Tran, Q.H.; Le, L.C.; Pham, H.T.; Bui, N.C.; Vu, H.H.; Nguyen, T.T.; et al. Findings from the first colorectal cancer screening among 103,542 individuals in Vietnam with systematic review of colorectal cancer screening programs in Asia-Pacific region. Jpn. J. Clin. Oncol. 2022, 52, 707–715. [Google Scholar] [CrossRef] [PubMed]
- Varga, E.; Glauner, T.; Koppen, R.; Mayer, K.; Sulyok, M.; Schuhmacher, R.; Krska, R.; Berthiller, F. Stable isotope dilution assay for the accurate determination of mycotoxins in maize by UHPLC-MS/MS. Anal. Bioanal. Chem. 2012, 402, 2675–2686. [Google Scholar] [CrossRef] [PubMed]
- Bolger, A.M.; Lohse, M.; Usadel, B. Trimmomatic: A flexible trimmer for Illumina sequence data. Bioinformatics 2014, 30, 2114–2120. [Google Scholar] [CrossRef] [PubMed]
- Langmead, B.; Salzberg, S.L. Fast gapped-read alignment with Bowtie 2. Nat. Methods 2012, 9, 357. [Google Scholar] [CrossRef]
- Wood, D.E.; Lu, J.; Langmead, B. Improved metagenomic analysis with Kraken 2. Genome Biol. 2019, 20, 257. [Google Scholar] [CrossRef]
- Lu, J.; Breitwieser, F.P.; Thielen, P.; Salzberg, S.L. Bracken: Estimating species abundance in metagenomics data. PeerJ Comput. Sci. 2017, 3, e104. [Google Scholar] [CrossRef]
- Almeida, A.; Nayfach, S.; Boland, M.; Strozzi, F.; Beracochea, M.; Shi, Z.J.; Pollard, K.S.; Sakharova, E.; Parks, D.H.; Hugenholtz, P.; et al. A unified catalog of 204,938 reference genomes from the human gut microbiome. Nat. Biotechnol. 2021, 39, 105–114. [Google Scholar] [CrossRef]
- Shao, Y.; Forster, S.C.; Tsaliki, E.; Vervier, K.; Strang, A.; Simpson, N.; Kumar, N.; Stares, M.D.; Rodger, A.; Brocklehurst, P. Stunted microbiota and opportunistic pathogen colonization in caesarean-section birth. Nature 2019, 574, 117–121. [Google Scholar] [CrossRef]
- Simon, H.Y.; Siddle, K.J.; Park, D.J.; Sabeti, P.C. Benchmarking metagenomics tools for taxonomic classification. Cell 2019, 178, 779–794. [Google Scholar]
- Franzosa, E.A.; McIver, L.J.; Rahnavard, G.; Thompson, L.R.; Schirmer, M.; Weingart, G.; Lipson, K.S.; Knight, R.; Caporaso, J.G.; Segata, N. Species-level functional profiling of metagenomes and metatranscriptomes. Nat. Methods 2018, 15, 962. [Google Scholar] [CrossRef]
- Weiss, S.; Xu, Z.Z.; Peddada, S.; Amir, A.; Bittinger, K.; Gonzalez, A.; Lozupone, C.; Zaneveld, J.R.; Vázquez-Baeza, Y.; Birmingham, A. Normalization and microbial differential abundance strategies depend upon data characteristics. Microbiome 2017, 5, 27. [Google Scholar] [CrossRef] [PubMed]
- Oksanen, J.; Blanchet, F.G.; Kindt, R.; Legendre, P.; Minchin, P.R.; O’hara, R.; Simpson, G.L.; Solymos, P.; Stevens, M.H.H.; Wagner, H. Package ‘Vegan’. Community Ecology Package, Version 2; ScienceOpen, Inc.: Lexington, MA, USA, 2013; pp. 1–295. [Google Scholar]
- Tang, Z.-Z.; Chen, G.; Alekseyenko, A.V. PERMANOVA-S: Association test for microbial community composition that accommodates confounders and multiple distances. Bioinformatics 2016, 32, 2618–2625. [Google Scholar] [CrossRef] [PubMed]
- Zhou, H.; He, K.; Chen, J.; Zhang, X. LinDA: Linear models for differential abundance analysis of microbiome compositional data. Genome Biol. 2022, 23, 95. [Google Scholar] [CrossRef] [PubMed]
- Byrd, A.L.; Liu, M.; Fujimura, K.E.; Lyalina, S.; Nagarkar, D.R.; Charbit, B.; Bergstedt, J.; Patin, E.; Harrison, O.J.; Quintana-Murci, L.; et al. Gut microbiome stability and dynamics in healthy donors and patients with non-gastrointestinal cancers. J. Exp. Med. 2021, 218, e20200606. [Google Scholar] [CrossRef] [PubMed]
- Zeileis, A.; Cribari-Neto, F.; Gruen, B.; Kosmidis, I.; Simas, A.B.; Rocha, A.V.; Zeileis, M.A. Package ‘betareg’. 2016. Available online: http://cran.nexr.com/web/packages/betareg/betareg.pdf (accessed on 1 August 2024).
- Gloor, G.B.; Wu, J.R.; Pawlowsky-Glahn, V.; Egozcue, J.J. It’s all relative: Analyzing microbiome data as compositions. Ann. Epidemiol. 2016, 26, 322–329. [Google Scholar] [CrossRef] [PubMed]
- Blei, D.M.; Ng, A.Y.; Jordan, M.I. Latent dirichlet allocation. J. Mach. Learn. Res. 2003, 3, 993–1022. [Google Scholar]
- Wang, C.; Yang, Y.; Cai, Q.; Gao, Y.; Cai, H.; Wu, J.; Zheng, W.; Long, J.; Shu, X.O. Oral microbiome and ischemic stroke risk among elderly Chinese women. J. Oral Microbiol. 2023, 15, 2266655. [Google Scholar] [CrossRef] [PubMed]
- Hosoda, S.; Nishijima, S.; Fukunaga, T.; Hattori, M.; Hamada, M. Revealing the microbial assemblage structure in the human gut microbiome using latent Dirichlet allocation. Microbiome 2020, 8, 95. [Google Scholar] [CrossRef]
- Deek, R.A.; Li, H. A Zero-Inflated Latent Dirichlet Allocation Model for Microbiome Studies. Front. Genet. 2020, 11, 602594. [Google Scholar] [CrossRef]
- Breuninger, T.A.; Wawro, N.; Breuninger, J.; Reitmeier, S.; Clavel, T.; Six-Merker, J.; Pestoni, G.; Rohrmann, S.; Rathmann, W.; Peters, A.; et al. Associations between habitual diet, metabolic disease, and the gut microbiota using latent Dirichlet allocation. Microbiome 2021, 9, 61. [Google Scholar] [CrossRef] [PubMed]
- Xu, S.; Zhan, L.; Tang, W.; Wang, Q.; Dai, Z.; Zhou, L.; Feng, T.; Chen, M.; Wu, T.; Hu, E.; et al. MicrobiotaProcess: A comprehensive R package for deep mining microbiome. Innovation 2023, 4, 100388. [Google Scholar] [CrossRef]
- Martins, D.; Silva, C.; Ferreira, A.C.; Dourado, S.; Albuquerque, A.; Saraiva, F.; Batista, A.B.; Castro, P.; Leite-Moreira, A.; Barros, A.S.; et al. Unravelling the Gut Microbiome Role in Cardiovascular Disease: A Systematic Review and a Meta-Analysis. Biomolecules 2024, 14, 731. [Google Scholar] [CrossRef]
- Tiso, M.; Schechter, A.N. Nitrate reduction to nitrite, nitric oxide and ammonia by gut bacteria under physiological conditions. PLoS ONE 2015, 10, e0119712. [Google Scholar] [CrossRef]
- Habermeyer, M.; Roth, A.; Guth, S.; Diel, P.; Engel, K.H.; Epe, B.; Furst, P.; Heinz, V.; Humpf, H.U.; Joost, H.G.; et al. Nitrate and nitrite in the diet: How to assess their benefit and risk for human health. Mol. Nutr. Food Res. 2015, 59, 106–128. [Google Scholar] [CrossRef] [PubMed]
- Wang, C.; Yang, Y.; Xu, W.; Yu, D.; Wu, J.; Cai, Q.; Long, J.; Zheng, W.; Shu, X.O. Legume Consumption and Gut Microbiome in Elderly Chinese Men and Women. J. Nutr. 2021, 151, 2399–2408. [Google Scholar] [CrossRef]
- Goldberg, M.R.; Mor, H.; Magid Neriya, D.; Magzal, F.; Muller, E.; Appel, M.Y.; Nachshon, L.; Borenstein, E.; Tamir, S.; Louzoun, Y.; et al. Microbial signature in IgE-mediated food allergies. Genome Med. 2020, 12, 92. [Google Scholar] [CrossRef]
- Kovatcheva-Datchary, P.; Nilsson, A.; Akrami, R.; Lee, Y.S.; De Vadder, F.; Arora, T.; Hallen, A.; Martens, E.; Bjorck, I.; Backhed, F. Dietary Fiber-Induced Improvement in Glucose Metabolism Is Associated with Increased Abundance of Prevotella. Cell Metab. 2015, 22, 971–982. [Google Scholar] [CrossRef]
- Asnicar, F.; Berry, S.E.; Valdes, A.M.; Nguyen, L.H.; Piccinno, G.; Drew, D.A.; Leeming, E.; Gibson, R.; Le Roy, C.; Khatib, H.A.; et al. Microbiome connections with host metabolism and habitual diet from 1098 deeply phenotyped individuals. Nat. Med. 2021, 27, 321–332. [Google Scholar] [CrossRef] [PubMed]
- Larsen, J.M. The immune response to Prevotella bacteria in chronic inflammatory disease. Immunology 2017, 151, 363–374. [Google Scholar] [CrossRef] [PubMed]
- Yan, H.; Chen, Y.; Zhu, H.; Huang, W.H.; Cai, X.H.; Li, D.; Lv, Y.J.; Si, Z.; Zhou, H.H.; Luo, F.Y.; et al. The Relationship among Intestinal Bacteria, Vitamin K and Response of Vitamin K Antagonist: A Review of Evidence and Potential Mechanism. Front. Med. 2022, 9, 829304. [Google Scholar] [CrossRef]
- Fenn, K.; Strandwitz, P.; Stewart, E.J.; Dimise, E.; Rubin, S.; Gurubacharya, S.; Clardy, J.; Lewis, K. Quinones are growth factors for the human gut microbiota. Microbiome 2017, 5, 161. [Google Scholar] [CrossRef]
- Sokol, H.; Pigneur, B.; Watterlot, L.; Lakhdari, O.; Bermudez-Humaran, L.G.; Gratadoux, J.J.; Blugeon, S.; Bridonneau, C.; Furet, J.P.; Corthier, G.; et al. Faecalibacterium prausnitzii is an anti-inflammatory commensal bacterium identified by gut microbiota analysis of Crohn disease patients. Proc. Natl. Acad. Sci. USA 2008, 105, 16731–16736. [Google Scholar] [CrossRef] [PubMed]
- Miquel, S.; Leclerc, M.; Martin, R.; Chain, F.; Lenoir, M.; Raguideau, S.; Hudault, S.; Bridonneau, C.; Northen, T.; Bowen, B.; et al. Identification of metabolic signatures linked to anti-inflammatory effects of Faecalibacterium prausnitzii. mBio 2015, 6, e00300-15. [Google Scholar] [CrossRef] [PubMed]
- Parsaei, M.; Sarafraz, N.; Moaddab, S.Y.; Ebrahimzadeh Leylabadlo, H. The importance of Faecalibacterium prausnitzii in human health and diseases. New Microbes New Infect. 2021, 43, 100928. [Google Scholar] [CrossRef] [PubMed]
- Hamer, H.M.; Jonkers, D.; Venema, K.; Vanhoutvin, S.; Troost, F.J.; Brummer, R.J. Review article: The role of butyrate on colonic function. Aliment. Pharmacol. Ther. 2008, 27, 104–119. [Google Scholar] [CrossRef]
- Canani, R.B.; Costanzo, M.D.; Leone, L.; Pedata, M.; Meli, R.; Calignano, A. Potential beneficial effects of butyrate in intestinal and extraintestinal diseases. World J. Gastroenterol. 2011, 17, 1519–1528. [Google Scholar] [CrossRef]

| Control | Peanut Intervention | p for Intervention vs. Control | |
|---|---|---|---|
| n = 43 | n = 35 | ||
| Mean ± SD | Mean ± SD | ||
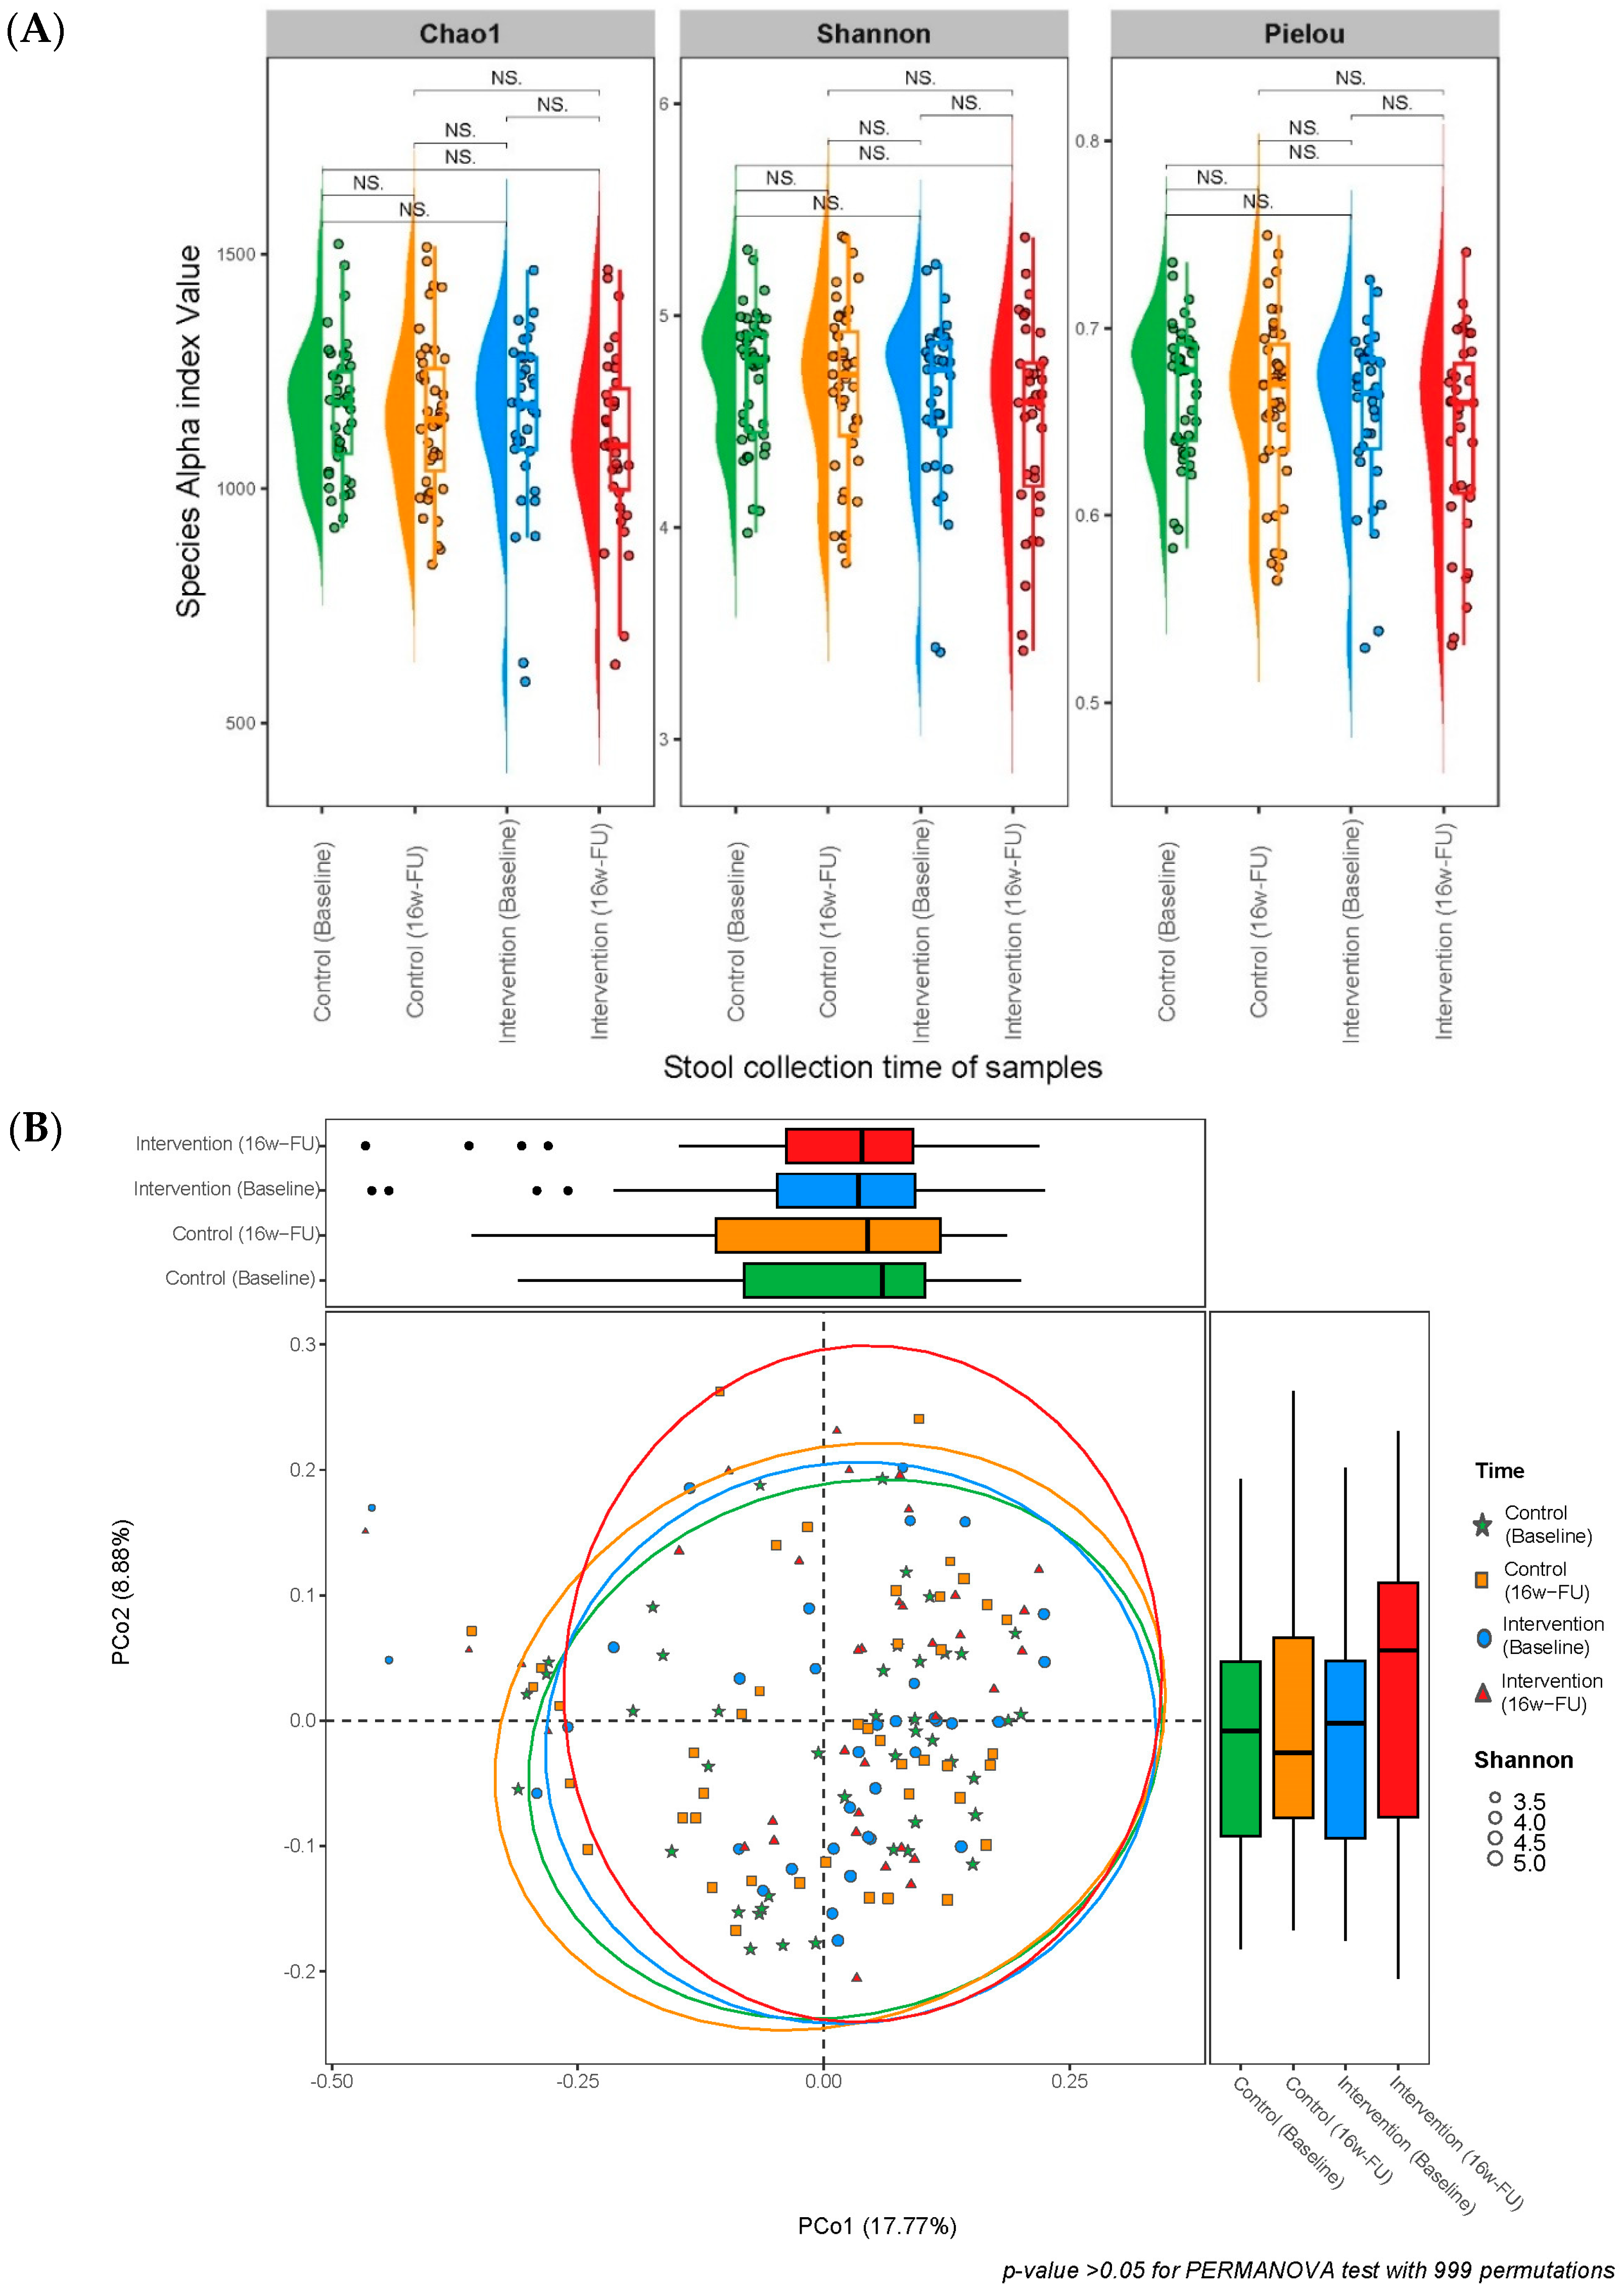
| Alpha diversity | |||
| Chao1 index | |||
| Species Chao1 index at baseline | 1167 ± 131 | 1146 ± 190 | 0.960 |
| Species Chao1 index at 16w-FU | 1152 ± 166 | 1100 ± 190 | 0.263 |
| p for baseline vs. FU | 0.592 | 0.145 | |
| Pathways Chao1 index at baseline | 381 ± 35 | 378 ± 40 | 0.872 |
| Pathways Chao1 index at 16w-FU | 379 ± 39 | 382 ± 30 | 0.924 |
| p for baseline vs. FU | 0.938 | 0.907 | |
| Shannon index | |||
| Species Shannon index at baseline | 4.708 ± 0.316 | 4.613 ± 0.418 | 0.363 |
| Species Shannon index at 16w-FU | 4.656 ± 0.405 | 4.509 ± 0.473 | 0.179 |
| p for baseline vs. FU | 0.547 | 0.256 | |
| Pathways Shannon index at baseline | 5.185 ± 0.159 | 5.168 ± 0.138 | 0.697 |
| Pathways Shannon index at 16w-FU | 5.194 ± 0.166 | 5.175 ± 0.160 | 0.617 |
| p for baseline vs. FU | 0.898 | 0.879 | |
| Pielou’s evenness | |||
| Species Pielou index at baseline | 0.667 ± 0.036 | 0.655 ± 0.045 | 0.303 |
| Species Pielou index at 16w-FU | 0.661 ± 0.046 | 0.644 ± 0.053 | 0.233 |
| p for baseline vs. FU | 0.530 | 0.427 | |
| Pathways Pielou index at baseline | 0.873 ± 0.019 | 0.872 ± 0.0166 | 0.976 |
| Pathways Pielou index at 16w-FU | 0.876 ± 0.020 | 0.871 ± 0.021 | 0.152 |
| p for baseline vs. FU | 0.497 | 0.462 | |
| Stability (1 − Intraindividual difference) a | |||
| Species stability | 0.575 ± 0.122 | 0.600 ± 0.103 | 0.435 |
| Pathways stability | 0.899 ± 0.045 | 0.890 ± 0.049 | 0.289 |
| Variable | Species | Pathways | ||||
|---|---|---|---|---|---|---|
| β | SE | p | β | SE | p | |
| Alpha diversity | ||||||
| Chao1 index | −0.024 | 0.041 | 0.555 | 0.037 | 0.036 | 0.307 |
| Shannon index | −0.008 | 0.027 | 0.778 | −0.001 | 0.010 | 0.906 |
| Pielou index | −0.004 | 0.023 | 0.846 | −0.008 | 0.008 | 0.356 |
| Beta diversity | ||||||
| Bray–Curtis distance | −0.023 | 0.018 | 0.203 | 0.011 | 0.007 | 0.142 |
| Jaccard Index distance | −0.021 | 0.018 | 0.229 | 0.017 | 0.011 | 0.135 |
| Overall stability | 0.105 | 0.100 | 0.294 | −0.112 | 0.093 | 0.229 |
| Microbial Taxa | Average RA, Median (%)|Pre (%) | β (SE) | p | FDR | |
|---|---|---|---|---|---|
| Control | Peanut Intervention | ||||
| (n = 43) | (n = 35) | ||||
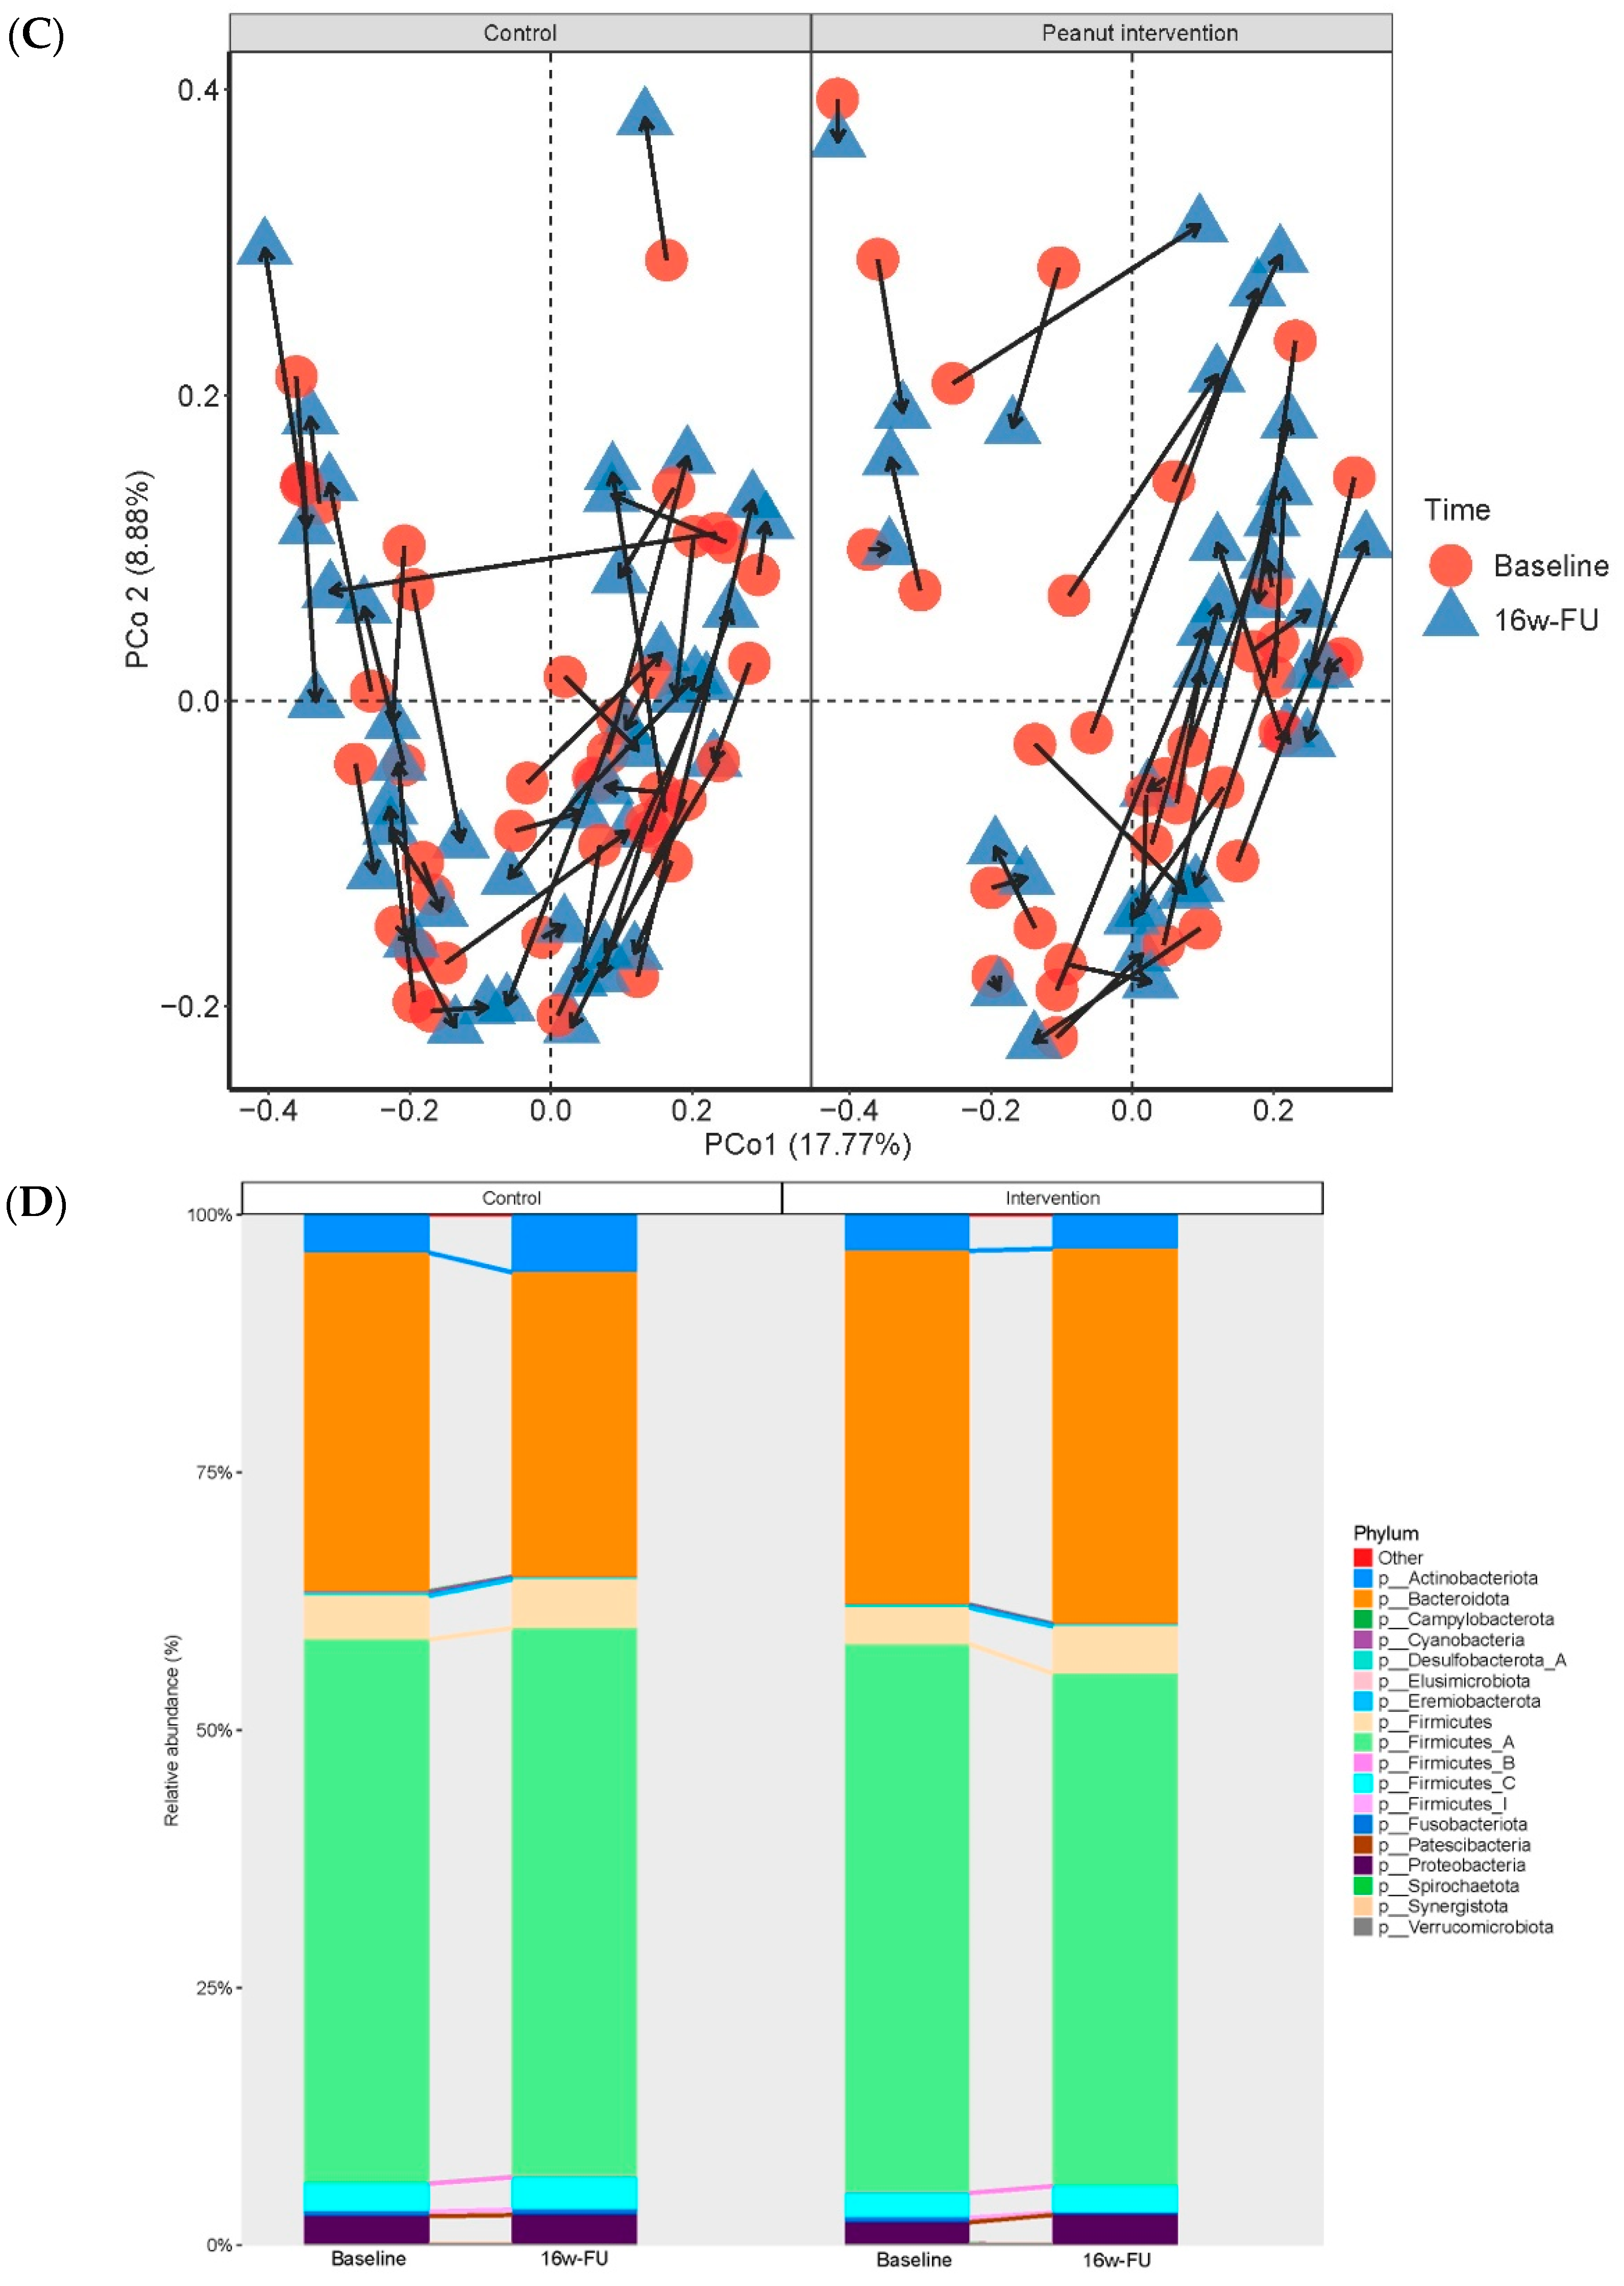
| Phylum Actinobacteriota | 2.8|100 | 2.3|100 | −0.915 (0.315) | 0.004 | 0.035 |
| Class Coriobacteriia | 2.1|100 | 1.8|100 | −1.041 (0.222) | 6.58 × 10⁻⁶ | 9.22 × 10⁻⁵ |
| Order Coriobacteriales | 2.1|100 | 1.8|100 | −0.991 (0.243) | 7.56 × 10⁻⁵ | 0.003 |
| Phylum Firmicutes | 3.3|100 | 2.8|100 | −0.685 (0.242) | 0.005 | 0.035 |
| Class Bacilli | 3.3|100 | 2.8|100 | −0.690 (0.228) | 0.003 | 0.020 |
| Order Erysipelotrichales | 1.77|100 | 1.6|100 | −0.799 (0.243) | 1.25 × 10⁻³ | 0.023 |
| Phylum Firmicutes A | 54.4|100 | 50.0|100 | −0.314 (0.137) | 0.024 | 0.065 |
| Class Clostridia | 54.4|100 | 50.0|100 | −0.318 (0.126) | 0.012 | 0.053 |
| Phylum Proteobacteria | 1.4|100 | 1.3|100 | −0.814 (0.341) | 0.018 | 0.065 |
| Class Gammaproteobacteria | 1.4|100 | 1.3|100 | −0.861 (0.350) | 0.015 | 0.053 |
| Phylum Synergistota | 1.18 × 10⁻³|57.0 | 1.29 × 10⁻³|57.1 | −0.762 (0.336) | 0.025 | 0.065 |
| Class Synergistia | 1.18 × 10⁻³|57.0 | 1.29 × 10⁻³|57.1 | −0.769 (0.336) | 0.023 | 0.066 |
| Subgroup and Top 5 Taxa | β (SE) | p | FDR |
|---|---|---|---|
| Subgroup1 | −4.633 (1.415) | 1.33 × 10⁻³ | 0.020 |
| Species MGYG-HGUT-00200 (53.34%) | |||
| Species Faecalicatena faecis (11.75%) | |||
| Species Anaerostipes hadrus (2.94%) | |||
| Species Blautia A sp900066165 (2.56%) | |||
| Species MGYG-HGUT-02772 (1.62%) | |||
| Subgroup 7 | −6.125 (1.804) | 8.85 × 10⁻⁴ | 0.020 |
| Species Roseburia inulinivorans (24.12%) | |||
| Species Bacteroides B dorei (4.33%) | |||
| Species Faecalicatena torques (3.93%) | |||
| Species Holdemanella sp002299315 (3.71%) | |||
| Species Dorea longicatena B (3.34%) | |||
| Subgroup 15 | −2.838 (1.085) | 9.84 × 10⁻³ | 0.074 |
| Species Bifidobacterium pseudocatenulatum (66.15%) | |||
| Species Anaerostipes hadrus (6.14%) | |||
| Species Fusicatenibacter saccharivorans (3.62%) | |||
| Species Dorea longicatena B (3.12%) | |||
| Species Faecalibacterium prausnitzii D (1.80%) | |||
| Subgroup 21 | −4.664 (1.351) | 7.23 × 10⁻⁴ | 0.020 |
| Species Escherichia coli D (63.50%) | |||
| Species Escherichia fergusonii (6.90%) | |||
| Species Escherichia sp000208585 (3.76%) | |||
| Species Bacteroides stercoris (2.37%) | |||
| Species Lachnospira rogosae (1.95%) | |||
| Subgroup 24 | −4.910 (1.733) | 5.26 × 10⁻³ | 0.059 |
| Species Ruminococcus D bicirculans (26.69%) | |||
| Species Faecalibacterium prausnitzii D (11.07%) | |||
| Species Fusicatenibacter saccharivorans (10.02%) | |||
| Species Blautia A sp900066165 (4.28%) | |||
| Species Bacteroides stercoris (3.45%) | |||
| Subgroup 35 | −4.001 (1.450) | 6.56 × 10⁻³ | 0.059 |
| Species Holdemanella biformis (30.75%) | |||
| Species Blautia A wexlerae (8.45%) | |||
| Species Holdemanella sp002299315 (3.05%) | |||
| Species Dorea formicigenerans (2.76%) | |||
| Species Dorea longicatena B (2.51%) |
| Microbial Metabolic Pathways | Average RA, Median|Pre (%) | β (SE) | p | FDR | ||
|---|---|---|---|---|---|---|
| Control | Intervention | |||||
| (n = 43) | (n = 35) | |||||
| NAD-BIOSYNTHESIS-II | NAD salvage pathway III (to nicotinamide riboside) | 0.0135|95.3 | 0.0106|94.3 | −1.279 (0.35) | 3.52 × 10⁻⁴ | 0.017 |
| P461-PWY | Hexitol fermentation to lactate, formate, ethanol and acetate | 0.0895|100 | 0.0801|100 | −0.507 (0.141) | 4.47 × 10⁻⁴ | 0.018 |
| P4-PWY | Superpathway of L-lysine, L-threonine and L-methionine biosynthesis I | 0.0611|100 | 0.0578|97.1 | −0.757 (0.184) | 6.63 × 10⁻⁵ | 0.012 |
| PWY0-301 | L-ascorbate degradation I (bacterial, anaerobic) | 0.0149|94.2 | 0.0189|94.3 | −1.009 (0.361) | 0.006 | 0.087 |
| PWY0-781 | Aspartate superpathway | 0.0644|100 | 0.0609|97.1 | −0.752 (0.183) | 6.54 × 10⁻⁵ | 0.012 |
| PWY-5675 | Nitrate reduction V (assimilatory) | 0.0107|89.5 | 0.0157|92.9 | −1.27 (0.389) | 1.35 × 10⁻³ | 0.028 |
| PWY-5705 | Allantoin degradation to glyoxylate III | 0.0016|57 | 0.0017|60 | −1.454 (0.481) | 0.003 | 0.050 |
| PWY-5723 | Rubisco shunt | 0.0251|96.5 | 0.0258|94.3 | −1.225 (0.37) | 1.18 × 10⁻³ | 0.028 |
| PWY-5837 | 2-carboxy-1,4-naphthoquinol biosynthesis | 0.0241|96.5 | 0.0207|100 | −0.824 (0.233) | 5.31 × 10⁻⁴ | 0.019 |
| PWY-5838 | Superpathway of menaquinol-8 biosynthesis I | 0.0594|96.5 | 0.0548|100 | −0.689 (0.183) | 2.49 × 10⁻⁴ | 0.017 |
| PWY-5840 | Superpathway of menaquinol-7 biosynthesis | 0.0506|96.5 | 0.0472|98.6 | −0.737 (0.233) | 0.002 | 0.037 |
| PWY-5845 | Superpathway of menaquinol-9 biosynthesis | 0.0439|96.5 | 0.0406|98.6 | −0.639 (0.194) | 1.25 × 10⁻³ | 0.028 |
| PWY-5861 | Superpathway of demethylmenaquinol-8 biosynthesis I | 0.0413|96.5 | 0.0378|100 | −0.739 (0.196) | 2.34 × 10⁻⁴ | 0.017 |
| PWY-5862 | Superpathway of demethylmenaquinol-9 biosynthesis | 0.0309|96.5 | 0.028|98.6 | −0.679 (0.204) | 1.09 × 10⁻³ | 0.028 |
| PWY-5897 | Superpathway of menaquinol-11 biosynthesis | 0.0594|96.5 | 0.0548|100 | −0.704 (0.193) | 3.62 × 10⁻⁴ | 0.017 |
| PWY-5898 | Superpathway of menaquinol-12 biosynthesis | 0.0594|96.5 | 0.0548|100 | −0.704 (0.193) | 3.62 × 10⁻⁴ | 0.017 |
| PWY-5899 | Superpathway of menaquinol-13 biosynthesis | 0.0594|96.5 | 0.0548|100 | −0.704 (0.193) | 3.62 × 10⁻⁴ | 0.017 |
| PWY-5913 | Partial TCA cycle (obligate autotrophs) | 0.0726|100 | 0.0604|100 | −0.639 (0.212) | 0.003 | 0.050 |
| PWY-5918 | Superpathway of heme b biosynthesis from glutamate | 0.0248|98.8 | 0.027|97.1 | −0.677 (0.234) | 0.004 | 0.070 |
| PWY-6285 | Superpathway of fatty acid biosynthesis (E. coli) | 0.0615|89.5 | 0.0738|95.7 | −0.691 (0.211) | 1.32 × 10⁻³ | 0.028 |
| PWY-6531 | Mannitol cycle | 0.0194|97.7 | 0.0197|97.1 | −1.014 (0.3) | 9.40 × 10⁻⁴ | 0.028 |
| PWY66-389 | Phytol degradation | 0.0071|87.2 | 0.0073|91.4 | −1.825 (0.559) | 1.36 × 10⁻³ | 0.028 |
| PWY-6961 | L-ascorbate degradation II (bacterial, aerobic) | 0.0137|96.5 | 0.0169|94.3 | −0.937 (0.310) | 0.003 | 0.050 |
| PWY-7385 | 1,3-propanediol biosynthesis (engineered) | 0.0095|77.9 | 0.0101|74.3 | −1.601 (0.561) | 0.005 | 0.076 |
| Median of Stability | |||||
|---|---|---|---|---|---|
| Control (n = 43) | Intervention (n = 35) | β (SE) | p | FDR | |
| Microbial taxa | |||||
| Phylum Bacteroidota | |||||
| Species MGYG-HGUT-00855 | 0.763 | 0.882 | 0.954 (0.323) | 0.003 | 0.084 |
| Species MGYG-HGUT-04491 | 0.625 | 0.786 | 0.961 (0.307) | 0.002 | 0.062 |
| Species Alistipes putredinis | 0.768 | 0.715 | −1.065 (0.299) | 3.67 × 10⁻⁴ | 0.029 |
| Phylum Firmicutes A | |||||
| Species MGYG-HGUT-04581 | 0.814 | 0.840 | 1.145 (0.306) | 1.81 × 10⁻⁴ | 0.029 |
| Species MGYG-HGUT-02992 | 0.721 | 0.821 | 0.883 (0.265) | 8.49 × 10⁻⁴ | 0.048 |
| Species Oscillibacter sp900066435 | 0.637 | 0.724 | 0.986 (0.273) | 2.99 × 10⁻³ | 0.029 |
| Species Faecalibacterium prausnitzii F | 0.752 | 0.845 | 0.901 (0.274) | 1.02 × 10⁻³ | 0.048 |
| Species Faecalibacterium prausnitzii H | 0.793 | 0.821 | 0.686 (0.226) | 0.002 | 0.070 |
| Species MGYG-HGUT-00512 | 0.695 | 0.831 | 0.856 (0.264) | 1.18 × 10⁻³ | 0.048 |
| Species MGYG-HGUT-02809 | 0.750 | 0.823 | 0.933 (0.285) | 1.05 × 10⁻³ | 0.048 |
| Species MGYG-HGUT-03166 | 0.736 | 0.855 | 0.986 (0.264) | 1.83 × 10⁻⁴ | 0.029 |
| Species MGYG-HGUT-03291 | 0.778 | 0.852 | 0.795 (0.257) | 0.002 | 0.063 |
| Metabolic pathways | |||||
| PWY-2942: L-lysine biosynthesis III | 0.968 | 0.936 | −0.563 (0.172) | 1.03 × 10⁻³ | 0.078 |
| PWY-5675: nitrate reduction V (assimilatory) | 0.587 | 0.399 | 1.040 (0.306) | 6.73 × 10⁻⁴ | 0.068 |
| PWY-6595: superpathway of guanosine nucleotides degradation (plants) | 0.767 | 0.645 | −0.982 (0.287) | 6.27 × 10⁻⁴ | 0.068 |
| PWY-6607: guanosine nucleotides degradation I | 0.759 | 0.643 | −0.976 (0.287) | 6.77 × 10⁻⁴ | 0.068 |
Disclaimer/Publisher’s Note: The statements, opinions and data contained in all publications are solely those of the individual author(s) and contributor(s) and not of MDPI and/or the editor(s). MDPI and/or the editor(s) disclaim responsibility for any injury to people or property resulting from any ideas, methods, instructions or products referred to in the content. |
© 2024 by the authors. Licensee MDPI, Basel, Switzerland. This article is an open access article distributed under the terms and conditions of the Creative Commons Attribution (CC BY) license (https://creativecommons.org/licenses/by/4.0/).
Share and Cite
Nguyen, S.M.; Tran, T.D.C.; Tran, T.M.; Wang, C.; Wu, J.; Cai, Q.; Ye, F.; Shu, X.-O. Influence of Peanut Consumption on the Gut Microbiome: A Randomized Clinical Trial. Nutrients 2024, 16, 3313. https://doi.org/10.3390/nu16193313
Nguyen SM, Tran TDC, Tran TM, Wang C, Wu J, Cai Q, Ye F, Shu X-O. Influence of Peanut Consumption on the Gut Microbiome: A Randomized Clinical Trial. Nutrients. 2024; 16(19):3313. https://doi.org/10.3390/nu16193313
Chicago/Turabian StyleNguyen, Sang Minh, Thi Du Chi Tran, Thi Mo Tran, Cong Wang, Jie Wu, Qiuyin Cai, Fei Ye, and Xiao-Ou Shu. 2024. "Influence of Peanut Consumption on the Gut Microbiome: A Randomized Clinical Trial" Nutrients 16, no. 19: 3313. https://doi.org/10.3390/nu16193313