Abstract
Background/Objectives. The comorbidity of osteoarthritis and type 2 diabetes mellitus poses a complex clinical challenge, complicating patient management due to overlapping pathophysiological mechanisms. This research aims to analyze the exacerbation of clinical symptoms and biochemical markers in patients with OA and T2DM compared to those with OA alone. Methods. We employed various assessment methods to evaluate inflammation, oxidative stress, and glycemic control in both cohorts. This study includes the administration of alpha-lipoic acid (ALA) to patients with comorbid OA and T2DM, monitoring its effects on joint function, inflammatory markers, oxidative stress levels, and glycemic control. Results. The findings indicate that T2DM significantly worsens clinical symptoms and biochemical markers in OA patients. Those with both conditions exhibited elevated indicators of inflammation and oxidative stress compared to OA-only patients. Additionally, correlations among metabolic, psychological, and inflammatory factors were identified. Body mass index emerged as a potential predictor for the deterioration of evaluated parameters. The analysis revealed that ALA administration led to statistically significant improvements in WOMAC pain scores, the Lequesne Algofunctional Index, and the AIMS-P compared to the control group. Conclusions. Further research into ALA’s effects on OA progression in patients with comorbidities is essential for developing personalized treatment approaches.
1. Introduction
With a global prevalence of nearly 23%, osteoarthritis (OA) imposes a significant disease burden, exacerbated by the lack of effective disease-modifying treatments [1,2]. Affecting over 240 million people globally, OA is a major contributor to activity limitation among adults. The pathogenesis of OA remains poorly understood, leading to a lack of effective clinical treatments [3]. Disruptions in glucose metabolism have been shown to cause chondrocyte hypertrophy and extracellular matrix degradation, playing a significant role in the onset and progression of the disease [4]. OA is a degenerative joint disorder that primarily targets the articular cartilage and is influenced by factors such as trauma, metabolic processes, and comorbidities [5]. The ensuing chronic inflammation affects not only the cartilage, but also adjacent tissues, further impairing function and exacerbating OA symptoms [5]. The prevalence of osteoarthritis rises with age, and its histological and pathophysiological characteristics indicate an underlying inflammatory process [6]. OA and diabetes mellitus (DM) are both prevalent chronic disorders with long-term detrimental effects. The pathophysiology of OA is significantly influenced by DM and its associated factors, including hyperglycemia [7].
DM is a significant chronic condition characterized by inadequate insulin production or the body’s inability to effectively use insulin, leading to a long-term metabolic disorder [8]. Currently, it affects approximately 537 million adults worldwide, or 10.5% of those aged from 20 to 79. Projections indicate that this number will rise to 643 million by 2030 and reach 783 million by 2045 [9]. Several risk factors, such as severe obesity, a family history of diabetes, certain ethnic backgrounds, maternal diabetes or gestational diabetes, and being female, contribute to the earlier onset of type 2 diabetes mellitus (T2DM) [8,10]. Pathogenetically, the primary mechanism involves impaired insulin secretion, coupled with insulin resistance related to ectopic fat accumulation [11,12]. The comorbidity of T2DM and OA is quite common, given that both conditions are prevalent metabolic diseases sharing risk factors such as obesity and aging. Despite this frequent coexistence, there is no clear consensus regarding the direct impact of T2DM on the development and progression of OA. Research findings have been inconsistent, with some studies demonstrating a significant influence of DM on OA, while others have found no substantial link between the two conditions [13,14]. Alpha-lipoic acid (ALA) is used in the comprehensive management of diabetes mellitus due to its antioxidant and pro-oxidant properties that affect insulin sensitivity and secretion [15]. It is widely prescribed for diabetic polyneuropathy, where it enhances nerve conduction and alleviates symptoms. Furthermore, ALA is also utilized in the treatment of other insulin resistance conditions, such as metabolic syndrome, polycystic ovary syndrome, and obesity [16,17,18]. Studies show that ALA significantly benefits the management of osteoarthritis in patients with DM [19,20,21]. The use of ALA for managing patients with comorbid osteoarthritis and type 2 diabetes mellitus requires further exploration. Continued research is essential to elucidate its effectiveness and potential advantages in this particular cohort.
2. Materials and Methods
2.1. Sample Collection
Participants for this study were recruited from the Ternopil City Communal Institution “Center for Primary Medical and Sanitary Care” between 2020 and 2023. The research adhered to the core principles set forth in the Council of Europe’s Convention on Human Rights and Biomedicine and was conducted in accordance with the ethical guidelines specified in the Declaration of Helsinki by the World Medical Association, including any subsequent revisions. Additionally, the study complied with Ministry of Health of Ukraine Order No. 690 dated 23 September 2009. Informed consent was obtained from all participants prior to their involvement. The study received ethical approval from the Bioethics Committee of I. Horbachevsky Ternopil National Medical University Ministry of Health of Ukraine (Protocol No. 75, 1 November 2023).
The study cohort comprised individuals of Ukrainian ethnicity with European ancestry aged between 29 and 78 years.
The study involved 123 patients who were categorized according to the specific pathology under investigation and the presence of comorbidities. The first group consisted of 52 patients diagnosed with OA, while the second group comprised 71 patients with concurrent OA and T2DM. No notable variations in gender, age, or the duration of OA were detected in the study groups (Table 1).

Table 1.
Age, gender characteristics, and duration of OA in patients included in the study.
The cohort of patients with OA and T2DM was subsequently divided according to the treatment regimen: one group without ALA (n = 37) and another group with ALA (n = 34). No significant differences in gender, age, duration of OA, or duration of T2DM were observed among the study groups (Table 2).
Table 2.
Age, gender characteristics, and duration of OA and T2DM in patients included in the study based on the utilization of ALA in treatment.
The group comprising patients with comorbid osteoarthritis and type 2 diabetes was segmented into two subgroups to facilitate a more in-depth examination of the potential effects of alpha-lipoic acid on the investigated parameters.
The group not receiving ALA was treated according to standard protocols, which included a regimen of basic therapy medications, such as nonsteroidal anti-inflammatory drugs, chondroprotectors, and oral hypoglycemic agents (metformin). The group receiving ALA, in addition to the basic therapy regimen, was administered alpha-lipoic acid by oral administration at a dose of 600 mg once daily for 6 weeks. The levels of the assessed parameters were measured before treatment and after 6 weeks.
Inclusion criteria for the study encompassed individuals of both genders who had a confirmed diagnosis of hip and knee osteoarthritis (ICD-10 codes M16 and M17) and type 2 diabetes mellitus (ICD-10 code E11). Exclusion criteria included: type I diabetes mellitus; thyroid gland disorders, decompensated heart-lung diseases, acute myocardial infarction; stage II-III hypertension, arrhythmias, unstable ischemic heart disease, recent major surgery within the past month; stage III-V chronic kidney disease; use of systemic glucocorticosteroids; severe exhaustion, pregnancy, suspected malignant tumors, infectious and parasitic diseases, congenital anomalies and chromosomal disorders, bleeding tendencies, psychiatric and behavioral disorders, and refusal to participate in the study.
The diagnosis of OA was made based on international guidelines [22]. The assessment of the radiological stages of OA were classified according to the system developed by J.H. Kellgren and J.S. Lawrence, with magnetic resonance imaging (MRI) findings also incorporated into the analysis, and standardized clinical criteria. The diagnosis of T2DM was confirmed in accordance with international standards, based on elevated serum glucose levels and HbA1c values, in accordance with the guidelines set forth by the American Diabetes Association [23].
2.2. Laboratory and Clinical Data
In assessing joint status in individuals with OA, the Western Ontario and McMaster Universities Osteoarthritis Index (WOMAC) was utilized as a key evaluation tool [24]. To gauge the severity of OA within the study cohort, the Lequesne Algofunctional Index was applied [24]. Additionally, the Visual Analog Scale (VAS) was used to measure rest pain, movement pain, inflammation, and joint dysfunction [25]. The Arthritis Impact Measurement Scales (AIMS) were employed to assess the effect of arthritis on patients’ physical and emotional health, measuring multiple dimensions such as Physical Function (FF), Pain (P), Social Function (SF), Emotional Health (EH), and General Health Perception (GHP) [26].
Fasting blood glucose levels were measured using automated glucose oxidase methods, while C-peptide levels were analyzed via enzyme-linked immunosorbent assay (ELISA) (BIOSERV Diagnostics Gmbh (Rostock, Germany)). HOMA-IR was calculated from fasting insulin and glucose levels determined using a chemiluminescent immunoassay, and Hemoglobin A1c (HbA1c) levels were assessed using high-performance liquid chromatography (HPLC).
The Diabetes Distress Scale (DDS-17) was used to evaluate various dimensions of distress related to diabetes management, including emotional burden (DDS-17-EB), physician-related distress (DDS-17-PRD), regimen-related distress (DDS-17-RRD), interpersonal distress (DDS-17-ID), and Total DDS-17 score [27]. Additionally, the Problem Areas in Diabetes (PAID) scale assessed overall emotional distress associated with diabetes through a self-administered questionnaire [28].
Leukocytes, neutrophils, and lymphocytes were quantified using automated complete blood count (CBC) analyzers. The neutrophil-to-lymphocyte ratio (NLR) was calculated from these CBC results. C-Reactive Protein (CRP) levels were measured with ELISA (BIOSERV Diagnostics Gmbh (Germany)). Hydroxyproline and malonaldehyde (MA) were quantified using colorimetric assays and thiobarbituric acid reactive substances (TBARS) assays. Ceruloplasmin, α1-antitrypsin, and α2-Macroglobulin levels were determined using nephelometry or ELISA (BIOSERV Diagnostics Gmbh (Germany)), while kallikrein levels were assessed through enzyme immunoassays. Superoxide dismutase (SOD) and catalase activities were measured using colorimetric and spectrophotometric assays.
Serum IgA, IgM, IgG, and IgE levels were measured using standard immunoassays, including nephelometry for IgA, IgM, and IgG, and ELISA for IgE (BIOSERV Diagnostics Gmbh (Germany)). T-lymphocytes (CD3+, CD19−), T-helpers (CD4+, CD8−), T-cytotoxic cells (CD4−, CD8+), cytotoxic cells (CD3+, CD56+), NK cells (CD3−, CD56+), and B-lymphocytes (CD3−, CD19+) were quantified using flow cytometry. The immunoregulatory index was calculated based on the proportions of T-helpers, T-cytotoxic cells. Monocytes/macrophages (CD14) were also assessed via flow cytometry using CD14-specific antibodies.
The methodology for assessing the body mass index (BMI) involved calculating the ratio of weight in kilograms to the square of height in meters (kg/m2) for all participants, ensuring accurate measurements through standardized protocols for weight and height assessment.
2.3. Statistical Analysis
Patient demographics and clinical data were comprehensively analyzed and presented using descriptive statistics. The Shapiro–Wilk test was employed to evaluate the normality of data distribution. Given the non-normal distribution of the data, medians and interquartile ranges were calculated for all variables, and a significance level of p < 0.05 was used for hypothesis testing.
Differences between two independent groups were assessed using the Mann–Whitney U test, while the Kruskal–Wallis test was used for comparisons involving three or more groups, with Dunn’s multiple comparison test applied for pairwise differences in a post hoc analysis.
Spearman’s rank correlation coefficient was utilized to explore associations among continuous variables in the correlation matrix analysis.
Binary logistic regression was utilized to identify potential predictors linked to the comorbidity of OA and T2DM. The model quality analysis included the creation of an odds plot and the calculation of ROC metrics, such as the Area Under the ROC Curve (AUC) with a 95% confidence interval (CI), the Youden index (J) with its corresponding cutoff point, as well as sensitivity (Se) and specificity (Sp).
The Wilcoxon signed-rank test was utilized to assess the significance of differences within a group before and after treatment. To compare the differences between groups prior to treatment, the Mann–Whitney U test was employed. The Mann–Whitney U test was also applied to evaluate the differences between groups following treatment. The Difference-in-Differences (DiD) test was employed to assess the causal impact of the intervention by comparing outcome changes over time between the treatment and control groups.
Statistical analyses were performed using commercially available software packages, including IBM SPSS Statistics (version 25) and GraphPad Prism 10.1.1, Stata 16.
3. Results
3.1. Evaluation of Clinical, Biochemical, and Immunological Parameters in OA and OA + T2DM
Several of the examined indicators revealed statistically significant differences between the groups (Table 3). The OA + T2DM group presented with elevated levels in WOMAC stiffness, total WOMAC score, the Lequesne Algofunctional Index, VAS rest pain, VAS inflammation, VAS joint dysfunction, AIMS-FF, AIMS-SF, and AIMS-GHP (p < 0.05). These results indicate that the coexistence of T2DM with OA may intensify symptoms and contribute to more pronounced joint functional impairments.
Table 3.
Comparison of OA indicators between patients with OA and OA + T2DM.
A statistically significant elevation was observed in various indicators associated with the progression of type 2 diabetes among patients with comorbid OA and T2DM compared to those in the group with osteoarthritis. Specifically, the OA + T2DM group demonstrated higher levels in fasting blood glucose, C-peptide, HOMA-IR, HbA1c, DDS-17-EB, DDS-17-PRD, DDS-17-RRD, DDS-17-ID, total DDS-17 score, and PAID (p < 0.001) (Table 4).
Table 4.
Diabetes-related metabolic and psychological parameter comparisons between OA and OA + T2DM patients.
Statistically significant differences were observed in several biomarkers between the OA and OA + T2DM groups. Specifically, the OA + T2DM group had significantly higher levels of neutrophils, NLR, MA, ceruloplasmin, and catalase (p < 0.05) (Table 5). These findings indicate an exacerbating effect of comorbid type 2 diabetes mellitus on the deterioration of these parameters in osteoarthritis. The increased levels of inflammatory and oxidative stress markers suggest that the presence of T2DM may contribute to a more severe pathological profile and worsening of the clinical status in patients with OA.
Table 5.
Comparison of inflammatory and biochemical markers in patients with OA and OA + T2DM.
In the analysis of immunological parameters, significant differences were detected between the OA and OA + T2DM groups (Table 6). Serum IgA and IgE levels were notably higher in the OA + T2DM group (p < 0.05). Additionally, the Immunoregulatory Index was significantly elevated in the OA + T2DM group (p < 0.05). No significant differences were observed for IgM, IgG, T-Lymphocytes, T-Helpers, T-Cytotoxic Cells, Cytotoxic Cells, NK Cells, B-Lymphocytes, or Monocytes/Macrophages (p > 0.05).
Table 6.
Comparison of immunological markers in patients with OA and OA + T2DM.
An analysis of BMI was also conducted in the studied groups. In the cohort of patients with osteoarthritis, the BMI was determined to be 27.85 kg/m2 (26.76–29.14 kg/m2), while in the cohort of patients with comorbidities, the BMI was 29.22 kg/m2 (27.04–31.32 kg/m2). A statistically significant difference between these values was observed (p = 0.0064), suggesting a potential influence of increased body weight on the studied parameters, which necessitates further investigation.
3.2. Correlation Analysis of Data in Patients with OA and OA + T2DM
This section explores the correlations among various clinical parameters in OA patients without T2DM. Spearman’s rank correlation coefficient (r) was employed to assess the strength and direction of these relationships. The total WOMAC score exhibited positive and negative correlations with several parameters. These correlations included the Lequesne Algofunctional Index (r = 0.36, p = 0.009), AIMS-GHP (r = 0.64, p < 0.001), HOMA-IR (r = 0.37, p = 0.006), HbA1c (r = 0.31, p = 0.023), total DDS-17 score (r = 0.41, p = 0.002), SOD (r = −0.64, p < 0.001), MA (r = 0.35, p = 0.011), ceruloplasmin (r = 0.46, p = 0.001), IgE (r = 0.3, p = 0.032), and the Immunoregulatory Index (r = 0.4, p = 0.003). The Lequesne Algofunctional Index exhibited positive and negative correlations with PAID (r = 0.29, p = 0.037), SOD (r = −0.51, p < 0.001), catalase (r = −0.36, p = 0.009), and the Immunoregulatory Index (r = 0.39, p = 0.004). VAS inflammation showed positive and negative correlations with total DDS-17 score (r = 0.31, p = 0.027), catalase (r = −0.36, p = 0.009), and B-Lymphocytes (CD3−. CD19+) (r = 0.45, p < 0.001). AIMS-GHP displayed positive and negative correlations with HOMA-IR (r = 0.39, p = 0.004), HbA1c (r = 0.45, p < 0.001), total DDS-17 score (r = 0.34, p = 0.015), SOD (r = −0.58, p < 0.001), CRP (r = 0.33, p = 0.017), MA (r = 0.64, p < 0.001), ceruloplasmin (r = 0.52, p < 0.001), IgE (r = 0.58, p < 0.001), and the Immunoregulatory Index (r = 0.34, p = 0.015). HOMA-IR exhibited positive and negative correlations with total DDS-17 score (r = 0.47, p < 0.001), SOD (r = −0.39, p = 0.005), NLR (r = 0.34, p = 0.013), MA (r = 0.47, p < 0.001), ceruloplasmin (r = 0.5, p < 0.001), catalase (r = −0.3, p = 0.033), and B-Lymphocytes CD3−. CD19+ (r = 0.52, p < 0.001). HbA1c demonstrated positive correlations with SOD (r = −0.33, p = 0.019), CRP (r = 0.29, p = 0.04), MA (r = 0.33, p = 0.016), and IgE (r = 0.42, p = 0.002). Total DDS-17 score demonstrated positive and negative correlations with MA (r = 0.41, p = 0.002), ceruloplasmin (r = 0.53, p < 0.001), catalase (r = −0.38, p = 0.006), and B-Lymphocytes (CD3−. CD19+) (r = 0.35, p = 0.011). SOD showed positive and negative correlations with CRP (r = −0.27, p = 0.049), MA (r = −0.44, p < 0.001), ceruloplasmin (r = −0.45, p < 0.001), catalase (r = 0.38, p = 0.006), IgE (r = −0.32, p = 0.002), and the Immunoregulatory Index (r = −0.42, p < 0.001). NLR exhibited positive and negative correlations with CRP (r = 0.47, p < 0.001), MA (r = 0.4, p = 0.004), catalase (r = −0.38, p = 0.005), the Immunoregulatory Index (r = 0.54, p < 0.001), and B-Lymphocytes (CD3−. CD19+) (r = 0.35, p = 0.012). CRP showed positive and negative correlations with MA (r = 0.4, p = 0.034), catalase (r = −0.38, p < 0.001), the Immunoregulatory Index (r = 0.59, p < 0.001), and B-Lymphocytes (CD3−. CD19+) (r = 0.35, p = 0.011). MA demonstrated positive correlations with ceruloplasmin (r = 0.4, p = 0.004) and B-Lymphocytes (CD3−. CD19+) (r = 0.54, p < 0.001). Ceruloplasmin exhibited positive correlations with IgE (r = 0.29, p = 0.04) and B-Lymphocytes (CD3−. CD19+) (r = 0.34, p = 0.015). Catalase showed a positive correlation with the Immunoregulatory Index (r = −0.48, p < 0.001).
The subsequent section examines the correlations among various clinical parameters in OA patients with T2DM. Spearman’s rank correlation coefficient (r) was used to determine the magnitude and direction of these associations. Total WOMAC score demonstrated positive and negative correlations with the Lequesne Algofunctional Index (r = 0.66, p < 0.001), VAS movement pain (r = 0.25, p = 0.034), AIMS-FF (r = 0.49, p < 0.001), AIMS-GHP (r = 0.62, p < 0.001), HOMA-IR (r = 0.27, p = 0.024), HbA1c (r = 0.36, p = 0.002), total DDS-17 score (r = 0.44, p < 0.001), PAID (r = 0.51, p < 0.001), NLR (r = 0.51, p < 0.001), ceruloplasmin (r = 0.27, p = 0.024), catalase (r = −0.25, p = 0.033), IgE (r = 0.44, p < 0.001), and the Immunoregulatory Index (r = 0.51, p < 0.001). The Lequesne Algofunctional Index showed positive and negative correlations with VAS inflammation (r = 0.35, p = 0.003), AIMS-GHP (r = 0.6, p < 0.001), HbA1c (r = 0.41, p < 0.001.), total DDS-17 score (r = 0.37, p = 0.001), PAID (r = 0.37, p = 0.002), NLR (r = 0.6, p < 0.001), CRP (r = 0.24, p = 0.041), MA (r = 0.36, p = 0.003), ceruloplasmin (r = 0.24, p = 0.044), catalase (r = −0.24, p = 0.043), IgE (r = 0.46, p < 0.001), and the Immunoregulatory Index (r = 0.41, p < 0.001). VAS movement pain demonstrated positive and negative correlations with HbA1c (r = 0.43, p < 0.001), total DDS-17 score (r = 0.27, p = 0.022), NLR (r = 0.34, p = 0.004), and catalase (r = −0.39, p < 0.001). VAS inflammation showed positive and negative correlations with AIMS-GHP (r = 0.27, p = 0.022), HOMA-IR (r = 0.26, p = 0.029), HbA1c (r = 0.31, p = 0.008), total DDS-17 score (r = 0.43, p < 0.001), SOD (r = −0.41, p < 0.001), NLR (r = 0.24, p = 0.048), MA (r = 0.37, p = 0.002), ceruloplasmin (r = 0.42, p < 0.001), and IgE (r = 0.41, p < 0.001.). AIMS-FF demonstrated positive correlations with AIMS-GHP (r = 0.55, p < 0.001), HOMA-IR (r = 0.35, p = 0.003), PAID (r = 0.45, p < 0.001), CRP (r = 0.38, p = 0.001), and the Immunoregulatory Index (r = 0.54, p < 0.001). AIMS-GHP showed positive and negative correlations with HbA1c (r = 0.31, p = 0.009), total DDS-17 score (r = 0.35, p = 0.003), PAID (r = 0.56, p < 0.001), NLR (r = 0.43, p < 0.001), CRP (r = 0.33, p = 0.005), MA (r = 0.29, p = 0.013), ceruloplasmin (r = 0.31, p = 0.008), catalase (r = −0.24, p = 0.045), IgE (r = 0.31, p = 0.008), and the Immunoregulatory Index (r = 0.58, p < 0.001). HOMA-IR exhibited positive correlations with HbA1c (r = 0.29, p = 0.013), PAID (r = 0.24, p = 0.041), and MA (r = 0.28, p = 0.019). HbA1c demonstrated positive and negative correlations with total DDS-17 score (r = 0.37, p = 0.002), NLR (r = 0.38, p < 0.001), MA (r = 0.33, p = 0.005), catalase (r = −0.47, p < 0.001), and IgE (r = 0.52, p < 0.001). Total DDS-17 score showed positive and negative correlations with SOD (r = −0.27, p = 0.024), NLR (r = 0.41, p < 0.001), MA (r = 0.35, p = 0.003), ceruloplasmin (r = 0.5, p < 0.001), catalase (r = −0.37, p = 0.002), IgE (r = 0.36, p = 0.002), and the Immunoregulatory Index (r = 0.31, p = 0.01). PAID demonstrated positive correlations with NLR (r = 0.45, p < 0.001) and the Immunoregulatory Index (r = 0.27, p = 0.025). SOD exhibited positive correlations with MA (r = −0.26, p = 0.029), ceruloplasmin (r = −0.33, p = 0.005), and IgE (r = −0.24, p = 0.041). NLR demonstrated positive and negative correlations with MA (r = 0.28, p = 0.017), catalase (r = −0.41, p < 0.001), and IgE (r = 0.37, p = 0.001). CRP exhibited a positive correlation with the Immunoregulatory Index (r = 0.62, p < 0.001). MA showed positive correlations with ceruloplasmin (r = 0.31, p = 0.008), IgE (r = 0.27, p = 0.022). Ceruloplasmin demonstrated a negative correlation with catalase (r = −0.24, p = 0.04).
3.3. Comparative Analysis of Treatment Outcomes in Patients with OA and T2DM with and without ALA Supplementation
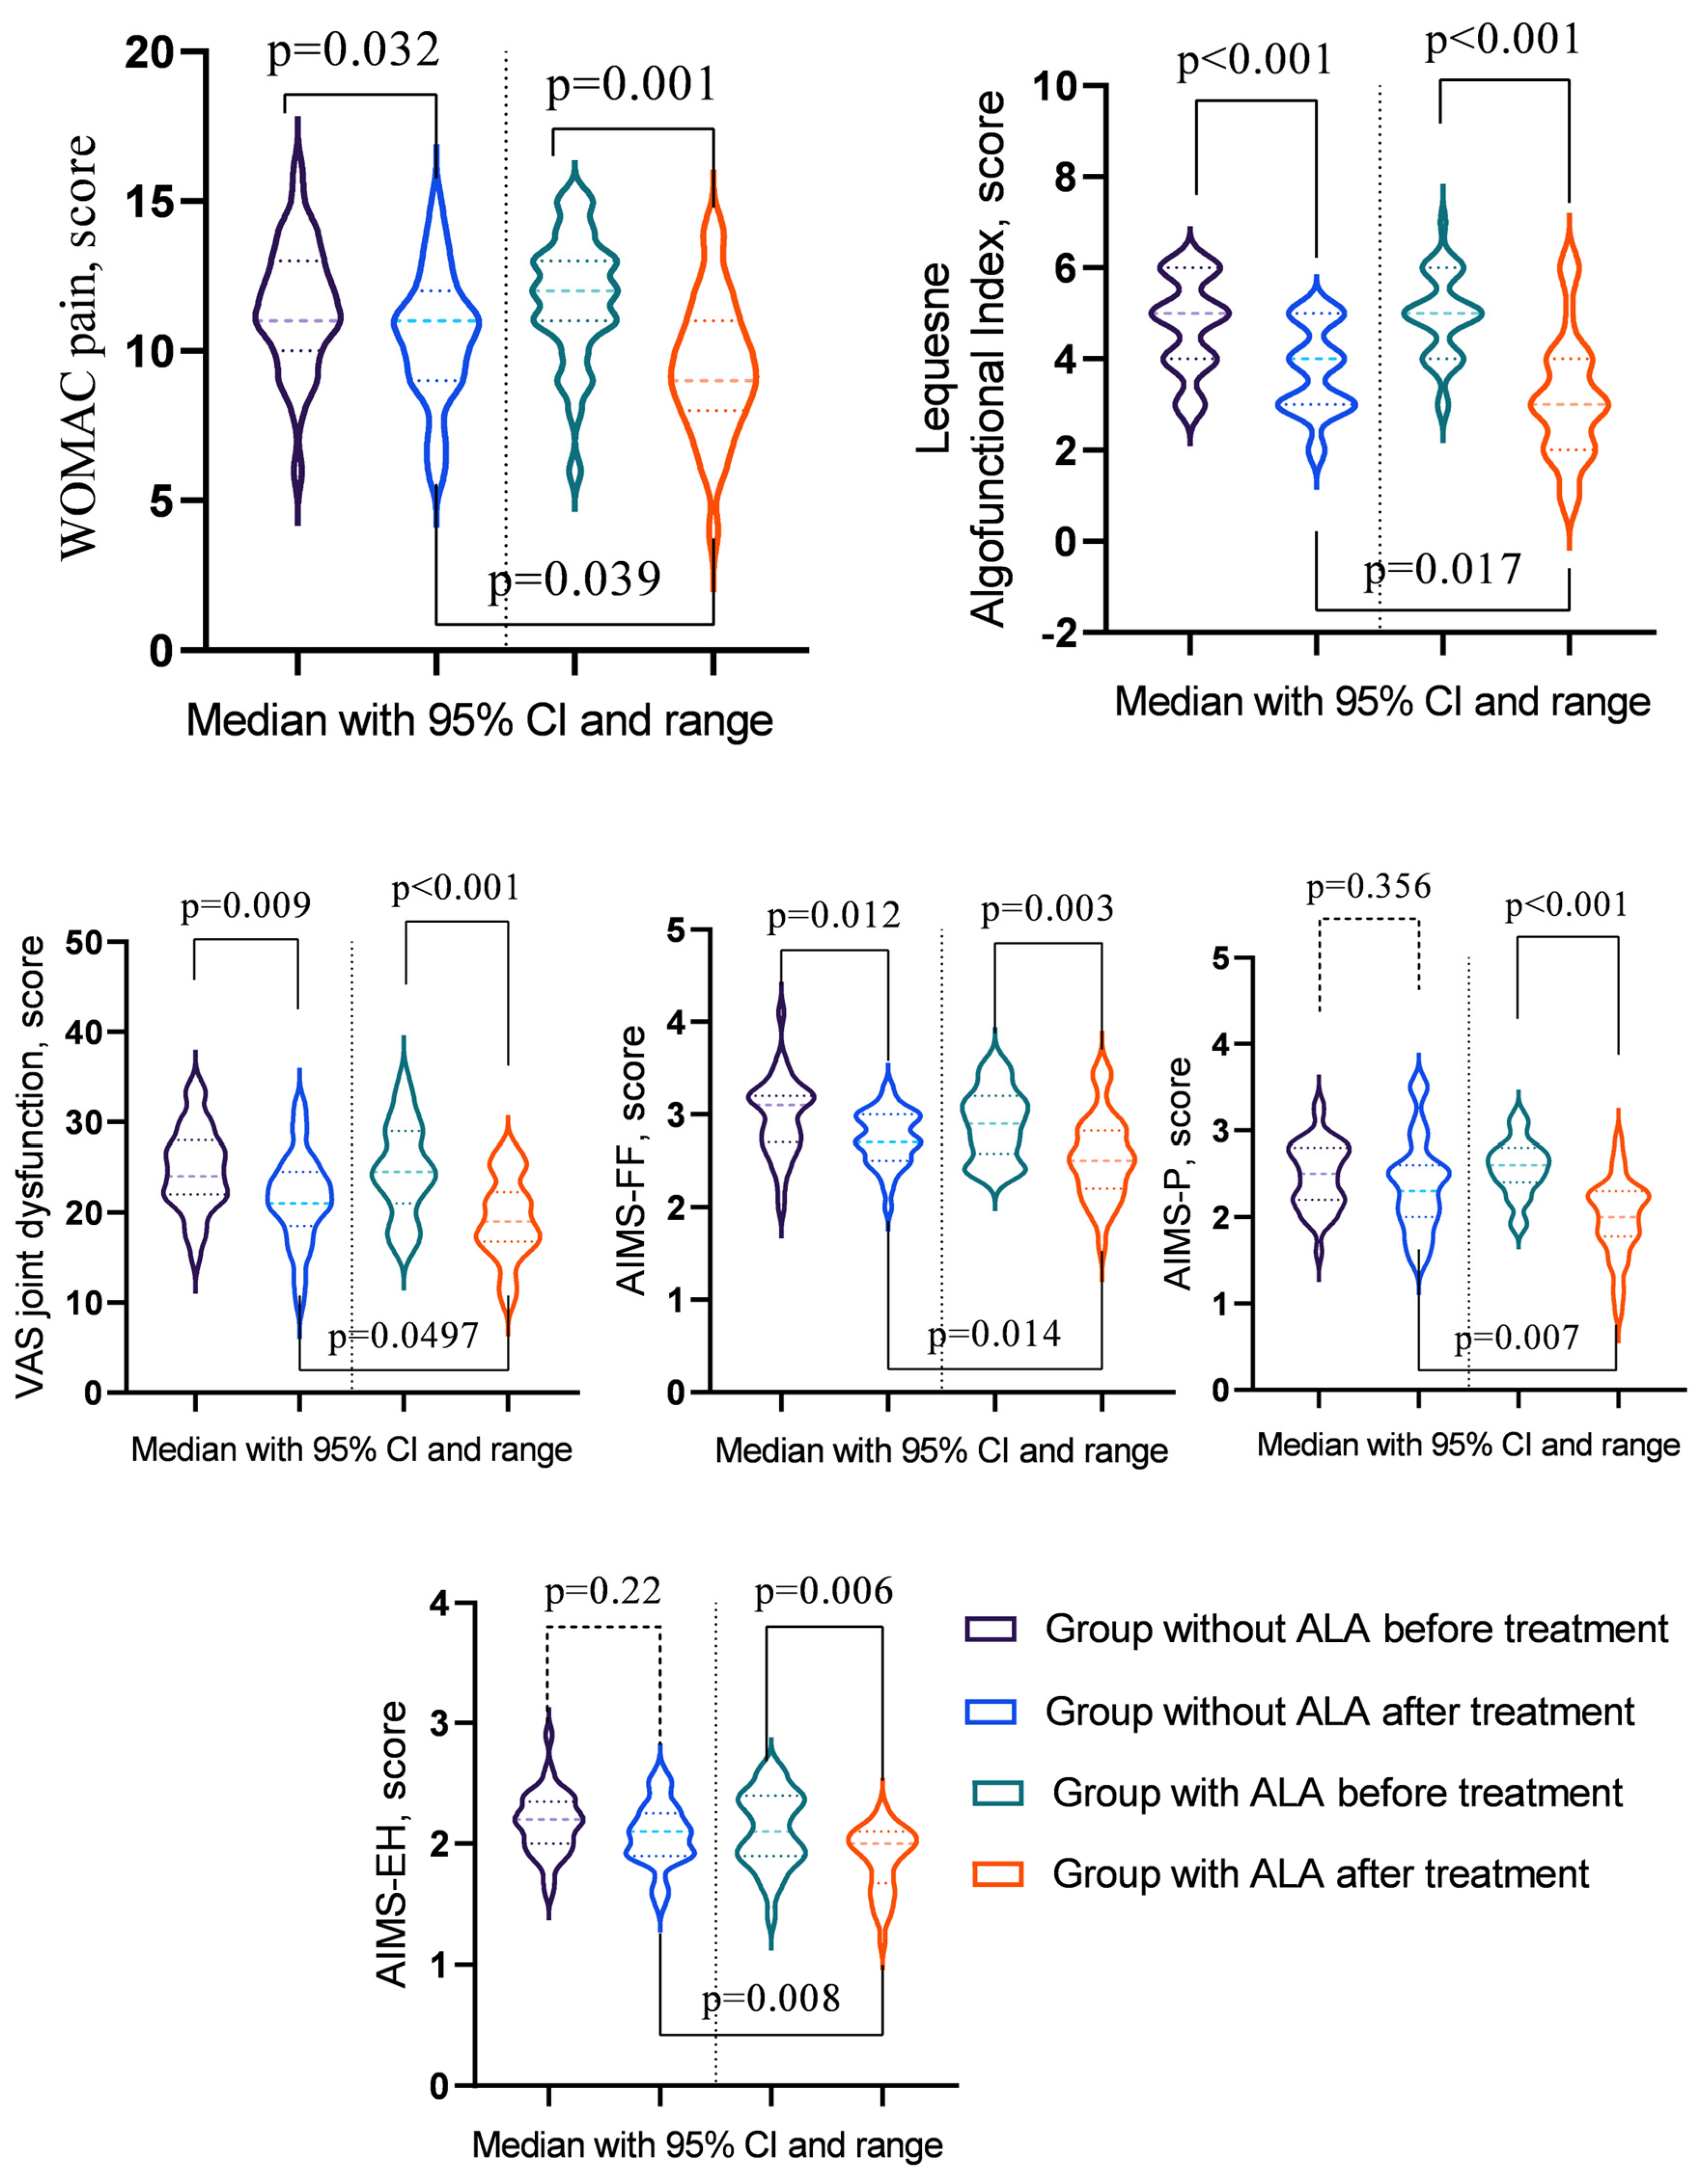
A statistical evaluation of the parameters before and after treatment revealed significant changes (Table 7). In the group without ALA, notable improvements were observed in WOMAC pain, WOMAC stiffness, WOMAC Physical Function, Total WOMAC score, the Lequesne Algofunctional Index, VAS rest pain, VAS movement pain, VAS inflammation, VAS joint dysfunction, AIMS-FF, and AIMS-SF (p < 0.05). Conversely, the group with ALA exhibited significant enhancements in WOMAC pain, WOMAC Physical Function, Total WOMAC score, the Lequesne Algofunctional Index, VAS rest pain, VAS movement pain, VAS inflammation, VAS joint dysfunction, AIMS-FF, AIMS-P, AIMS-SF, AIMS-EH, and AIMS-GHP (p < 0.05). A comparative analysis between the groups after treatment highlighted that the effects of treatment were more pronounced in the ALA group, particularly for WOMAC pain, the Lequesne Algofunctional Index, VAS joint dysfunction, AIMS-FF, and AIMS-EH (p < 0.05) (Figure 1).
Table 7.
Comparison of osteoarthritis indicators before and after treatment in groups with and without ALA.

Figure 1.
Osteoarthritis indicators showing significant changes post-treatment across groups.
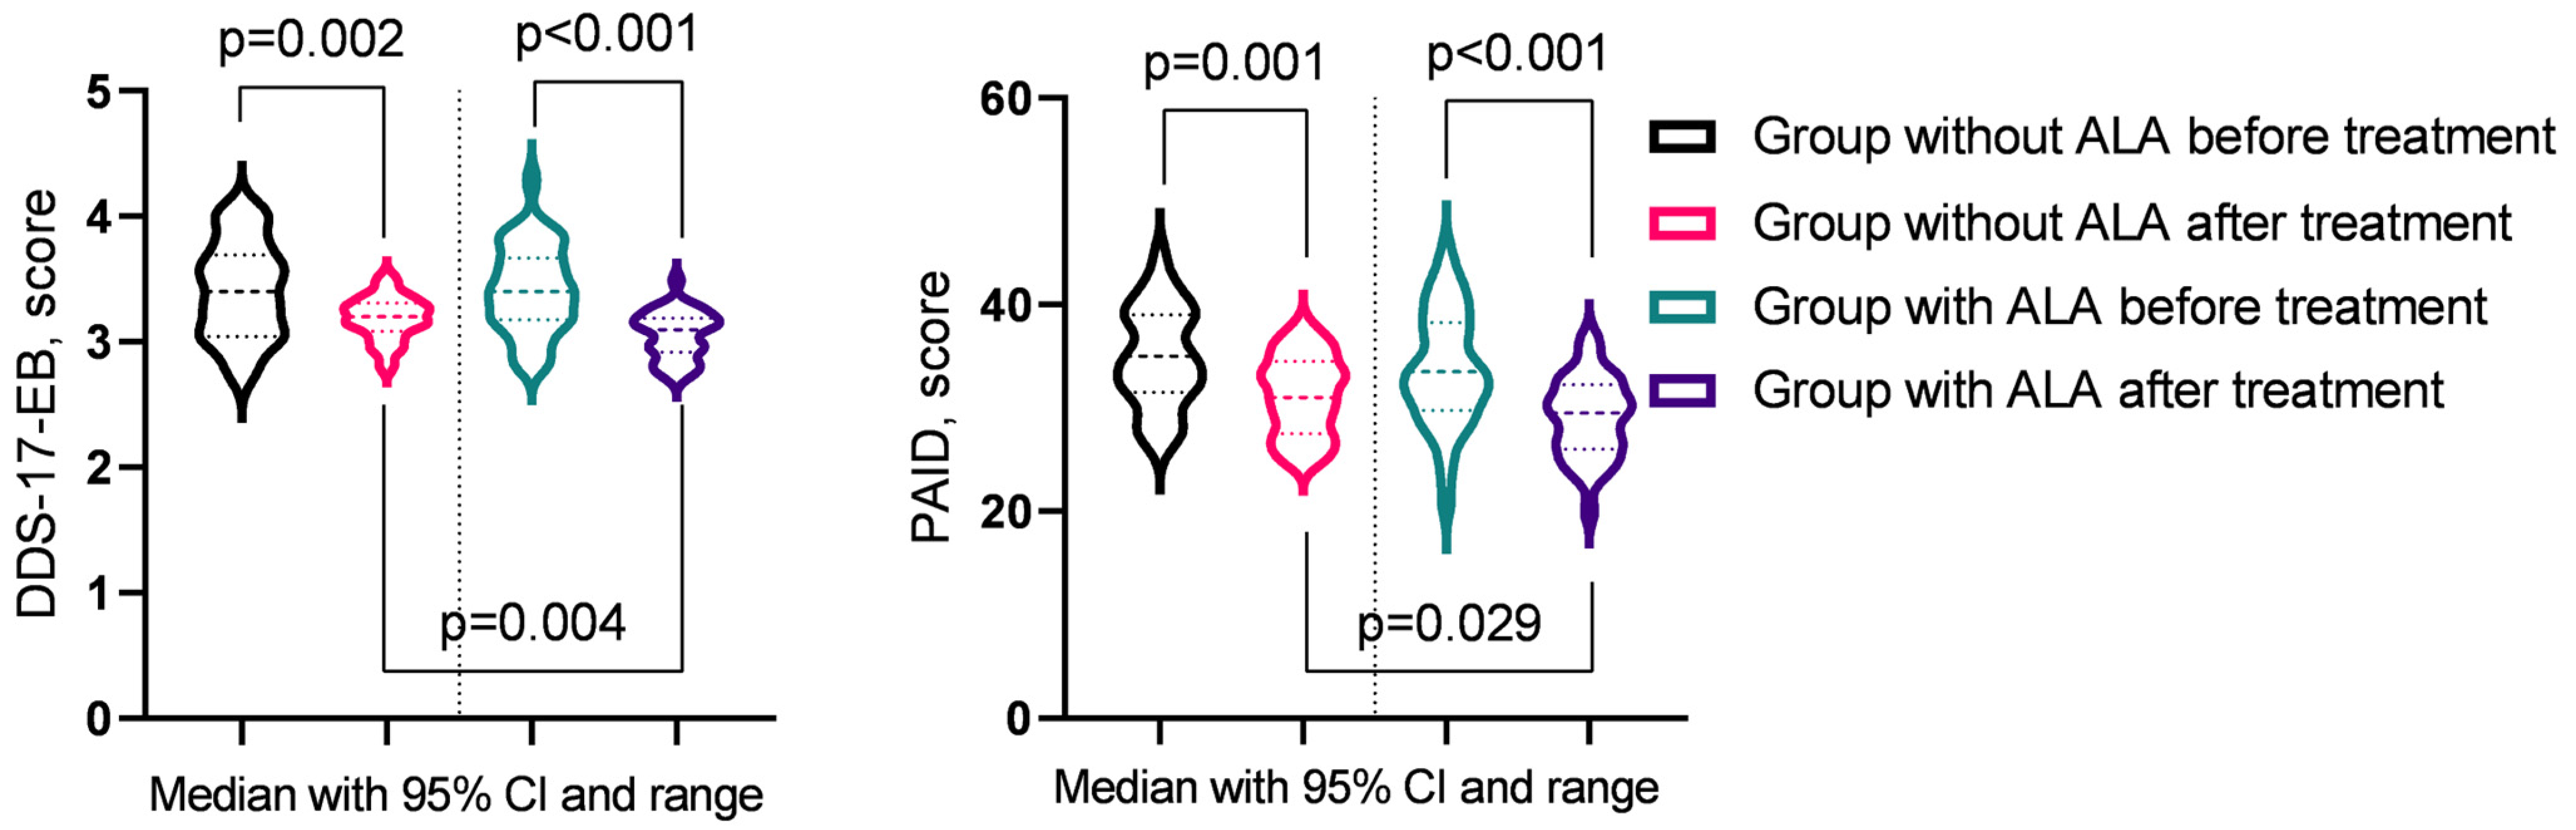
In the analysis of T2DM progression indicators before and after treatment (Table 8), significant improvements were observed across several parameters. In the group not receiving ALA, notable reductions were seen in fasting blood glucose levels, DDS-17-EB, DDS-17-RRD, and PAID (p < 0.05). In contrast, the group treated with ALA demonstrated significant improvements in fasting blood glucose levels, DDS-17-EB, DDS-17-RRD, DDS-17-ID, and PAID (p < 0.05). Post-treatment comparisons between the groups revealed that the ALA group experienced more substantial benefits, particularly in DDS-17-EB and PAID (p < 0.05) (Figure 2).
Table 8.
Comparison of diabetes indicators before and after treatment in groups with and without ALA.

Figure 2.
Diabetes indicators showing significant changes post-treatment across groups.
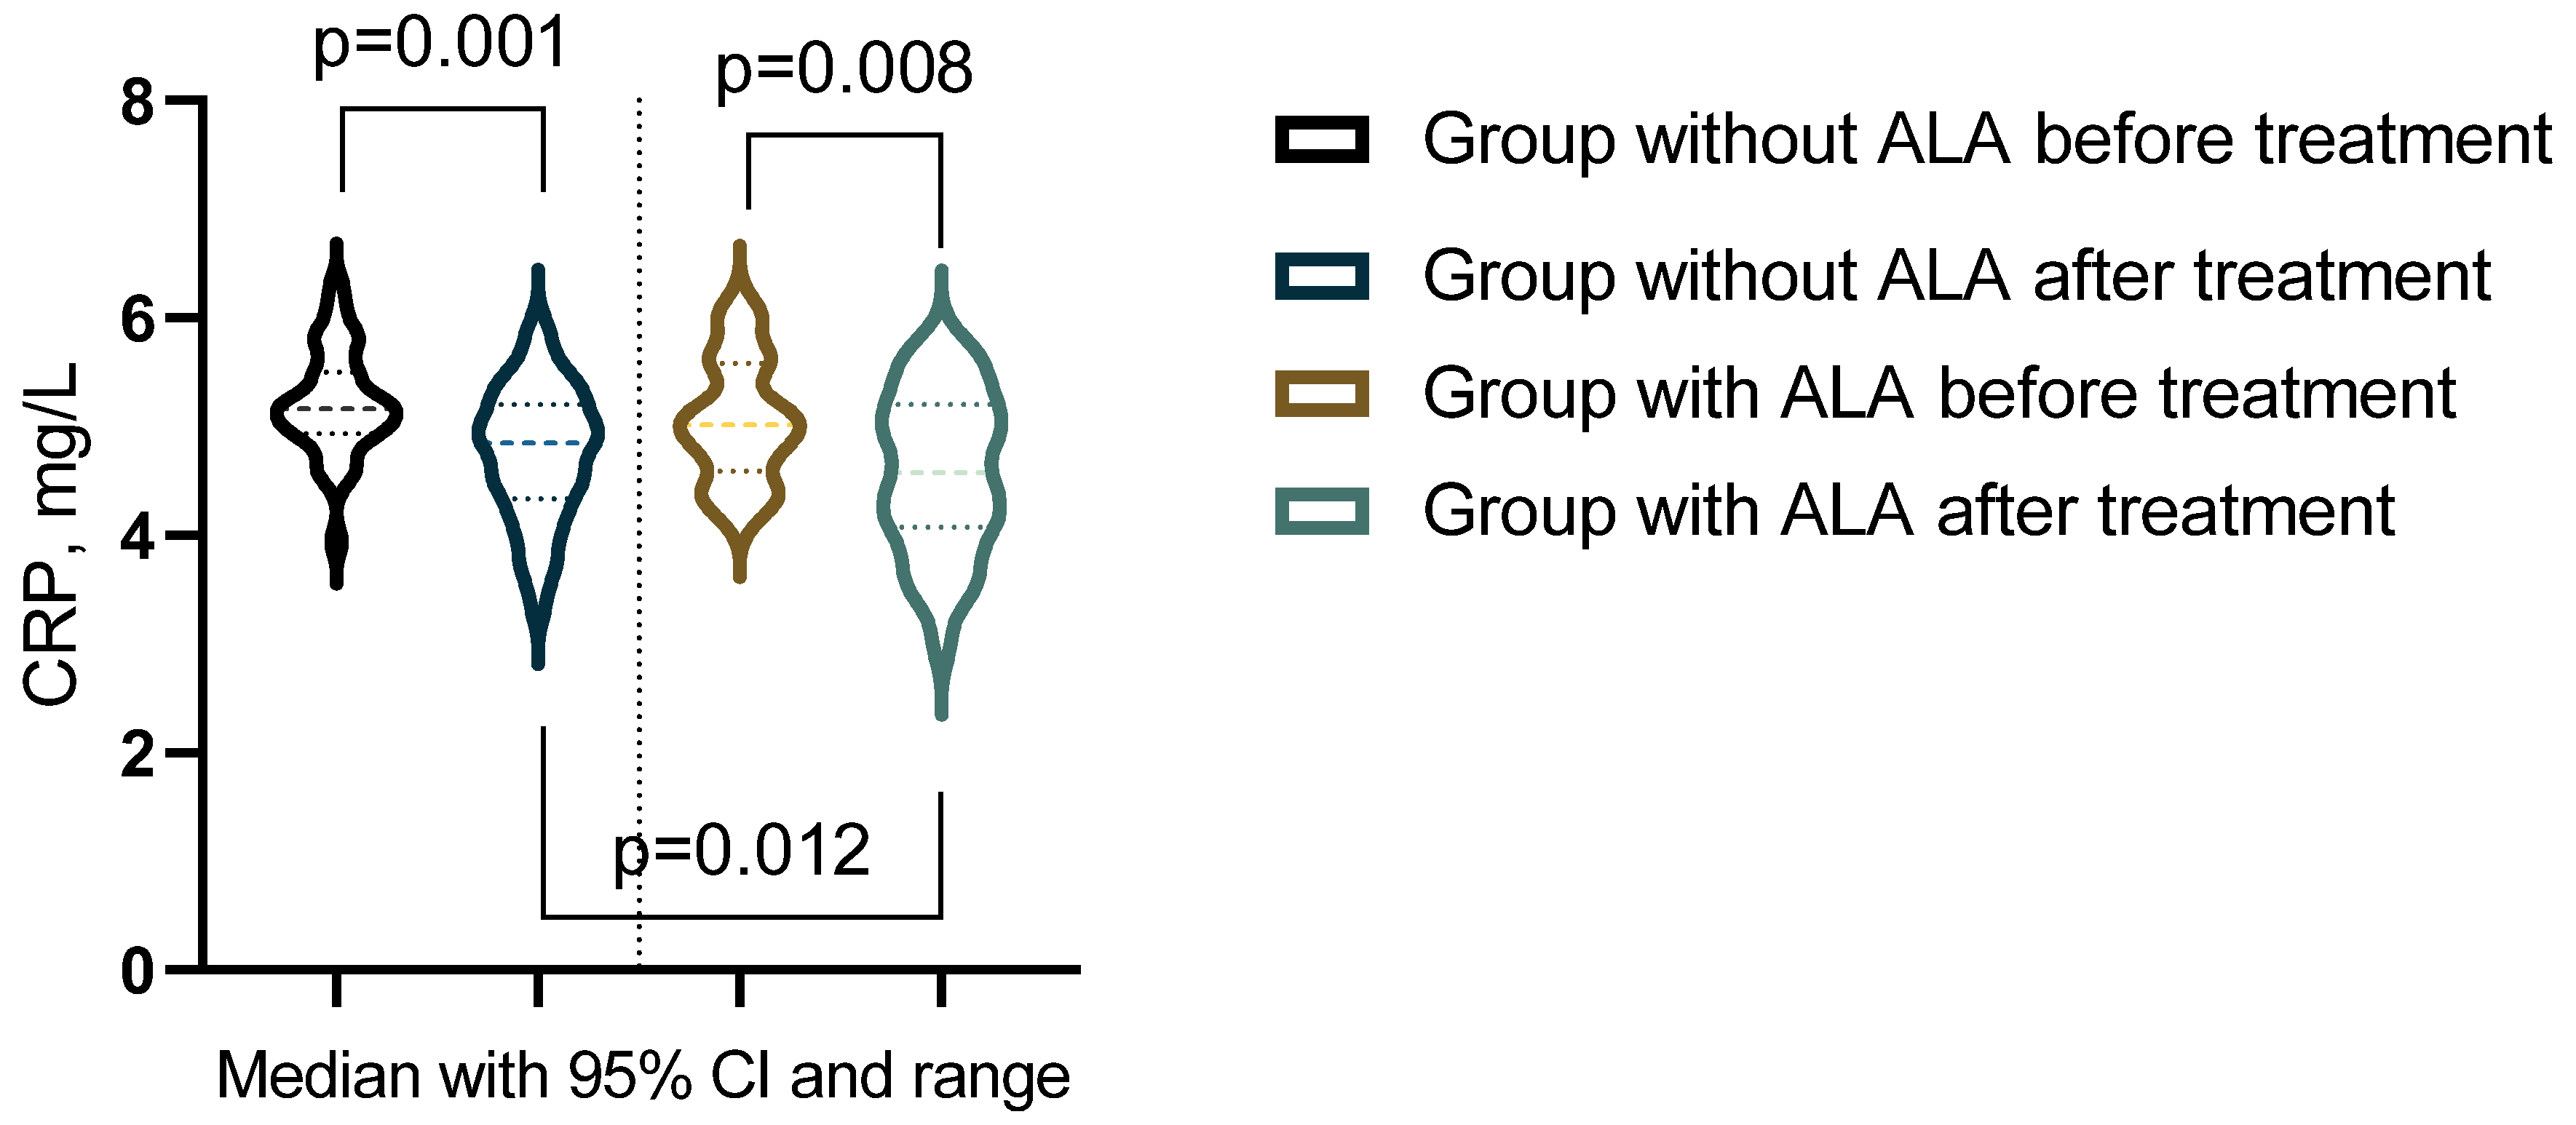
The analysis of outcomes before and after treatment revealed significant differences in inflammatory markers, oxidative stress parameters, and leukocyte subpopulations between the groups (Table 9). In the group not receiving ALA, statistically significant changes were observed in NLR, CRP, and catalase levels (p < 0.05). Conversely, in the group treated with ALA, significant alterations were noted in leukocyte counts, neutrophil percentages, NLR, CRP, MA, ceruloplasmin, SOD, and catalase (p < 0.05). Additionally, biomarkers after treatment comparisons between the groups highlighted a statistically significant difference in CRP levels (p < 0.05) (Figure 3).
Table 9.
Comparison of biomarkers before and after treatment in groups with and without ALA.

Figure 3.
Biomarker showing significant changes post-treatment across groups.
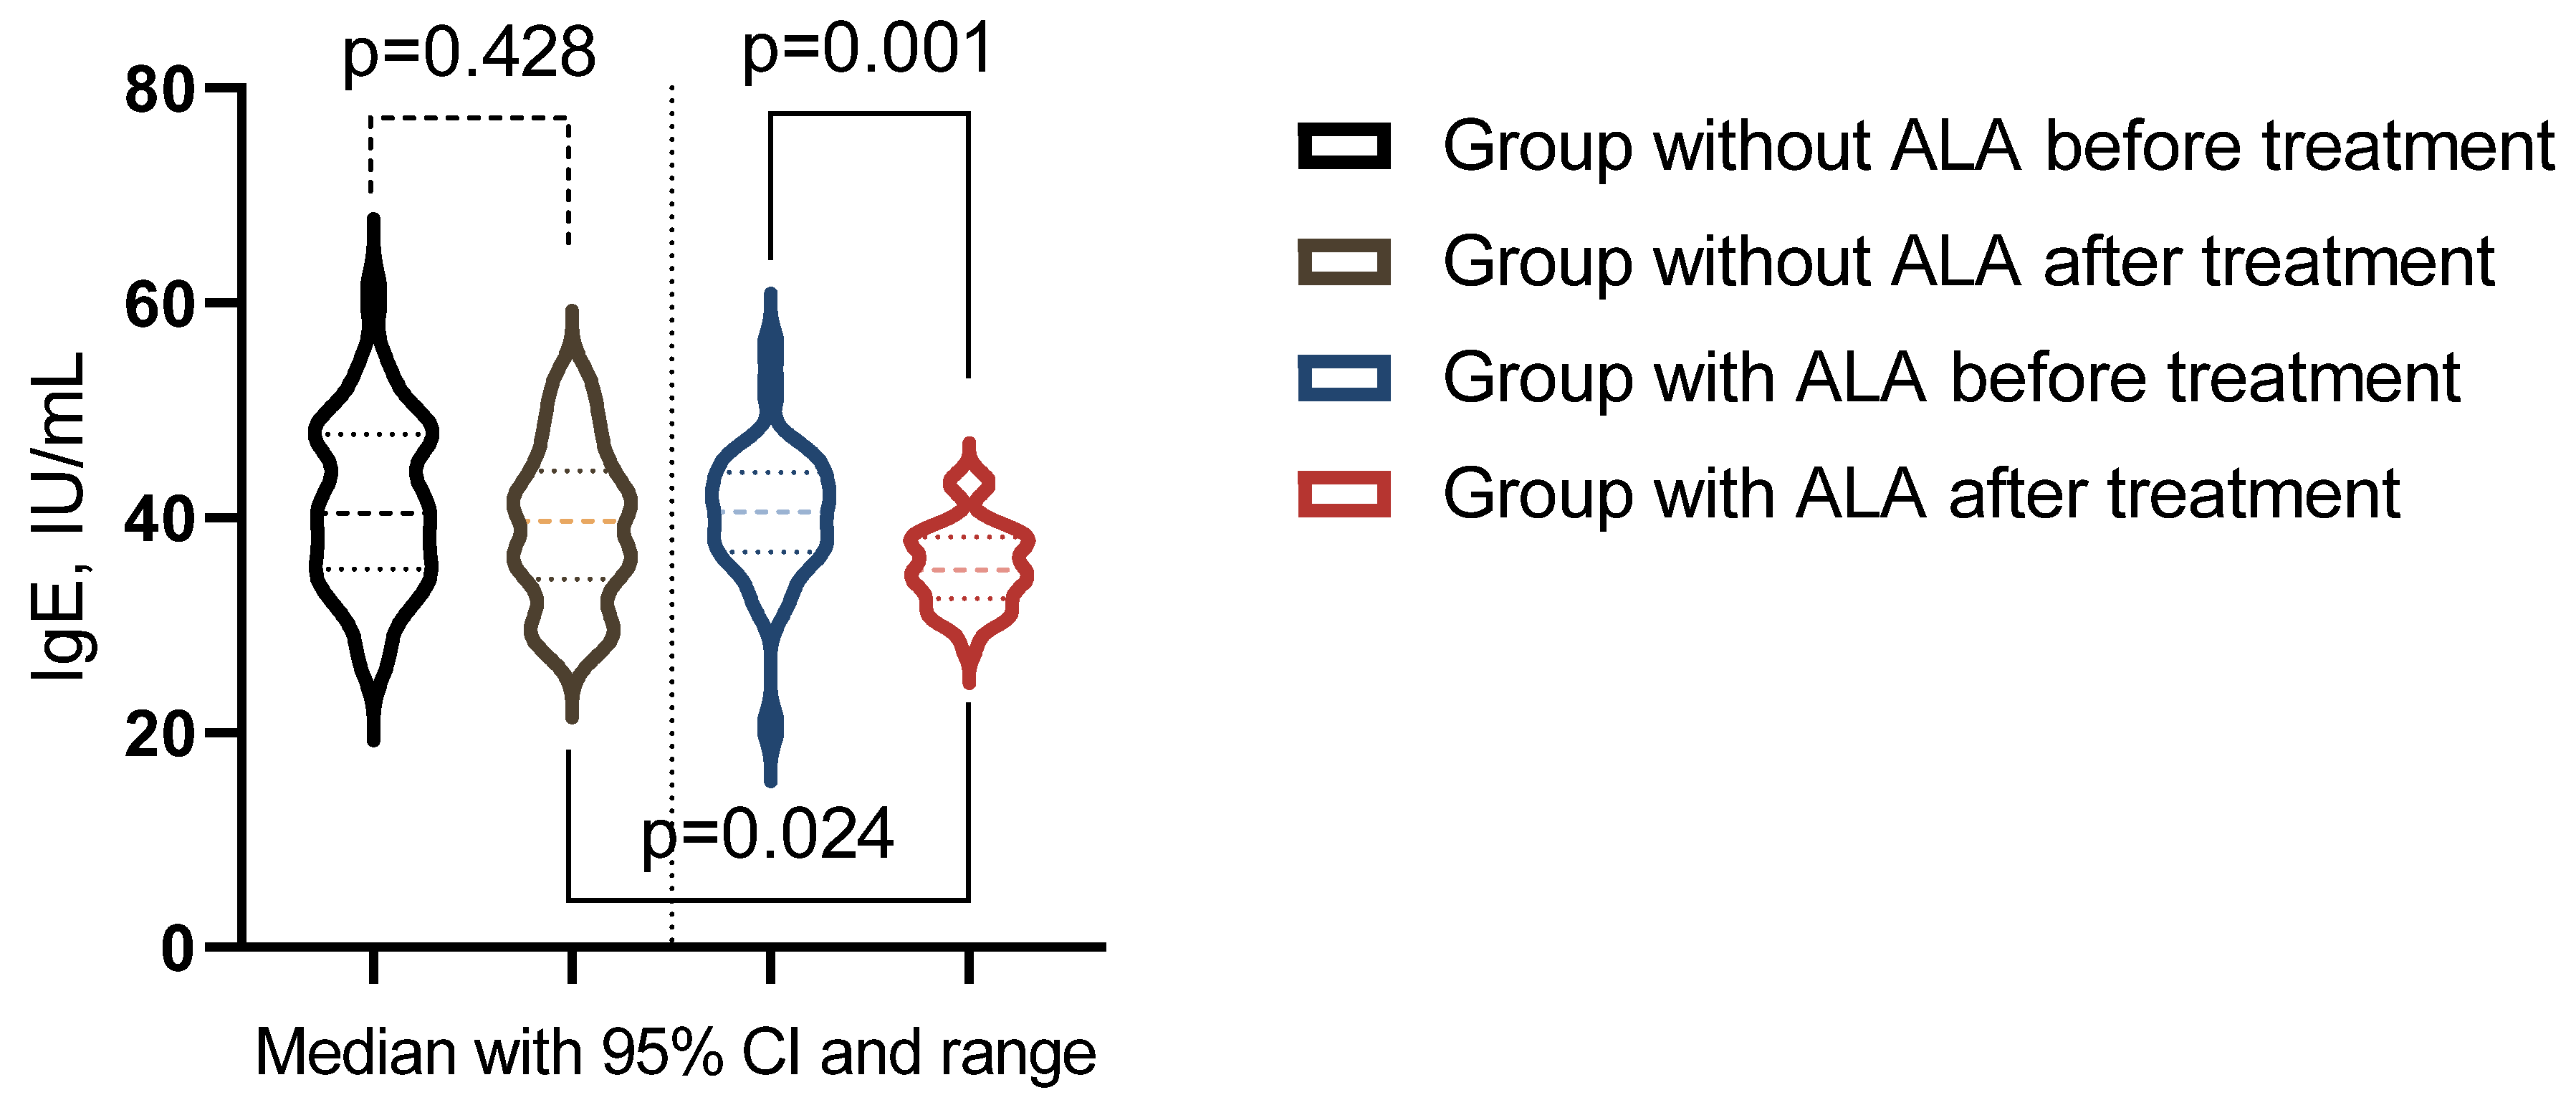
The analysis indicated differential responses in immunological markers to treatment across the study groups (Table 10). In the group that did not receive ALA, no statistically significant changes were observed in the immunological markers (p > 0.05). In contrast, the group treated with ALA showed significant post-treatment changes in serum IgA, IgE, and the Immunoregulatory Index (p < 0.05). Moreover, a significant difference in IgE levels was observed when comparing post-treatment levels between the groups across the studied markers (p < 0.05) (Figure 4).
Table 10.
Comparison of immunological markers before and after treatment in groups with and without ALA.

Figure 4.
Immunological indicator showing significant changes post-treatment across groups.
4. Discussion
This study sheds light on the intricate relationship between T2DM and OA, demonstrating how the coexistence of these conditions significantly exacerbates clinical symptoms and biochemical markers in affected patients. These findings are consistent with previous studies that have reported similar associations between T2DM and the worsening of OA [29,30,31,32]. For instance, prior research has shown that patients with both T2DM and OA often experience more severe pain and greater functional limitations compared to those with OA alone [14,33,34,35,36]. This study aligns with these observations, further supporting the notion that T2DM acts as an aggravating factor in OA progression.
The increased levels of inflammation, oxidative stress, and immune disturbances observed in this study’s cohort mirror findings from other research [10,37,38]. Elevated CRP levels, a marker of systemic inflammation, have been consistently reported in patients with T2DM [39,40], and their further elevation in the context of OA suggests the synergistic effect of these conditions on inflammatory processes [30,41]. Previous studies have also highlighted the role of oxidative stress in comorbid T2DM and OA [38,42], with some research indicating that oxidative damage may contribute to cartilage degradation and joint dysfunction [43,44,45]. The current study’s findings reinforce these insights, showing that oxidative stress is markedly higher in patients with comorbid T2DM and OA, thereby linking metabolic disturbances with joint pathology.
Moreover, this study’s identification of significant correlations among metabolic, psychological, and inflammatory factors in patients with both T2DM and OA adds a new dimension to our understanding of this comorbidity. While earlier research has explored the individual impact of these factors [34,46,47,48,49], the present study underscores their interconnectedness, suggesting that managing one aspect of this triad may influence the others. For example, addressing metabolic dysregulation in T2DM could potentially reduce inflammation and improve psychological well-being, which in turn might slow the progression of OA [50,51,52]. This holistic view aligns with recent studies advocating for integrated treatment approaches that consider the multifactorial nature of comorbid conditions [53,54,55]. T2DM is managed by targeting metabolic alterations, with metformin being a key pharmacological agent [56,57,58]. It effectively improves insulin sensitivity, decreases hepatic glucose production, and enhances peripheral glucose uptake, thereby aiding in the normalization of metabolic parameters in individuals with T2DM [59,60,61,62,63].
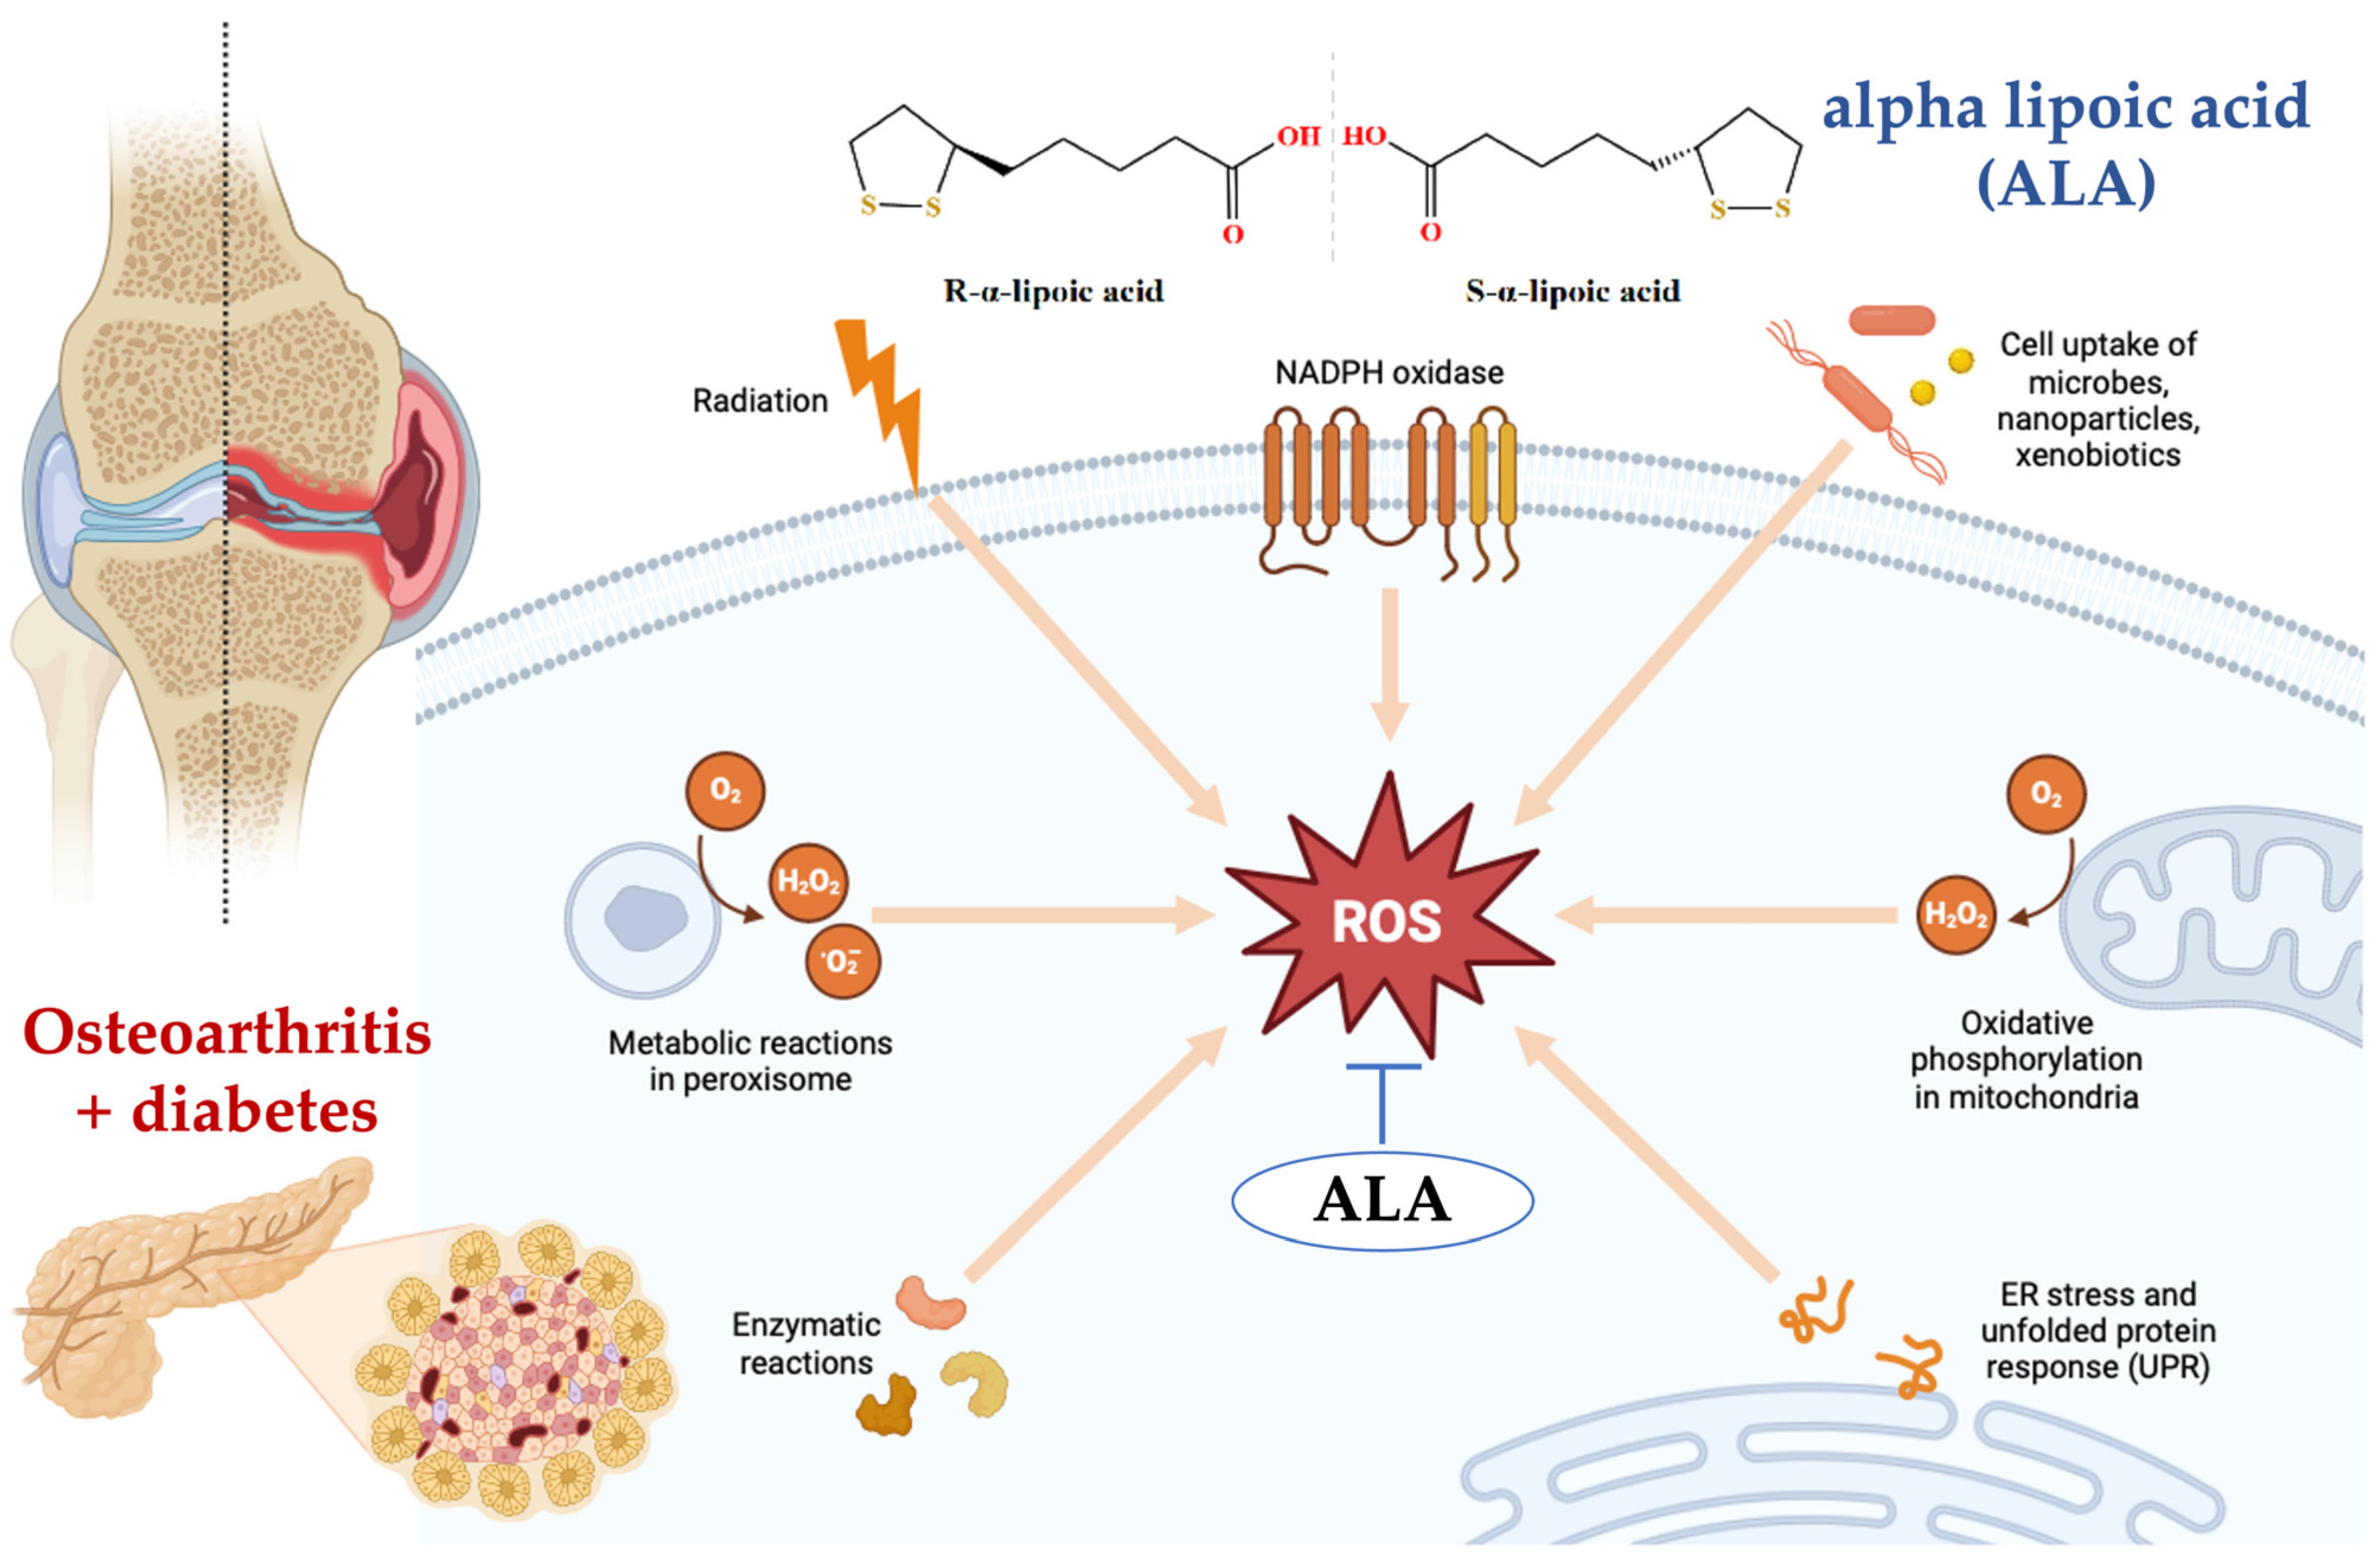
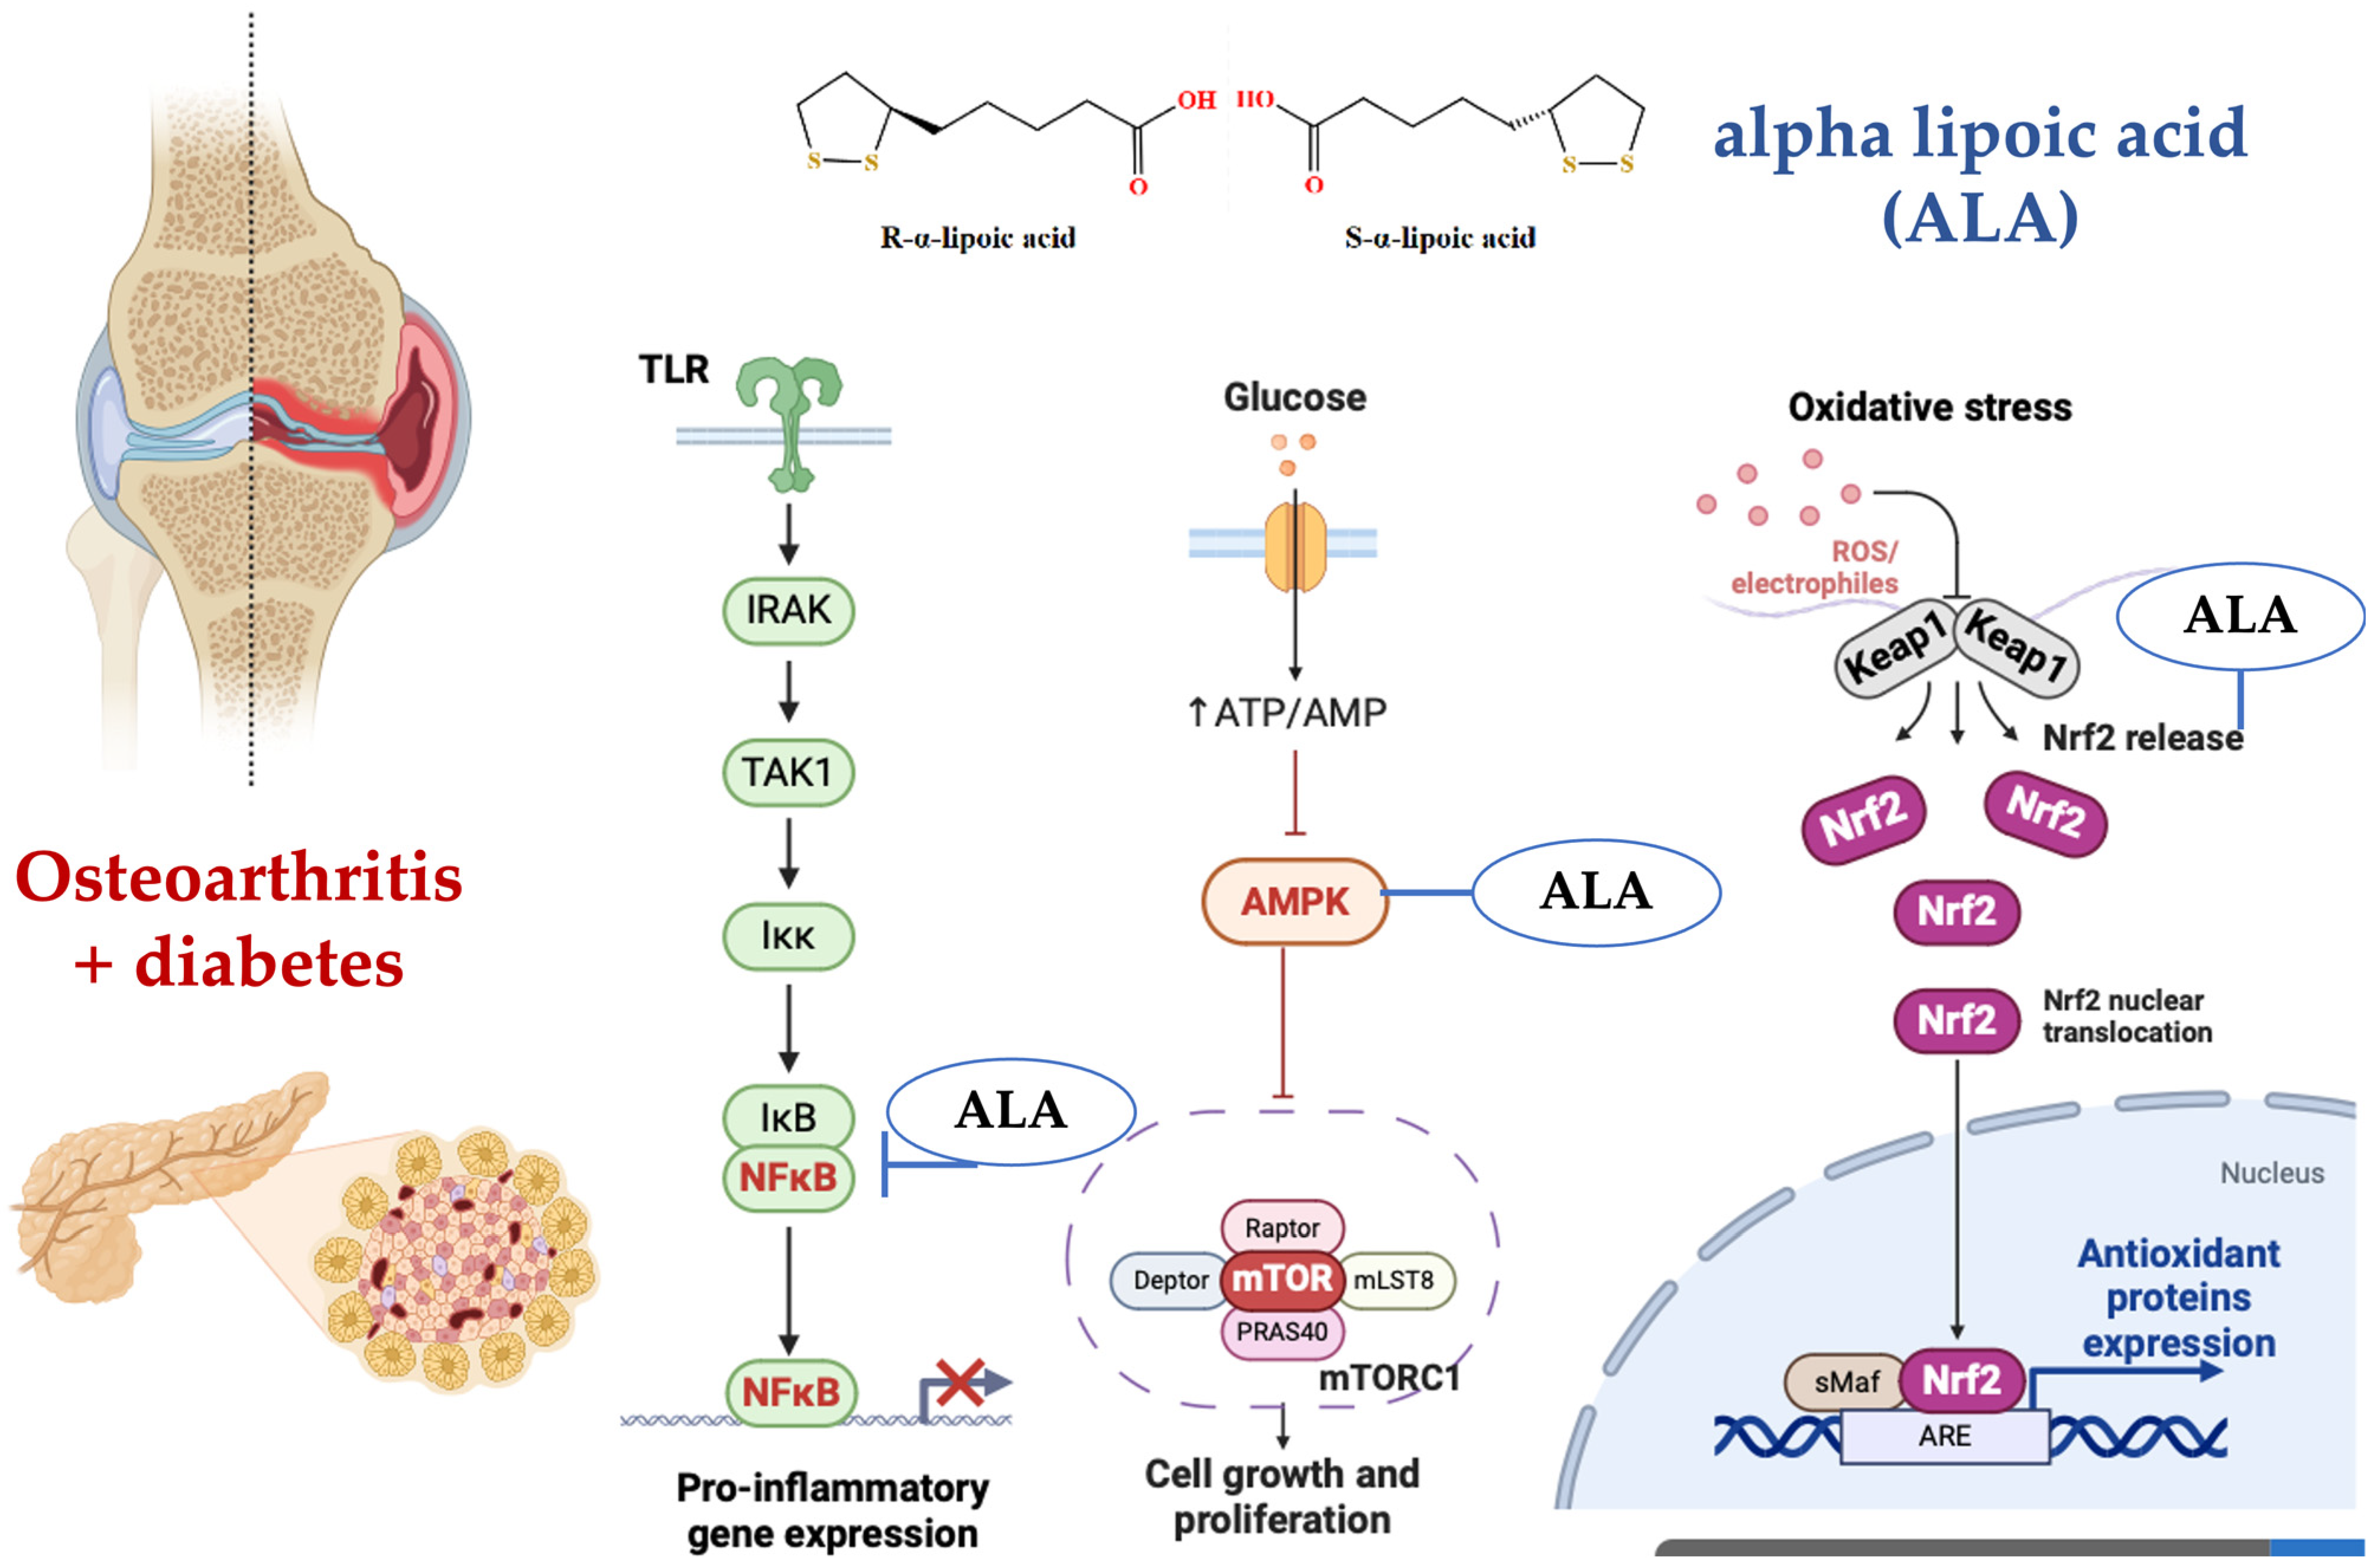
This study’s exploration of ALA as a therapeutic adjunct also contributes to the growing body of evidence supporting its use in metabolic disorders. Previous studies have demonstrated ALA’s effectiveness in improving insulin sensitivity and reducing oxidative stress (Figure 5) [64,65,66]. Recent research indicates that the administration of alpha-lipoic acid is associated with a significant reduction in systemic inflammation. This effect highlights its potential as a therapeutic agent in the management of inflammatory processes in various conditions (Figure 6) [67,68,69,70].

Figure 5.
Alpha-lipoic acid (ALA) reduces the formation of reactive oxygen species (ROS) by directly scavenging free radicals, including hydroxyl radicals and hydrogen peroxide. Additionally, ALA chelates transition metal ions, preventing the conversion of weak oxidants into more harmful reactive species. ALA also enhances the levels of intracellular antioxidants such as glutathione, which further helps in neutralizing ROS. Moreover, ALA can regenerate other antioxidants like vitamin C and vitamin E, thereby maintaining a robust antioxidant defense system within the cell [71,72,73]. Figure 5 was generated using BioRender (https://www.biorender.com/, accessed on 12 August 2024).
The current research extends these findings by demonstrating that ALA supplementation may have a potential impact on the course of pain syndrome in osteoarthritis, as well as a possible improvement in glycemic control, potentially enhancing the effects of hypoglycemic therapy and diet in patients with comorbid OA T2DM. These results are consistent with other studies that have highlighted the potential of antioxidants in managing both metabolic and degenerative joint diseases [74,75,76].
However, the findings regarding ALA must be interpreted with caution. While the improvements observed in this study are promising, they are consistent with earlier reports that emphasize the need for further investigation into the long-term effects and optimal dosing of ALA in patients with multiple comorbidities [77,78,79]. Other studies have pointed out the variability in patient responses to ALA, which may depend on factors such as disease severity, duration of diabetes, and individual differences in metabolism [80,81,82,83]. The current study’s relatively short duration and limited sample size suggest that more extensive research is needed to confirm these preliminary results and to explore the potential mechanisms underlying ALA’s effects in this specific patient population.

Figure 6.
(Left) Alpha-lipoic acid (ALA) has been shown to inhibit the NF-κB signaling pathway in various ways. Firstly, ALA pretreatment of human large artery endothelial cells (HAEC) significantly inhibited NF-κB-binding activity induced by TNF-α in a dose-dependent manner, suggesting a metal chelation effect rather than a general antioxidation effect. Secondly, ALA has been demonstrated to block NF-κB activation, which is crucial for preventing the spread of influenza virus by inhibiting the virus-induced increase in NF-κB and caspase activities. Lastly, ALA can reduce the production of pro-inflammatory cytokines by negatively regulating NF-κB, thereby modulating the immune response and reducing inflammation. (Center) Alpha-lipoic acid (ALA) activates the AMPK pathway, which in turn inhibits the mTOR signaling pathway, leading to reduced cell growth and proliferation. Additionally, ALA-induced AMPK activation results in the phosphorylation and inhibition of mTOR, thereby promoting autophagy and improving cellular energy metabolism. (Right) The Keap1-Nrf2 pathway is a signaling pathway involved in cellular responses to oxidative stress. The regulatory protein Keap1 regulates the activity of the transcription factor Nrf2. Under conditions of oxidative stress, Nrf2 is released from Keap1 and translocates to the nucleus, where it activates the expression of genes encoding antioxidant enzymes. Alpha-lipoic acid (ALA) activates the Keap1-Nrf2 signaling pathway by modifying Keap1, leading to the release and nuclear translocation of Nrf2, which enhances the expression of antioxidant response element (ARE)-driven genes. This activation helps in reducing oxidative stress and promoting cellular defense mechanisms [84,85,86,87,88]. Figure 6 was generated using BioRender.
This study emphasizes the complex and multifaceted nature of comorbid OA and T2DM, highlighting the need for comprehensive and personalized treatment strategies. While the potential of alpha-lipoic acid as a therapeutic agent appears promising, further research is essential to fully understand its efficacy, safety, and long-term benefits in patients with both OA and T2DM.
5. Limitations
We acknowledge several limitations in our study. First, the relatively small sample size limits the generalizability of our findings to a wider population. A larger, multicenter study is necessary to validate these results and enhance their applicability. Additionally, the monocentric design of this study inherently restricts the population studied and may introduce selection bias. Future research should include participants from multiple centers to obtain a more representative sample. The lack of randomization in the intervention group may introduce bias into the results, highlighting a limitation of this study that should be considered in future research. Moreover, the parameters investigated were not analyzed in a cohort of patients with T2DM who do not have comorbid OA.
6. Conclusions
This study illustrates that the presence of type 2 diabetes mellitus in patients with osteoarthritis significantly worsens clinical symptoms and biochemical markers. Patients with both osteoarthritis and type 2 diabetes exhibited elevated levels of certain indicators of inflammation, oxidative stress, and immunological disturbances when compared to those with osteoarthritis alone. Additionally, this research identified correlations among metabolic, psychological, and inflammatory factors. This study also highlights the potential predictors of this comorbidity, including a BMI in patients with the studied comorbidity, which may serve as a potential predictor for the deterioration of the evaluated parameters.
This analysis revealed that the administration of alpha-lipoic acid in a cohort of patients with osteoarthritis and type 2 diabetes mellitus led to statistically significant improvements in WOMAC pain scores, the Lequesne Algofunctional Index, and the AIMS-P when compared to the group of patients who did not receive alpha-lipoic acid. Further research into the application and effects of alpha-lipoic acid on the progression of osteoarthritis in patients with comorbid osteoarthritis and type 2 diabetes mellitus is warranted to facilitate a personalized treatment approach.
Author Contributions
Conceptualization and writing—original draft preparation, I.H. and O.K.; writing—review and editing, I.H., V.O. and O.K.; supervision, O.K. and V.O.; project administration, V.O. and O.K.; visualization, I.H and O.K. All authors have read and agreed to the published version of the manuscript.
Funding
This research received no external funding.
Institutional Review Board Statement
The study protocol met the requirements for biomedical research and was approved by the Local Ethics Committee of the I. Horbachevsky Ternopil National Medical University as protocol N75, dated 1 November 2023.
Informed Consent Statement
All patients signed an informed consent for the study.
Data Availability Statement
The original contributions presented in the study are included in the article, further inquiries can be directed to the corresponding authors.
Conflicts of Interest
The authors declare no conflicts of interest.
References
- Oo, W.M. Prospects of Disease-Modifying Osteoarthritis Drugs. Rheum. Dis. Clin. N. Am. 2024, 50, 483–518. [Google Scholar] [CrossRef]
- Halabitska, I.; Babinets, L. Different consequences of the treatment of osteoarthritis in gastrointestinal comorbidity with exocrine pancreatic insufficiency. Fam. Med. Prim. Care Rev. 2021, 23, 422–428. [Google Scholar] [CrossRef]
- Liang, J.; Liu, L.; Feng, H.; Yue, Y.; Zhang, Y.; Wang, Q.; Zhao, H. Therapeutics of osteoarthritis and pharmacological mechanisms: A focus on RANK/RANKL signaling. Biomed. Pharmacother. 2023, 167, 115646. [Google Scholar] [CrossRef]
- Pi, P.; Zeng, L.; Zeng, Z.; Zong, K.; Han, B.; Bai, X.; Wang, Y. The role of targeting glucose metabolism in chondrocytes in the pathogenesis and therapeutic mechanisms of osteoarthritis: A narrative review. Front. Endocrinol. 2024, 15, 1319827. [Google Scholar] [CrossRef]
- Shawl, M.; Geetha, T.; Burnett, D.; Babu, J.R. Omega-3 Supplementation and Its Effects on Osteoarthritis. Nutrients 2024, 16, 1650. [Google Scholar] [CrossRef]
- Buchanan, W.W.; Kean, C.A.; Kean, W.F.; Rainsford, K.D. Osteoarthritis. Inflammopharmacology 2024, 32, 13–22. [Google Scholar] [CrossRef]
- Shukla, R.; Singh, S.; Kamath, S.; Shah, U.; Patel, S.; Kherajani, K.; Gupta, A.; Shaw, P.; Unnithan, V.; Kaithathara, S.; et al. Interplay Between Diabetes Mellitus and the Occurrence of Osteoarthritis and Associated Conditions in Women of Menopausal Age. Cureus 2024, 16, e58502. [Google Scholar] [CrossRef]
- Yu, M.G.; Gordin, D.; Fu, J.; Park, K.; Li, Q.; King, G.L. Protective Factors and the Pathogenesis of Complications in Diabetes. Endocr. Rev. 2024, 45, 227–252. [Google Scholar] [CrossRef]
- Kumar, A.; Gangwar, R.; Zargar, A.A.; Kumar, R.; Sharma, A. Prevalence of Diabetes in India: A Review of IDF Diabetes Atlas 10th Edition. Curr. Diabetes Rev. 2024, 20, e130423215752. [Google Scholar] [CrossRef]
- An, Y.; Xu, B.T.; Wan, S.R.; Ma, X.M.; Long, Y.; Xu, Y.; Jiang, Z.Z. The role of oxidative stress in diabetes mellitus-induced vascular endothelial dysfunction. Cardiovasc. Diabetol. 2023, 22, 237. [Google Scholar] [CrossRef]
- Strati, M.; Moustaki, M.; Psaltopoulou, T.; Vryonidou, A.; Paschou, S.A. Early onset type 2 diabetes mellitus: An update. Endocrine 2024, 85, 965–978. [Google Scholar] [CrossRef]
- Zemlyak, O.S.; Babinets, L.S.; Halabitska, I.M. The Role of Endotoxicosis and Inflammation in Deepening the Pancreatic Functional Insufficiency in Chronic Pancreatitis in Combination with Type 2 Diabetes. Pol. Merkur. Lek. Organ Pol. Tow. Lek. 2023, 51, 207–215. [Google Scholar] [CrossRef]
- Rios-Arce, N.D.; Hum, N.R.; Loots, G.G. Interactions Between Diabetes Mellitus and Osteoarthritis: From Animal Studies to Clinical Data. JBMR Plus 2022, 6, e10626. [Google Scholar] [CrossRef]
- Chowdhury, T.; Bellamkonda, A.; Gousy, N.; Deb Roy, P. The Association Between Diabetes Mellitus and Osteoarthritis: Does Diabetes Mellitus Play a Role in the Severity of Pain in Osteoarthritis? Cureus 2022, 14, e21449. [Google Scholar] [CrossRef]
- Yu, Y.; Xu, J.; Li, H.; Lv, J.; Zhang, Y.; Niu, R.; Wang, J.; Zhao, Y.; Sun, Z. α-Lipoic acid improves mitochondrial biogenesis and dynamics by enhancing antioxidant and inhibiting Wnt/Ca(2+) pathway to relieve fluoride-induced hepatotoxic injury. Chem. Biol. Interact. 2023, 385, 110719. [Google Scholar] [CrossRef]
- Capece, U.; Moffa, S.; Improta, I.; Di Giuseppe, G.; Nista, E.C.; Cefalo, C.M.A.; Cinti, F.; Pontecorvi, A.; Gasbarrini, A.; Giaccari, A.; et al. Alpha-Lipoic Acid and Glucose Metabolism: A Comprehensive Update on Biochemical and Therapeutic Features. Nutrients 2022, 15, 18. [Google Scholar] [CrossRef]
- Theodosis-Nobelos, P.; Papagiouvannis, G.; Tziona, P.; Rekka, E.A. Lipoic acid. Kinetics and pluripotent biological properties and derivatives. Mol. Biol. Rep. 2021, 48, 6539–6550. [Google Scholar] [CrossRef]
- Rochette, L.; Ghibu, S.; Richard, C.; Zeller, M.; Cottin, Y.; Vergely, C. Direct and indirect antioxidant properties of α-lipoic acid and therapeutic potential. Mol. Nutr. Food Res. 2013, 57, 114–125. [Google Scholar] [CrossRef]
- Halabitska, I.M.; Babinets, L.S.; Vysotskyi, V.I. Possibilities of Metabolic and Functional Disorders Correction in Osteoarthritis with Complex Comorbidity. Wiad. Lek. 2022, 75, 645–648. [Google Scholar] [CrossRef]
- Wang, J.; Sun, H.; Fu, Z.; Liu, M. Chondroprotective effects of alpha-lipoic acid in a rat model of osteoarthritis. Free Radic. Res. 2016, 50, 767–780. [Google Scholar] [CrossRef]
- Frondoza, C.G.; Fortuno, L.V.; Grzanna, M.W.; Ownby, S.L.; Au, A.Y.; Rashmir-Raven, A.M. α-Lipoic Acid Potentiates the Anti-Inflammatory Activity of Avocado/Soybean Unsaponifiables in Chondrocyte Cultures. Cartilage 2018, 9, 304–312. [Google Scholar] [CrossRef]
- Sabha, M.; Hochberg, M.C. Non-surgical management of hip and knee osteoarthritis; comparison of ACR/AF and OARSI 2019 and VA/DoD 2020 guidelines. Osteoarthr. Cartil. Open 2022, 4, 100232. [Google Scholar] [CrossRef]
- Marathe, P.H.; Gao, H.X.; Close, K.L. American Diabetes Association Standards of Medical Care in Diabetes 2017. J. Diabetes 2017, 9, 320–324. [Google Scholar] [CrossRef]
- Salehi, R.; Valizadeh, L.; Negahban, H.; Karimi, M.; Goharpey, S.; Shahali, S. The Western Ontario and McMaster Universities Osteoarthritis, Lequesne Algofunctional index, Arthritis Impact Measurement Scale-short form, and Visual Analogue Scale in patients with knee osteoarthritis: Responsiveness and minimal clinically important differences. Disabil. Rehabil. 2023, 45, 2185–2191. [Google Scholar]
- Sung, Y.T.; Wu, J.S. The Visual Analogue Scale for Rating, Ranking and Paired-Comparison (VAS-RRP): A new technique for psychological measurement. Behav. Res. Methods 2018, 50, 1694–1715. [Google Scholar] [CrossRef]
- Gignac, M.A.; Cao, X.; McAlpine, J.; Badley, E.M. Measures of disability: Arthritis Impact Measurement Scales 2 (AIMS2), Arthritis Impact Measurement Scales 2-Short Form (AIMS2-SF), The Organization for Economic Cooperation and Development (OECD) Long-Term Disability (LTD) Questionnaire, EQ-5D, World Health Organization Disability Assessment Schedule II (WHODASII), Late-Life Function and Disability Instrument (LLFDI), and Late-Life Function and Disability Instrument-Abbreviated Version (LLFDI-Abbreviated). Arthritis Care Res. 2011, 63 (Suppl. S11), S308–S324. [Google Scholar]
- Polonsky, W.H.; Fisher, L.; Earles, J.; Dudl, R.J.; Lees, J.; Mullan, J.; Jackson, R.A. Assessing psychosocial distress in diabetes: Development of the diabetes distress scale. Diabetes Care 2005, 28, 626–631. [Google Scholar] [CrossRef]
- Sayed Ahmed, H.A.; Mohamed, S.F.; Mostafa, M.; Elotla, S.F.; Shah, A.; Shah, J.; Fouad, A.M. Psychometric evaluation of the Arabic version of the 5-item Problem Areas in Diabetes (AR-PAID-5) scale. BMC Prim. Care 2022, 23, 148. [Google Scholar] [CrossRef]
- Veronese, N.; Cooper, C.; Reginster, J.Y.; Hochberg, M.; Branco, J.; Bruyère, O.; Chapurlat, R.; Al-Daghri, N.; Dennison, E.; Herrero-Beaumont, G.; et al. Type 2 diabetes mellitus and osteoarthritis. Semin. Arthritis Rheum. 2019, 49, 9–19. [Google Scholar] [CrossRef] [PubMed]
- Courties, A.; Sellam, J. Osteoarthritis and type 2 diabetes mellitus: What are the links? Diabetes Res. Clin. Pract. 2016, 122, 198–206. [Google Scholar] [CrossRef] [PubMed]
- Arruda, A.L.; Hartley, A.; Katsoula, G.; Smith, G.D.; Morris, A.P.; Zeggini, E. Genetic underpinning of the comorbidity between type 2 diabetes and osteoarthritis. Am. J. Hum. Genet. 2023, 110, 1304–1318. [Google Scholar] [CrossRef]
- Schwarz, S.; Mrosewski, I.; Silawal, S.; Schulze-Tanzil, G. The interrelation of osteoarthritis and diabetes mellitus: Considering the potential role of interleukin-10 and in vitro models for further analysis. Inflamm. Res. 2018, 67, 285–300. [Google Scholar] [CrossRef]
- Eitner, A.; Wildemann, B. Diabetes—Osteoarthritis and joint pain. Bone Jt. Res. 2021, 10, 307–309. [Google Scholar] [CrossRef]
- Motta, F.; Barone, E.; Sica, A.; Selmi, C. Inflammaging and Osteoarthritis. Clin. Rev. Allergy Immunol. 2023, 64, 222–238. [Google Scholar] [CrossRef]
- Burbank, K.M.; Stevenson, J.H.; Czarnecki, G.R.; Dorfman, J. Chronic shoulder pain: Part I. Evaluation and diagnosis. Am. Fam. Physician 2008, 77, 453–460. [Google Scholar]
- Colletti, A.; Cicero, A.F.G. Nutraceutical Approach to Chronic Osteoarthritis: From Molecular Research to Clinical Evidence. Int. J. Mol. Sci. 2021, 22, 12920. [Google Scholar] [CrossRef]
- Li, M.; Xiao, Y.B.; Wang, X.T.; Zhuang, J.P.; Zhou, C.L. Proline-Serine-Threonine Phosphatase-Interacting Protein 2 Alleviates Diabetes Mellitus-Osteoarthritis in Rats through Attenuating Synovial Inflammation and Cartilage Injury. Orthop. Surg. 2021, 13, 1398–1407. [Google Scholar] [CrossRef]
- Ebrahim, H.A.; Alzamil, N.M.; Al-Ani, B.; Haidara, M.A.; Kamar, S.S.; Dawood, A.F. Suppression of knee joint osteoarthritis induced secondary to type 2 diabetes mellitus in rats by resveratrol: Role of glycated haemoglobin and hyperlipidaemia and biomarkers of inflammation and oxidative stress. Arch. Physiol. Biochem. 2022, 128, 1375–1382. [Google Scholar] [CrossRef]
- Mazidi, M.; Karimi, E.; Rezaie, P.; Ferns, G.A. Treatment with GLP1 receptor agonists reduce serum CRP concentrations in patients with type 2 diabetes mellitus: A systematic review and meta-analysis of randomized controlled trials. J. Diabetes Its Complicat. 2017, 31, 1237–1242. [Google Scholar] [CrossRef] [PubMed]
- Calle, M.C.; Fernandez, M.L. Inflammation and type 2 diabetes. Diabetes Metab. 2012, 38, 183–191. [Google Scholar] [CrossRef] [PubMed]
- Schwartz, A.V.; Lane, N.E. Bone and Joint Complications in Diabetes. In Diabetes in America; Cowie, C.C., Casagrande, S.S., Menke, A., Cissell, M.A., Eberhardt, M.S., Meigs, J.B., Gregg, E.W., Knowler, W.C., Barrett-Connor, E., Becker, D.J., et al., Eds.; National Institute of Diabetes and Digestive and Kidney Diseases (US): Bethesda, MD, USA, 2018. [Google Scholar]
- Qu, Z.A.; Ma, X.J.; Huang, S.B.; Hao, X.R.; Li, D.M.; Feng, K.Y.; Wang, W.M. SIRT2 inhibits oxidative stress and inflammatory response in diabetic osteoarthritis. Eur. Rev. Med. Pharmacol. Sci. 2020, 24, 2855–2864. [Google Scholar]
- Mas-Bargues, C.; Alique, M.; Barrús-Ortiz, M.T.; Borrás, C.; Rodrigues-Díez, R. Special Issue “Oxidative Stress in Aging and Associated Chronic Diseases”. Antioxidants 2022, 11, 701. [Google Scholar] [CrossRef]
- Nadella, H.; Bloom, A.W.; Demory Beckler, M.; Kesselman, M.M. The Overlap of Diabetes and Osteoarthritis in American Populations. Cureus 2023, 15, e38287. [Google Scholar] [CrossRef]
- Courties, A.; Sellam, J.; Berenbaum, F. Metabolic syndrome-associated osteoarthritis. Curr. Opin. Rheumatol. 2017, 29, 214–222. [Google Scholar] [CrossRef]
- Sampath, S.J.P.; Venkatesan, V.; Ghosh, S.; Kotikalapudi, N. Obesity, Metabolic Syndrome, and Osteoarthritis-An Updated Review. Curr. Obes. Rep. 2023, 12, 308–331. [Google Scholar] [CrossRef]
- Ma, H.; Li, X.; Zhou, T.; Sun, D.; Liang, Z.; Li, Y.; Heianza, Y.; Qi, L. Glucosamine Use, Inflammation, and Genetic Susceptibility, and Incidence of Type 2 Diabetes: A Prospective Study in UK Biobank. Diabetes Care 2020, 43, 719–725. [Google Scholar] [CrossRef]
- Francisco, V.; Pino, J.; González-Gay, M.; Lago, F.; Karppinen, J.; Tervonen, O.; Mobasheri, A.; Gualillo, O. A new immunometabolic perspective of intervertebral disc degeneration. Nat. Rev. Rheumatol. 2022, 18, 47–60. [Google Scholar] [CrossRef]
- Petakh, P.; Oksenych, V.; Kamyshnyi, A. The F/B ratio as a biomarker for inflammation in COVID-19 and T2D: Impact of metformin. Biomed. Pharmacother. 2023, 163, 114892. [Google Scholar] [CrossRef]
- Xing, X.; Wang, Y.; Pan, F.; Cai, G. Osteoarthritis and risk of type 2 diabetes: A two-sample Mendelian randomization analysis. J. Diabetes 2023, 15, 987–993. [Google Scholar] [CrossRef] [PubMed]
- Mechanick, J.I.; Apovian, C.; Brethauer, S.; Garvey, W.T.; Joffe, A.M.; Kim, J.; Kushner, R.F.; Lindquist, R.; Pessah-Pollack, R.; Seger, J.; et al. Clinical Practice Guidelines for the Perioperative Nutrition, Metabolic, and Nonsurgical Support of Patients Undergoing Bariatric Procedures—2019 Update: Cosponsored by American Association of Clinical Endocrinologists/American College of Endocrinology, the Obesity Society, American Society for Metabolic & Bariatric Surgery, Obesity Medicine Association, and American Society of Anesthesiologists—Executive Summary. Endocr. Pract. Off. J. Am. Coll. Endocrinol. Am. Assoc. Clin. Endocrinol. 2019, 25, 1346–1359. [Google Scholar]
- Blüher, M. Obesity: Global epidemiology and pathogenesis. Nat. Rev. Endocrinol. 2019, 15, 288–298. [Google Scholar] [CrossRef]
- Repchuk, Y.; Sydorchuk, L.P.; Sydorchuk, A.R.; Fedonyuk, L.Y.; Kamyshnyi, O.; Korovenkova, O.; Plehutsa, I.M.; Dzhuryak, V.S.; Myshkovskii, Y.M.; Iftoda, O.M.; et al. Linkage of blood pressure, obesity and diabetes mellitus with angiotensinogen gene (AGT 704T>C/rs699) polymorphism in hypertensive patients. Bratisl. Lek. Listy 2021, 122, 715–720. [Google Scholar] [CrossRef]
- Kamyshna, I.I.; Pavlovych, L.B.; Maslyanko, V.A.; Kamyshnyi, A.M. Analysis of the transcriptional activity of genes of neuropeptides and their receptors in the blood of patients with thyroid pathology. J. Med. Life 2021, 14, 243–249. [Google Scholar] [CrossRef]
- Yerevanian, A.; Soukas, A.A. Metformin: Mechanisms in Human Obesity and Weight Loss. Curr. Obes. Rep. 2019, 8, 156–164. [Google Scholar] [CrossRef]
- Kamyshnyi, O.; Matskevych, V.; Lenchuk, T.; Strilbytska, O.; Storey, K.; Lushchak, O. Metformin to decrease COVID-19 severity and mortality: Molecular mechanisms and therapeutic potential. Biomed. Pharmacother. 2021, 144, 112230. [Google Scholar] [CrossRef]
- Triggle, C.R.; Mohammed, I.; Bshesh, K.; Marei, I.; Ye, K.; Ding, H.; MacDonald, R.; Hollenberg, M.D.; Hill, M.A. Metformin: Is it a drug for all reasons and diseases? Metab. Clin. Exp. 2022, 133, 155223. [Google Scholar] [CrossRef]
- Petakh, P.; Kobyliak, N.; Kamyshnyi, A. Gut microbiota in patients with COVID-19 and type 2 diabetes: A culture-based method. Front. Cell. Infect. Microbiol. 2023, 13, 1142578. [Google Scholar] [CrossRef]
- Petakh, P.; Kamyshna, I.; Kamyshnyi, A. Gene expression of protein kinase AMP-activated catalytic subunit alpha 1 (PRKAA1), solute carrier family 2 member 1 (SLC2A1) and mechanistic target of rapamycin (MTOR) in metformin-treated type 2 diabetes patients with COVID-19: Impact on inflammation markers. Inflammopharmacology 2024, 32, 885–891. [Google Scholar]
- Petakh, P.; Kamyshna, I.; Oksenych, V.; Kamyshnyi, O. Metformin Alters mRNA Expression of FOXP3, RORC, and TBX21 and Modulates Gut Microbiota in COVID-19 Patients with Type 2 Diabetes. Viruses 2024, 16, 281. [Google Scholar] [CrossRef] [PubMed]
- Pavlo, P.; Kamyshna, I.; Kamyshnyi, A. Effects of metformin on the gut microbiota: A systematic review. Mol. Metab. 2023, 77, 101805. [Google Scholar] [CrossRef] [PubMed]
- Petakh, P.; Griga, V.; Mohammed, I.B.; Loshak, K.; Poliak, I.; Kamyshnyiy, A. Effects of Metformin, Insulin on Hematological Parameters of COVID-19 Patients with Type 2 Diabetes. Med. Arch. 2022, 76, 329–332. [Google Scholar] [CrossRef]
- Petakh, P.; Kamyshna, I.; Oksenych, V.; Kainov, D.; Kamyshnyi, A. Metformin Therapy Changes Gut Microbiota Alpha-Diversity in COVID-19 Patients with Type 2 Diabetes: The Role of SARS-CoV-2 Variants and Antibiotic Treatment. Pharmaceuticals 2023, 16, 904. [Google Scholar] [CrossRef]
- Solmonson, A.; DeBerardinis, R.J. Lipoic acid metabolism and mitochondrial redox regulation. J. Biol. Chem. 2018, 293, 7522–7530. [Google Scholar] [CrossRef]
- Salehi, B.; Berkay Yılmaz, Y.; Antika, G.; Boyunegmez Tumer, T.; Fawzi Mahomoodally, M.; Lobine, D.; Akram, M.; Riaz, M.; Capanoglu, E.; Sharopov, F.; et al. Insights on the Use of α-Lipoic Acid for Therapeutic Purposes. Biomolecules 2019, 9, 356. [Google Scholar] [CrossRef]
- Nguyen, H.; Pellegrini, M.V.; Gupta, V. Alpha-Lipoic Acid. In StatPearls; StatPearls Publishing: St. Petersburg, FL, USA, 2024. [Google Scholar]
- Zwierz, M.; Chabowski, A.; Sztolsztener, K. α-Lipoic acid—A promising agent for attenuating inflammation and preventing steatohepatitis in rats fed a high-fat diet. Arch. Biochem. Biophys. 2023, 750, 109811. [Google Scholar] [CrossRef]
- El-Houseiny, W.; Arisha, A.H.; Metwally, M.M.M.; Abdel-Warith, A.A.; Younis, E.M.; Davies, S.J.; Hassan, B.A.; Abd-Elhakim, Y.M. Alpha-lipoic acid suppresses gibberellic acid nephrotoxicity in Nile tilapia (Oreochromis niloticus) via modulating oxidative stress, inflammation, cytokine production, and apoptosis. Pestic. Biochem. Physiol. 2023, 196, 105598. [Google Scholar] [CrossRef]
- Shen, C.; Chen, X.; Cao, Y.; Du, Y.; Xu, X.; Wu, Q.; Lin, L.; Qin, Y.; Meng, R.; Gan, L.; et al. Alpha-Lipoic Acid Protects against Chronic Alcohol Consumption-Induced Cardiac Damage by the Aldehyde Dehydrogenase 2-Associated PINK/Parkin Pathway. J. Cardiovasc. Pharmacol. 2023, 82, 407–418. [Google Scholar]
- Abdullah Ali, M.; Naji Alhassani, A.; Kareem Hamad, B. Impacts of trelagliptin and remogliflozin alone and in combination with Alpha Lipoic Acid on cardiac function in streptozotocin-induced diabetes mellitus in rats. Cell. Mol. Biol. 2023, 69, 106–112. [Google Scholar] [CrossRef]
- Petersen Shay, K.; Moreau, R.F.; Smith, E.J.; Hagen, T.M. Is alpha-lipoic acid a scavenger of reactive oxygen species in vivo? Evidence for its initiation of stress signaling pathways that promote endogenous antioxidant capacity. IUBMB Life 2008, 60, 362–367. [Google Scholar] [CrossRef]
- Rochette, L.; Ghibu, S.; Muresan, A.; Vergely, C. Alpha-lipoic acid: Molecular mechanisms and therapeutic potential in diabetes. Can. J. Physiol. Pharmacol. 2015, 93, 1021–1027. [Google Scholar] [CrossRef]
- Cakatay, U. Pro-oxidant actions of alpha-lipoic acid and dihydrolipoic acid. Med. Hypotheses 2006, 66, 110–117. [Google Scholar] [CrossRef]
- Baicus, C.; Purcarea, A.; von Elm, E.; Delcea, C.; Furtunescu, F.L. Alpha-lipoic acid for diabetic peripheral neuropathy. Cochrane Database Syst. Rev. 2024, 1, Cd012967. [Google Scholar] [CrossRef]
- Wang, J.Q.; Ling, X.; Wang, H.J.; Chen, F.E. α-Lipoic acid chemistry: The past 70 years. RSC Adv. 2023, 13, 36346–36363. [Google Scholar] [CrossRef]
- Cronan, J.E. Lipoic acid attachment to proteins: Stimulating new developments. Microbiol. Mol. Biol. Rev. MMBR 2024, 88, e0000524. [Google Scholar] [CrossRef]
- Banihani, S.A. Role of Lipoic Acid in Testosterone Production in Males. World J. Men’s Health 2024, 42, e52. [Google Scholar] [CrossRef]
- Longhitano, L.; Distefano, A.; Amorini, A.M.; Orlando, L.; Giallongo, S.; Tibullo, D.; Lazzarino, G.; Nicolosi, A.; Alanazi, A.M.; Saoca, C.; et al. (+)-Lipoic Acid Reduces Lipotoxicity and Regulates Mitochondrial Homeostasis and Energy Balance in an In Vitro Model of Liver Steatosis. Int. J. Mol. Sci. 2023, 24, 14491. [Google Scholar] [CrossRef]
- Kabin, E.; Dong, Y.; Roy, S.; Smirnova, J.; Smith, J.W.; Ralle, M.; Summers, K.; Yang, H.; Dev, S.; Wang, Y.; et al. α-lipoic acid ameliorates consequences of copper overload by up-regulating selenoproteins and decreasing redox misbalance. Proc. Natl. Acad. Sci. USA 2023, 120, e2305961120. [Google Scholar] [CrossRef]
- Orellana-Donoso, M.; López-Chaparro, M.; Barahona-Vásquez, M.; Santana-Machuca, A.; Bruna-Mejias, A.; Nova-Baeza, P.; Valenzuela-Fuenzalida, J.J. Effectiveness of alpha-lipoic acid in patients with neuropathic pain associated with type I and type II diabetes mellitus: A systematic review and meta-analysis. Medicine 2023, 102, e35368. [Google Scholar] [CrossRef]
- Jang, H.N.; Oh, T.J. Pharmacological and Nonpharmacological Treatments for Painful Diabetic Peripheral Neuropathy. Diabetes Metab. J. 2023, 47, 743–756. [Google Scholar] [CrossRef]
- Gilron, I.; Robb, S.; Tu, D.; Holden, R.R.; Jackson, A.C.; Duggan, S.; Milev, R. Randomized, double-blind, controlled trial of a combination of alpha-lipoic acid and pregabalin for neuropathic pain: The PAIN-CARE trial. Pain 2024, 165, 461–469. [Google Scholar] [CrossRef]
- Genazzani, A.D.; Battipaglia, C.; Rusce, L.; Prampolini, G.; Aio, C.; Ricciardiello, F.; Foschi, M.; Sponzilli, A.; Semprini, E.; Petrillo, T. Alpha lipoic acid administration improved both peripheral sensitivity to insulin and liver clearance of insulin reducing potential risk of diabetes and nonalcoholic fatty liver disease in overweight/obese PCOS patients. Gynecol. Endocrinol. Off. J. Int. Soc. Gynecol. Endocrinol. 2024, 40, 2341701. [Google Scholar] [CrossRef] [PubMed]
- Zhang, W.J.; Frei, B. Alpha-lipoic acid inhibits TNF-alpha-induced NF-kappaB activation and adhesion molecule expression in human aortic endothelial cells. FASEB J. Off. Publ. Fed. Am. Soc. Exp. Biol. 2001, 15, 2423–2432. [Google Scholar]
- Roy, P.; Tomassoni, D.; Martinelli, I.; Bellitto, V.; Nittari, G.; Amenta, F.; Tayebati, S.K. Protective effects of the R-(+)-thioctic acid treatment: Possible anti-inflammatory activity on heart of hypertensive rats. BMC Complement. Med. Ther. 2024, 24, 281. [Google Scholar] [CrossRef]
- Hu, W.; Zhang, Q.; Yang, X.; Wang, Y.; Sun, L. Puerarin inhibits adhesion molecule expression in tnf-alpha-stimulated human endothelial cells via modulation of the nuclear factor kappaB pathway. Pharmacology 2010, 85, 27–35. [Google Scholar] [CrossRef]
- Kargar, H.M.P.; Noshiri, H. Protective effects of alpha-lipoic acid on anxiety-like behavior, memory and prevention of hippocampal oxidative stress in methamphetamine-treated rats. Psychopharmacology 2024, 241, 315–326. [Google Scholar] [CrossRef] [PubMed]
- Della Giustina, A.; Goldim, M.P.; Danielski, L.G.; Florentino, D.; Mathias, K.; Garbossa, L.; Oliveira Junior, A.N.; Fileti, M.E.; Zarbato, G.F.; da Rosa, N.; et al. Alpha-lipoic acid attenuates acute neuroinflammation and long-term cognitive impairment after polymicrobial sepsis. Neurochem. Int. 2017, 108, 436–447. [Google Scholar] [CrossRef] [PubMed]
Disclaimer/Publisher’s Note: The statements, opinions and data contained in all publications are solely those of the individual author(s) and contributor(s) and not of MDPI and/or the editor(s). MDPI and/or the editor(s) disclaim responsibility for any injury to people or property resulting from any ideas, methods, instructions or products referred to in the content. |
© 2024 by the authors. Licensee MDPI, Basel, Switzerland. This article is an open access article distributed under the terms and conditions of the Creative Commons Attribution (CC BY) license (https://creativecommons.org/licenses/by/4.0/).