Abstract
Background: Magnesium (Mg) is an essential element and participates in many metabolic pathways. Many studies have found a certain negative correlation between magnesium and blood glucose parameters, but the dose–response relationship between them is still a relatively narrow research field. We aim to explore the dose–response relationship between plasma and dietary Mg and type 2 diabetes (T2DM) among childbearing women in a nationally representative sample. And we will also initially explore the threshold of dietary and plasma magnesium in the prevention of T2DM and their consistency. Methods: A total of 2912 18–44 year-old childbearing women were recruited from the China Adult Chronic Disease and Nutrition Surveillance (2015). Multivariate logistic regression was used to explore the dose–response relationship between plasma and dietary Mg and glucose parameters. The threshold effect between Mg and T2DM was explored by a restricted cubic spline regression. Results: It was found that when plasma Mg was increased by 0.041 mmol/L, the risk of T2DM, impaired fasting glucose (IFG), and HbA1c-hyperglycemia was reduced by 18%, 19%, and 18%, respectively. The possible threshold value for plasma Mg to prevent the risk of T2DM was 0.87 mmol/L. Through the quality control of the sample dietary survey data, 2469 cases were finally included for dietary analysis. And the possible threshold value for dietary Mg to prevent the risk of T2DM was 408 mg/d. Taking the recommended dietary Mg intake of 330 mg/d as the reference group, when the Mg intake reached 408 mg/d, the risk of T2DM was significantly reduced. And the average plasma Mg level of the people whose dietary intake reached 408 mg/d was 0.87 mmol/L. Conclusions: These results indicate that dietary Mg and plasma Mg have good consistency on the threshold effect of glucose parameters in women of childbearing age.
1. Introduction
Magnesium is an essential element in humans [1]. As a cofactor in more than 300 enzymatic reactions, magnesium plays an important physiological role in many functions of the human body, including protein synthesis, blood sugar control, and blood pressure regulation [2]. Based on its multiple functions, a low magnesium level is associated with the occurrence and development of many chronic diseases, such as Alzheimer’s disease, insulin resistance, T2DM, and hypertension [3].
The association between hypomagnesemia and T2DM has aroused the great interest of researchers since it was first discovered by Beckett and Lewis [4] in 1959. There is evidence that the relationship between magnesium deficiency and T2DM is bidirectional. Magnesium deficiency is a common manifestation in patients with type 1 and T2DM [5,6], and magnesium deficiency may also increase the risk of diabetes [7,8].
Many studies [9,10,11] show that with the increase of blood magnesium level, the risk of T2DM is significantly reduced. And epidemiological and multicenter studies have also shown an inverse relationship between the intake of magnesium-rich foods and the risk of diabetes [12]. Although some studies have suggested that there may be a threshold between plasma magnesium and T2DM, there are very limited research reports on the specific dose–response relationship and threshold effect between magnesium and T2DM.
In this study, we intend to analyze the dose–response relationship between either dietary or plasma magnesium and T2DM through nationally representative population data. At the same time, we will preliminarily explore the consistency of the threshold effect of dietary and plasma magnesium on glucose-related parameters in Chinese childbearing women.
2. Materials and Methods
2.1. Subjects
The data for the study came from the 2015 Chinese Adult Chronic Disease and Nutrition Surveillance, a nationally representative cross-sectional survey. A stratified, multi-stage, probabilistic random selection approach was used to pick all survey participants. The sampling method was described in detail in Yu et al. [13]. Considering regional types and monitoring sites, participants of reproductive age were chosen at random from the overall population for this investigation. Samples with incomplete questionnaire responses, poor blood quality (such as hemolysis), and biological index values below the detection limit were also disregarded. This study population did not include pregnant women and nursing mothers, and this particular population was monitored in a separate study. This survey eventually comprised 2912 childbearing women. Each participant gave their written consent after being fully informed. The protocol was approved by the Ethics Committee of the National Institute of Nutrition and Health, Chinese Center for Disease Control and Prevention (No: 201519-A), and the study was carried out in line with the Declaration of Helsinki.
2.2. Basic Information and Sample Collection
Basic demographic data were gathered by consistently trained investigators using a standardized questionnaire. Nationality, education, and drinking habits were collected using a self-reported questionnaire. There were three categories for education levels: elementary (primary school and lower), medium (junior high/high school/secondary school), and advanced (junior college or above). The eastern, middle, and western parts of the district were separated. Anthropometric measures were also taken by skilled medical personnel using defined protocols. Measurements of blood pressure, waist circumference, height, and weight are part of the physical examination. Height and weight were used to determine the body mass index (BMI).
After at least 10 h of fasting, venous blood was drawn in the morning. Each blood sample was separated into an anticoagulant tube and a serum separator tube. Between 20–30 min after the blood was drawn, plasma separator tubes containing blood samples were immediately centrifuged at 3000× g for 15 min. Afterward, the plasma aliquots were separated and stored at 80 °C for further testing.
2.3. Plasma Mg and Laboratory Index Detection
An automated biochemical analyzer (Hitachi 7600, Tokyo, Japan) was used to evaluate the concentrations of serum fasting glucose, high density lipoprotein cholesterol (HDL-C), low density lipoprotein cholesterol (LDL-C), total cholesterol (TC), and triglyceride (TG). And glycated hemoglobin (HbA1c) was measured using HPLC (Waters E2695, Milford, MA, USA).
Inductively coupled plasma mass spectrometry (ICP-MS, PerkinElmer, NexION 350, Waltham, MA, USA) was used to detect the amounts of magnesium and calcium. The plasma element was measured by 0.5% (v/v) high-purity nitric acid dilution (1:20). The precision and accuracy of the analysis were checked at 10-sample intervals using the quality control samples (Seronorm, Level-2, Billingstad, Norway).
The coefficient of variation for Mg was 2.33% for between batches and 1.19% for within batches. The coefficient of variation for Ca was 1.23% for between batches and 2.62% for within batches. The recovery of Mg and Ca were 100.10% and 97.63%, respectively.
2.4. Evaluation Standards of Glucose Parameters
T2DM, impaired fasting glucose, and HbA1c hyperglycemia all satisfied the respective diagnostic standards advised by the World Health Organization in 2006 [14]. Fasting glucose ≥ 7.0 mmol/Land/or 2 h post-glucose load ≥ 11.1 mmol/L and/or HbA1c ≥ 6.5% were used to define T2DM. Fasting glucose between 6.1 and 7.0 mmol/L was referred to as impaired glucose tolerance (IFG). HbA1c levels above 6.5% are considered to be HbA1c-hyperglycemia.
2.5. Calculation and Quality Control of Dietary Magnesium
A validated food frequency questionnaire (FFQ) was used in CNHS 2015 to gather data on participants’ dietary habits during the previous 12 months [15]. The questionnaire contained 64 items on it. The edible weight was defined as the weight ingested in a single day, and the daily eating weight was determined depending on frequency (daily, weekly, monthly, or yearly). The China Food Composition Table (2018) [16] was used to determine each person’s daily intake of dietary energy, macronutrients, calcium (Ca) (mg), and magnesium (Mg). Since magnesium supplements are not common in China, this study did not take their usage into account. From the 2912 cases, the samples with complete dietary data and energy intake between 800–4000 kcal meeting the quality control requirements were selected. Finally, 2469 samples were included for follow-up analysis of dietary data. The residuals model was also used to modify dietary magnesium intake for total calorie consumption [17].
2.6. Data Analyses
Statistical analyses were performed using SPSS version 19.0, SAS 9.3, and R 4.0.3. The possible influencing factors of Mg were analyzed by a generalized additive model. After adjusting the confounding factors affecting blood glucose parameters, the dose–response relationship between blood glucose parameters and plasma magnesium concentration was evaluated by a multiple logistic regression model, which could be described as the odds ratios (ORs) and 95% confidence intervals (95% CIs). And the multiple logistic regression was also used to calculate the relationship between dietary Mg and blood glucose parameters. The threshold effect between plasma and dietary magnesium and blood glucose parameters was explored by a restricted cubic spline regression. All statistical tests were two-sided, and statistical significance was considered at p < 0.05.
3. Results
3.1. Plasma Magnesium Distribution of 2912 Childbearing Women
This study was conducted on 2912 childbearing women, after excluding the hemolysis, incomplete data, and other unqualified samples. Table 1 describes plasma magnesium concentration levels and deficiency rates under total and different blood glucose conditions. At the same time, the magnesium level and deficiency rate under different group variables are also described. The median of total magnesium in 2912 subjects was 0.86 mmol/L, and the magnesium deficiency rate was 7.73% (when the plasma magnesium level equal to or less than 0.75 mmol/L is considered as a deficiency).

Table 1.
The distribution and comparison of Mg concentrations among different groups in 2912 subjects (mmol/L).
The median values of magnesium in the NFG, IFG, and T2DM group were 0.87 mmol/L, 0.85 mmol/L, and 0.84 mmol/L respectively, indicating a downward trend; the deficiency rate of magnesium was 4.30%, 9.94%, and 16.70%, respectively, showing an upward trend.
Under different stratification factors, the distribution of plasma magnesium concentration in the NFG, IFG, and T2DM group, except for the 18–25 age group, showed a downward trend. The distribution of the magnesium deficiency rate in the NFG, IFG, and T2DM group, except for the underweight factor of BMI, all showed an upward trend, and the magnesium deficiency rate of the three groups had statistical significance in each level.
3.2. The Basic Characteristic of 2912 Subjects
Table 2 shows the clinical characteristics of 2912 Chinese women of childbearing age. The comparison among the three groups showed that height, weight, waist circumference, SBP, DBP, TG, TC, LDL-C, and UA increased with the increase of the glucose parameters levels, while HDL decreases as glucose parameters rise. The differences among all groups were statistically significant (p < 0.01).
Table 2.
Basic characteristics of the subjects.
3.3. The Associations of Plasma Magnesium Concentration with Glucose Parameters
Table 3 shows the odds ratios for T2DM, IFG, and HbA1c hyperglycemia in relation to the levels of plasma magnesium concentrations as continuous variables and is divided into quintiles based on the distribution. Lower plasma Mg concentrations were linked with higher ORs for T2DM, IFG, and HbA1c-hyperglycemia. For T2DM, IFG, and HbA1c-hyperglycemia, a magnesium level less than 0.75 mmol/L is a risk factor (all p values were less than 0.01); the odds ratios were 3.99, 4.05, and 3.90, respectively. And adjusting for additional potential confounders did not significantly alter the results. Additionally, Mg levels between 0.75 and 0.85 mmol/L are associated with an increased risk of T2DM, IFG, and HbA1c hyperglycemia (all p values were less than 0.05); the odds ratios were 1.55, 1.49, and 1.68, respectively. The results were almost unchanged after accounting for potential confounders. When plasma magnesium was used as an ordered variable, there was a tendency to decrease the risk of T2DM, IFG, and HbA1c hyperglycemia with increasing magnesium levels.
Table 3.
Associations of the plasma magnesium concentration with glucose parameters.
In the dose–response relationship, plasma magnesium was used as a continuous variable to explore the relationship between serum magnesium and abnormal blood glucose. It was found that with every 0.041 mmol/L increase in the plasma magnesium level, the risk of T2DM, IFG, and HbA1c-hyperglucose was reduced compared with people with normal blood glucose, and the OR values were 0.82, 0.81, and 0.82, respectively. In other words, it means when plasma magnesium was increased by 0.041 mmol/L, the risk of T2DM, IFG, and HbA1c-hyperglycemia was reduced to 18%, 19%, and 18%, respectively.
3.4. The Dose–Response Relationship between Plasma Mg and the Risk of T2DM
A restricted cubic spline regression was used to fit the relationship between adjusted plasma magnesium and T2DM, as shown in Figure 1. When the OR value of T2DM risk was 1, the corresponding adjusted plasma magnesium concentration was 0.865 mmol/L. The risk of T2DM increased when plasma magnesium was less than 0.865 mmol/L (OR > 1). Lines represent ORs (solid line) and 95% CIs (dashed line) based on restricted cubic splines for plasma magnesium concentrations. Confounding factors such as age, sex, BMI, drink, systolic and diastolic blood pressure, and plasma calcium were adjusted for plasma magnesium. The points where the lines coincide represent the adjusted plasma magnesium concentration when the OR value is equal to 1.
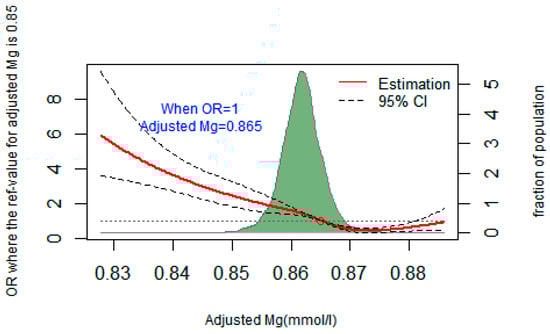
Figure 1.
Restricted cubic spline regression fitting curve of adjusted plasma magnesium and T2DM.
3.5. Daily Dietary Nutrient Intake of the Subjects
The daily dietary nutrient intake of 2469 subjects after quality screening are shown in Table 4. There was no statistical difference in nutrient intake among the three groups.
Table 4.
Daily dietary nutrient intake of the subjects.
3.6. The Associations of Dietary Magnesium Concentration with Glucose Parameters
Table 5 shows the multivariate logistic analysis of the correlations between dietary Mg intake and glucose parameters. With a dietary magnesium intake of less than 321.35 mg/d as a reference, when the Mg intake reached 439.47 mg/d, the risk of IFG was reduced. The results were consistent after adjusting the confounders. During the analysis of T2DM, it was also found that when taken, with a Mg intake of less than 321.35 mg/d as a reference, the Mg intake between 439.47–<492 mg/d would reduce the risk of T2DM.
Table 5.
Associations of the dietary magnesium concentration with glucose parameters.
3.7. The Dose–Response Relationship between Dietary Mg and the Risk of T2DM
Figure 2 illustrates the dose–response relationship between dietary Mg and T2DM using a restricted cubic spline regression. The corresponding adjusted dietary Mg was 408 mg/d when the OR value of the risk of T2DM was 1. The lines represent ORs (solid line) and 95% CIs (dashed line) based on restricted cubic splines. Dietary Mg was corrected for confounding variables such as age, sex, BMI, drink, systolic and diastolic blood pressure, and dietary calcium. The points where the lines coincide represent the adjusted dietary Mg concentration when the OR value is equal to 1.
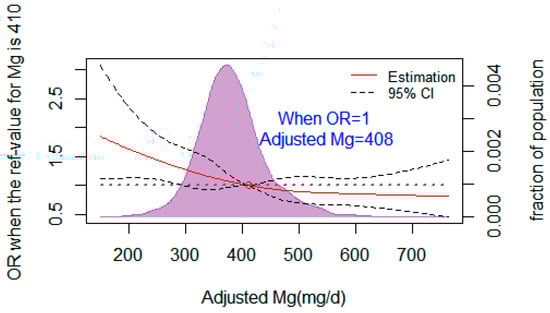
Figure 2.
Restricted cubic spline regression fitting curve of adjusted dietary magnesium and T2DM.
3.8. Consistency Analysis of Dose–Response Effect of Dietary Magnesium and Plasma Magnesium on Glucose Parameters
Table 6 shows the consistency analysis of threshold effects of dietary magnesium and plasma magnesium on glucose parameters. Taking the recommended dietary Mg intake of 330 mg/d as the reference group, when the Mg intake reached 408 mg/d, the risk of IFG and T2DM were both significantly reduced. And the average plasma magnesium level of the people whose dietary intake reached 408 mg/d was 0.87 mmol/L. These results indicate that dietary Mg and plasma Mg have good consistency on the threshold effect of glucose parameters in women of childbearing age.
Table 6.
Consistency analysis of the dose–response effect of dietary magnesium and plasma magnesium on glucose parameters.
4. Discussion
Since the 1940s, studies have shown that T2DM was associated with hypomagnesemia [18]. A low serum magnesium level was found in a large number of T2DM cohort studies [19]. Magnesium deficiency affects the blood glucose regulation and metabolic function of diabetes patients, and diabetes and insulin resistance can further deepen magnesium deficiency [8]. Therefore, fully understanding and exploring the dose–response relationship between magnesium and T2DM will not only help to further explore practical T2DM intervention measures to provide an important basis, but also provide scientific data for the prevention and treatment of hypomagnesemia in the future.
In this study, we first studied the dose–response relationship between plasma magnesium and blood glucose parameters. The distribution of plasma magnesium was divided according to five quantiles, and 0.85–0.95 was used as a reference. It was found that the risk of T2DM, IFG, and HbA1c-hyperglucose were significantly increased when the plasma Mg level was less than 0.85 mmol/L.
The results are similar to those reported in several countries. In a cross-sectional study of adults in Korea [20], the risk of hyperglycemia was significantly increased when plasma magnesium levels were lower than 0.80 mmol/L as a reference (OR = 2.28, 95% confidence interval 1.29–4.02). In the Australian population [21], when serum magnesium was lower than 0.79 mmol/L as a reference, the risk of T2DM and IFG increased to 393% and 145%, respectively. In a 10-year follow-up study of the Mexican population [22], when serum magnesium was lower than 0.74 mmol/L, the risk of T2DM and IFG increased by 254% and 149%, respectively. In a study of a middle-aged and elderly Chinese population [23], it was found that when serum magnesium was higher than 0.87 mmol/L, the risk of developing T2DM was reduced by 0.34 times. (OR = 0.34, 95% CI 0.24–0.49). Although different studies have different blood magnesium threshold values for evaluating the risk of T2DM, they all suggest a dose–effect relationship between them.
In this study, when plasma magnesium was analyzed as a continuous variable, it was found that the risk of T2DM, IFG, and HbA1c-hyperglucose was reduced by 18%, 19%, and 18% for each 0.041 mmol/L increase in plasma Mg, respectively. Data from the Nutrition and Health Monitoring of Canadian Residents [24] show that compared with people with normal blood glucose, a decrease in the serum magnesium level of 0.04–0.07 mmol/L increases the risk of T2DM. A cohort study [25] of 1999 Japanese patients followed for 15.6 years showed that for every standard deviation increase in Mg levels, the risk of T2DM was 14% lower (p = 0.04). Another study in Wuhan, Hubei Province [26], also found that the risk of T2DM and IFG decreased by 10% and 24%, respectively, for each 0.041 mmol/L increase in plasma Mg. The inconsistencies in the value of the dose–response relationship between plasma Mg and glucose parameters may be attributed to differences in the study population, the measurement of magnesium, and the prevalence of diabetes.
Many studies [27,28] believed that the lower limit of reference range for plasma Mg in T2DM patients should be 0.85 mmol/L. In a cohort of 9784 subjects followed by NHANES I for 18 years [29], it was found that the risk ratio for T2DM began to increase when Mg was less than 0.85 mmol/L. The OR value for the risk of T2DM was 1.20 when Mg was between 0.80 and 0.84 mmol/L, and 1.51 when Mg was <0.80 mmol/L. Recent studies have shown [30,31] that individuals with plasma Mg less than 0.75 mmol/L are most likely to suffer from Mg deficiency, while a plasma Mg level above 0.85 mmol/L may be the lower limit of a suitable level to maintain human health. However, the above studies are observational results based on large sample populations, rather than statistical methods to explore statistically significant thresholds. In a case-control study on serum Mg and hyperglycemia [26], the possible threshold of plasma Mg in preventing the occurrence of T2DM was explored by a restricted cubic spline regression. After adjusting for potential confounders of Mg, it was found that when Mg was lower than 0.91 mmol/L, the risk of prediabetes and T2DM was significantly reduced, and then no significant decline was observed. In this study, we found that the threshold value for plasma Mg to prevent T2DM was 0.87 mmol/L, which is similar to the threshold recommended by the above research.
Studies have also shown that there is a significant dose–response relationship between dietary Mg intake and T2DM [24,32]. Whether in American black women [33] with 115 mg/d Mg intake, in Japanese people [34] with less than 300 mg/d Mg intake, or in German people [35] with less than 350 mg/d Mg intake, dietary Mg intake is negatively correlated with the risk of T2DM. In this study, through the analysis of the FFQ among 2469 subjects, we found that the total dietary energy intake of women of childbearing age was 1964 kcal. The intake of the protein, fat, and carbohydrate were all within the normal range. By comparing the sextile, it was found that the higher the dietary magnesium intake, the lower the risk of IFG and T2DM when compared with the recommended dietary magnesium intake of Chinese people (320 mg/d). And the results were consistent with Song Y et al. [36] and Hruby et al. [37]. We also explored the possible threshold of dietary magnesium in the prevention of T2DM by a restricted cubic spline regression. It was found that there was a significant association with T2DM when the diet Mg intake was less than 408 mg/d [38]. This threshold is very close to our team’s previously published research, with a threshold of 410 mg/d for dietary magnesium in the prevention of prediabetes. However, this study is different from the results of the limited studies on the threshold effect. A meta-analysis indicated that 300 mg/day of Mg intake was the essential dose for preventing T2DM [39]. A cohort study showed that the risk of metabolic syndrome (MetS) and its components decreased significantly with the increase of magnesium intake when the magnesium intake was less than 280 mg/day [40]. However, a cross-sectional study concluded that more than 300 mg/d of Mg intake might not improve insulin sensitivity and have no influence [41]. The difference in the dietary magnesium threshold may be due to different dietary survey methods (including 3 days, 24 h, and FFQ) [38] and statistical methods, and another may be due to differences among study populations. However, unlike other studies, we further analyzed the threshold effects of dietary and plasma Mg on T2DM and found a good consistency between plasma and dietary Mg.
This study is the first to evaluate and analyze the dose–response relationship between Mg nutritional status and T2DM in Chinese women of childbearing age based on nationally representative surveillance. In this study, we also preliminarily proposed thresholds for Mg to reduce the risk of T2DM. At the same time, we found that dietary Mg and plasma Mg had a good consistency on the threshold effect of blood glucose in women of childbearing age. Many epidemiological studies have found a high prevalence of hypomagnesemia in patients with type 2 diabetes mellitus (T2DM), especially in those with poor glycemic control [7,42]. At present, a large number of literature reports show that magnesium deficiency will bring a series of adverse effects on the body and even accelerate the occurrence and development of many chronic diseases. Therefore, timely and effective assessment of magnesium nutrition status of the population is of great significance for the prevention of chronic diseases. At present, there is no systematic assessment of the magnesium nutrition status of the population based on nationally representative data in China. Randomized controlled trials (RCTS) are key to establishing and validating systems for external exposure to influence internal exposure levels and thereby improve health outcomes. Although randomized controlled trials of magnesium supplementation have been reported in the literature, there is a wide variation between studies and inconsistent results. However, there have been no randomized controlled trials of magnesium supplements in China. At present, our team has completed a study on the improvement of the blood glucose regulation effect of dietary magnesium supplementation in elderly T2DM patients with hypomagnesemia, and the study results are under review. It is believed that the causal relationship between hypomagnesemia and T2DM can be explored in the future through the cross-sectional studies, intervention studies, and future mechanism studies completed by our team.
The study also has some limitations. The first limitation of this study lies in the type of cross-sectional study, which can only observe the correlation between variables, rather than the accidental relationship between variables. And the second one is the narrow age range and population of this study make it unclear whether the relationship can be replicated in other populations.
5. Conclusions
In summary, according to the latest monitoring results in 2015, the average plasma level of magnesium in 2912 childbearing women in China is 0.86 mmol/L. It was found that when plasma Mg was increased by 0.041 mmol/L, the risk of T2DM, IFG, and HbA1c-hyperglycemia was reduced 18%, 19%, and 18%, respectively. The possible threshold value for plasma Mg to prevent the risk of T2DM was 0.87 mmol/L. And the possible threshold value for dietary Mg to prevent the risk of T2DM was 408 mg/d. With the recommended dietary magnesium intake of 330 mg/d as the reference group, the risk of T2DM decreased when the magnesium intake reached 408 mg/d and the corresponding average plasma magnesium level was 0.87 mmol/L. Dietary Mg and plasma Mg have good consistency on the threshold effect of glucose parameters in women of childbearing age. Further studies are needed to confirm our findings in more populations and clarify the mechanisms behind this relationship.
Author Contributions
Writing, H.Z.; element concentrations detection, H.Z. and J.Y.; general characteristics collection, Y.C. and X.S.; project design and supervision, L.Y. All authors have read and agreed to the published version of the manuscript.
Funding
This study was funded by Study of Diet and Nutrition Assessment and Intervention Technology (No. 2020YFC2006300) from Active Health and Aging Technologic Solutions Major Project of National Key R&D Program—Study on the Key Nutrients Requirement of Chinese Population (No. 2020YFC2006302).
Institutional Review Board Statement
The study was conducted according to the guidelines of the Declaration of Helsinki and approved by the Ethics Committee of the National Institute of Nutrition and Health, Chinese Center for Disease Control and Prevention (No: 201519-A).
Informed Consent Statement
Informed consent was obtained from all subjects involved in the study.
Data Availability Statement
Data are contained within the article.
Acknowledgments
We are grateful to all the participants in our study and all the staff working for the 2015 China Adult Chronic Disease and Nutrition Surveillance.
Conflicts of Interest
The authors declare no conflict of interest.
References
- Altura, B.M. Basic Biochemistry and Physiology of Magnesium: A Brief Review. Magnes. Trace Elem. 1991, 10, 167–171. [Google Scholar] [PubMed]
- de Baaij, J.H.F.; Hoenderop, J.G.J.; Bindels, R.J.M. Magnesium in Man: Implications for Health and Disease. Physiol. Rev. 2015, 95, 1–46. [Google Scholar] [CrossRef] [PubMed]
- Barbagallo, M.; Veronese, N.; Dominguez, L.J. Magnesium in Aging, Health and Diseases. Nutrients 2021, 13, 463. [Google Scholar] [CrossRef] [PubMed]
- Beckett, A.G.; Lewis, J.G. Serum Magnesium in Diabetes Mellitus. Clin. Sci. 1959, 18, 597–604. [Google Scholar] [PubMed]
- Pham, P.C.T.; Pham, P.M.T.; Pham, S.V.; Miller, J.M.; Pham, P.T.T. Hypomagnesemia in Patients with Type 2 Diabetes. Clin. J. Am. Soc. Nephrol. 2007, 2, 366–373. [Google Scholar] [CrossRef] [PubMed]
- De Valk, H.W. Magnesium in Diabetes Mellitus. Neth. J. Med. 1999, 54, 139–146. [Google Scholar] [CrossRef] [PubMed]
- Larsson, S.C.; Wolk, A. Magnesium Intake and Risk of Type 2 Diabetes: A Meta-Analysis. J. Intern. Med. 2007, 262, 208–214. [Google Scholar] [CrossRef] [PubMed]
- Gommers, L.M.M.; Hoenderop, J.G.J.; Bindels, R.J.M.; De Baaij, J.H.F. Hypomagnesemia in Type 2 Diabetes: A Vicious Circle? Diabetes 2016, 65, 3–13. [Google Scholar] [CrossRef] [PubMed]
- Guerreiro, V.; Maia, I.; Neves, J.S.; Salazar, D.; Ferreira, M.J.; Mendonça, F.; Silva, M.M.; Viana, S.; Costa, C.; Pedro, J.; et al. Adequate Magnesium Level as an Associated Factor of Pre-Diabetes and Diabetes Mellitus Remission in Patients with Obesity Submitted to Bariatric Surgery. Sci. Rep. 2021, 11, 21223. [Google Scholar] [CrossRef]
- Wu, C.F.; Liou, H.H.; Kuo, C.C.; Tsai, M.H.; Chang, M.Y.; Lee, Y.C.; Lin, T.M.; Hung, S.Y. The Association of Urinary Sclerostin and Renal Magnesium Handling in Type 2 Diabetic Patients with Chronic Kidney Disease. Kidney Blood Press. Res. 2021, 46, 514–522. [Google Scholar] [CrossRef]
- Zhao, B.; Zeng, L.; Zhao, J.; Wu, Q.; Dong, Y.; Zou, F.; Gan, L.; Wei, Y.; Zhang, W. Association of Magnesium Intake with Type 2 Diabetes and Total Stroke: An Updated Systematic Review and Meta-Analysis. BMJ Open 2020, 10, e032240. [Google Scholar] [CrossRef] [PubMed]
- Nadler, J.L. A New Dietary Approach to Reduce the Risk of Type 2 Diabetes? Diabetes Care 2004, 27, 270–271. [Google Scholar] [CrossRef] [PubMed]
- Yu, D.; Zhao, L.; Zhang, J.; Yang, Z.; Yang, L.; Huang, J.; Fang, H.; Guo, Q.; Xu, X.; Ju, L.; et al. China Nutrition and Health Surveys (1982–2017). China CDC Wkly. 2021, 3, 193–195. [Google Scholar] [CrossRef] [PubMed]
- World Health Organization. Classification of Diabetes Mellitus; World Health Organization: Geneva, Switzerland, 2019. [Google Scholar]
- Liu, D.; He, L.; Zhao, W. Establishment and Application of Food Frequency Questionnaire Method among Chinese. Wei Sheng Yan Jiu 2018, 47, 744–748+755. [Google Scholar] [CrossRef] [PubMed]
- Yang, Y.X. China Food Composition Tables. ACTA Nutr. SINICA 2019, 41, 426. [Google Scholar]
- Willett, W.C.; Howe, G.R.; Kushi, L.H. Adjustment for Total Energy Intake in Epidemiologic Studies. Am. J. Clin. Nutr. 1997, 65, 1220S–1228S, discussion 1229S–1231S. [Google Scholar] [CrossRef] [PubMed]
- Martin, H.E.; Wertman, M. Serum Potassium, Magnesium, and Calcium Levels in Diabetic Acidosis. J. Clin. Investig. 1947, 26, 217–228. [Google Scholar] [CrossRef] [PubMed][Green Version]
- Chaudhary, D.P.; Sharma, R.; Bansal, D.D. Implications of Magnesium Deficiency in Type 2 Diabetes: A Review. Biol. Trace Elem. Res. 2010, 134, 119–129. [Google Scholar] [CrossRef] [PubMed]
- Song, C.H.; Song, I.K.; Ju, S.Y.; Ock, S.M. Serum Magnesium Level Is Negatively Associated with Fasting Serum Glucose Level in Korean Adults. Biol. Trace Elem. Res. 2011, 143, 612–618. [Google Scholar] [CrossRef]
- Simmons, D.; Joshi, S.; Shaw, J. Hypomagnesaemia Is Associated with Diabetes: Not Pre-Diabetes, Obesity or the Metabolic Syndrome. Diabetes Res. Clin. Pract. 2010, 87, 261–266. [Google Scholar] [CrossRef]
- Guerrero-Romero, F.; Rascón-Pacheco, R.A.; Rodríguez-Morán, M.; De La Peña, J.E.; Wacher, N.; Chavez-Negrete, A.; Madero, A.; Salcedo, A.; Medina-Escobedo, C.E.; Revilla-Monsalve, C.; et al. Hypomagnesaemia and Risk for Metabolic Glucose Disorders: A 10-Year Follow-up Study. Eur. J. Clin. Investig. 2008, 38, 389–396. [Google Scholar] [CrossRef] [PubMed]
- Wei, J.; Zeng, C.; Li, X.X.; Gong, Q.Y.; Lei, G.H.; Yang, T.B. Association among Dietary Magnesium, Serum Magnesium, and Diabetes: A Cross-Sectional Study in Middle-Aged and Older Adults. J. Health Popul. Nutr. 2016, 35, 33. [Google Scholar] [CrossRef]
- Bertinato, J.; Wang, K.C.; Hayward, S. Serum Magnesium Concentrations in the Canadian Population and Associations with Diabetes, Glycemic Regulation, and Insulin Resistance. Nutrients 2017, 9, 296. [Google Scholar] [CrossRef] [PubMed]
- Hata, A.; Doi, Y.; Ninomiya, T.; Mukai, N.; Hirakawa, Y.; Hata, J.; Ozawa, M.; Uchida, K.; Shirota, T.; Kitazono, T.; et al. Magnesium Intake Decreases Type 2 Diabetes Risk through the Improvement of Insulin Resistance and Inflammation: The Hisayama Study. Diabet. Med. 2013, 30, 1487–1494. [Google Scholar] [CrossRef]
- Chen, S.; Jin, X.; Liu, J.; Sun, T.; Xie, M.; Bao, W.; Yu, X.; Yang, X.; Zhang, Y.; Zhang, H.; et al. Association of Plasma Magnesium with Prediabetes and Type 2 Diabetes Mellitus in Adults. Sci. Rep. 2017, 7, 12763. [Google Scholar] [CrossRef] [PubMed]
- von Ehrlich, B.; Barbagallo, M.; Classen, H.G.; Guerrero-Romero, F.; Mooren, F.C.; Rodriguez-Moran, M.; Vierling, W.; Vormann, J.; Kisters, K. Significance of Magnesium in Insulin Resistance, Metabolic Syndrome, and Diabetes—Recommendations of the Association of Magnesium Research e.V. Trace Elem. Electrolytes 2017, 34, 124–129. [Google Scholar] [CrossRef]
- Elin, R.J. Assessment of Magnesium Status for Diagnosis and Therapy. Magnes. Res. 2010, 23, 194–198. [Google Scholar]
- Everett, C.J.; King, D.E. Serum Magnesium and the Development of Diabetes. Nutrition 2006, 22, 679. [Google Scholar] [CrossRef]
- Nielsen, F.H. Guidance for the Determination of Status Indicators and Dietary Requirements for Magnesium. Magnes. Res. 2016, 29, 154–160. [Google Scholar] [CrossRef]
- Costello, R.B.; Elin, R.J.; Rosanoff, A.; Wallace, T.C.; Guerrero-Romero, F.; Hruby, A.; Lutsey, P.L.; Nielsen, F.H.; Rodriguez-Moran, M.; Song, Y.; et al. Perspective: The Case for an Evidence-Based Reference Interval for Serum Magnesium: The Time Has Come. Adv. Nutr. 2016, 7, 977–993. [Google Scholar] [CrossRef]
- Dong, J.Y.; Xun, P.; He, K.; Qin, L.Q. Magnesium Intake and Risk of Type 2 Diabetes: Meta-Analysis of Prospective Cohort Studies. Diabetes Care 2011, 34, 2116–2122. [Google Scholar] [CrossRef] [PubMed]
- Van Dam, R.M.; Hu, F.B.; Rosenberg, L.; Krishnan, S.; Palmer, J.R. Dietary Calcium and Magnesium, Major Food Sources, and Risk of Type 2 Diabetes in U.S. Black Women. Diabetes Care 2006, 29, 2238–2243. [Google Scholar] [CrossRef] [PubMed]
- Kirii, K.; Iso, H.; Date, C.; Fukui, M.; Tamakoshi, A. Magnesium Intake and Risk of Self-Reported Type 2 Diabetes among Japanese. J. Am. Coll. Nutr. 2010, 29, 99–106. [Google Scholar] [CrossRef] [PubMed]
- Schulze, M.B.; Schulz, M.; Heidemann, C.; Schienkiewitz, A.; Hoffmann, K.; Boeing, H. Fiber and Magnesium Intake and Incidence of Type 2 Diabetes: A Prospective Study and Meta-Analysis. Arch. Intern. Med. 2007, 167, 956–965. [Google Scholar] [CrossRef] [PubMed]
- Song, Y.; Manson, J.E.; Buring, J.E.; Liu, S. Dietary Magnesium Intake in Relation to Plasma Insulin Levels and Risk of Type 2 Diabetes in Women. Diabetes Care 2004, 27, 59–65. [Google Scholar] [CrossRef] [PubMed]
- Hruby, A.; Meigs, J.B.; O’Donnell, C.J.; Jacques, P.F.; McKeown, N.M. Higher Magnesium Intake Reduces Risk of Impaired Glucose and Insulin Metabolism and Progression from Prediabetes to Diabetes in Middle-Aged Americans. Diabetes Care 2014, 37, 419–427. [Google Scholar] [CrossRef] [PubMed]
- Yang, J.; Zhang, H.; Cao, Y.; Shan, X.; Feng, J.; Lu, J.; Cai, S.; Zhao, L.; Yang, L. The Association of Dietary Magnesium and Prediabetes in Childbearing Chinese Women: Results from China Nutrition and Health Surveillance (2015–2017). Nutrients 2022, 14, 4580. [Google Scholar] [CrossRef] [PubMed]
- Xu, T.; Chen, G.C.; Zhai, L.; Ke, K.F. Nonlinear Reduction in Risk for Type 2 Diabetes by Magnesium Intake: An Updated Meta-Analysis of Prospective Cohort Studies. Biomed. Environ. Sci. 2015, 28, 527–534. [Google Scholar] [CrossRef] [PubMed]
- Jiao, Y.; Li, W.; Wang, L.; Jiang, H.; Wang, S.; Jia, X.; Wang, Z.; Wang, H.; Zhang, B.; Ding, G. Relationship between Dietary Magnesium Intake and Metabolic Syndrome. Nutrients 2022, 14, 2013. [Google Scholar] [CrossRef]
- Ma, B.; Lawson, A.B.; Liese, A.D.; Bell, R.A.; Mayer-Davis, E.J. Dairy, Magnesium, and Calcium Intake in Relation to Insulin Sensitivity: Approaches to Modeling a Dose-Dependent Association. Am. J. Epidemiol. 2006, 164, 449–458. [Google Scholar] [CrossRef]
- Meyer, K.A.; Kushi, L.H.; Jacobs, D.R.; Slavin, J.; Sellers, T.A.; Folsom, A.R. Carbohydrates, Dietary Fiber, and Incident Type 2 Diabetes in Older Women. Am. J. Clin. Nutr. 2000, 71, 921–930. [Google Scholar] [CrossRef] [PubMed]


Disclaimer/Publisher’s Note: The statements, opinions and data contained in all publications are solely those of the individual author(s) and contributor(s) and not of MDPI and/or the editor(s). MDPI and/or the editor(s) disclaim responsibility for any injury to people or property resulting from any ideas, methods, instructions or products referred to in the content. |
© 2024 by the authors. Licensee MDPI, Basel, Switzerland. This article is an open access article distributed under the terms and conditions of the Creative Commons Attribution (CC BY) license (https://creativecommons.org/licenses/by/4.0/).