
Malnutrition-Related Health Outcomes in Older Adults with Hip Fractures: A Systematic Review and Meta-Analysis

 , , ,
, , ,
Abstract
1. Introduction
2. Materials and Methods
2.1. Search Strategy and Data Source
2.2. Eligibility Criteria
2.3. Data Extraction and Quality Assessment
2.4. Statistical Analysis
3. Results
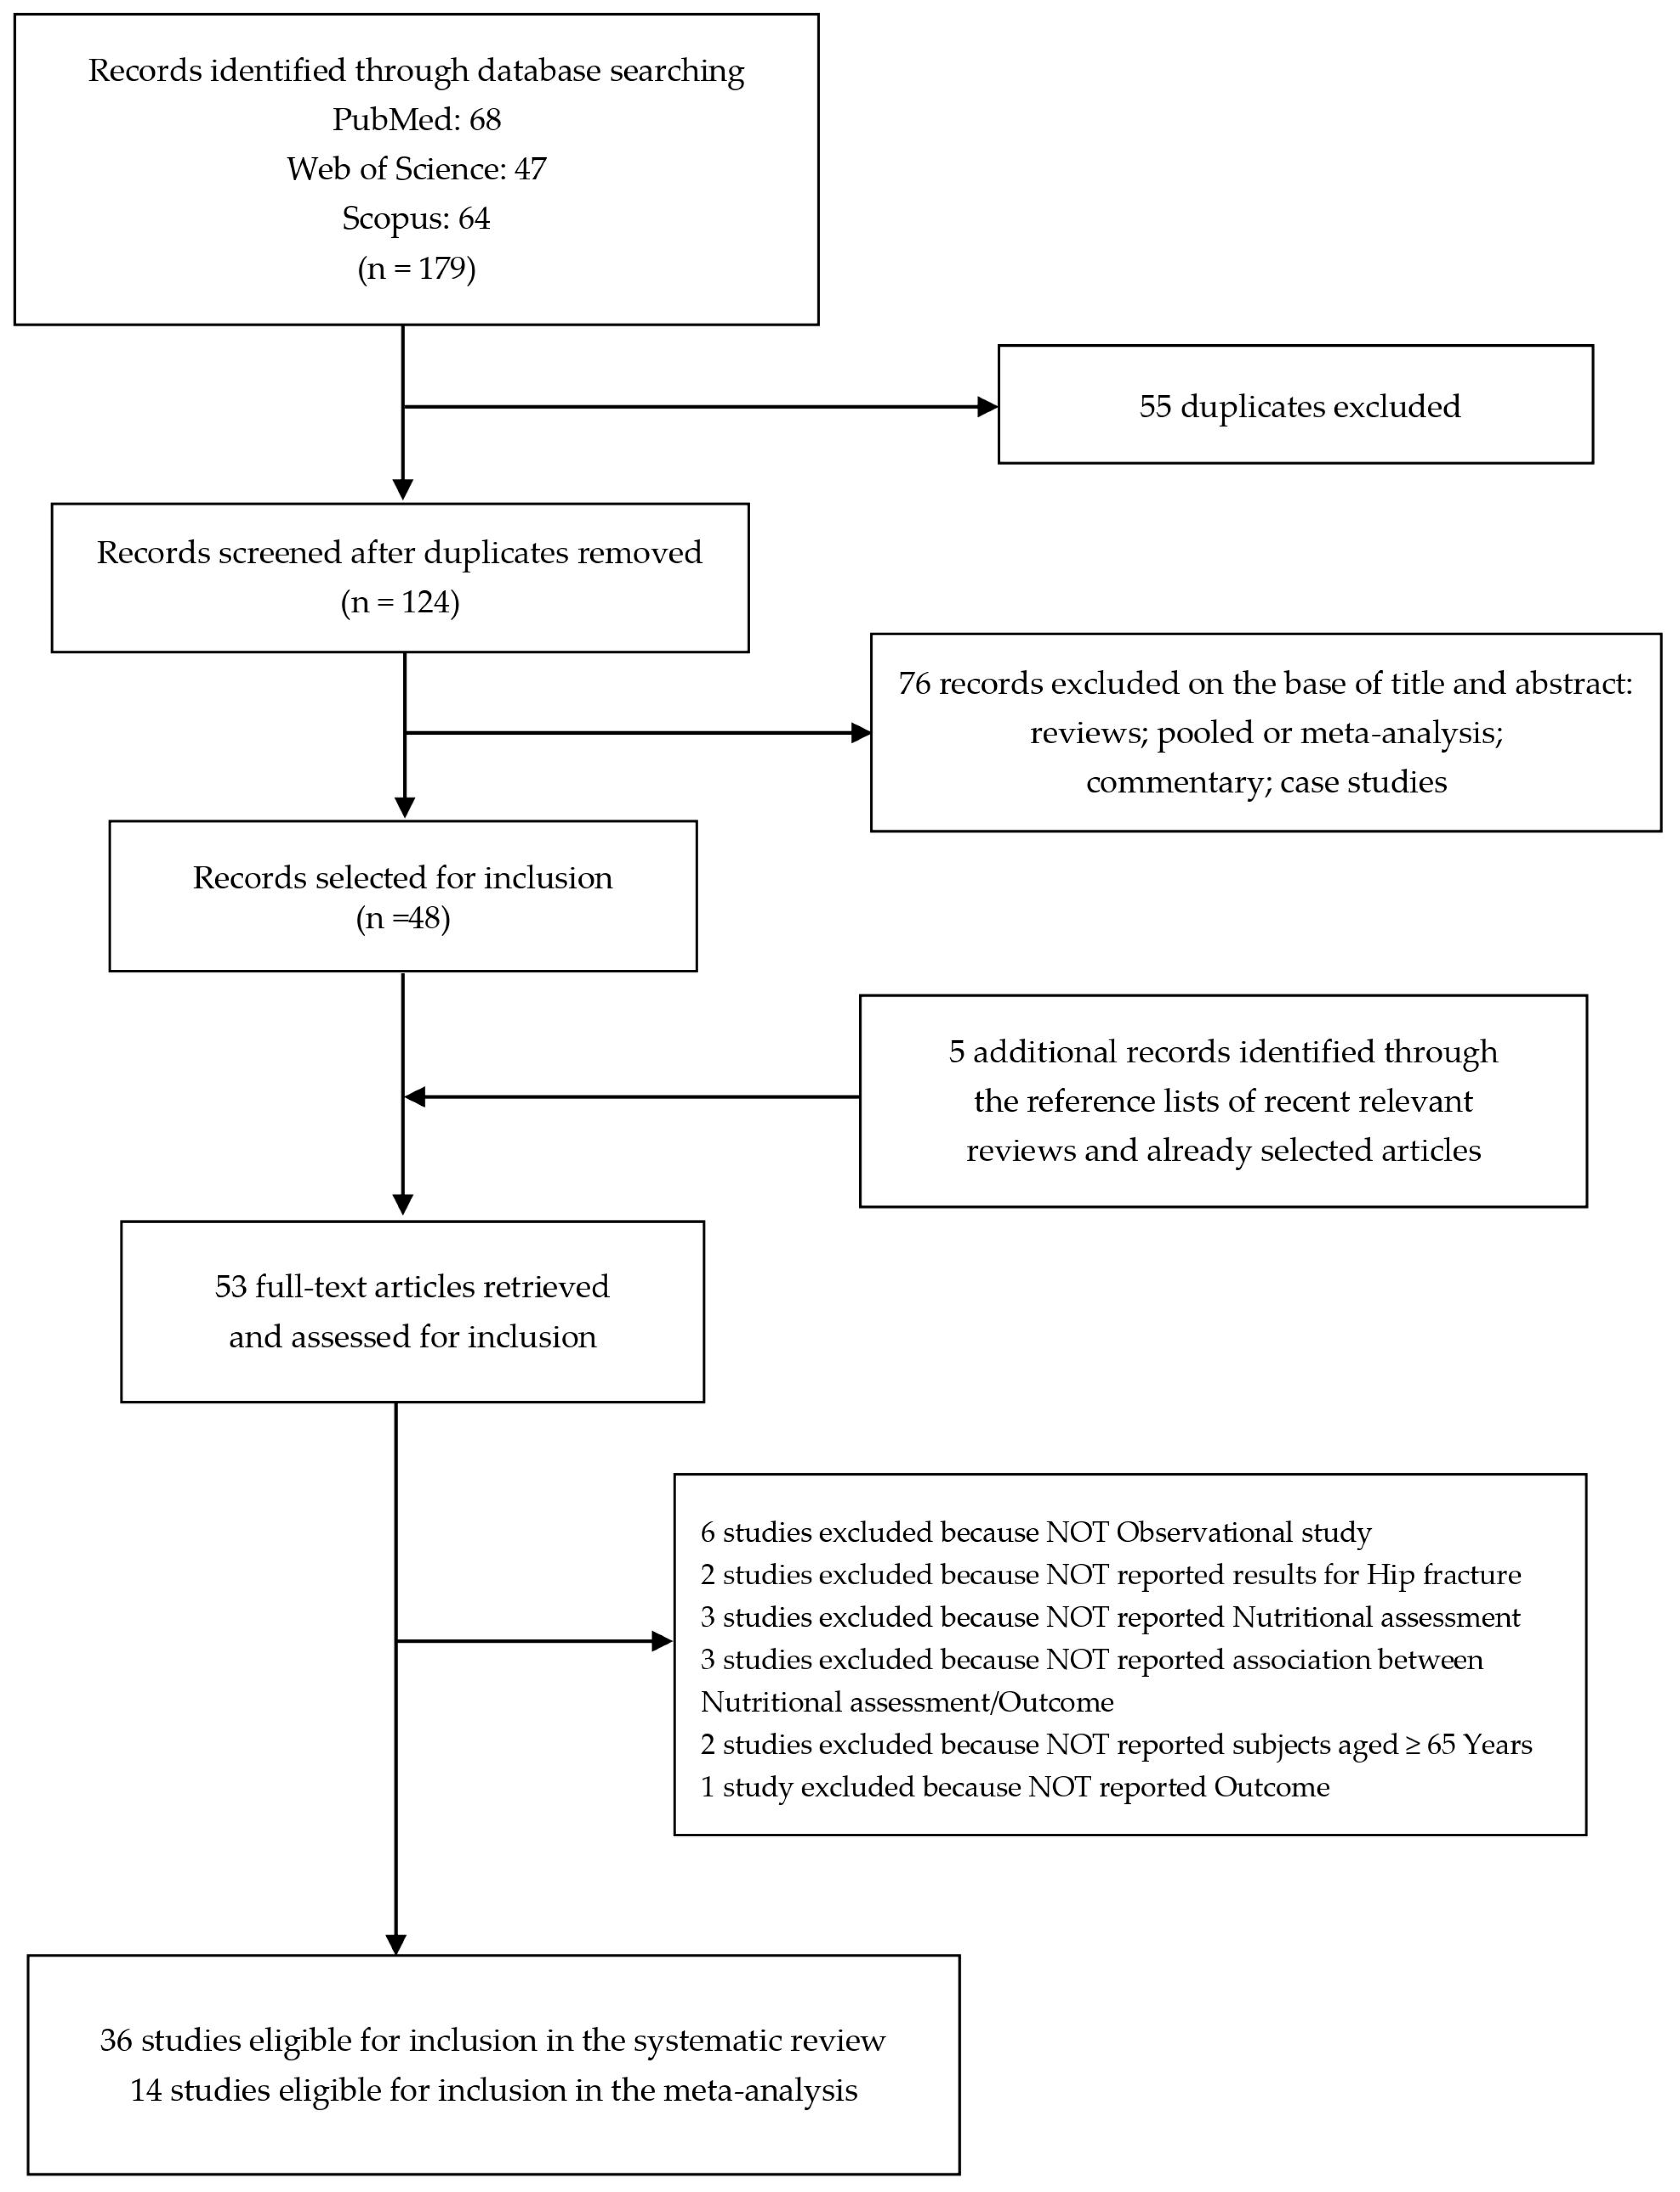
3.1. Study Selection
3.2. Study Characteristics and Quality Assessment
3.3. Meta-Analysis
3.4. Sensitivity Analysis and Publication Bias
- -
- 2.32 (95% CI 1.65–3.28; p ≤ 0.05) with I2 = 0.00%, p = 0.568, and p = 0.212 and p = 0.174 for publication bias by the Egger and Begg methods, respectively, for any health outcome after hip fracture (OR) at 1 month in cohort study;
- -
- 1.87 (95% CI 1.40–2.51; p ≤ 0.05) with I2 = 18.63%, p = 0.282, and p = 0.224 and p = 0.083 for publication bias by the Egger and Begg methods, respectively, for any health outcome after hip fracture (OR) at 3 months in cohort study;
- -
- 1.88 (95% CI 1.16–3.06; p ≤ 0.05) with I2 = 47.91%, p = 0.124, and p = 0.137 and p = 0.174 for publication bias by the Egger and Begg methods, respectively, for mortality HR after hip fracture at 4 months in cohort study;
- -
- 1.60 (95% CI 1.20–2.12; p ≤ 0.05) with I2 = 28.45%, p = 0.222, and p = 0.06 and p = 0.188 for publication bias by the Egger and Begg methods, respectively, for mortality HR after hip fracture at 1 year in cohort study.
4. Discussion
4.1. Stratification Based on the Type of Outcome
4.1.1. Mortality
4.1.2. Postoperative Complications
4.1.3. Mobility
4.1.4. Living Arrangements
4.2. Strengths and Limitations
5. Conclusions
Supplementary Materials
Author Contributions
Funding
Conflicts of Interest
References
- Ensrud, K.E. Epidemiology of fracture risk with advancing age. J. Gerontol. Ser. A 2013, 68, 1236–1242. [Google Scholar] [CrossRef] [PubMed]
- Veronese, N.; Maggi, S. Epidemiology and social costs of hip fracture. Injury 2018, 49, 1458–1460. [Google Scholar] [CrossRef] [PubMed]
- Johnell, O.; Kanis, J. Epidemiology of osteoporotic fractures. Osteoporos. Int. 2005, 16 (Suppl. S2), S3–S7. [Google Scholar] [CrossRef]
- Braithwaite, R.S.; Col, N.F.; Wong, J.B. Estimating hip fracture morbidity, mortality and costs. J. Am. Geriatr. Soc. 2003, 51, 364–370. [Google Scholar] [CrossRef] [PubMed]
- Guzon-Illescas, O.; Perez Fernandez, E.; Crespí Villarias, N.; Quirós Donate, F.J.; Peña, M.; Alonso-Blas, C.; García-Vadillo, A.; Mazzucchelli, R. Mortality after osteoporotic hip fracture: Incidence, trends, and associated factors. J. Orthop. Surg. Res. 2019, 14, 203. [Google Scholar] [CrossRef] [PubMed]
- Leal, J.; Gray, A.M.; Prieto-Alhambra, D.; Arden, N.K.; Cooper, C.; Javaid, M.K.; Judge, A.; REFReSH study group. Impact of hip fracture on hospital care costs: A population-based study. Osteoporos. Int. 2016, 27, 549–558. [Google Scholar] [CrossRef]
- Foo, M.X.E.; Wong, G.J.Y.; Lew, C.C.H. A systematic review of the malnutrition prevalence in hospitalized hip fracture patients and its associated outcomes. JPEN J. Parenter. Enteral. Nutr. 2021, 45, 1141–1152. [Google Scholar] [CrossRef]
- Millrose, M.; Schmidt, W.; Krickl, J.; Ittermann, T.; Ruether, J.; Bail, H.J.; Gesslein, M. Influence of Malnutrition on Outcome after Hip Fractures in Older Patients. J. Pers. Med. 2023, 13, 109. [Google Scholar] [CrossRef]
- Malafarina, V.; Reginster, J.Y.; Cabrerizo, S.; Bruyère, O.; Kanis, J.A.; Martinez, J.A.; Zulet, M.A. Nutritional Status and Nutritional Treatment Are Related to Outcomes and Mortality in Older Adults with Hip Fracture. Nutrients 2018, 10, 555. [Google Scholar] [CrossRef]
- Guigoz, Y. The Mini Nutritional Assessment (MNA) review of the literature—What does it tell us? J. Nutr. Health Aging 2006, 10, 466–485; discussion 485–487. [Google Scholar]
- Murphy, M.C.; Brooks, C.N.; New, S.A.; Lumbers, M.L. The use of the Mini-Nutritional Assessment (MNA) tool in elderly orthopaedic patients. Eur. J. Clin. Nutr. 2000, 54, 555–562. [Google Scholar] [CrossRef] [PubMed]
- Bouillanne, O.; Morineau, G.; Dupont, C.; Coulombel, I.; Vincent, J.P.; Nicolis, I.; Benazeth, S.; Cynober, L.; Aussel, C. Geriatric Nutritional Risk Index: A new index for evaluating at-risk elderly medical patients. Am. J. Clin. Nutr. 2005, 82, 777–783. [Google Scholar] [CrossRef] [PubMed]
- Onodera, T.; Goseki, N.; Kosaki, G. [Prognostic nutritional index in gastrointestinal surgery of malnourished cancer patients]. Nihon Geka Gakkai Zasshi 1984, 85, 1001–1005. (In Japanese) [Google Scholar]
- Ignacio de Ulíbarri, J.; González-Madroño, A.; de Villar, N.G.; González, P.; González, B.; Mancha, A.; Rodríguez, F.; Fernández, G. CONUT: A tool for controlling nutritional status. First validation in a hospital population. Nutr. Hosp. 2005, 20, 38–45. [Google Scholar] [PubMed]
- Corish, C.A.; Bardon, L.A. Malnutrition in older adults: Screening and determinants. Proc. Nutr. Soc. 2019, 78, 372–379. [Google Scholar] [CrossRef] [PubMed]
- Katsoulis, M.; Benetou, V.; Karapetyan, T.; Feskanich, D.; Grodstein, F.; Pettersson-Kymmer, U.; Eriksson, S.; Wilsgaard, T.; Jørgensen, L.; Ahmed, L.A.; et al. Excess mortality after hip fracture in elderly persons from Europe and the USA: The CHANCES project. J. Intern. Med. 2017, 281, 300–310. [Google Scholar] [CrossRef] [PubMed]
- Liu, N.; Lv, L.; Jiao, J.; Zhang, Y.; Zuo, X.L. Association between nutritional indices and mortality after hip fracture: A systematic review and meta-analysis. Eur. Rev. Med. Pharmacol. Sci. 2023, 27, 2297–2304. [Google Scholar] [CrossRef] [PubMed]
- Stroup, D.F.; Berlin, J.A.; Morton, S.C.; Olkin, I.; Williamson, G.D.; Rennie, D.; Moher, D.; Becker, B.J.; Sipe, T.A.; Thacker, S.B. Meta-analysis of observational studies in epidemiology: A proposal for reporting. Meta-analysis Of Observational Studies in Epidemiology (MOOSE) group. JAMA 2000, 283, 2008–2012. [Google Scholar] [CrossRef] [PubMed]
- Page, M.J.; McKenzie, J.E.; Bossuyt, P.M.; Boutron, I.; Hoffmann, T.C.; Mulrow, C.D.; Shamseer, L.; Tetzlaff, J.M.; Akl, E.A.; Brennan, S.E.; et al. The PRISMA 2020 statement: An updated guideline for reporting systematic reviews. J. Clin. Epidemiol. 2021, 134, 178–189. [Google Scholar] [CrossRef]
- Higgins, J.P.; Thompson, S.G. Quantifying heterogeneity in a meta-analysis. Stat. Med. 2002, 21, 1539–1558. [Google Scholar] [CrossRef]
- Higgins, J.P.; Thompson, S.G.; Deeks, J.J.; Altman, D.G. Measuring inconsistency in meta-analyses. BMJ 2003, 327, 557–560. [Google Scholar] [CrossRef] [PubMed]
- Begg, C.B.; Mazumdar, M. Operating characteristics of a rank correlation test for publication bias. Biometrics 1994, 50, 1088–1101. [Google Scholar] [CrossRef] [PubMed]
- Egger, M.; Davey Smith, G.; Schneider, M.; Minder, C. Bias in meta-analysis detected by a simple, graphical test. BMJ 1997, 315, 629–634. [Google Scholar] [CrossRef] [PubMed]
- Koval, K.J.; Maurer, S.G.; Su, E.T.; Aharonoff, G.B.; Zuckerman, J.D. The Effects of Nutritional Status on Outcome After Hip Fracture. J. Orthop. Trauma 1999, 13, 164–169. [Google Scholar] [CrossRef] [PubMed]
- Formiga, F.; Chivite, D.; Mascaró, J.; Ramón, J.M.; Pujol, R. No correlation between mininutritional assessment (short form) scale and clinical outcomes in 73 elderly patients admitted for hip fracture. Aging Clin. Exp. Res. 2005, 17, 343–346. [Google Scholar] [CrossRef] [PubMed]
- Duncan, D.G.; Beck, S.J.; Hood, K.; Johansen, A. Using Dietetic Assistants to Improve the Outcome of Hip Fracture: A Randomised Controlled Trial of Nutritional Support in an Acute Trauma Ward. Age Ageing 2006, 35, 148–153. [Google Scholar] [CrossRef]
- Olofsson, B.; Stenvall, M.; Lundström, M.; Svensson, O.; Gustafson, Y. Malnutrition in hip fracture patients: An intervention study. J. Clin. Nurs. 2007, 16, 2027–2038. [Google Scholar] [CrossRef] [PubMed]
- Guo, J.J.; Yang, H.; Qian, H.; Huang, L.; Guo, Z.; Tang, T. The Effects of Different Nutritional Measurements on Delayed Wound Healing After Hip Fracture in the Elderly. J. Surg. Res. 2010, 159, 503–508. [Google Scholar] [CrossRef] [PubMed]
- Nicholson, J.A.; Dowrick, A.S.; Liew, S.M. Nutritional status and short-term outcome of hip arthroplasty. J. Orthop. Surg. 2012, 20, 331–335. [Google Scholar] [CrossRef]
- Koren-Hakim, T.; Weiss, A.; Hershkovitz, A.; Otzrateni, I.; Grosman, B.; Frishman, S.; Salai, M.; Beloosesky, Y.-Y. The relationship between nutritional status of hip fracture operated elderly patients and their functioning, comorbidity and outcome. Clin. Nutr. 2012, 31, 917–921. [Google Scholar] [CrossRef]
- Gumieiro, D.N.; Rafacho, B.P.; Gonçalves, A.F.; Tanni, S.E.; Azevedo, P.S.; Sakane, D.T.; Carneiro, C.A.; Gaspardo, D.; Zornoff, L.A.; Pereira, G.J.; et al. Mini Nutritional Assessment predicts gait status and mortality 6 months after hip fracture. Br. J. Nutr. 2013, 109, 1657–1661. [Google Scholar] [CrossRef] [PubMed]
- Li, H.J.; Cheng, H.S.; Liang, J.; Wu, C.C.; Shyu, Y.I.L. Functional recovery of older people with hip fracture: Does malnutrition make a difference? J. Adv. Nurs. 2013, 69, 1691–1703. [Google Scholar] [CrossRef] [PubMed]
- Goisser, S.; Schrader, E.; Singler, K.; Bertsch, T.; Gefeller, O.; Biber, R.; Bail, H.J.; Sieber, C.C.; Volkert, D. Malnutrition According to Mini Nutritional Assessment Is Associated with Severe Functional Impairment in Geriatric Patients Before and up to 6 Months After Hip Fracture. J. Am. Med. Dir. Assoc. 2015, 16, 661–667. [Google Scholar] [CrossRef] [PubMed]
- Nuotio, M.; Tuominen, P.; Luukkaala, T. Association of nutritional status as measured by the Mini-Nutritional Assessment Short Form with changes in mobility, institutionalization and death after hip fracture. Eur. J. Clin. Nutr. 2016, 70, 393–398. [Google Scholar] [CrossRef] [PubMed]
- Koren-Hakim, T.; Weiss, A.; Hershkovitz, A.; Otzrateni, I.; Anbar, R.; Gross Nevo, R.F.; Schlesinger, A.; Frishman, S.; Salai, M.; Beloosesky, Y. Comparing the adequacy of the MNA-SF, NRS-2002 and MUST nutritional tools in assessing malnutrition in hip fracture operated elderly patients. Clin. Nutr. 2016, 35, 1053–1058. [Google Scholar] [CrossRef] [PubMed]
- Van Wissen, J.; van Stijn, M.F.; Doodeman, H.J.; Houdijk, A.P. Mini Nutritional Assessment and Mortality after Hip Fracture Surgery in the Elderly. J. Nutr. Health Aging 2016, 20, 964–968. [Google Scholar] [CrossRef] [PubMed]
- Niccolai, F.; Parchi, P.D.; Vigorito, A.; Pasqualetti, G.; Monzani, F.; Lisanti, M. The Correlation between Preoperative Levels of Albumin and Tlc and Mortality in Patients with Femoral Neck Fracture. J. Biol. Regul. Homeost. Agents 2016, 30, 187–191. [Google Scholar]
- Morice, A.; Reina, N.; Gracia, G.; Bonnevialle, P.; Laffosse, J.-M.; Wytrykowski, K.; Cavaignac, E.; Bonnevialle, N. Proximal Femoral Fractures in Centenarians. A Retrospective Analysis of 39 Patients. Orthop. Traumatol. Surg. Res. OTSR 2017, 103, 9–13. [Google Scholar] [CrossRef] [PubMed]
- Mazzola, P.; Ward, L.; Zazzetta, S.; Broggini, V.; Anzuini, A.; Valcarcel, B.; Brathwaite, J.S.; Pasinetti, G.M.; Bellelli, G.; Annoni, G. Association Between Preoperative Malnutrition and Postoperative Delirium After Hip Fracture Surgery in Older Adults. J. Am. Geriatr. Soc. 2017, 65, 1222–1228. [Google Scholar] [CrossRef]
- Miu, K.Y.D.; Lam, P.S. Effects of Nutritional Status on 6-Month Outcome of Hip Fractures in Elderly Patients. Ann. Rehabil. Med. 2017, 41, 1005–1012. [Google Scholar] [CrossRef]
- Inoue, T.; Misu, S.; Tanaka, T.; Sakamoto, H.; Iwata, K.; Chuman, Y.; Ono, R. Pre-fracture nutritional status is predictive of functional status at discharge during the acute phase with hip fracture patients: A multicenter prospective cohort study. Clin. Nutr. 2017, 36, 1320–1325. [Google Scholar] [CrossRef] [PubMed]
- Helminen, H.; Luukkaala, T.; Saarnio, J.; Nuotio, M.S. Changes in nutritional status and associated factors in a geriatric post-hip fracture assessment. Eur. Geriatr. Med. 2017, 8, 134–139. [Google Scholar] [CrossRef]
- Helminen, H.; Luukkaala, T.; Saarnio, J.; Nuotio, M. Comparison of the Mini-Nutritional Assessment short and long form and serum albumin as prognostic indicators of hip fracture outcomes. Injury 2017, 48, 903–908. [Google Scholar] [CrossRef]
- Ren, H.; Wu, L.; Hu, W.; Ye, X.; Yu, B. Prognostic value of the c-reactive protein/prognostic nutritional index ratio after hip fracture surgery in the elderly population. Oncotarget 2017, 8, 61365–61372. [Google Scholar] [CrossRef] [PubMed]
- Inoue, T.; Misu, S.; Tanaka, T.; Kakehi, T.; Ono, R. Acute phase nutritional screening tool associated with functional outcomes of hip fracture patients: A longitudinal study to compare MNA-SF, MUST, NRS-2002 and GNRI. Clin. Nutr. 2019, 38, 220–226. [Google Scholar] [CrossRef] [PubMed]
- Nishioka, S.; Wakabayashi, H.; Momosaki, R. Nutritional Status Changes and Activities of Daily Living after Hip Fracture in Con-valescent Rehabilitation Units: A Retrospective Observational Cohort Study from the Japan Rehabilitation Nutrition Database. J. Acad. Nutr. Diet. 2018, 118, 1270–1276. [Google Scholar] [CrossRef]
- Kramer, I.F.; Blokhuis, T.J.; Verdijk, L.B.; van Loon, L.J.C.; Poeze, M. Perioperative nutritional supplementation and skeletal muscle mass in older hip-fracture patients. Nutr. Rev. 2019, 77, 254–266. [Google Scholar] [CrossRef] [PubMed]
- Zanetti, M.; Gortan Cappellari, G.; Ratti, C.; Ceschia, G.; Murena, L.; De Colle, P.; Barazzoni, R. Poor nutritional status but not cognitive or functional impairment per se independently predict 1 year mortality in elderly patients with hip-fracture. Clin. Nutr. 2019, 38, 1607–1612. [Google Scholar] [CrossRef]
- Helminen, H.; Luukkaala, T.; Saarnio, J.; Nuotio, M.S. Predictive Value of the Mini-Nutritional Assessment Short Form (MNA-SF) and Nutritional Risk Screening (NRS2002) in Hip Fracture. Eur. J. Clin. Nutr. 2019, 73, 112–120. [Google Scholar] [CrossRef]
- Kotera, A. Geriatric Nutritional Risk Index and Controlling Nutritional Status Score can predict postoperative 180-day mortality in hip fracture surgeries. JA Clin. Rep. 2019, 5, 62. [Google Scholar] [CrossRef]
- Xing, H.; Xiang, D.; Li, Y.; Ji, X.; Xie, G. Preoperative prognostic nutritional index predicts postoperative delirium in elderly patients after hip fracture surgery. Psychogeriatrics 2020, 20, 487–494. [Google Scholar] [CrossRef] [PubMed]
- Hill-Mündel, K.; Schlegl, J.; Biesalski, H.K.; Ehnert, S.; Schröter, S.; Bahrs, C.; Nohr, D.; Nüssler, A.K.; Ihle, C. Preoperative Ascorbic Acid Levels in Proximal Femur Fracture Patients Have No Postoperative Clinical Impact, While Ascorbic Acid Levels upon Discharge Have a Major Effect on Postoperative Outcome. J. Clin. Med. 2020, 9, 66. [Google Scholar] [CrossRef] [PubMed]
- Su, W.T.; Wu, S.C.; Huang, C.Y.; Chou, S.E.; Tsai, C.H.; Li, C.; Hsu, S.Y.; Hsieh, C.H. Geriatric Nutritional Risk Index as a Screening Tool to Identify Patients with Malnutrition at a High Risk of In Hospital Mortality among Elderly Patients with Femoral Fractures-A Ret-rospective Study in a Level I Trauma Center. Int. J. Environ. Res. Public Health 2020, 17, 8920. [Google Scholar] [CrossRef] [PubMed]
- Yagi, T.; Oshita, Y.; Okano, I.; Kuroda, T.; Ishikawa, K.; Nagai, T.; Inagaki, K. Controlling nutritional status score predicts postoperative complications after hip fracture surgery. BMC Geriatr. 2020, 20, 243. [Google Scholar] [CrossRef] [PubMed]
- Sezen, Ö.; Cevik, B. The Impact of Preoperative Nutritional Status of Elderly Patients on the Postoperative Outcome: Comparison of Two Nutritional Assessment Tests and Biochemical Tools. Cyprus J. Med. Sci. 2020, 5, 333–338. [Google Scholar] [CrossRef]
- Hao, L.; Carson, J.L.; Schlussel, Y.; Noveck, H.; Shapses, S.A. Vitamin D Deficiency Is Associated with Reduced Mobility after Hip Fracture Surgery: A Prospective Study. Am. J. Clin. Nutr. 2020, 112, 613–618. [Google Scholar] [CrossRef] [PubMed]
- Feng, L.; Fu, S.; Yao, Y.; Yuan, W.; Zhao, Y. Age, Prognostic Nutritional Index, and Charlson Comorbidity Index Were Independent Risk Factors for Postoperative Long-Term Mortality in Chinese Geriatric Patients Who Sustain Hip Fracture. J. Am. Med. Dir. Assoc. 2021, 22, 2602–2603. [Google Scholar] [CrossRef] [PubMed]
- Tamamura, Y.; Matsuura, M.; Shiba, S.; Nishikimi, T. Effect of heart failure and malnutrition, alone and in combination, on rehabilitation effectiveness in patients with hip fracture. Clin. Nutr. ESPEN 2021, 44, 356–366. [Google Scholar] [CrossRef] [PubMed]
- Yokoyama, K.; Ukai, T.; Watanabe, M. Effect of nutritional status before femoral neck fracture surgery on postoperative outcomes: A retrospective study. BMC Musculoskelet. Disord. 2021, 22, 1027. [Google Scholar] [CrossRef]
- O’Leary, L.; Jayatilaka, L.; Leader, R.; Fountain, J. Poor nutritional status correlates with mortality and worse postoperative outcomes in patients with femoral neck fractures. Bone Jt. J. 2021, 103-B, 164–169. [Google Scholar] [CrossRef]
- Nishioka, S.; Wakabayashi, H.; Kayashita, J.; Taketani, Y.; Momosaki, R. Predictive validity of the Mini Nutritional Assessment Short-Form for rehabilitation patients: A retrospective analysis of the Japan Rehabilitation Nutrition Database. J. Hum. Nutr. Diet. 2021, 34, 881–889. [Google Scholar] [CrossRef]
- Han, T.S.; Yeong, K.; Lisk, R.; Fluck, D.; Fry, C.H. Prevalence and consequences of malnutrition and malnourishment in older individuals admitted to hospital with a hip fracture. Eur. J. Clin. Nutr. 2021, 75, 645–652. [Google Scholar] [CrossRef] [PubMed]
- Zhou, Y.; Wang, L.; Cao, A.; Luo, W.; Xu, Z.; Sheng, Z.; Wang, J.; Zhu, B. Modified Frailty Index Combined with a Prognostic Nutritional Index for Predicting Postoperative Complications of Hip Fracture Surgery in Elderly. J. Investig. Surg. 2022, 35, 1739–1746. [Google Scholar] [CrossRef] [PubMed]
- Feng, L.; Chen, W.; Ping, P.; Ma, T.; Li, Y.; Xu, L.; Feng, Z.; Zhao, Y.; Fu, S. Preoperative malnutrition as an independent risk factor for the postoperative mortality in elderly Chinese individuals undergoing hip surgery: A singlecenter observational study. Ther. Adv. Chronic Dis. 2022, 13, 20406223221102739. [Google Scholar] [CrossRef] [PubMed]
- Kılıç, O.; Özkalkanlı, M.Y.; Yılmaz, F.; Altay, T. Comparison of malnutrition screening tests in predicting postoperative complications in elderly patients with femur fracture. Ain-Shams J. Anesthesiol. 2022, 14, 83. [Google Scholar] [CrossRef]
- Tseng, M.Y.; Liang, J.; Wu, C.C.; Cheng, H.S.; Chen, C.Y.; Lin, Y.E.; Weng, C.J.; Yu, Y.H.; Shyu, Y.L. Influence of Nutritional Status on a Family-Centered Care Intervention for Older Adults with Cognitive Impairment following Hip-Fracture Surgery: Secondary Data Analysis of a Randomized Controlled Trial. J. Nutr. Health Aging 2022, 26, 1047–1053. [Google Scholar] [CrossRef] [PubMed]
- Fujimoto, Y.; Setoguchi, T.; Ishidou, Y.; Taniguchi, N. Low geriatric nutritional risk index is a risk f actor for death within 1 year following hip fracture. J. Orthop. Surg. 2022, 30, 10225536221103360. [Google Scholar] [CrossRef] [PubMed]
- Liu, M.; Ji, S.; Yang, C.; Zhang, T.; Han, N.; Pan, Y.; Xu, X.; Lin, J.; Sun, G. Prealbumin as a nutrition status indicator may be associated with outcomes of geriatric hip fractures: A propensity score matching and 1-year follow-up study. Aging Clin. Exp. Res. 2022, 34, 3005–3015. [Google Scholar] [CrossRef] [PubMed]
- Popp, D.; Nia, A.; Biedermann, G.; Schmoelz, L.; Silvaieh, S.; Tiefenboeck, T.M.; Hajdu, S.; Widhalm, H.K. Predictive Validity of Mortality after Surgically Treated Proximal Femur Fractures Based on Four Nutrition Scores-A Retrospective Data Analysis. Nutrients 2023, 15, 3357. [Google Scholar] [CrossRef] [PubMed]
- Cheng, X.; Chen, W.; Yan, J.; Yang, Z.; Li, C.; Wu, D.; Wang, T.; Zhang, Y.; Zhu, Y. Association of preoperative nutritional status evaluated by the controlling nutritional status score with walking independence at 180 days postoperatively: A prospective cohort study in Chinese older patients with hip fracture. Int. J. Surg. 2023, 109, 2660–2671. [Google Scholar] [CrossRef]
- Tsutsui, T.; Fujiwara, T.; Matsumoto, Y.; Kimura, A.; Kanahori, M.; Arisumi, S.; Oyamada, A.; Ohishi, M.; Ikuta, K.; Tsuchiya, K.; et al. Geriatric nutritional risk index as the prognostic factor in older patients with fragility hip fractures. Osteoporos. Int. 2023, 34, 1207–1221. [Google Scholar] [CrossRef]
- Sánchez-Torralvo, F.J.; Pérez-Del-Río, V.; García-Olivares, M.; Porras, N.; Abuín-Fernández, J.; Bravo-Bardají, M.F.; García-de-Quevedo, D.; Olveira, G. Global Subjective Assessment and Mini Nutritional Assessment Short Form Better Predict Mortality Than GLIM Malnutrition Criteria in Elderly Patients with Hip Fracture. Nutrients 2023, 15, 1828. [Google Scholar] [CrossRef]
- Berk, T.; Thalmann, M.; Jensen, K.O.; Schwarzenberg, P.; Jukema, G.N.; Pape, H.C.; Halvachizadeh, S. Implementation of a novel nursing assessment tool in geriatric trauma patients with proximal femur fractures. PLoS ONE 2023, 18, e0284320. [Google Scholar] [CrossRef] [PubMed]
- Fernández Miró, M.; Cabrejo Gavidia, V.; Carrascosa Piquer, O.; Valero Lanau, J.; Toapanta Valencia, M.; Aguado Jodar, A. Malnutrition is associated with postoperative complications in elderly patients undergoing total hip arthroplasty. Endocrinol. Diabetes Nutr. Engl. Ed. 2023, 70 (Suppl. S3), 59–66. [Google Scholar] [CrossRef]
- Rutenberg, T.F.; Gabarin, R.; Kilimnik, V.; Daglan, E.; Iflah, M.; Zach, S.; Shemesh, S. Nutritional and Inflammatory Indices and the Risk of Surgical Site Infection After Fragility Hip Fractures: Can Routine Blood Test Point to Patients at Risk? Surg. Infect. 2023, 24, 645–650. [Google Scholar] [CrossRef]
- Faust, L.M.; Lerchenberger, M.; Gleich, J.; Linhart, C.; Keppler, A.M.; Schmidmaier, R.; Böcker, W.; Neuerburg, C.; Zhang, Y. Predictive Value of Prognostic Nutritional Index for Early Postoperative Mobility in Elderly Patients with Pertrochanteric Fracture Treated with Intramedullary Nail Osteosynthesis. J. Clin. Med. 2023, 12, 1792. [Google Scholar] [CrossRef]
- Takahashi, K.; Momosaki, R.; Yasufuku, Y.; Nakamura, N.; Maeda, K. Nutritional Therapy in Older Patients with Hip Fractures Undergoing Rehabilitation: A Systematic Review and Meta-Analysis. J. Am. Med. Dir. Assoc. 2020, 21, 1364–1364.e6. [Google Scholar] [CrossRef]
- Nishioka, S.; Aragane, H.; Suzuki, N.; Yoshimura, Y.; Fujiwara, D.; Mori, T.; Kanehisa, Y.; Iida, Y.; Higashi, K.; Yoshimura-Yokoi, Y.; et al. Clinical practice guidelines for rehabilitation nutrition in cerebrovascular disease, hip fracture, cancer, and acute illness: 2020 update. Clin. Nutr. ESPEN 2021, 43, 90–103. [Google Scholar] [CrossRef] [PubMed]
- Fabiani, R.; Naldini, G.; Chiavarini, M. Dietary Patterns in Relation to Low Bone Mineral Density and Fracture Risk: A Systematic Review and Meta-Analysis. Adv. Nutr. 2019, 10, 219–236. [Google Scholar] [CrossRef] [PubMed]
- Chiavarini, M.; Naldini, G.; Fabiani, R. The Role of Diet in Osteoporotic Fracture Healing: A Systematic Review. Curr. Osteoporos. Rep. 2020, 18, 138–147. [Google Scholar] [CrossRef]
- Li, S.; Zhang, J.; Zheng, H.; Wang, X.; Liu, Z.; Sun, T. Prognostic Role of Serum Albumin, Total Lymphocyte Count, and Mini Nutritional Assessment on Outcomes After Geriatric Hip Fracture Surgery: A Meta-Analysis and Systematic Review. J. Arthroplast. 2019, 34, 1287–1296. [Google Scholar] [CrossRef]
- Hung, K.C.; Chiu, C.C.; Hsu, C.W.; Ho, C.N.; Ko, C.C.; Chen, I.W.; Sun, C.K. Association of preoperative prognostic nutritional index with risk of postoperative delirium: A systematic review and meta-analysis. Front. Med. 2023, 9, 1017000. [Google Scholar] [CrossRef] [PubMed]
- Fairhall, N.J.; Dyer, S.M.; Mak, J.C.; Diong, J.; Kwok, W.S.; Sherrington, C. Interventions for improving mobility after hip fracture surgery in adults. Cochrane Database Syst. Rev. 2022, 9, CD001704. [Google Scholar] [CrossRef] [PubMed]
- Oremus, M.; Oremus, C.; Hall, G.B.; McKinnon, M.C.; ECT & Cognition Systematic Review Team. Inter-rater and test-retest reliability of quality assessments by novice student raters using the Jadad and Newcastle-Ottawa Scales. BMJ Open 2012, 2, e001368. [Google Scholar] [CrossRef] [PubMed]
- Hartling, L.; Milne, A.; Hamm, M.P.; Vandermeer, B.; Ansari, M.; Tsertsvadze, A.; Dryden, D.M. Testing the Newcastle Ottawa Scale showed low reliability between individual reviewers. J. Clin. Epidemiol. 2013, 66, 982–993. [Google Scholar] [CrossRef] [PubMed]
- Luchini, C.; Stubbs, B.; Solmi, M.; Veronese, N. Assessing the quality of studies in meta-analyses: Advantages and limitations of the Newcastle Ottawa Scale. World J. Meta-Anal. 2017, 5, 80–84. [Google Scholar] [CrossRef]
- Bellelli, G.; Mazzola, P.; Corsi, M.; Zambon, A.; Corrao, G.; Castoldi, G.; Zatti, G.; Annoni, G. The combined effect of ADL impairment and delay in time from fracture to surgery on 12-month mortality: An observational study in orthogeriatric patients. J. Am. Med. Dir. Assoc. 2012, 13, 664.e9–664.e14. [Google Scholar] [CrossRef]
- Hip Fracture: Management; National Institute for Health and Care Excellence (NICE): London, UK, 2023; Available online: https://www.nice.org.uk/guidance/cg124 (accessed on 26 October 2023).


| Author Year Country [Ref] | Study Design | Population Sample Size Period Age (y) Sex (M%) | Pre-Fracture Conditions: Comorbidities, Living, Mobility | NA
| Fracture Management | OUTCOMES (Follow-up)
| OR/RR/HR (95% IC) | Matched or Adjusted Variables | NOS | Calculated OR (95% IC)—Unadjusted |
|---|---|---|---|---|---|---|---|---|---|---|
| Nuotio 2015 Finland [34] | Prospective | 472 patients Period: January 2010–December 2012 Age > 65 M: 24.8% | Patients unable to move 2.3%, living in an institution 14% | MNA-SF At baseline: At risk 42% Malnourished 9% | Hip fracture Surgery | Mobility 4 m Living arrangements 4 m Mortality 4 m | Ref = Normal At risk OR = 2.03 (1.24–3.31) Malnourished OR = 2.32 (0.91–5.89) At risk OR = 2.42 (1.25–4.66) Malnourished OR = 6.10 (2.01–18.5) At risk HR = 1.32 (0.77–2.26) Malnourished HR = 2.16 (1.07–4.34) | Age, sex, ASA grade, pre-fracture memory disorder, and pre-fracture living arrangements | 8 | At risk OR = 3.18 (1.81–5.68) Malnourished OR = 5.22 (2.22–11.90) |
| Van Wissen 2015 The Netherlands [36] | Retrospective | 226 patients Period: March 2008–July 2010 Age > 75 M: 26.9% | - | MNA-LF At baseline: At risk 27% Malnourished 5% | Hip fracture Surgery | Mortality in hospital 12 m | Ref = Normal At risk OR = 1.9 (0.7–5.4) Malnourished OR = 4.4 (1.0–20.4) At risk HR = 1.6 (0.9–3.0) Malnourished HR = 2.7 (1.1–7.0) | Age and sex | 8 | At risk OR = 1.14 (0.51–2.50) Malnourished OR = 2.85 (0.63–12.10) |
| Mazzola 2017 Italy [39] | Prospective | 415 patients Period: September 2012–April 2016 Age > 70 (mean 84.0 ± 6.6) M: 25.5% | History of dementia 17.8%, psychotropic drugs 57.3% | MNA-SF At baseline: At risk 44.6% Malnourished 18.8% | Hip fracture Surgery | Complications (Postoperative delirium, 7 days) | Ref = Normal At risk OR = 2.5 (1.3–4.7) Malnourished OR = 3.0 (1.4–6.2) | Age, sex, CCI, ADL, MMSE score, history of dementia, psychotropic drug use, and ASA grade | 9 | |
| Helminen 2017 Finland [43] | Prospective | 594 patients Period: December 2011–November 2014 Mean age: 84 (65–100) M: 28.5% | Pre-fracture diagnosis of memory disorder 32%, independent mobility 51%, living in own home 72%, ASA grade > 3 84.5% | MNA-SF At baseline: At risk 40% Malnourished 7% ___________ MNA-LF At baseline: At risk 58% Malnourished 7% | Hip fracture Surgery | Mobility 1 m 4 m 12 m Living arrangements 1 m 4 m 12 m Mortality 1 m 4 m 12 m _________________ Mobility 1 m 4 m 12 m Living arrangements 1 m 4 m 12 m Mortality 1 m 4 m 12 m | Ref = Normal At risk OR = 0.51 (0.33–0.79) Malnourished OR = 0.98 (0.39–2.46) At risk OR = 1.31 (0.87–1.98) Malnourished OR = 1.64 (0.68–3.95) At risk OR = 1.44 (0.91–2.29) Malnourished OR = 1.99 (0.70–5.67) At risk OR = 1.10 (0.71–1.70) Malnourished OR = 3.85 (1.44–10.3) At risk OR = 1.59 (0.91–2.77) Malnourished OR = 8.20 (2.70–24.9) At risk OR = 1.38 (0.79–2.43) Malnourished OR = 7.70 (2.17–27.3) At risk HR = 1.64 (0.92–2.95) Malnourished HR = 2.80 (1.24–6.33) At risk HR = 1.90 (1.26–2.87) Malnourished HR = 2.76 (1.51–5.05) At risk HR = 1.88 (1.32–2.69) Malnourished HR = 2.95 (1.75–4.98) ____________________ At risk OR = 0.93 (0.6–1.45) Malnourished OR = 0.83 (0.32–2.09) At risk OR = 1.84 (1.21–2.79) Malnourished OR = 2.40 (0.94–6.12) At risk OR = 1.88 (1.18–2.99) Malnourished OR = 3.28 (0.97–11.0) At risk OR = 1.12 (0.74–1.71) Malnourished OR = 2.43 (0.89–6.61) At risk OR = 1.67 (0.96–2.90) Malnourished OR = 4.77 (1.51–15.1) At risk OR = 1.25 (0.73–2.14) Malnourished OR = 4.19 (1.05–16.6) At risk HR = 5.03 (1.77–14.4) Malnourished HR = 10.6 (3.20–34.9) At risk HR = 2.92 (1.64–5.19) Malnourished HR = 4.69 (2.23–9.86) At risk HR = 2.73 (1.70–4.40) Malnourished HR = 5.11 (2.75–9.50) | Age, sex, ASA grade, and fracture type | 8 | At risk OR = 2.45 (1.30–4.71) Malnourished OR = 4.26 (1.56–10.8) At risk OR = 2.93 (1.84–4.70) Malnourished OR = 4.64 (2.11–9.92) At risk OR = 2.77 (1.82–4.23) Malnourished OR = 5.20 (2.49–10.8) At risk OR = 7.83 (2.79–30.3) Malnourished OR = 18.3 (4.78–83.6) At risk OR = 4.88 (2.65–9.54) Malnourished OR = 9.08 (3.54–23.0) At risk OR = 4.27 (2.54–7.43) Malnourished OR = 11.06 (4.69–26.0) |
| Helminen 2019 Finland [49] | Prospective | 265 patients Period: November 2015–March 2017 Mean age: 84 (65–103) M: 33.3% | Diagnosis of memory disorder 32%, independent mobility 91%, living in own home 73%, ASA grade >3 83.8% | MNA-SF At baseline: At risk 40% Malnourished 7% | Hip fracture Surgery | Mobility 4 m Mortality 4 m | Ref = Normal At risk OR = 1.63 (0.86–3.07) At risk HR = 1.38 (0.68–2.82) Malnourished HR = 4.37 (1.77–10.8) | Age, sex, ASA, and fracture type Age, sex, ASA and fracture type, mobility level, and living arrangements at baseline | 8 | At risk OR = 2.42 (1.11–5.37) Malnourished OR = 11.16 (3.28–37.8) |
| Xing 2020 China [51] | Prospective | 163 patients Period: March 2014–April 2017 Age ≥ 65 (mean 72) M: 43% | ASA grade 3–4 36.8% | PNI | Hip fracture Surgery | Complications (Postoperative delirium, 7 days) | Ref = PNI-high group PNI-low group OR = 2.88 (1.25–6.64) | Age, pre-operative MMSE score, duration of operation, type of anesthesia, Hb, albumin, and lymphocyte count | 7 | |
| Su 2020 Taiwan [53] | Retrospective | 678 patients Period: January 2009–December 2019 Age range: 69–89 M: 34.2% | DM 34.5%, HTN 66%, CAD 13.4%, CVA 13%, ESRD 5.3% | GNRI At baseline: Low risk 18.1% Moderate risk 26.4% Severe risk 18.7% | Femoral fracture Any treatment | Mortality in hospital | Ref = Normal Low risk OR = 0.4 (0.07–2.05) Moderate risk OR = 3.7 (0.75–18.29) Severe risk OR = 6.3 (1.34–29.37) | Age, sex, pre-existing comorbidities, and injury severity | 9 | |
| Hao 2020 USA [56] | Prospective | 290 patients Period: 2004–2009 Mean age: 82 ± 7 M: 27% | ASA grade mean: 2.9 ± 0.6 | GNRI At baseline: Some risk 33% High risk 34% | Hip fracture Surgery | Mobility Free walking ability 1 m 2 m Mortality 2 m | Ref = High risk No risk OR = 1.57 (0.88–2.82) No risk OR = 1.02 (0.54–1.19) No risk OR = 0.68 (0.21–2.25) | Age and sex | 8 | Ref = No risk Decreased walking ability High risk OR = 1.64 (0.89–3.00) High risk OR = 1.08 (0.57–2.03) High risk OR = 1.47 (0.44–4.76) |
| Feng 2022 China [64] | Prospective | 195 patients Period: January 2012–December 2018 Mean age: 78 (70–90) M: 21.2% | HTN 49.2%, DM 25.1%, CAD 18.5%, arrhythmia 21%, CVA 19%, DVT 6.7%, pulmonary disease 11.3% | PNI At baseline: At risk/ malnourished 13.3% | Hip fracture Surgery | Survival (Long-term postoperative: mean follow-up 1339 ± 610 days) | Ref = Normal At risk/malnourished HR = 0.269 (0.085–0.859) | - | 7 | Mortality At risk/malnourished HR = 3.72 (1.16–11.76) At risk/malnourished OR = 2.68 (0.98–6.94) |
| Fujimoto 2022 Japan [67] | Retrospective | 108 patients Period: February–July 2007 Mean age: 84 (78–89) M: 21.3% | Pre-injury dementia 44.4% | GNRI At baseline: Mean: 92.8 ±8.62 | Hip fracture Surgery | Survival 12 m | Lower GNRI OR = 0.80 (0.68–0.93) | - | 7 | Mortality Lower GNRI OR = 1.25 (1.08–1.45) |
| Liu 2022 China [68] | Prospective | 546 patients Period: December 2017–May 2021 Mean age: 75.19 ± 10.23 M: 31.3% | CCI > 4 24.4%, HTN 51.1%, polytrauma 14.1% | GNRI At baseline: Low/ moderate/ severe risk 43.8% ___________ PNI At baseline: Moderate/ high risk 52.9% | Hip fracture Surgery | Mobility Free walking ability 3 m Mortality 12 m ________________ Mortality 12 m | Ref = Normal Low/moderate/severe risk OR = 0.602 (0.383–0.947) Low/moderate/severe risk HR = 1.467 (0.937–2.297) ___________________ Ref = Low risk Moderate/high risk HR = 1.295 (0.814–2.060) | Age, type of fracture, CCI, gout, HTN, and Hb | 8 | Decreased walking ability Low/moderate/severe risk OR = 1.48 (0.85–2.58) Low/moderate/ severe risk OR = 1.35 (0.69–2.62) __________________ Moderate/high risk OR = 1.45 (0.73–2.92) |
| Popp 2023 Austria [69] | Retrospective | 1080 patients Period: January 2018–November 2019 Mean age: 81.1 M: 30.5% | - | MNA-SF At baseline: At risk 41.2% Malnourished 14.54% | Proximal femur fracture Surgery | Mortality 1 m 3 m 6 m 12 m | Ref = Normal At risk OR = 1.68 (p > 0.05) Malnourished OR = 5.03 (p < 0.01) At risk OR = 2.35 (p < 0.01) Malnourished OR = 7.28 (p < 0.01) At risk OR = 2.73 (p < 0.01) Malnourished OR = 7.44 (p < 0.01) At risk OR = 3.35 (p < 0.01) Malnourished OR = 7.77 (p < 0.01) | - | 7 | 95% IC were obtained from data extracted from the original text |
| Cheng 2023 China [70] | Prospective | 1958 patients Period: October 2014–April 2019 Mean age: 76 (69–83) M: 33% | ASA 3–4 47.9%, CCI ≥ 3 8.7%, HTN 53.9%, DM 24.5%, CVA 35.6%, heart disease 33.5%, kidney disease 5.6%, surgical history 31.5% | CONUT At baseline: Moderate/ severe malnutrition 51.3% | Hip fracture Surgery | Mobility 6 m | Ref = Normal/mild malnutrition Moderate/severe malnutrition RR = 1.42 (1.12–1.80) | Operation type, anesthesia type, surgical duration, and perioperative blood transfusion | 8 | OR = 1.36 (1.07–1.74) |
| Sánchez-Torralvo 2023 Spain [72] | Prospective | 300 patients Period: September 2019–February 2021 Age > 65 (mean 82.9 ± 7.1) M: 20.7% | Previous fracture 11.3%, CCI mean: 5.67 ± 1.91 | MNA-SF At baseline: At risk 42% Malnourished 37.3% | Hip fracture Any treatment | Mortality 3 m 6 m 12 m | Ref = Normal At risk/malnourished OR = 6.36 (0.79–51.06) At risk/malnourished OR = 5.71 (1.28 25.36) At risk/malnourished OR = 3.81 (1.25 11.57) | Age, sex, and CCI | 9 |
| Combined Risk Estimate a | Test of Heterogeneity | Publication Bias | ||||||
|---|---|---|---|---|---|---|---|---|
| N. b | Value (95% CI) | p | Q | I2% | p | p (Egger Test) | p (Begg Test) | |
| Any health outcome after hip fracture (OR) | ||||||||
| ALL (ALL + art 64, 67, 70) | 75 | 2.42 (2.07–2.83) | <0.01 | 526.17 | 85.94 | <0.01 | <0.01 | 0.087 |
| ALL >75 y (ALL + art 67) | 19 | 2.43 (1.71–3.44) | <0.01 | 143.84 | 87.44 | <0.01 | 0.073 | 0.600 |
| Period ≤ 1 month ALL At Risk Malnourished | 23 9 9 | 1.70 (1.36–2.13) 1.12 (0.93–1.36) 3.01 (1.75–5.17) | <0.01 0.233 <0.01 | 106.02 28.14 21.97 | 79.25 71.57 63.59 | <0.01 <0.01 0.005 | <0.01 0.211 0.516 | 0.170 0.118 0.677 |
| Cohort | 16 | 1.49 (1.19–1.87) | <0.01 | 74.48 | 79.86 | <0.01 | 0.005 | 0.013 |
| Case-control | 7 | 2.61 (1.44–4.75) | 0.002 | 11.41 | 47.42 | 0.076 | 0.865 | 0.652 |
| ALL >75 y | 5 | 2.39 (1.45–3.93) | 0.001 | 7.00 | 42.85 | 0.136 | 0.538 | 0.142 |
| Period ≤ 3 months ALL At Risk Malnourished | 29 10 10 | 1.86 (1.50–2.32) 1.21 (0.99–1.49) 3.39 (2.00–5.73) | <0.01 0.060 <0.01 | 160.51 32.52 29.74 | 82.56 76.01 69.74 | <0.01 <0.01 <0.01 | <0.01 0.106 0.627 | 0.268 0.152 0.788 |
| Cohort | 20 | 1.48 (1.20–1.81) | <0.01 | 79.13 | 75.99 | <0.01 | 0.001 | 0.012 |
| Case-control | 9 | 3.03 (1.82–5.05) | <0.01 | 21.59 | 62.95 | 0.006 | 0.560 | 0.532 |
| ALL >75 y | 10 | 2.29 (1.50–3.51) | <0.01 | 31.42 | 71.35 | <0.01 | 0.978 | 0.531 |
| Period ≤ 4 months ALL At Risk Malnourished | 50 21 20 | 2.29 (1.90–2.75) 1.67 (1.37–2.02) 3.90 (2.82–5.40) | <0.01 <0.01 <0.01 | 306.96 117.99 45.10 | 84.04 83.05 57.87 | <0.01 <0.01 0.001 | <0.01 <0.01 0.931 | 0.076 0.156 0.399 |
| Cohort | 41 | 2.15 (1.78–2.59) | <0.01 | 239.40 | 83.29 | <0.01 | <0.01 | 0.004 |
| Case-control | 9 | 3.03 (1.82–5.05) | <0.01 | 21.59 | 62.95 | 0.006 | 0.560 | 0.532 |
| Period ≤ 6 months ALL At Risk Malnourished | 53 22 21 | 2.40 (1.99–2.91) 1.71 (1.41–2.09) 4.08 (2.98–5.58) | <0.01 <0.01 <0.01 | 366.79 132.07 50.36 | 85.82 84.10 60.29 | <0.01 <0.01 <0.01 | <0.01 <0.01 0.456 | 0.131 0.195 0.763 |
| Cohort | 42 | 2.17 (1.80–2.62) | <0.01 | 243.48 | 83.16 | <0.01 | <0.01 | 0.005 |
| Case-control | 11 | 3.36 (2.20–5.14) | <0.01 | 31.39 | 68.14 | 0.001 | 0.487 | 0.392 |
| ALL >75 y | 12 | 2.62 (1.75–3.92) | <0.01 | 48.97 | 77.54 | <0.01 | 0.626 | 0.681 |
| Period ≤ 12 months ALL At Risk Malnourished | 72 30 29 | 2.50 (2.11–2.97) 1.80 (1.50–2.16) 4.35 (3.38–5.62) | <0.01 <0.01 <0.01 | 520.76 200.53 63.71 | 86.37 85.54 56.05 | <0.01 <0.01 <0.01 | <0.01 <0.01 0.128 | 0.212 0.498 0.499 |
| Cohort | 57 | 2.28 (1.93–2.71) | <0.01 | 335.57 | 83.31 | <0.01 | <0.01 | 0.004 |
| Case-control | 15 | 3.34 (2.34–4.77) | <0.01 | 50.23 | 72.13 | <0.01 | 0.290 | 0.400 |
| ALL >75 y | 18 | 2.55 (1.83–3.57) | <0.01 | 81.72 | 79.20 | <0.01 | 0.197 | 0.472 |
| Mobility (OR)—Cohort | ||||||||
| ALL (ALL + art 70) | 19 | 1.40 (1.16–1.69) | <0.01 | 36.97 | 51.31 | 0.005 | 0.383 | 0.248 |
| Period ≤ 1 month ALL At Risk Malnourished | 5 2 2 | 0.89 (0.58–1.37) 0.69 (0.38–1.24) 0.90 (0.47–1.74) | 0.592 0.213 0.762 | 9.99 3.60 0.06 | 59.95 72.22 <0.01 | 0.041 0.058 0.804 | 0.543 - - | 1.00 - - |
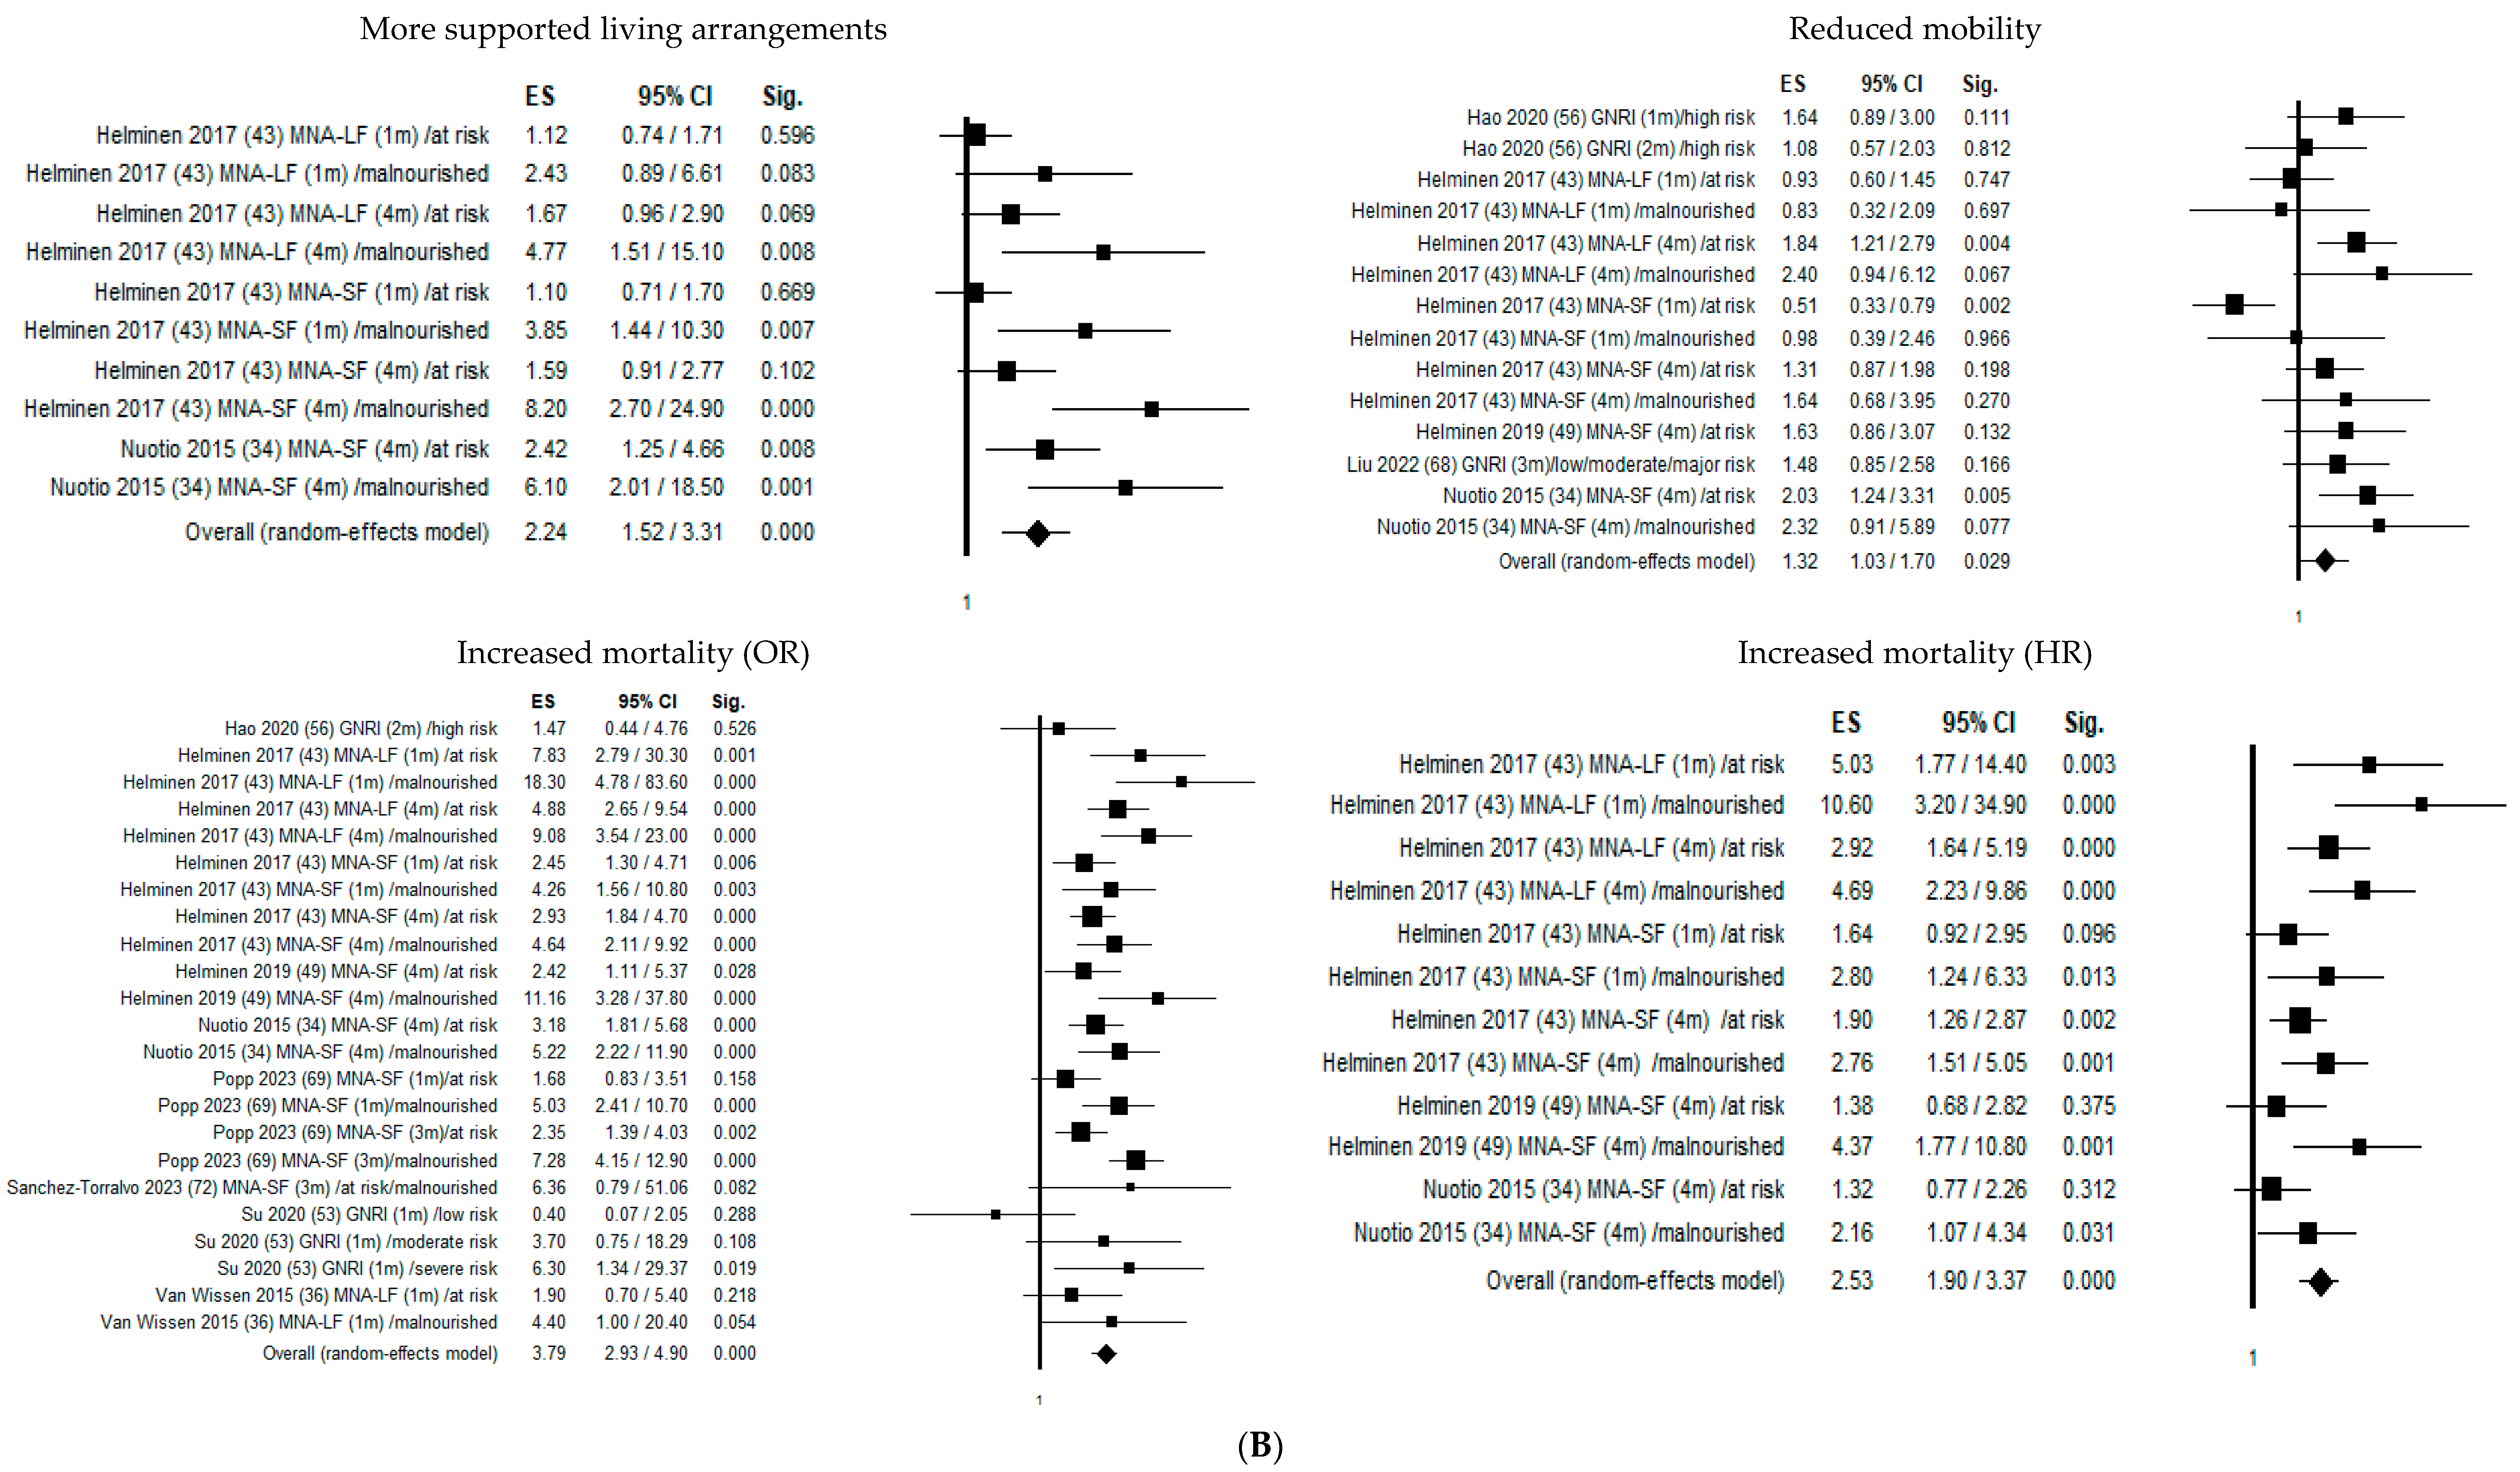
| Period ≤ 4 months ALL At Risk Malnourished | 14 6 5 | 1.32 (1.03–1.70) 1.24 (0.81–1.89) 1.49 (0.98–2.28) | 0.029 0.331 0.062 | 31.86 25.54 4.19 | 59.19 80.42 4.60 | 0.003 <0.01 0.381 | 0.440 0.649 0.966 | 0.784 0.573 1.00 |
| ALL >75 y | 3 | 1.40 (0.99–1.97) | 0.055 | 0.94 | <0.01 | 0.624 | 0.652 | 0.602 |
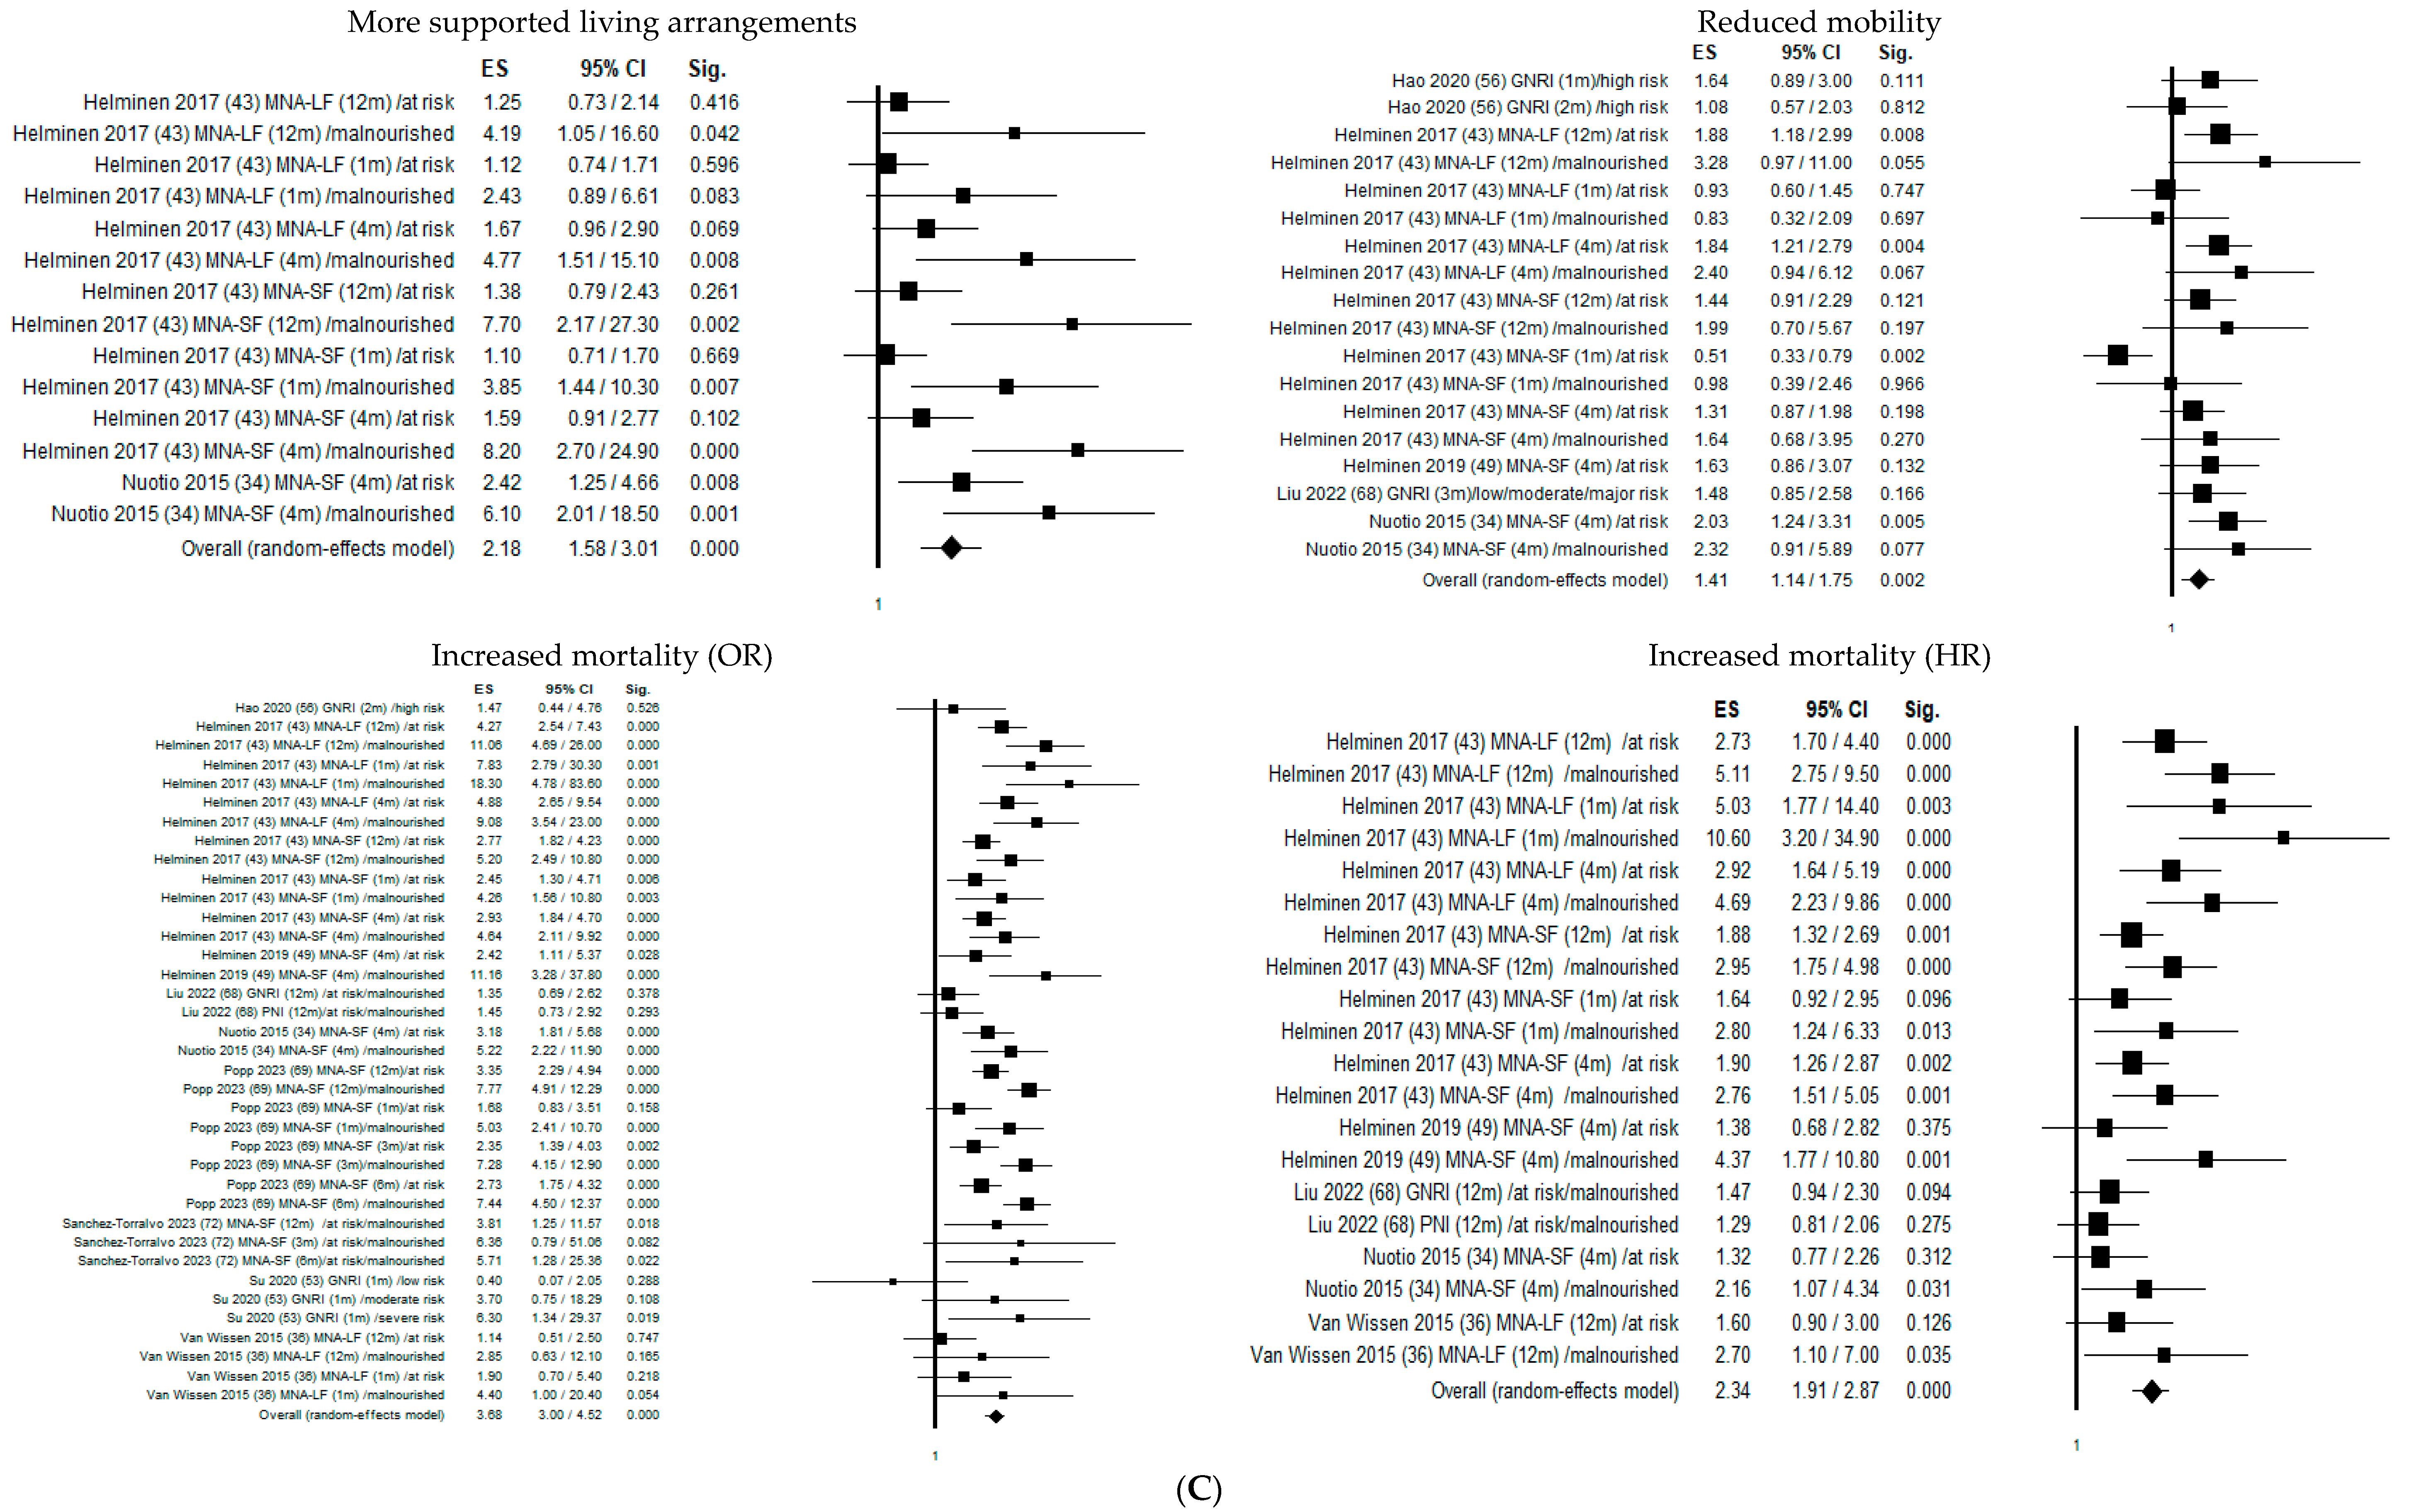
| Period ≤ 12 months ALL At Risk Malnourished | 18 8 7 | 1.41 (1.14–1.75) 1.33 (0.95–1.85) 1.66 (1.15–2.39) | 0.002 0.096 0.006 | 36.97 28.79 5.77 | 54.01 75.68 <0.01 | 0.003 <0.01 0.450 | 0.272 0.550 0.249 | 0.306 0.216 0.293 |
| Mortality (OR) | ||||||||
| ALL (ALL + art 64, 67) | 39 | 3.54 (2.74–4.57) | <0.01 | 221.61 | 82.85 | <0.01 | <0.01 | 0.570 |
| ALL >75 y (ALL+ art 67) | 16 | 2.72 (1.80–4.09) | <0.01 | 134.34 | 89.23 | <0.01 | 0.053 | 0.418 |
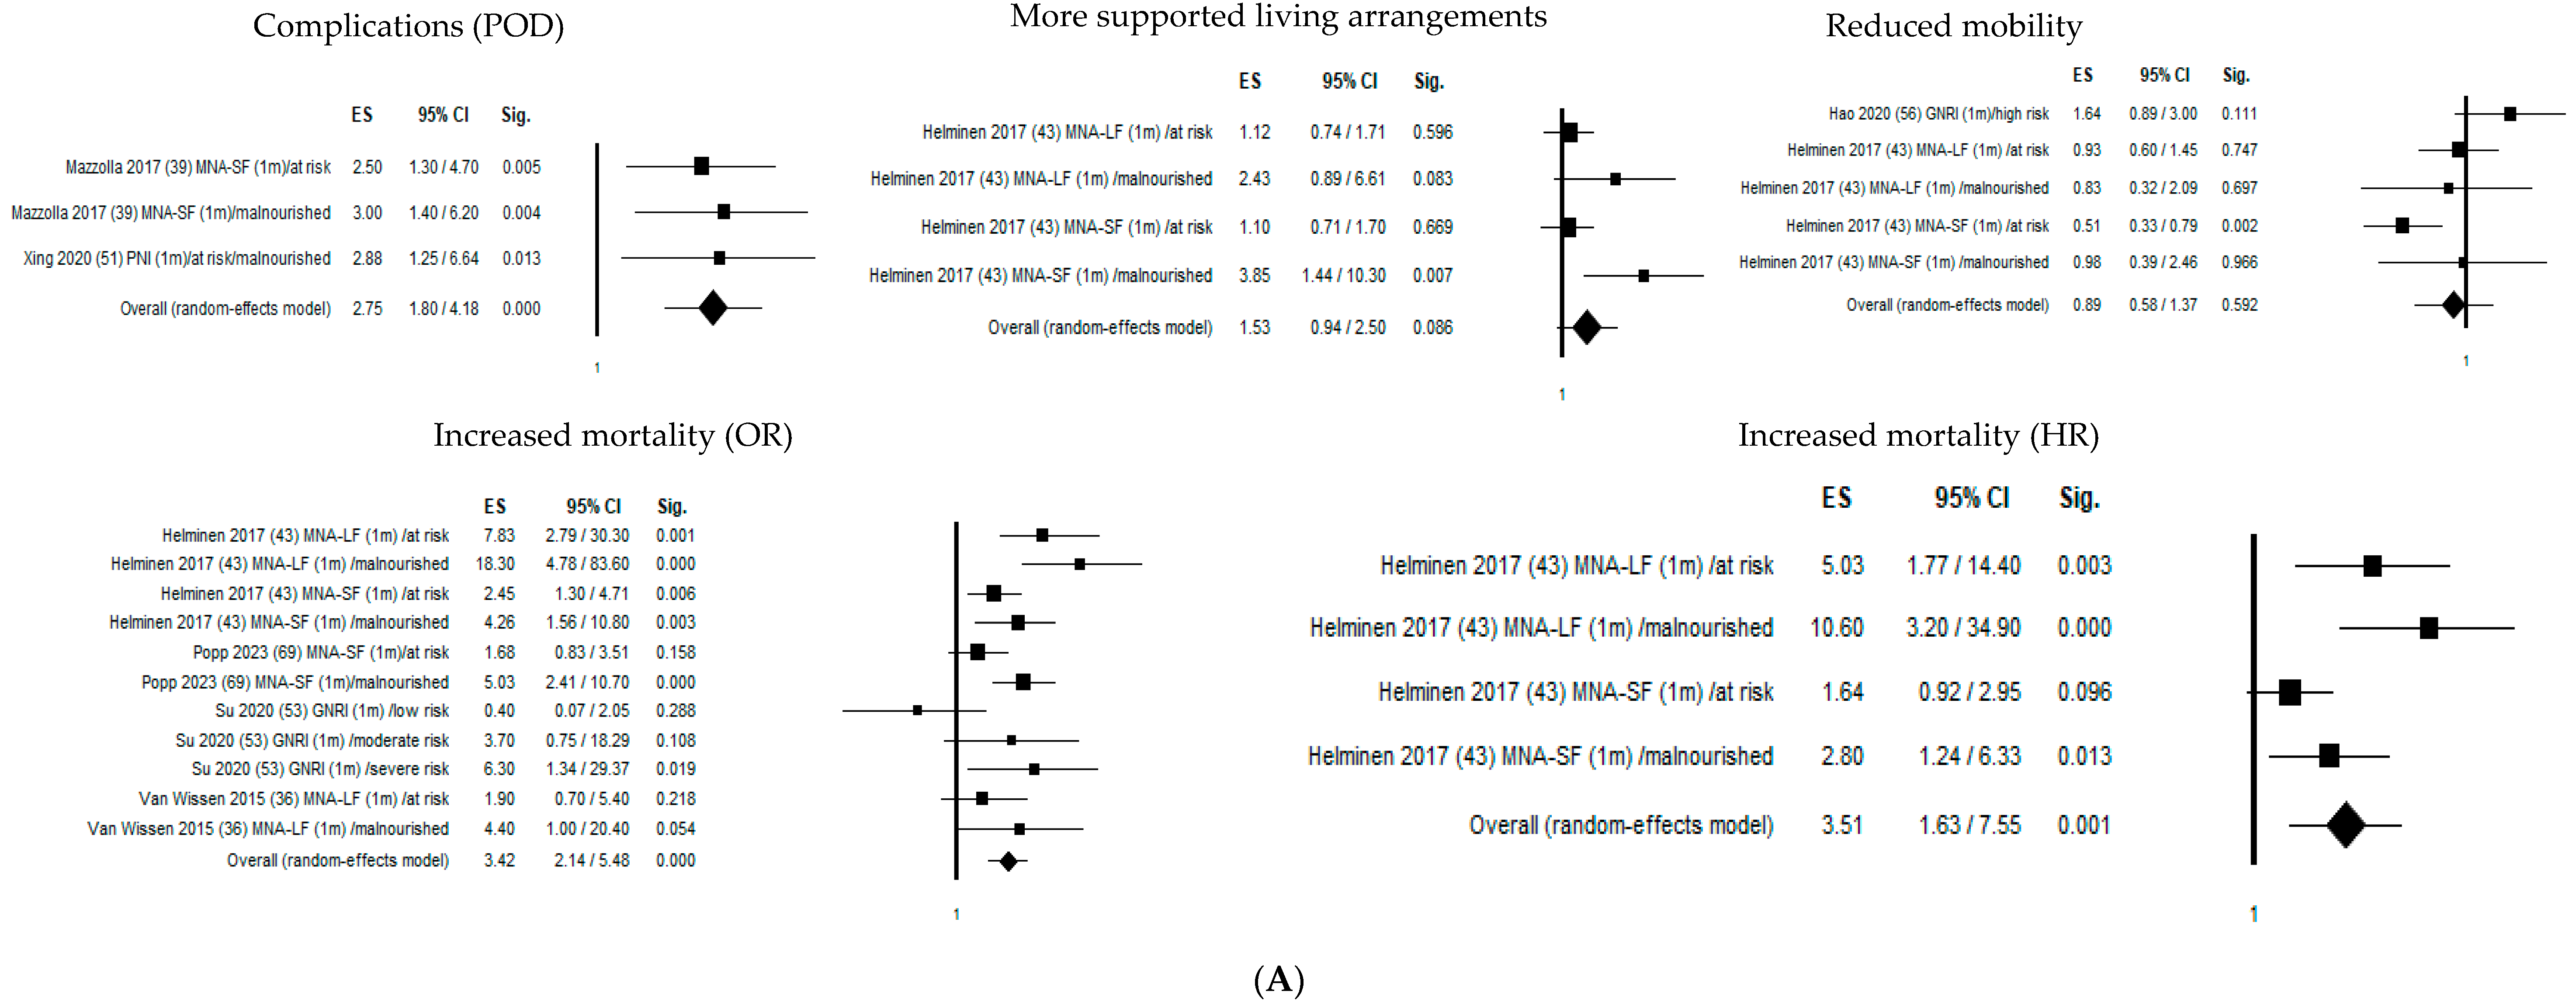
| Period ≤ 1 month ALL At Risk Malnourished | 11 4 4 | 3.42 (2.14–5.48) 2.50 (1.45–4.31) 5.61 (3.31–9.50) | <0.01 0.001 <0.01 | 21.12 4.92 3.12 | 52.65 39.04 3.72 | 0.020 0.178 0.374 | 0.496 0.400 0.503 | 0.938 0.497 0.497 |
| Cohort | 4 | 5.29 (2.34–11.96) | <0.01 | 7.79 | 61.51 | 0.050 | 0.015 | 0.042 |
| Case-control | 7 | 2.61 (1.44–4.75) | 0.002 | 11.41 | 47.42 | 0.076 | 0.865 | 0.652 |
| ALL >75 y | 4 | 2.77 (1.50–5.11) | 0.001 | 5.17 | 42.23 | 0.158 | 0.861 | 0.497 |
| Period ≤ 3 months ALL At Risk Malnourished | 15 5 5 | 3.44 (2.33–5.07) 2.40 (1.66–3.48) 6.29 (4.30–9.20) | <0.01 <0.01 <0.01 | 32.31 4.92 3.58 | 56.67 18.76 <0.01 | 0.004 0.295 0.466 | 0.845 0.415 0.892 | 0.961 0.624 1.000 |
| Cohort | 6 | 4.30 (2.19–8.43) | <0.01 | 10.54 | 52.54 | 0.061 | 0.239 | 0.091 |
| Case-control | 9 | 3.03 (1.82–5.05) | <0.01 | 21.59 | 62.95 | 0.006 | 0.560 | 0.532 |
| ALL >75 y | 7 | 3.02 (1.82–5.01) | <0.01 | 16.65 | 63.97 | 0.001 | 0.567 | 0.881 |
| Period ≤ 4 months ALL At Risk Malnourished | 23 9 9 | 3.79 (2.93–4.90) 2.82 (2.23–3.57) 6.31 (4.71–8.44) | <0.01 <0.01 <0.01 | 43.54 9.16 5.80 | 49.47 12.70 <0.01 | 0.004 0.329 0.670 | 0.447 0.747 0.485 | 0.853 0.835 0.297 |
| Cohort | 14 | 4.17 (3.12–5.56) | <0.01 | 21.05 | 38.24 | 0.072 | 0.043 | 0.090 |
| Case-control | 9 | 3.03 (1.82–5.05) | <0.01 | 21.59 | 62.95 | 0.006 | 0.560 | 0.532 |
| Period ≤ 6 months ALL At Risk Malnourished | 26 10 10 | 3.90 (3.07–4.95) 2.80 (2.30–3.42) 6.57 (5.11–8.46) | <0.01 <0.01 <0.01 | 52.90 9.18 6.11 | 52.74 1.96 <0.01 | 0.001 0.421 0.729 | 0.530 0.717 0.793 | 0.947 0.788 0.421 |
| Cohort | 15 | 4.19 (3.17–5.52) | <0.01 | 21.30 | 34.28 | 0.094 | 0.035 | 0.102 |
| Case-control | 11 | 3.36 (2.20–5.14) | <0.01 | 31.39 | 68.14 | 0.001 | 0.487 | 0.392 |
| ALL >75 y | 9 | 3.38 (2.21–5.16) | <0.01 | 26.56 | 69.88 | 0.001 | 0.502 | 0.677 |
| Period ≤ 12 months ALL At Risk Malnourished | 37 14 14 | 3.68 (3.00–4.52) 2.85 (2.38–3.41) 6.76 (5.52–8.29) | <0.01 <0.01 <0.01 | 96.70 17.17 9.58 | 62.77 24.30 <0.01 | <0.01 0.191 0.728 | 0.733 0.565 0.645 | 0.774 0.298 0.784 |
| Cohort | 22 | 3.86 (3.00–4.96) | <0.01 | 46.17 | 54.52 | 0.001 | 0.035 | 0.076 |
| Case-control | 15 | 3.34 (2.34–4.77) | <0.01 | 50.23 | 72.13 | <0.01 | 0.290 | 0.400 |
| ALL >75 y | 15 | 2.94 (2.07–4.19) | <0.01 | 59.83 | 76.60 | <0.01 | 0.190 | 0.458 |
| Mortality (HR) | ||||||||
| ALL (ALL + art 64) | 21 | 2.36 (1.94–2.89) | <0.01 | 43.67 | 54.20 | 0.002 | 0.005 | 0.022 |
| Period ≤ 1 month ALL (Cohort) At Risk Malnourished | 4 2 2 | 3.51 (1.63–7.55) 2.63 (0.89–7.78) 5.06 (1.38–18.49) | 0.001 0.081 0.014 | 9.20 3.36 3.25 | 67.39 70.20 69.28 | 0.027 0.067 0.071 | 0.012 - - | 0.042 - - |
| Period ≤ 4 months ALL (Cohort) At Risk Malnourished | 12 6 6 | 2.53 (1.90–3.37) 1.92 (1.40–2.63) 3.46 (2.38–5.04) | <0.01 <0.01 <0.01 | 23.34 8.23 6.78 | 52.87 39.23 26.26 | 0.016 0.144 0.237 | 0.011 0.423 0.063 | 0.020 0.573 0.091 |
| Period ≤ 12 months ALL At Risk Malnourished | 20 9 9 | 2.34 (1.91–2.87) 1.96 (1.59–2.41) 3.45 (2.67–4.46) | <0.01 <0.01 <0.01 | 42.85 10.69 8.96 | 55.66 25.14 10.71 | 0.001 0.220 0.346 | 0.007 0.576 0.244 | 0.023 0.835 0.297 |
| Cohort | 18 | 2.39 (1.92–2.98) | <0.01 | 41.62 | 59.16 | 0.001 | 0.007 | 0.017 |
| Case-control | 2 | 1.87 (1.13–3.10) | 0.015 | 0.86 | <0.01 | 0.353 | - | - |
| ALL >75 y | 4 | 1.51 (1.15–1.98) | 0.003 | 1.99 | <0.01 | 0.575 | 0.059 | 0.174 |
| Living Arrangements (OR) Cohort | ||||||||
| Period ≤ 1 month ALL At Risk Malnourished | 4 2 2 | 1.53 (0.94–2.50) 1.11 (0.82–1.50) 3.07 (1.52–6.20) | 0.086 0.499 0.002 | 7.22 <0.01 0.41 | 58.43 <0.01 <0.01 | 0.065 0.954 0.521 | 0.035 - - | 0.497 - - |
| Period ≤ 4 months ALL At Risk Malnourished | 10 5 5 | 2.24 (1.52–3.31) 1.41 (1.08–1.85) 4.50 (2.80–7.25) | <0.01 0.011 <0.01 | 27.77 5.48 2.97 | 67.59 27.06 <0.01 | 0.001 0.241 0.563 | <0.01 0.001 0.171 | 0.002 0.142 0.327 |
| Period ≤ 12 months ALL At Risk Malnourished | 14 7 7 | 2.18 (1.58–3.01) 1.36 (1.12–1.66) 4.75 (3.11–7.26) | <0.01 0.002 <0.01 | 36.67 5.60 3.61 | 64.54 <0.01 <0.01 | <0.01 0.47 0.73 | <0.01 0.004 0.296 | 0.01 0.051 0.453 |
| Complications (Delirium)(OR) Cohort | ||||||||
| Period ≤ 1 month ALL | 3 | 2.75 (1.80–4.18) | <0.01 | 0.15 | <0.01 | 0.928 | 0.408 | 0.602 |
Disclaimer/Publisher’s Note: The statements, opinions and data contained in all publications are solely those of the individual author(s) and contributor(s) and not of MDPI and/or the editor(s). MDPI and/or the editor(s) disclaim responsibility for any injury to people or property resulting from any ideas, methods, instructions or products referred to in the content. |
© 2024 by the authors. Licensee MDPI, Basel, Switzerland. This article is an open access article distributed under the terms and conditions of the Creative Commons Attribution (CC BY) license (https://creativecommons.org/licenses/by/4.0/).
Share and Cite
Chiavarini, M.; Ricciotti, G.M.; Genga, A.; Faggi, M.I.; Rinaldi, A.; Toscano, O.D.; D’Errico, M.M.; Barbadoro, P. Malnutrition-Related Health Outcomes in Older Adults with Hip Fractures: A Systematic Review and Meta-Analysis. Nutrients 2024, 16, 1069. https://doi.org/10.3390/nu16071069
Chiavarini M, Ricciotti GM, Genga A, Faggi MI, Rinaldi A, Toscano OD, D’Errico MM, Barbadoro P. Malnutrition-Related Health Outcomes in Older Adults with Hip Fractures: A Systematic Review and Meta-Analysis. Nutrients. 2024; 16(7):1069. https://doi.org/10.3390/nu16071069
Chicago/Turabian StyleChiavarini, Manuela, Giorgia Maria Ricciotti, Anita Genga, Maria Ilaria Faggi, Alessia Rinaldi, Oriana Dunia Toscano, Marcello Mario D’Errico, and Pamela Barbadoro. 2024. "Malnutrition-Related Health Outcomes in Older Adults with Hip Fractures: A Systematic Review and Meta-Analysis" Nutrients 16, no. 7: 1069. https://doi.org/10.3390/nu16071069
APA StyleChiavarini, M., Ricciotti, G. M., Genga, A., Faggi, M. I., Rinaldi, A., Toscano, O. D., D’Errico, M. M., & Barbadoro, P. (2024). Malnutrition-Related Health Outcomes in Older Adults with Hip Fractures: A Systematic Review and Meta-Analysis. Nutrients, 16(7), 1069. https://doi.org/10.3390/nu16071069