
Intraepithelial Lymphogram in the Diagnosis of Celiac Disease in Adult Patients: A Validation Cohort

 , , ,
, , ,
Abstract
1. Introduction
2. Materials and Methods
2.1. Patients
- Control group (n = 411). All patients in this group were on a gluten-containing diet and lacked circulating IgA anti-TG2 antibodies. We have intentionally highlighted a Control Marsh stage I (MI) subgroup of 57 patients with duodenal lymphocytosis in whom CD was excluded (negative serology and/or non-compatible genetics and/or no clinical remission after gluten withdrawal). The remaining individuals included in this group (n = 356) showed no evidence of mucosal lesion (M0, Marsh stage 0).
- Active CD seropositive (n = 203). The active CD group included only patients with a new diagnosis of CD on a gluten-containing diet. Serological tests were considered valid if performed between 1 year before and 1 year after the date of the endoscopy. In this group, almost all patients had positive IgA anti-TG2 serology, confirmed by anti-endomysial antibody. All patients presented villous atrophy (Marsh stage III a-c lesion).
- Active CD seronegative (n = 14). A small group of patients with a new diagnosis of CD in a gluten-containing diet, lacked serum IgA anti-tTG2 antibodies. All patients presented villous atrophy (Marsh stage III a-c lesion).
- Patients with CD in remission (gluten-free diet [GFD] group, n = 195). Patients in this group had been on a gluten-free diet (GFD) since their diagnosis (median 72 months, Q1–Q3 quartiles 36–156 months). Monitoring of diet compliance was performed by detecting the presence of specific CD serology. In general, a clinical visit was scheduled every 6 months until it became negative and annually thereafter. Only the specific CD serological tests performed between 3 months before and 3 months after the endoscopy were considered, to maintain a temporal agreement with the histological findings. A follow-up group (n = 70) was included, in which a second biopsy was required to demonstrate mucosal recovery or comorbidities unrelated to CD.
- Patients with potential CD (n = 15). In this group, patients had positive specific serology without villous atrophy (Marsh 0-I). A permissive HLA-DQ2/DQ8 genotype was present when available (73%). Five asymptomatic patients were detected in family screening, seven had mild digestive symptoms, one had iron deficiency anemia, and two had an autoimmune disease. All initiated a GFD.
2.2. Small-Bowel Biopsy and Flow Cytometry Analysis
2.3. Statistics
3. Results
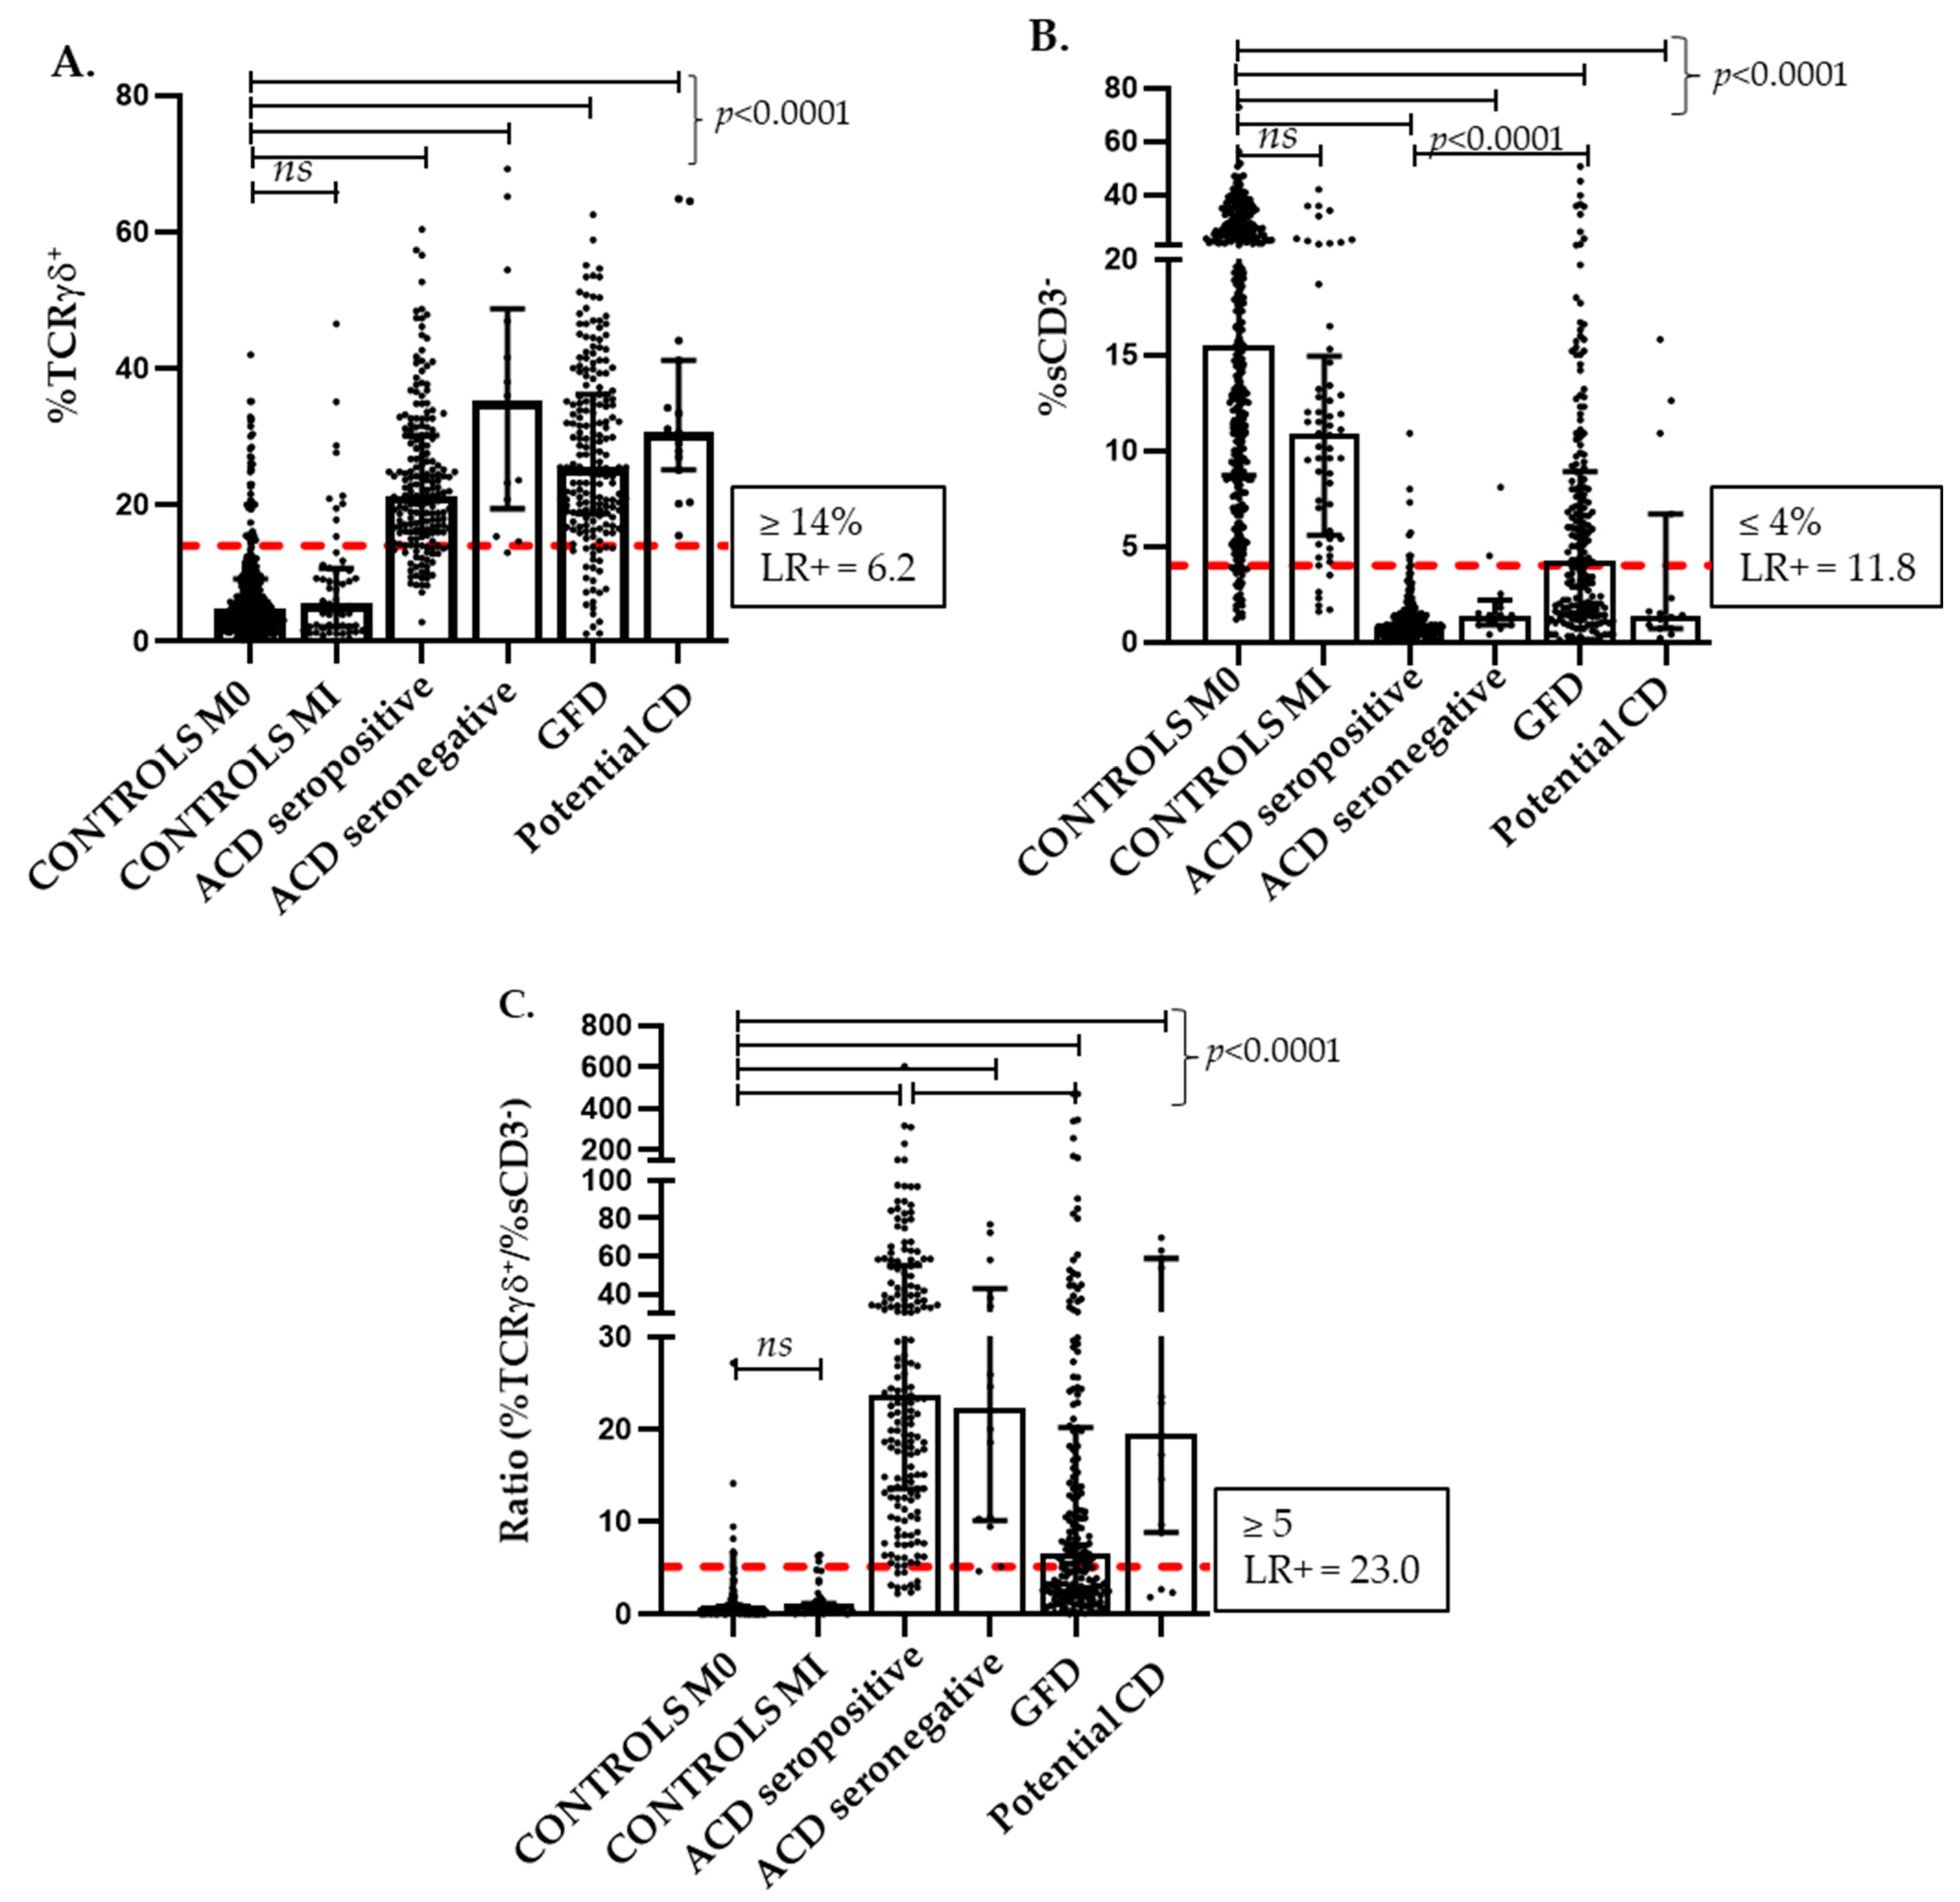
3.1. TCRγδ and sCD3− Intraepithelial Lymphocyte Subsets: Distribution among Celiac Disease Groups and Controls
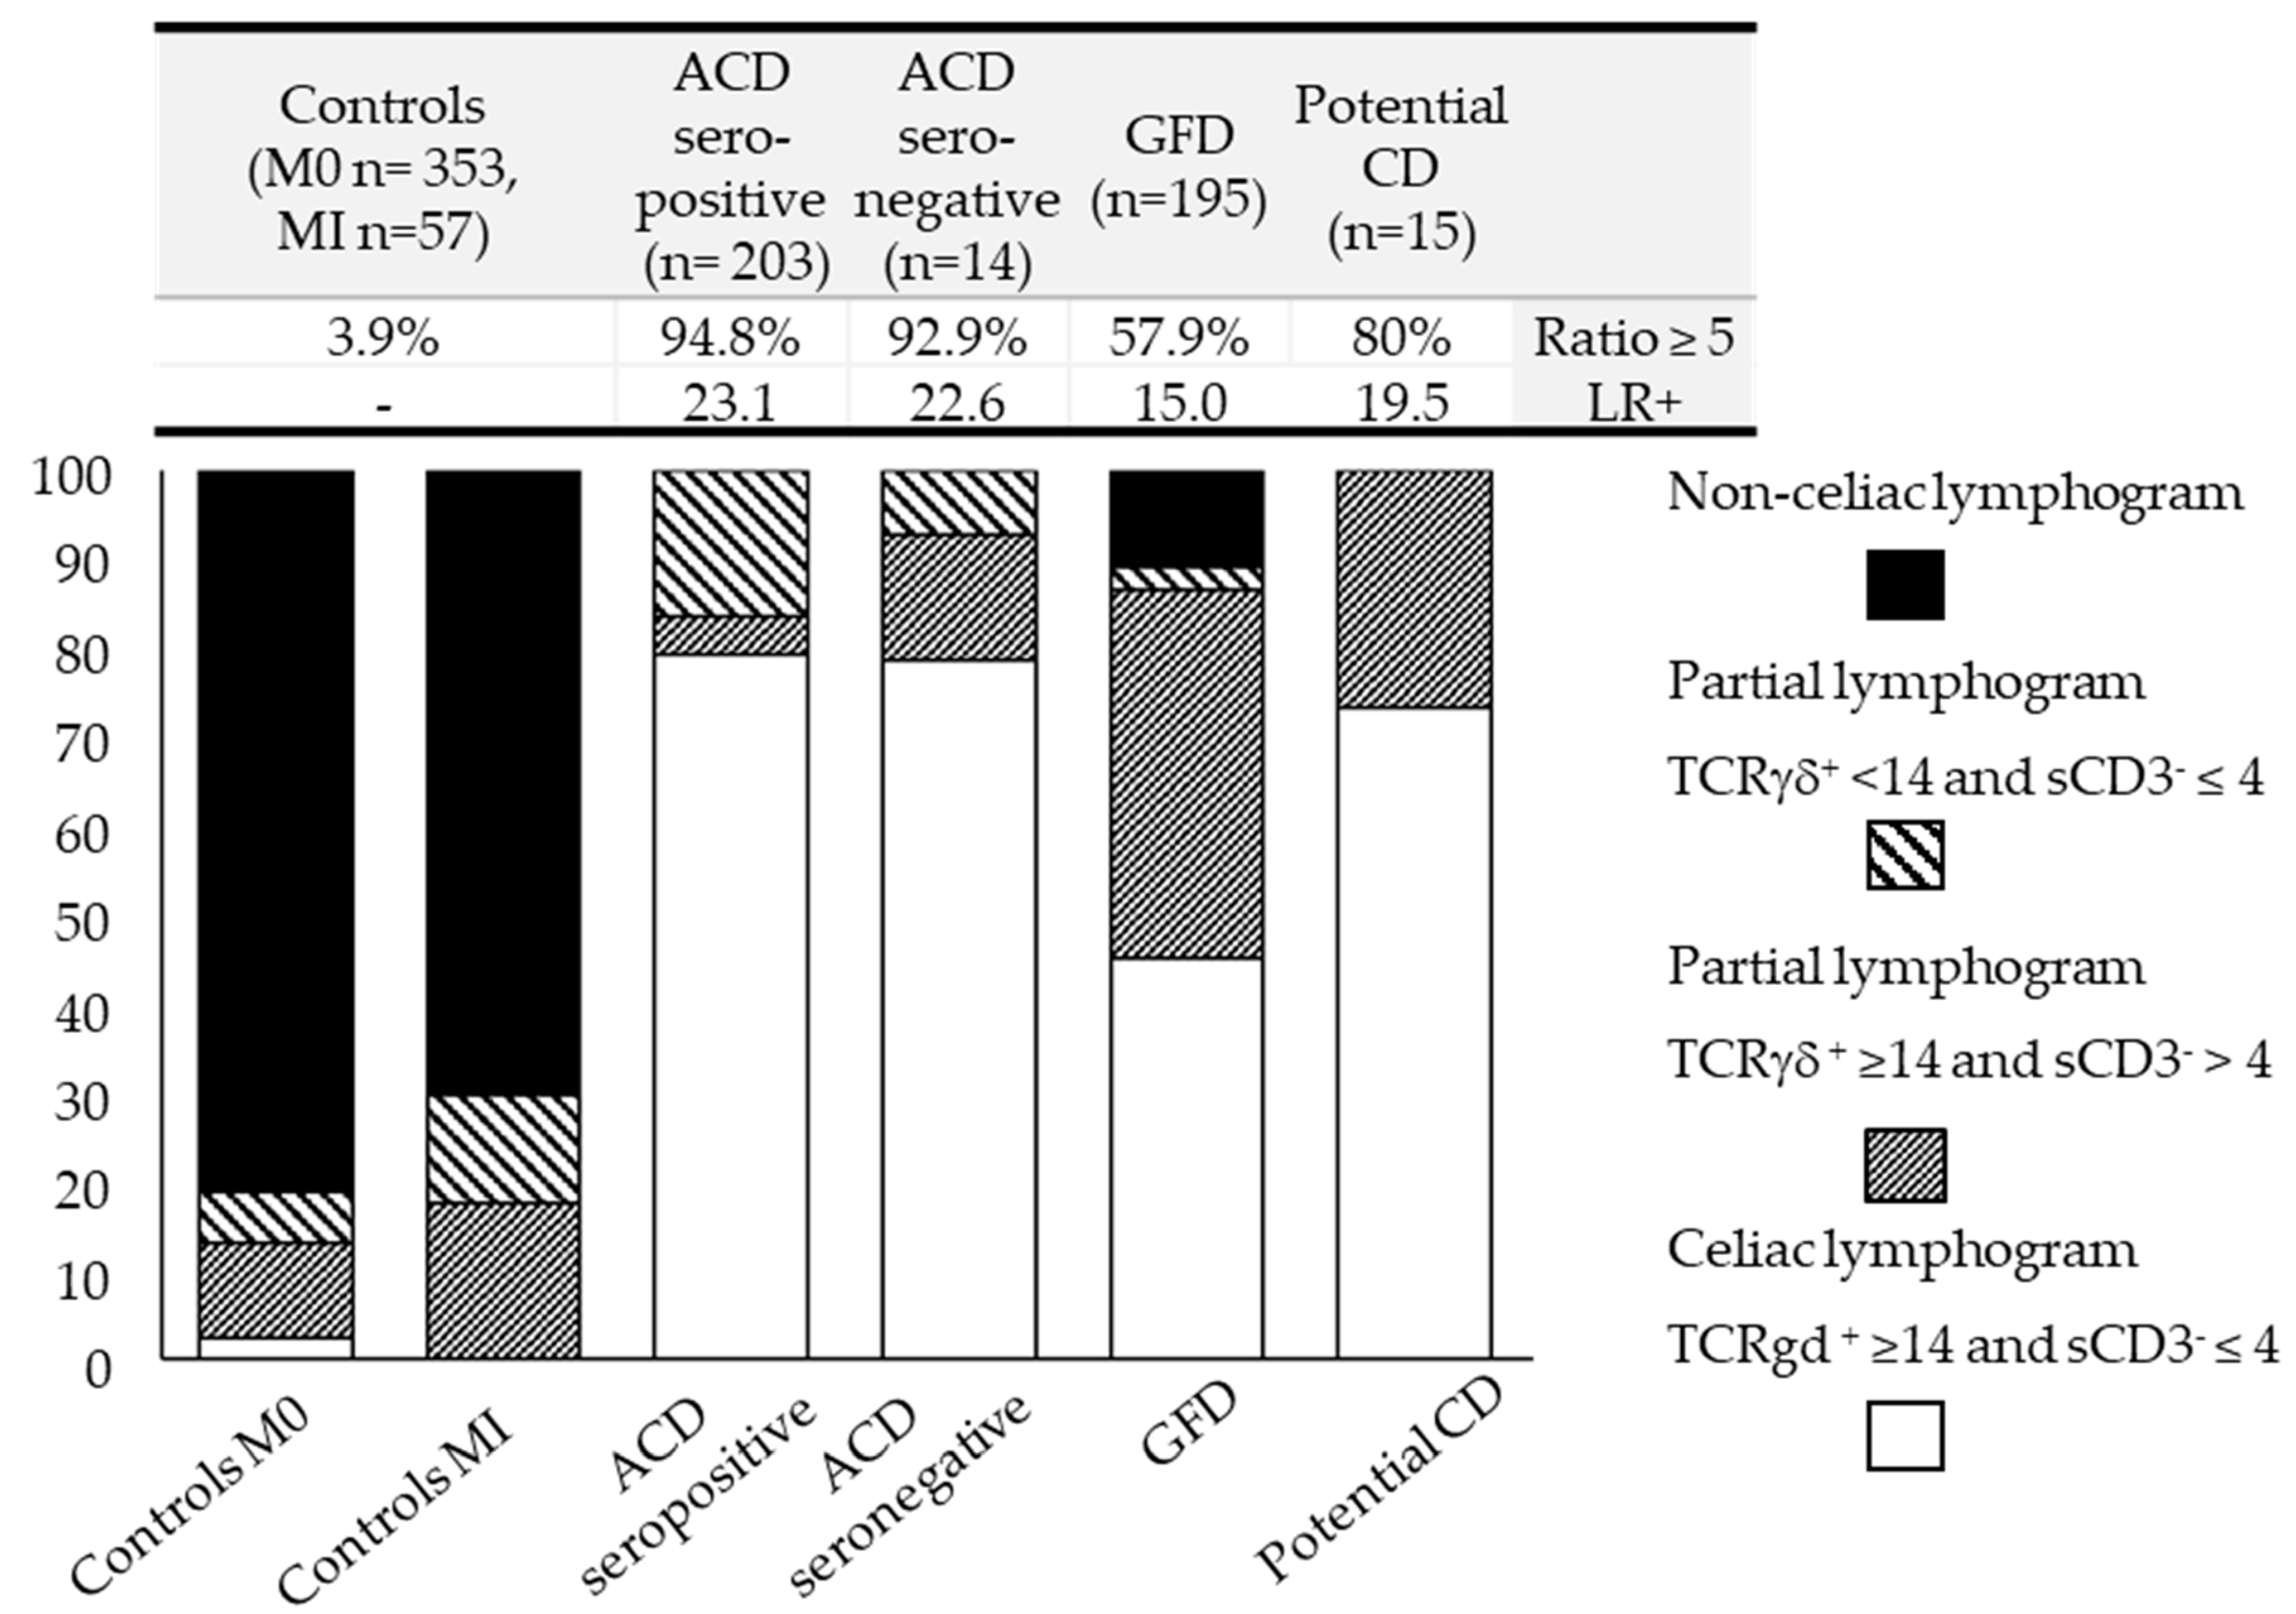
3.2. TCRγδ and sCD3− Intraepithelial Lymphocyte Subsets: Establishing Cut-Offs and Defining Lymphogram Profiles
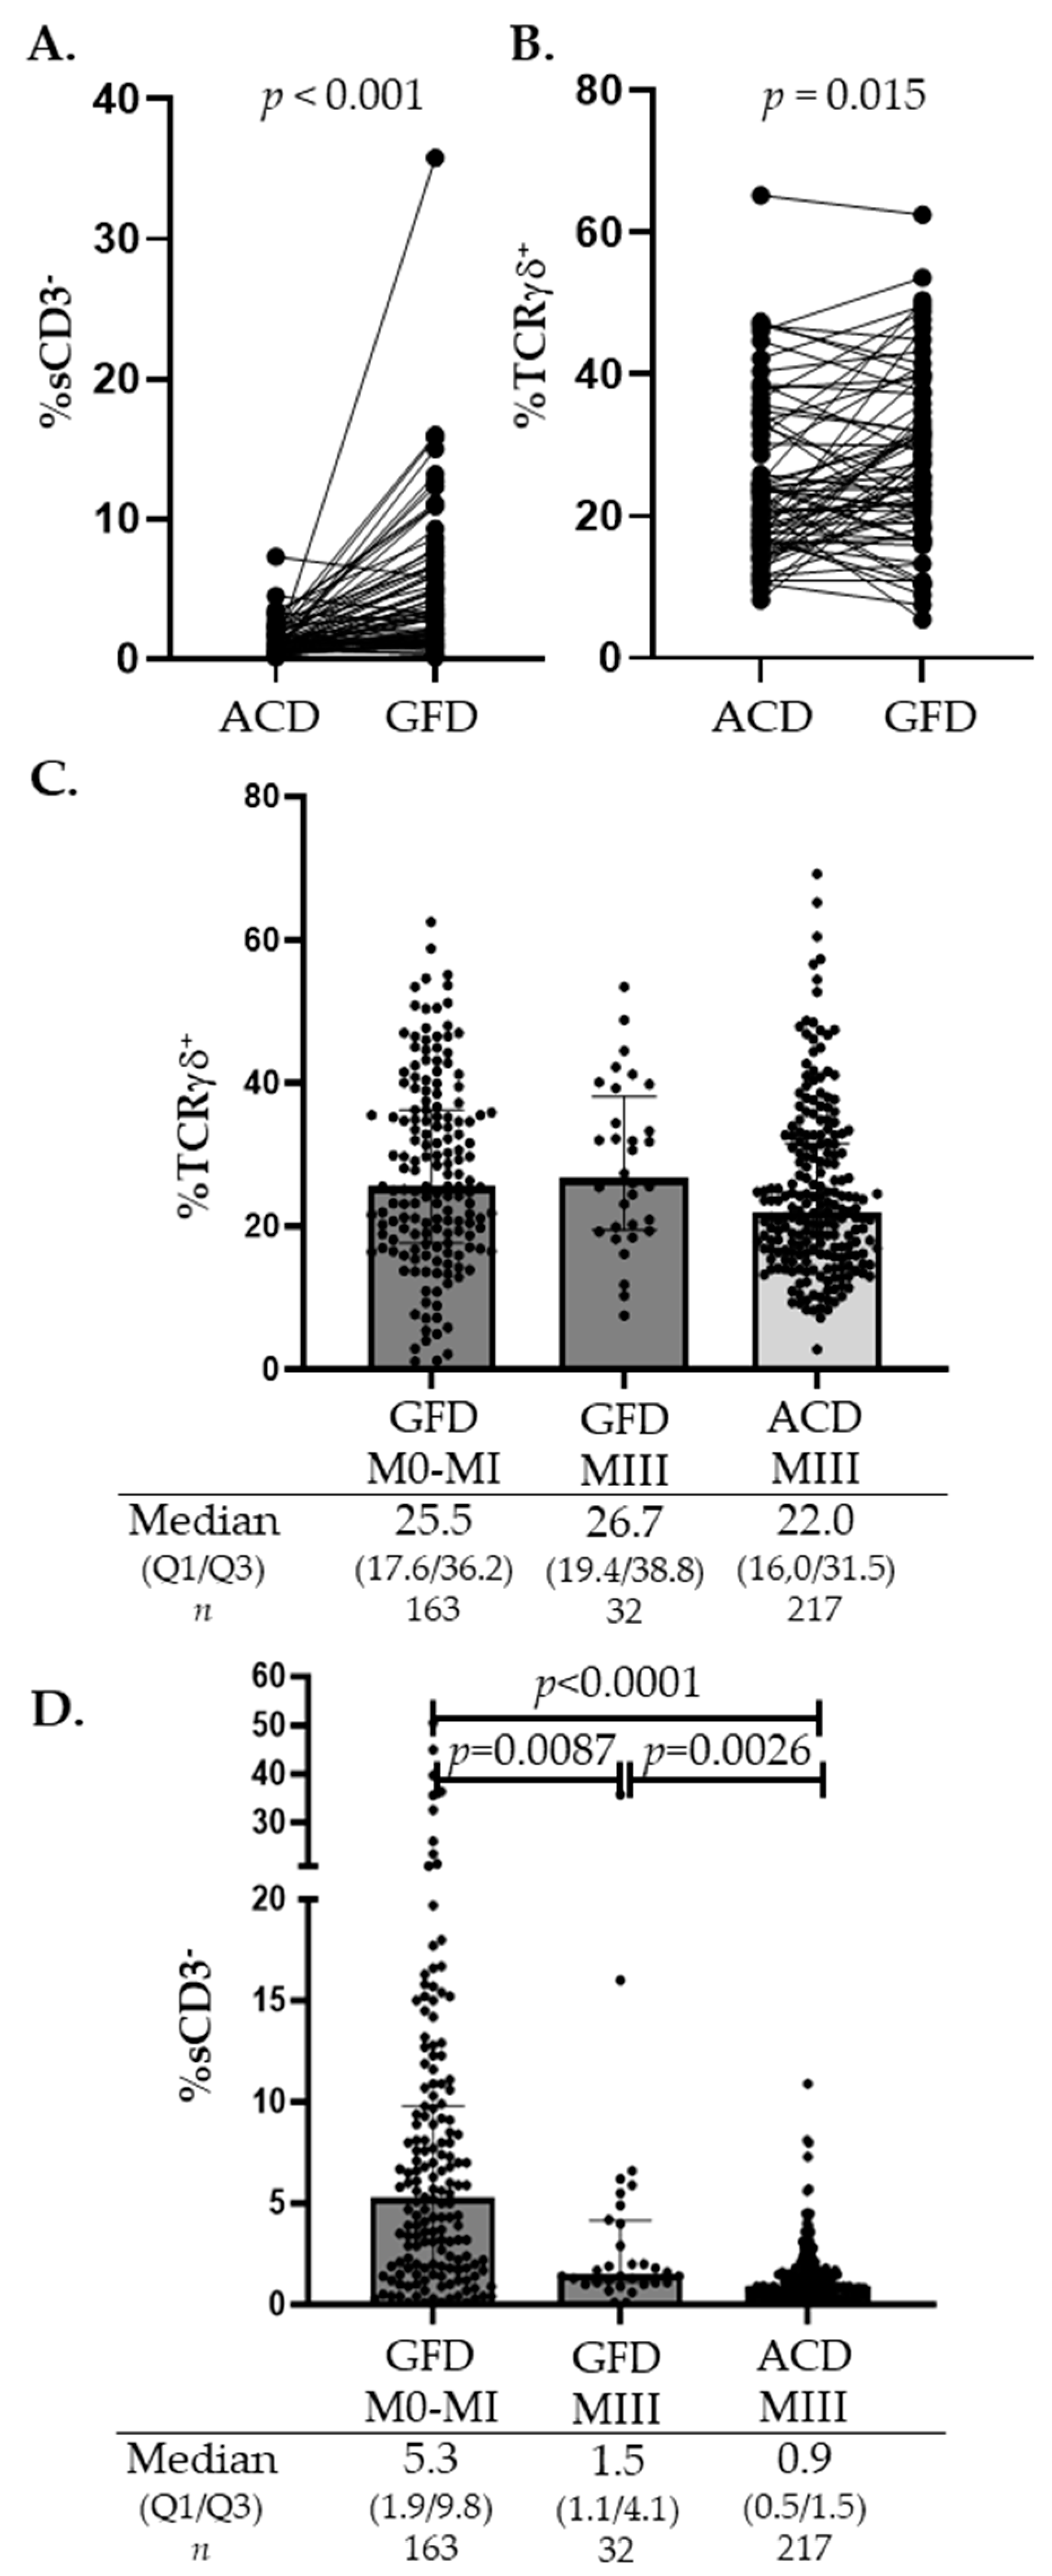
3.3. TCRγδ and sCD3− Intraepithelial Lymphocyte Subsets: Biomarkers of the Ongoing Immunological Celiac Disease Process
4. Discussion
- Knowing whether a patient is ingesting gluten is critical when interpreting partial lymphogram profiles in the initial diagnosis of CD: ↑TCRγδ ≥ 14 and ↑sCD3− > 4% in a patient eating gluten practically excludes an active CD form or introduces the option of a potential CD form, whereas, if the patient is on a GFD, it indicates good follow-up.
- Chosen cut-offs are arbitrary and depend on the priorities of the clinicians, favoring specificity or sensitivity, so it is important to be aware that the higher the specificity, the better the discriminatory power.
- Quantifying the TCRγδ/sCD3− imbalance ratio is a good discriminative index to discard or suspect an active CD form.
- The lymphogram is a simple, rapid, and accurate technique, but it requires expertise in mucosal immunology to interpret and further analyze the profound phenotypic or numerical changes in the dynamic IEL compartment.
5. Conclusions
- The celiac lymphogram is a highly specific imprint of the subjacent immunopathogenic process, guided by gluten intake.
- An increase in TCRγδ IELs is the pathological hallmark of CD enteropathy in the majority of CD forms.
- The sCD3− IEL subset is a sensor of celiac mucosal integrity, almost disappearing in active CD forms but with an increasing tendency in healing mucosa.
- A complete celiac lymphogram has a high diagnostic accuracy (LR+ 36.2).
- A non-celiac lymphogram practically excludes active CD.
- Once a diagnostic or follow-up biopsy is clinically indicated, the lymphogram confers specificity to the histological findings and increases the efficiency of the whole diagnostic process.
Author Contributions
Funding
Institutional Review Board Statement
Informed Consent Statement
Data Availability Statement
Acknowledgments
Conflicts of Interest
References
- Abadie, V.; Kim, S.M.; Lejeune, T.; Palanski, B.A.; Ernest, J.D.; Tastet, O.; Voisine, J.; Discepolo, V.; Marietta, E.V.; Hawash, M.B.F.; et al. IL-15, gluten and HLA-DQ8 drive tissue destruction in coeliac disease. Nature 2020, 578, 600–604. [Google Scholar] [CrossRef] [PubMed]
- Korneychuk, N.; Ramiro-Puig, E.; Ettersperger, J.; Schulthess, J.; Montcuquet, N.; Kiyono, H.; Meresse, B.; Cerf-Bensussan, N. Interleukin 15 and CD4+ T cells cooperate to promote small intestinal enteropathy in response to dietary antigen. Gastroenterology 2014, 146, 1017–1027. [Google Scholar] [CrossRef] [PubMed]
- Al-Toma, A.; Volta, U.; Auricchio, R.; Castillejo, G.; Sanders, D.S.; Cellier, C.; Mulder, C.J.; Lundin, K.E.A. European Society for the Study of Coeliac Disease (ESsCD) guideline for coeliac disease and other gluten-related disorders. United Eur. Gastroenterol. J. 2019, 7, 583–613. [Google Scholar] [CrossRef] [PubMed]
- Lundin, K.E.; Scott, H.; Hansen, T.; Paulsen, G.; Halstensen, T.S.; Fausa, O.; Thorsby, E.; Sollid, L.M. Gliadin-specific, HLA-DQ(alpha 1*0501,beta 1*0201) restricted T cells isolated from the small intestinal mucosa of celiac disease patients. J. Exp. Med. 1993, 178, 187–196. [Google Scholar] [CrossRef] [PubMed]
- Fasano, A.; Berti, I.; Gerarduzzi, T.; Not, T.; Colletti, R.B.; Drago, S.; Elitsur, Y.; Green, P.H.; Guandalini, S.; Hill, I.D.; et al. Prevalence of celiac disease in at-risk and not-at-risk groups in the United States: A large multicenter study. Arch. Intern. Med. 2003, 163, 286–292. [Google Scholar] [CrossRef]
- Collin, P.; Vilppula, A.; Luostarinen, L.; Holmes, G.K.T.; Kaukinen, K. Review article: Coeliac disease in later life must not be missed. Aliment. Pharmacol. Ther. 2018, 47, 563–572. [Google Scholar] [CrossRef]
- Singh, P.; Arora, A.; Strand, T.A.; Leffler, D.A.; Catassi, C.; Green, P.H.; Kelly, C.P.; Ahuja, V.; Makharia, G.K. Global Prevalence of Celiac Disease: Systematic Review and Meta-analysis. Clin. Gastroenterol. Hepatol. Off. Clin. Pract. J. Am. Gastroenterol. Assoc. 2018, 16, 823–836.e2. [Google Scholar] [CrossRef]
- Jabri, B.; Sollid, L.M. T Cells in Celiac Disease. J. Immunol. 2017, 198, 3005–3014. [Google Scholar] [CrossRef]
- Ettersperger, J.; Montcuquet, N.; Malamut, G.; Guegan, N.; Lopez-Lastra, S.; Gayraud, S.; Reimann, C.; Vidal, E.; Cagnard, N.; Villarese, P.; et al. Interleukin-15-Dependent T-Cell-like Innate Intraepithelial Lymphocytes Develop in the Intestine and Transform into Lymphomas in Celiac Disease. Immunity 2016, 45, 610–625. [Google Scholar] [CrossRef]
- Marsh, M.N.; Johnson, M.W.; Rostami, K. Rebutting Oberhuber-Again. Gastroenterol. Hepatol. Bed Bench 2015, 8, 303–305. [Google Scholar]
- Bolotin, D.; Petronic-Rosic, V. Dermatitis herpetiformis. Part II. Diagnosis, management, and prognosis. J. Am. Acad. Dermatol. 2011, 64, 1027–1033, quiz 33-4. [Google Scholar] [CrossRef]
- Briani, C.; Zara, G.; Alaedini, A.; Grassivaro, F.; Ruggero, S.; Toffanin, E.; Albergoni, M.P.; Luca, M.; Giometto, B.; Ermani, M.; et al. Neurological complications of celiac disease and autoimmune mechanisms: A prospective study. J. Neuroimmunol. 2008, 195, 171–175. [Google Scholar] [CrossRef]
- Leffler, D.A.; Schuppan, D. Update on serologic testing in celiac disease. Am. J. Gastroenterol. 2010, 105, 2520–2524. [Google Scholar] [CrossRef]
- Dieterich, W.; Ehnis, T.; Bauer, M.; Donner, P.; Volta, U.; Riecken, E.O.; Schuppan, D. Identification of tissue transglutaminase as the autoantigen of celiac disease. Nat. Med. 1997, 3, 797–801. [Google Scholar] [CrossRef]
- Ludvigsson, J.F.; Card, T.R.; Kaukinen, K.; Bai, J.; Zingone, F.; Sanders, D.S.; Murray, J.A. Screening for celiac disease in the general population and in high-risk groups. United Eur. Gastroenterol. J. 2015, 3, 106–120. [Google Scholar] [CrossRef]
- Kelly, C.P.; Bai, J.C.; Liu, E.; Leffler, D.A. Advances in diagnosis and management of celiac disease. Gastroenterology 2015, 148, 1175–1186. [Google Scholar] [CrossRef]
- Robert, M.E.; Crowe, S.E.; Burgart, L.; Yantiss, R.K.; Lebwohl, B.; Greenson, J.K.; Guandalini, S.; Murray, J.A. Statement on Best Practices in the Use of Pathology as a Diagnostic Tool for Celiac Disease: A Guide for Clinicians and Pathologists. Am. J. Surg. Pathol. 2018, 42, e44–e58. [Google Scholar] [CrossRef]
- Wakim-Fleming, J.; Pagadala, M.R.; Lemyre, M.S.; Lopez, R.; Kumaravel, A.; Carey, W.D.; Zein, N.N. Diagnosis of celiac disease in adults based on serology test results, without small-bowel biopsy. Clin. Gastroenterol. Hepatol. Off. Clin. Pract. J. Am. Gastroenterol. Assoc. 2013, 11, 511–516. [Google Scholar] [CrossRef]
- Werkstetter, K.J.; Korponay-Szabó, I.R.; Popp, A.; Villanacci, V.; Salemme, M.; Heilig, G.; Lillevang, S.T.; Mearin, M.L.; Ribes-Koninckx, C.; Thomas, A.; et al. Accuracy in Diagnosis of Celiac Disease Without Biopsies in Clinical Practice. Gastroenterology 2017, 153, 924–935. [Google Scholar] [CrossRef]
- Fuchs, V.; Kurppa, K.; Huhtala, H.; Laurila, K.; Mäki, M.; Collin, P.; Salmi, T.; Luostarinen, L.; Saavalainen, P.; Kaukinen, K. Serology-based criteria for adult coeliac disease have excellent accuracy across the range of pre-test probabilities. Aliment. Pharmacol. Ther. 2019, 49, 277–284. [Google Scholar] [CrossRef]
- Volta, U.; Caio, G.; Boschetti, E.; Giancola, F.; Rhoden, K.J.; Ruggeri, E.; Paterini, P.; De Giorgio, R. Seronegative celiac disease: Shedding light on an obscure clinical entity. Dig. Liver Dis. Off. J. Ital. Soc. Gastroenterol. Ital. Assoc. Study Liver 2016, 48, 1018–1022. [Google Scholar] [CrossRef]
- Schiepatti, A.; Sanders, D.S.; Baiardi, P.; Caio, G.; Ciacci, C.; Kaukinen, K.; Lebwohl, B.; Leffler, D.; Malamut, G.; Murray, J.A.; et al. Nomenclature and diagnosis of seronegative coeliac disease and chronic non-coeliac enteropathies in adults: The Paris consensus. Gut 2022, 71, 2218–2225. [Google Scholar] [CrossRef]
- Jansson-Knodell, C.L.; Hujoel, I.A.; Rubio-Tapia, A.; Murray, J.A. Not All That Flattens Villi Is Celiac Disease: A Review of Enteropathies. Mayo Clin. Proc. 2018, 93, 509–517. [Google Scholar] [CrossRef]
- Malamut, G.; Cerf-Bensussan, N.; Cellier, C. Identification of new cases of severe enteropathy has recently increased the spectrum of intestinal non-celiac villous atrophy. Expert Rev. Gastroenterol. Hepatol. 2015, 9, 719–721. [Google Scholar] [CrossRef]
- Villanacci, V.; Lorenzi, L.; Donato, F.; Auricchio, R.; Dziechciarz, P.; Gyimesi, J.; Koletzko, S.; Mišak, Z.; Laguna, V.M.; Polanco, I.; et al. Histopathological evaluation of duodenal biopsy in the PreventCD project. An observational interobserver agreement study. APMIS Acta Pathol. Microbiol. Immunol. Scand. 2018, 126, 208–214. [Google Scholar] [CrossRef]
- Ferguson, A. Intraepithelial lymphocytes of the small intestine. Gut 1977, 18, 921–937. [Google Scholar] [CrossRef]
- Abadie, V.; Discepolo, V.; Jabri, B. Intraepithelial lymphocytes in celiac disease immunopathology. Semin. Immunopathol. 2012, 34, 551–566. [Google Scholar] [CrossRef]
- Meresse, B.; Curran, S.A.; Ciszewski, C.; Orbelyan, G.; Setty, M.; Bhagat, G.; Lee, L.; Tretiakova, M.; Semrad, C.; Kistner, E.; et al. Reprogramming of CTLs into natural killer–like cells in celiac disease. J. Exp. Med. 2006, 203, 1343–1355. [Google Scholar] [CrossRef]
- León, F.; Roldán, E.; Sanchez, L.; Camarero, C.; Bootello, A.; Roy, G. Human small-intestinal epithelium contains functional natural killer lymphocytes. Gastroenterology 2003, 125, 345–356. [Google Scholar] [CrossRef]
- Halstensen, T.S.; Scott, H.; Brandtzaeg, P. Intraepithelial T cells of the TcR gamma/delta+ CD8− and V delta 1/J delta 1+ phenotypes are increased in coeliac disease. Scand. J. Immunol. 1989, 30, 665–672. [Google Scholar] [CrossRef]
- Holm, K.; Maki, M.; Savilahti, E.; Lipsanen, V.; Laippala, P.; Koskimies, S. Intraepithelial gamma delta T-cell-receptor lymphocytes and genetic susceptibility to coeliac disease. Lancet 1992, 339, 1500–1503. [Google Scholar] [CrossRef]
- Spencer, J.; MacDonald, T.T.; Diss, T.C.; Walker-Smith, J.A.; Ciclitira, P.J.; Isaacson, P.G. Changes in intraepithelial lymphocyte subpopulations in coeliac disease and enteropathy associated T cell lymphoma (malignant histiocytosis of the intestine). Gut 1989, 30, 339–346. [Google Scholar] [CrossRef]
- Eiras, P.; Roldan, E.; Camarero, C.; Olivares, F.; Bootello, A.; Roy, G. Flow cytometry description of a novel CD3−/CD7+ intraepithelial lymphocyte subset in human duodenal biopsies: Potential diagnostic value in coeliac disease. Cytometry 1998, 34, 95–102. [Google Scholar] [CrossRef]
- Leon, F. Flow cytometry of intestinal intraepithelial lymphocytes in celiac disease. J. Immunol. Methods 2011, 363, 177–186. [Google Scholar] [CrossRef]
- Camarero, C.; Eiras, P.; Asensio, A.; Leon, F.; Olivares, F.; Escobar, H.; Roy, G. Intraepithelial lymphocytes and coeliac disease: Permanent changes in CD3−/CD7+ and T cell receptor gammadelta subsets studied by flow cytometry. Acta Paediatr. 2000, 89, 285–290. [Google Scholar]
- Nunez, C.; Carrasco, A.; Corzo, M.; Pariente, R.; Esteve, M.; Roy, G. Flow cytometric analysis of duodenal intraepithelial lymphocytes (celiac lymphogram): A diagnostic test for celiac disease. Methods Cell Biol. 2023, 179, 143–155. [Google Scholar]
- Camarero, C.; De Andrés, A.; García-Hoz, C.; Roldán, B.; Muriel, A.; León, F.; Roy, G. Assessment of Duodenal Intraepithelial Lymphocyte Composition (Lymphogram) for Accurate and Prompt Diagnosis of Celiac Disease in Pediatric Patients. Clin. Transl. Gastroenterol. 2021, 12, e00426. [Google Scholar] [CrossRef]
- Fernández-Bañares, F.; Carrasco, A.; Martín, A.; Esteve, M. Systematic Review and Meta-Analysis: Accuracy of Both Gamma Delta+ Intraepithelial Lymphocytes and Coeliac Lymphogram Evaluated by Flow Cytometry for Coeliac Disease Diagnosis. Nutrients 2019, 11, 1992. [Google Scholar] [CrossRef]
- Basu, K.; Creasey, H.; Bruggemann, N.; Stevens, J.; Bloxham, D.; Woodward, J.M. Diagnosis of coeliac disease by flow cytometry of intraepithelial lymphocytes: A new ‘gold’ standard? Frontline Gastroenterol. 2022, 13, 119–125. [Google Scholar] [CrossRef]
- Fernández-Bañares, F.; Crespo, L.; Núñez, C.; López-Palacios, N.; Tristán, E.; Vivas, S.; Farrais, S.; Arau, B.; Vidal, J.; Roy, G.; et al. Gamma delta+ intraepithelial lymphocytes and coeliac lymphogram in a diagnostic approach to coeliac disease in patients with seronegative villous atrophy. Aliment. Pharmacol. Ther. 2020, 51, 699–705. [Google Scholar] [CrossRef]
- Ruiz-Ramírez, P.; Carreras, G.; Fajardo, I.; Tristán, E.; Carrasco, A.; Salvador, I.; Zabana, Y.; Andújar, X.; Ferrer, C.; Horta, D.; et al. Intraepithelial Lymphocyte Cytometric Pattern Is a Useful Diagnostic Tool for Coeliac Disease Diagnosis Irrespective of Degree of Mucosal Damage and Age—A Validation Cohort. Nutrients 2021, 13, 1684. [Google Scholar] [CrossRef]
- Fernández-Bañares, F.; Farrais, S.; Planella, M.; Melero, J.; López-Palacios, N.; Vivas, S.; Fernández-Salazar, L.; Lanzarote, A.P.; Ruiz-Ramírez, P.; Aguilar-Criado, M.; et al. Coeliac Disease in Elderly Patients: Value of Coeliac Lymphogram for Diagnosis. Nutrients 2021, 13, 2984. [Google Scholar] [CrossRef]
- Fernández-Bañares, F.; Núñez, C.; Montoro, M.; Roy, G.; Esteve, M. Management of Small Bowel Villous Atrophy in Patients Seronegative for Celiac Disease: High Diagnostic Accuracy of Celiac Lymphogram. Am. J. Gastroenterol. 2020, 115, 2110. [Google Scholar] [CrossRef]
- Nijeboer, P.; van Gils, T.; Reijm, M.; Ooijevaar, R.; Lissenberg-Witte, B.I.; Bontkes, H.J.; Mulder, C.J.; Bouma, G. Gamma-Delta T Lymphocytes in the Diagnostic Approach of Coeliac Disease. J. Clin. Gastroenterol. 2019, 53, e208–e213. [Google Scholar] [CrossRef]
- Saborido, R.; Martinón, N.; Regueiro, A.; Crujeiras, V.; Eiras, P.; Leis, R. Intraepithelial lymphocyte immunophenotype: A useful tool in the diagnosis of celiac disease. J. Physiol. Biochem. 2018, 74, 153–158. [Google Scholar] [CrossRef]
- Valle, J.; Morgado, J.M.T.; Ruiz-Martín, J.; Guardiola, A.; Lopes-Nogueras, M.; García-Vela, A.; Martín-Sacristán, B.; Sánchez-Muñoz, L. Flow cytometry of duodenal intraepithelial lymphocytes improves diagnosis of celiac disease in difficult cases. United Eur. Gastroenterol. J. 2017, 5, 819–826. [Google Scholar] [CrossRef]
- Sánchez-Castañon, M.; Castro, B.G.; Toca, M.; Santacruz, C.; Arias-Loste, M.; Iruzubieta, P.; Crespo, J.; López-Hoyos, M. Intraepithelial lymphocytes subsets in different forms of celiac disease. Autoimmun. Highlights 2016, 7, 14. [Google Scholar] [CrossRef]
- Calleja, S.; Vivas, S.; Santiuste, M.; Arias, L.; Hernando, M.; Nistal, E.; Casqueiro, J.; Ruiz de Morales, J.G. Dynamics of non-conventional intraepithelial lymphocytes-NK, NKT, and gammadelta T-in celiac disease: Relationship with age, diet, and histopathology. Dig. Dis. Sci. 2011, 56, 2042–2049. [Google Scholar] [CrossRef]
- Fernández-Bañares, F.; Carrasco, A.; García-Puig, R.; Rosinach, M.; González, C.; Alsina, M.; Loras, C.; Salas, A.; Viver, J.M.; Esteve, M. Intestinal intraepithelial lymphocyte cytometric pattern is more accurate than subepithelial deposits of anti-tissue transglutaminase IgA for the diagnosis of celiac disease in lymphocytic enteritis. PLoS ONE 2014, 9, e101249. [Google Scholar] [CrossRef]
- Oberhuber, G. Histopathology of celiac disease. Biomed. Pharmacother. 2000, 54, 368–372. [Google Scholar] [CrossRef]
- Roy, G.; Fernández-Bañares, F.; Corzo, M.; Gómez-Aguililla, S.; García-Hoz, C.; Núñez, C. Intestinal and blood lymphograms as new diagnostic tests for celiac disease. Front. Immunol. 2022, 13, 1081955. [Google Scholar] [CrossRef]
- Sollid, L.M. The roles of MHC class II genes and post-translational modification in celiac disease. Immunogenetics 2017, 69, 605–616. [Google Scholar] [CrossRef]
- Camarero, C.; Leon, F.; Sanchez, L.; Asensio, A.; Roy, G. Age-related variation of intraepithelial lymphocytes subsets in normal human duodenal mucosa. Dig. Dis. Sci. 2007, 52, 685–691. [Google Scholar] [CrossRef]
- Meresse, B.; Malamut, G.; Cerf-Bensussan, N. Celiac disease: An immunological jigsaw. Immunity 2012, 36, 907–919. [Google Scholar] [CrossRef]
- Savilahti, E.; Ormala, T.; Arato, A.; Hacsek, G.; Holm, K.; Klemola, T.; Nemeth, A.; Mäki, M.; Reunala, T. Density of gamma/delta+ T cells in the jejunal epithelium of patients with coeliac disease and dermatitis herpetiformis is increased with age. Clin. Exp. Immunol. 1997, 109, 464–467. [Google Scholar] [CrossRef]
- Kokkonen, J.; Holm, K.; Karttunen, T.J.; Maki, M. Children with untreated food allergy express a relative increment in the density of duodenal gammadelta+ T cells. Scand. J. Gastroenterol. 2000, 35, 1137–1142. [Google Scholar]
- Nilssen, D.E.; Halstensen, T.S.; Froland, S.S.; Fausa, O.; Brandtzaeg, P. Distribution and phenotypes of duodenal intraepithelial gamma/delta T cells in patients with various types of primary B-cell deficiency. Clin. Immunol. Immunopathol. 1993, 68, 301–310. [Google Scholar] [CrossRef]
- Spencer, J.; Isaacson, P.G.; Macdonald, T.T.; Thomas, A.J.; Walker-Smith, J.A. Gamma/delta T cells and the diagnosis of coeliac disease. Clin. Exp. Immunol. 1991, 85, 109–113. [Google Scholar] [CrossRef]
- León, R.R.; Pérez, L.C.; de Santiago, E.R.; Ariño, G.R.; Martín, A.D.A.; Jiménez, C.G.H.; Rodríguez, E.S.; González, A.S.; Prieto, F.L.; Albillos, A. Genetic and flow cytometry analysis of seronegative celiac disease: A cohort study. Scand. J. Gastroenterol. 2019, 54, 563–570. [Google Scholar] [CrossRef]
- Fernández-Bañares, F.; Carrasco, A.; Rosinach, M.; Arau, B.; García-Puig, R.; González, C.; Tristán, E.; Zabana, Y.; Esteve, M. A Scoring System for Identifying Patients Likely to Be Diagnosed with Low-Grade Coeliac Enteropathy. Nutrients 2019, 11, 1050. [Google Scholar] [CrossRef]
- Maki, M.; Holm, K.; Collin, P.; Savilahti, E. Increase in gamma/delta T cell receptor bearing lymphocytes in normal small bowel mucosa in latent coeliac disease. Gut 1991, 32, 1412–1414. [Google Scholar] [CrossRef]
- Auricchio, R.; Mandile, R.; Del Vecchio, M.R.; Scapaticci, S.; Galatola, M.; Maglio, M.; Discepolo, V.; Miele, E.; Cielo, D.; Troncone, R.; et al. Progression of Celiac Disease in Children with Antibodies Against Tissue Transglutaminase and Normal Duodenal Architecture. Gastroenterology 2019, 157, 413–420.e3. [Google Scholar] [CrossRef]
- Cheroutre, H.; Lambolez, F.; Mucida, D. The light and dark sides of intestinal intraepithelial lymphocytes. Nat. Rev. Immunol. 2011, 11, 445–456. [Google Scholar] [CrossRef]
- McDonald, B.D.; Jabri, B.; Bendelac, A. Diverse developmental pathways of intestinal intraepithelial lymphocytes. Nat. Rev. Immunol. 2018, 18, 514–525. [Google Scholar] [CrossRef]
- Tye-Din, J.A.; Skodje, G.I.; Sarna, V.K.; Dzuris, J.L.; Russell, A.K.; Goel, G.; Wang, S.; Goldstein, K.E.; Williams, L.J.; Sollid, L.M.; et al. Cytokine release after gluten ingestion differentiates coeliac disease from self-reported gluten sensitivity. United Eur. Gastroenterol. J. 2020, 8, 108–118. [Google Scholar] [CrossRef]
- Bhagat, G.; Naiyer, A.J.; Shah, J.G.; Harper, J.; Jabri, B.; Wang, T.C.; Green, P.H.; Manavalan, J.S. Small intestinal CD8+TCRgammadelta+NKG2A+ intraepithelial lymphocytes have attributes of regulatory cells in patients with celiac disease. J. Clin. Investig. 2008, 118, 281–293. [Google Scholar] [CrossRef]
- Di Marco Barros, R.; Roberts, N.A.; Dart, R.J.; Vantourout, P.; Jandke, A.; Nussbaumer, O.; Deban, L.; Cipolat, S.; Hart, R.; Iannitto, M.L.; et al. Epithelia Use Butyrophilin-like Molecules to Shape Organ-Specific gammadelta T Cell Compartments. Cell 2016, 167, 203–218. [Google Scholar] [CrossRef]
- Mayassi, T.; Ladell, K.; Gudjonson, H.; McLaren, J.E.; Shaw, D.G.; Tran, M.T.; Rokicka, J.J.; Lawrence, I.; Grenier, J.-C.; van Unen, V.; et al. Chronic Inflammation Permanently Reshapes Tissue-Resident Immunity in Celiac Disease. Cell 2019, 176, 967–981.e19. [Google Scholar] [CrossRef]
- Inagaki-Ohara, K.; Chinen, T.; Matsuzaki, G.; Sasaki, A.; Sakamoto, Y.; Hiromatsu, K.; Nakamura-Uchiyama, F.; Nawa, Y.; Yoshimura, A. Mucosal T cells bearing TCRgammadelta play a protective role in intestinal inflammation. J. Immunol. 2004, 173, 1390–1398. [Google Scholar] [CrossRef]
- Dunne, M.R.; Byrne, G.; Chirdo, F.G.; Feighery, C. Coeliac Disease Pathogenesis: The Uncertainties of a Well-Known Immune Mediated Disorder. Front. Immunol. 2020, 11, 1374. [Google Scholar] [CrossRef]
- Servicio de Evaluación del Servicio Canario de la Salud (SESCS). Grupo de Trabajo del Protocolo Para el Diagnóstico Precoz de la Enfermedad Celiaca; Ministerio de Sanidad, Servicios Sociales e Igualdad: Canary Islands, Spain, 2018.


| Controls | ACD Seropositive | ACD Seronegative | GFD | Potential CD | |
|---|---|---|---|---|---|
| TOTAL | 411 | 203 | 14 | 195 | 15 |
| Sex: n [%] | M: 121 [30] F: 289 [70] | M: 54 [27] F: 149 [73] | M: 4 [29] F: 10 [71] | M: 56 [29] F: 139 [71] | M: 4 [36] F: 11 [64] |
| Age (years) | |||||
| Median | 41 | 36 | 44 | 39 | 35 |
| (min/max) Q1/Q3 | (17/88) 31/50 | (17/83) 26/47 | (20/90) 26/66 | (17/85) 27/52 | (19/68) 31/42 |
| Villous atrophy n [%] | |||||
| Marsh 0 | 353 [85.9] | 0 | 0 | 129 [66.2] | 9 [60] |
| Marsh I | 57 [13.9] | 0 | 0 | 34 [17.4] | 3 [20] |
| Marsh II | 1 [0.2] | 0 | 0 | 3 [1.5] | 3 [20] |
| Marsh III A, B, C | 0 | 203 [100] | 14 [100] | 29 [14.9] | 0 |
| Serology n [%] | |||||
| Positive | 0 | 194 [95.5] | 0 [0] | 9 [4.6] | 15 [100] |
| Negative | 412 [100] | 0 | 14 [100] | 112 [57.4] | 0 |
| Not available | 0 | 9 [4.5] | 0 [0] | 74 [38.0] | 0 |
| HLA allele n [%] | |||||
| DQ2 or DQ8 | 92 [22.3] | 114 [56.1] | 12 [85.7] | 115 [59.0] | 11 [73.3] |
| Nor DQ2 or DQ8 | 41 [10.3] | 2 [1.0] | 0 [ | 1 [0.5] | 0 |
| Not available | 277 [67.4] | 87 [42.9] | 2 [14.3] | 79 [40.5] | 4 [26.7] |
| Controls M0 | Controls MI | ACD Seropositive | ACD Seronegative | GFD | Potential CD | |
|---|---|---|---|---|---|---|
| TOTAL | 353 | 57 | 194 | 14 | 195 | 15 |
| % TCRγδ+ | ||||||
| median | 4.8 | 5.5 | 21.35 | 35.25 | 25.5 | 30.6 |
| Q1/Q3 | 2.6/9.2 | 2.1/10.7 | 16.1/30.2 | 19.4/48.8 | 18.7/36.2 | 25.1/41.2 |
| min/max | 0.2/42.0 | 0.4/46.5 | 2.8/60.4 | 13.0/69.2 | 1.1/62.5 | 15.5/64.8 |
| % sCD3− | ||||||
| median | 15.5 | 10.9 | 0.8 | 1.4 | 4.3 | 1.4 |
| Q1/Q3 | 8.7/25.7 | 5.6/15.0 | 0.5/1.4 | 0.9/2.2 | 1.5/8.9 | 0.7/6.7 |
| min/max | 1.2/72.8 | 1.6/42.0 | 0.1/10.8 | 0.4/8.1 | 0.1/50.5 | 0.2/15.8 |
| median | 0.3 | 0.6 | 23.8 | 22.3 | 6.5 | 19.4 |
| Q1/Q3 | 0.1/0.9 | 0.2/1.2 | 13.5/55.1 | 10.0/43.0 | 2.5/20.2 | 8.8/58.9 |
| min/max | 0.004/27.2 | 0.03/6.4 | 2.2/604 | 4.6/76.9 | 0.03/470 | 1.8/135.0 |
| Cut-Off | AUC | Sensitivity (95% CI) | Specificity (95% CI) | LR+ | LR− | |
|---|---|---|---|---|---|---|
| % TCRγδ+ | ≥14% | 0.917 | 84.33 (78.80–88.90) | 86.37 (82.67–89.54) | 6.19 | 0.18 |
| % sCD3− | ≤4% | 0.984 | 94.91 (91.07–97.43) | 91.97 (88.91–94.41) | 11.82 | 0.06 |
| ratio TCRγδ+/sCD3− | ≥5 | 0.992 | 94.91 (91.07–97.43) | 96.11 (93.75–97.76) | 24.38 | 0.05 |
| Sensitivity (95% CI) | Specificity (95% CI) | PPV (95% CI) | NPV (95% CI) | |
|---|---|---|---|---|
| a Complete celiac lymphogram | 0.79 (0.74–0.85) | 0.98 (0.96–0.99) | 0.94 (0.91–0.98) | 0.91 (0.88–0.94) |
| b Complete celiac + partial lymphograms | 1.00 (0.98–1.00) | 0.80 (0.76–0.83) | 0.70 (0.64–0.75) | 1.00 (0.99–1.00) |
Disclaimer/Publisher’s Note: The statements, opinions and data contained in all publications are solely those of the individual author(s) and contributor(s) and not of MDPI and/or the editor(s). MDPI and/or the editor(s) disclaim responsibility for any injury to people or property resulting from any ideas, methods, instructions or products referred to in the content. |
© 2024 by the authors. Licensee MDPI, Basel, Switzerland. This article is an open access article distributed under the terms and conditions of the Creative Commons Attribution (CC BY) license (https://creativecommons.org/licenses/by/4.0/).
Share and Cite
García-Hoz, C.; Crespo, L.; Pariente, R.; De Andrés, A.; Rodríguez-Ramos, R.; Roy, G. Intraepithelial Lymphogram in the Diagnosis of Celiac Disease in Adult Patients: A Validation Cohort. Nutrients 2024, 16, 1117. https://doi.org/10.3390/nu16081117
García-Hoz C, Crespo L, Pariente R, De Andrés A, Rodríguez-Ramos R, Roy G. Intraepithelial Lymphogram in the Diagnosis of Celiac Disease in Adult Patients: A Validation Cohort. Nutrients. 2024; 16(8):1117. https://doi.org/10.3390/nu16081117
Chicago/Turabian StyleGarcía-Hoz, Carlota, Laura Crespo, Roberto Pariente, Ana De Andrés, Rafael Rodríguez-Ramos, and Garbiñe Roy. 2024. "Intraepithelial Lymphogram in the Diagnosis of Celiac Disease in Adult Patients: A Validation Cohort" Nutrients 16, no. 8: 1117. https://doi.org/10.3390/nu16081117
APA StyleGarcía-Hoz, C., Crespo, L., Pariente, R., De Andrés, A., Rodríguez-Ramos, R., & Roy, G. (2024). Intraepithelial Lymphogram in the Diagnosis of Celiac Disease in Adult Patients: A Validation Cohort. Nutrients, 16(8), 1117. https://doi.org/10.3390/nu16081117