
High β-Glucan Whole Grain Barley Reduces Postprandial Glycemic Response in Healthy Adults—Part One of a Randomized Controlled Trial


Abstract
1. Introduction
2. Materials and Methods
2.1. Grain Characteristics
2.2. Experimental Preload Conditions
2.3. Trial Design
2.4. Measurements
2.5. Participant Sample Size Determination
2.6. Participants
2.7. Data Management, Calculations, and Statistical Analyses
2.8. Changes in Response to the COVID-19 Pandemic
3. Results
3.1. Sample
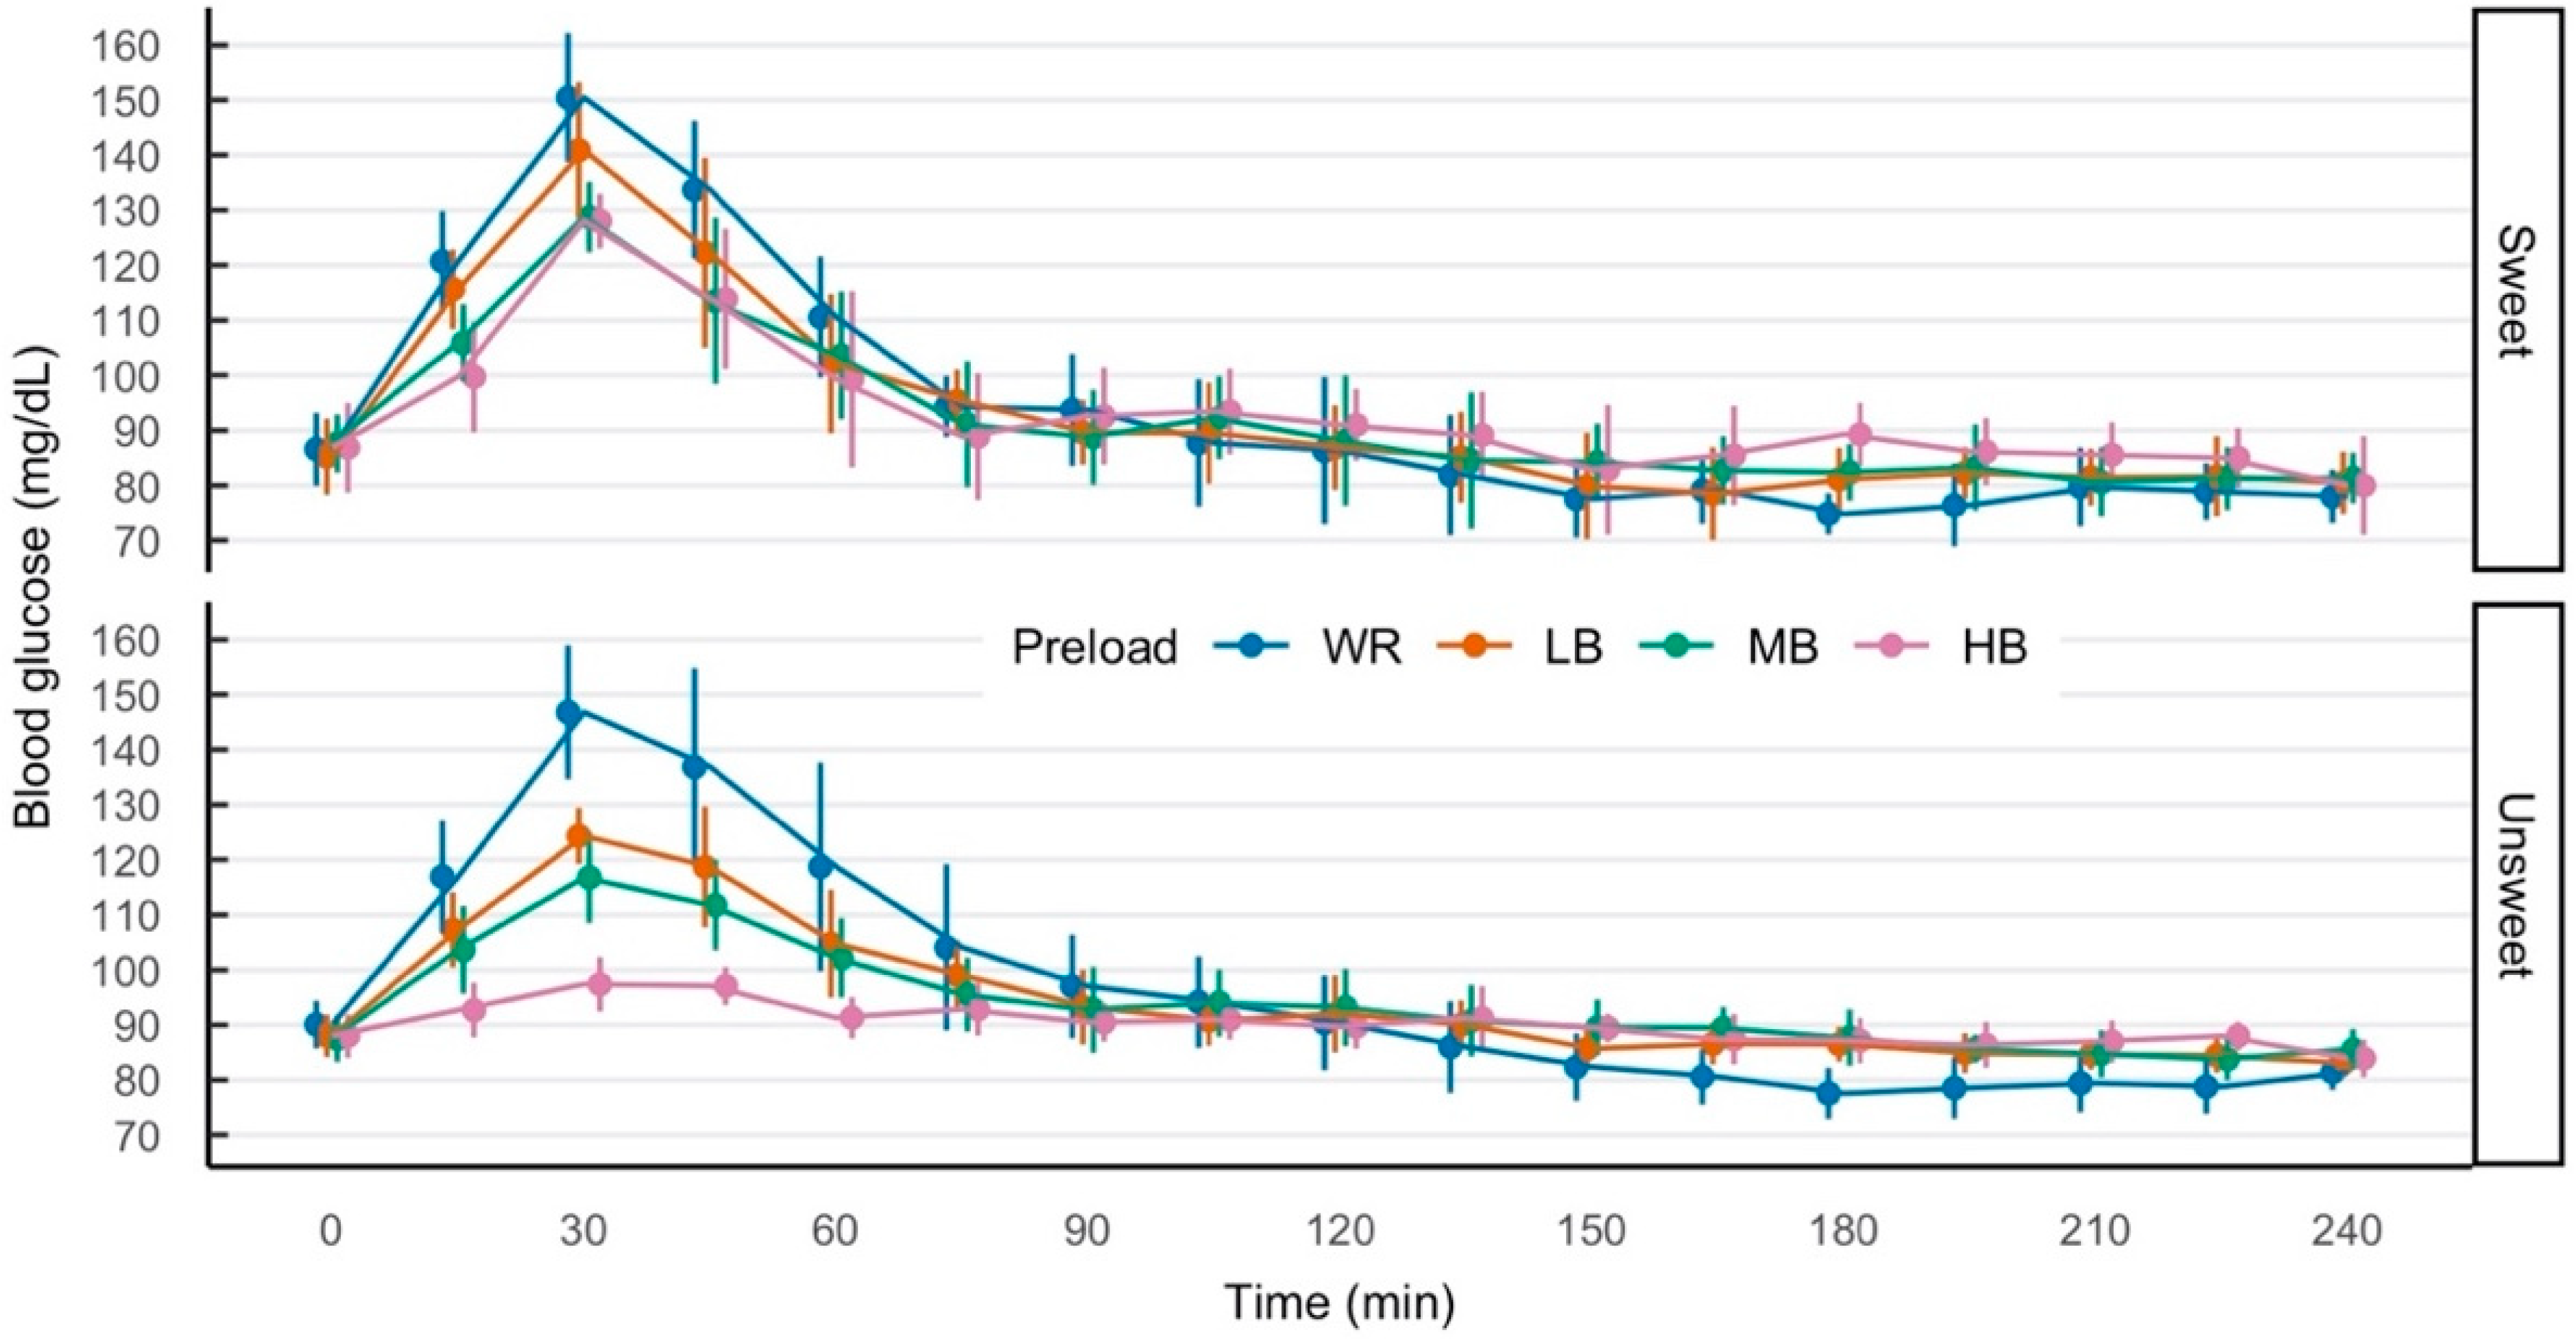
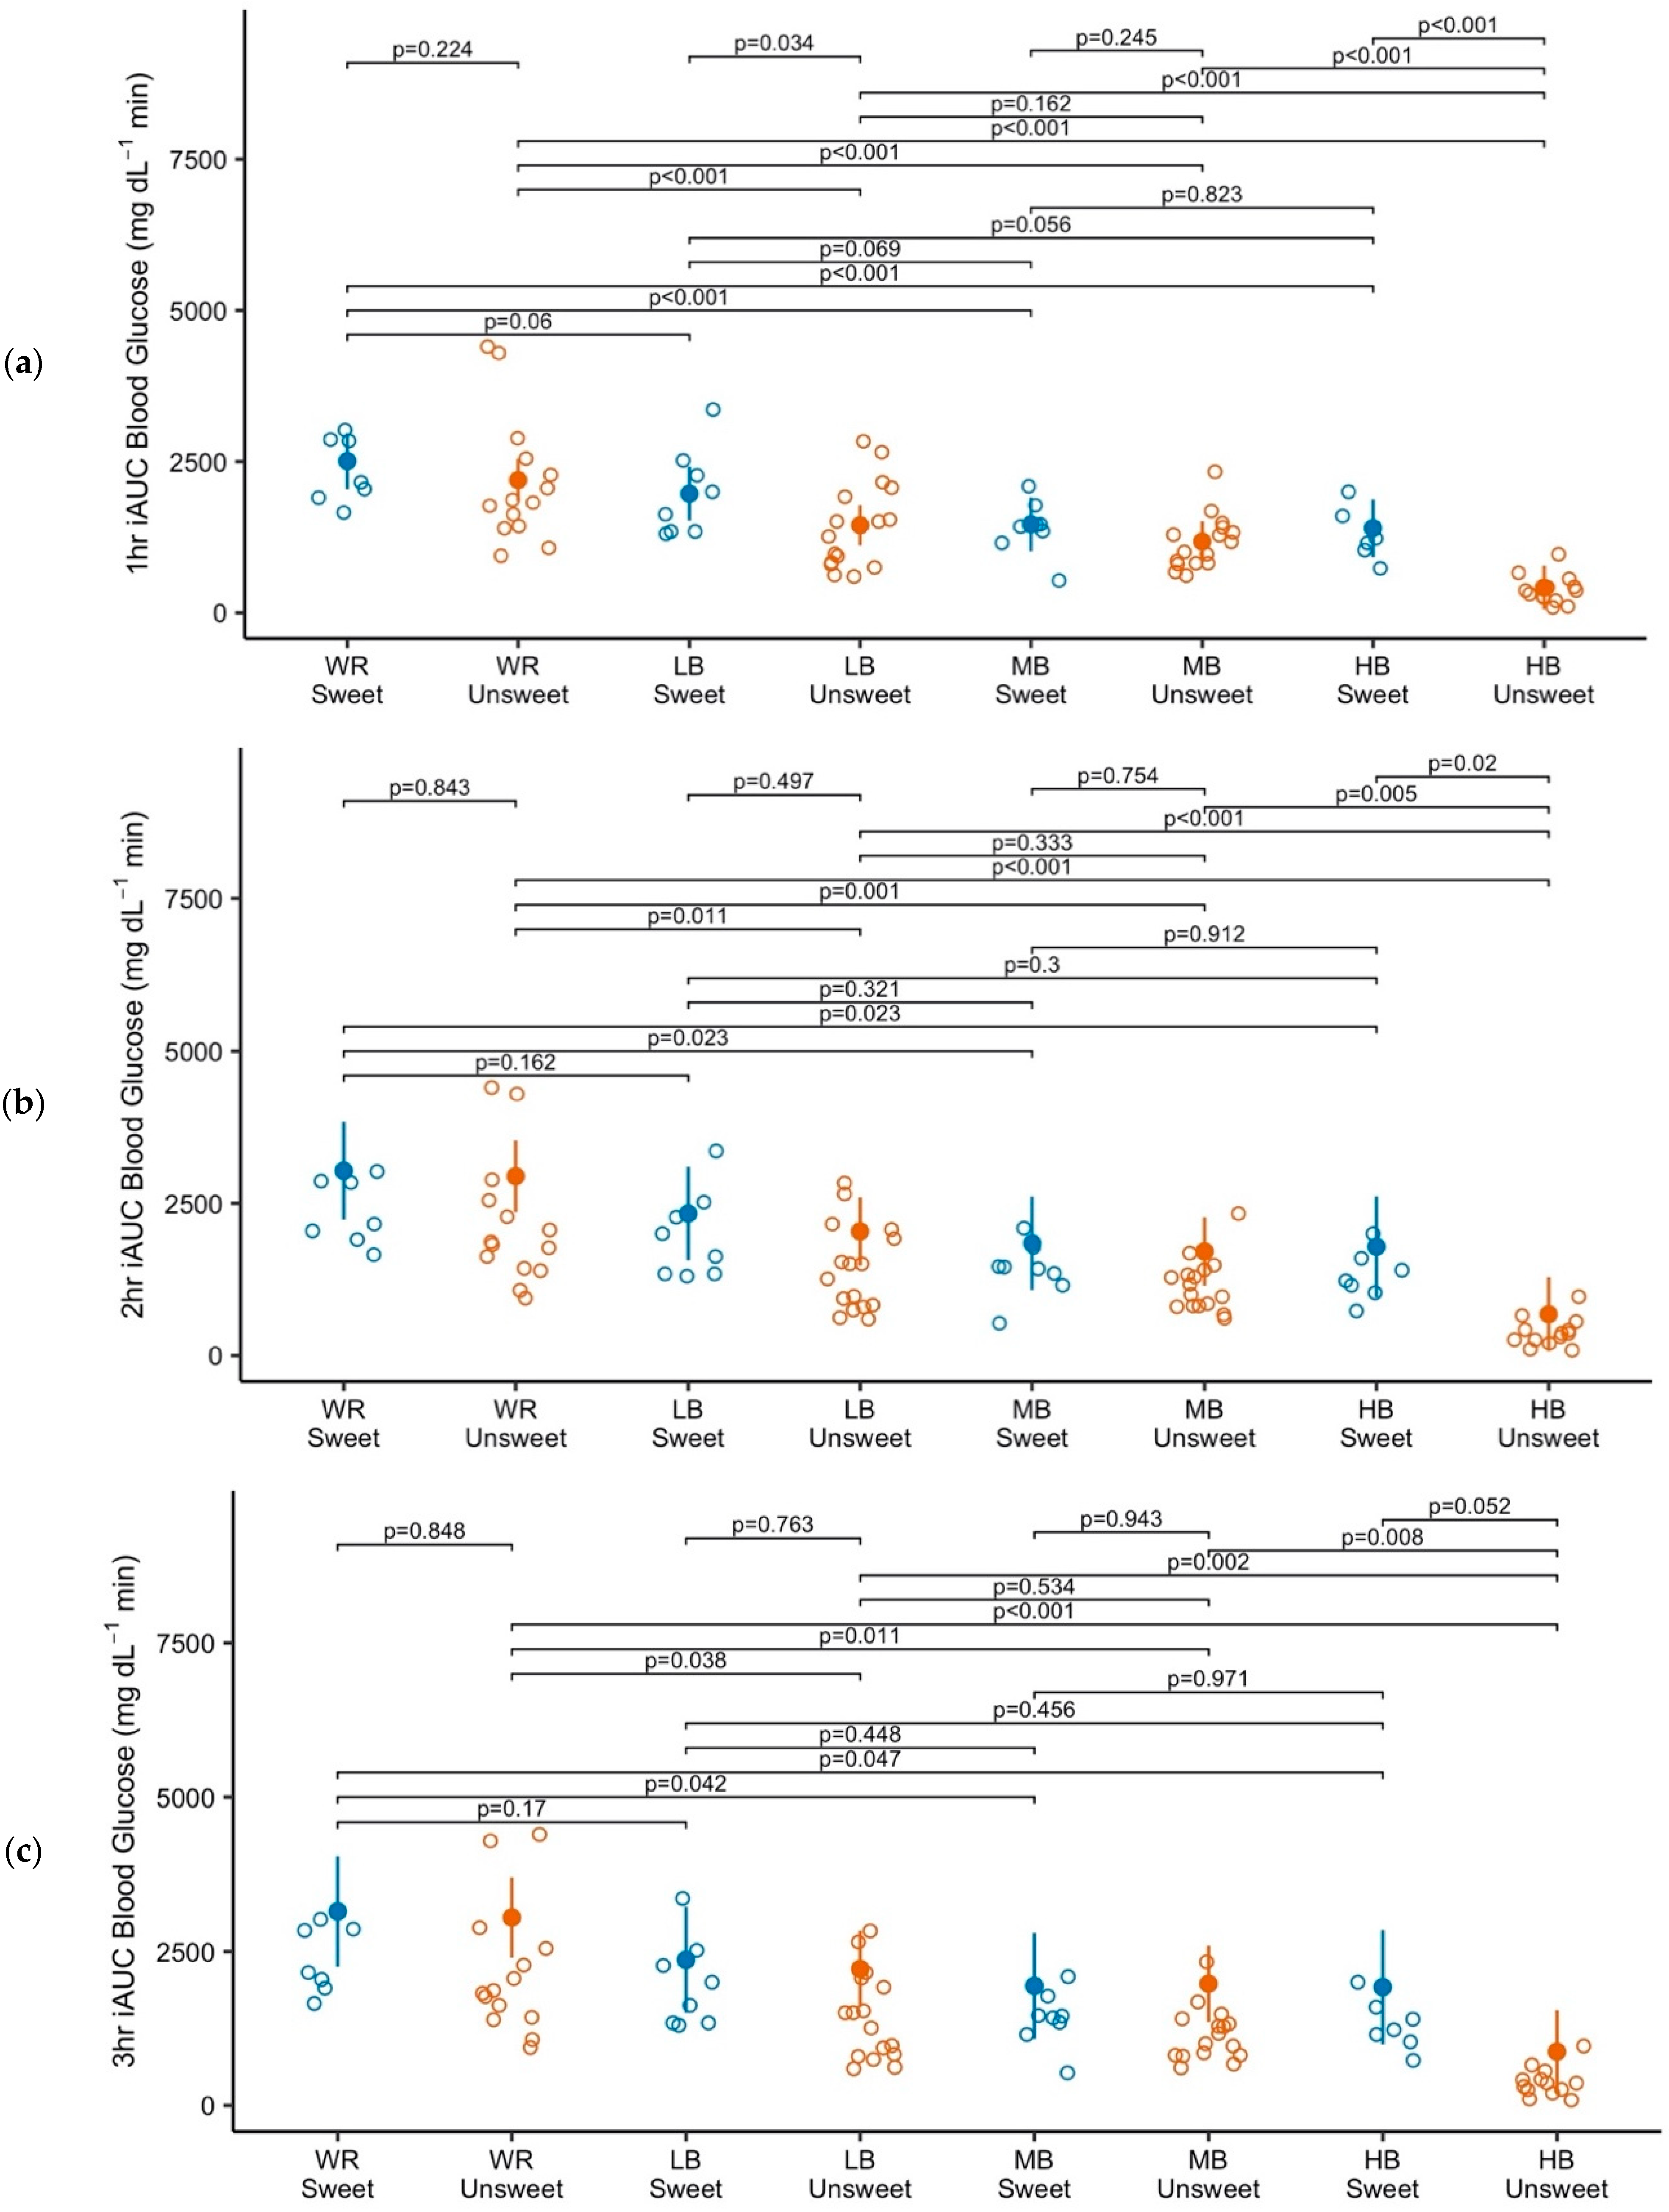
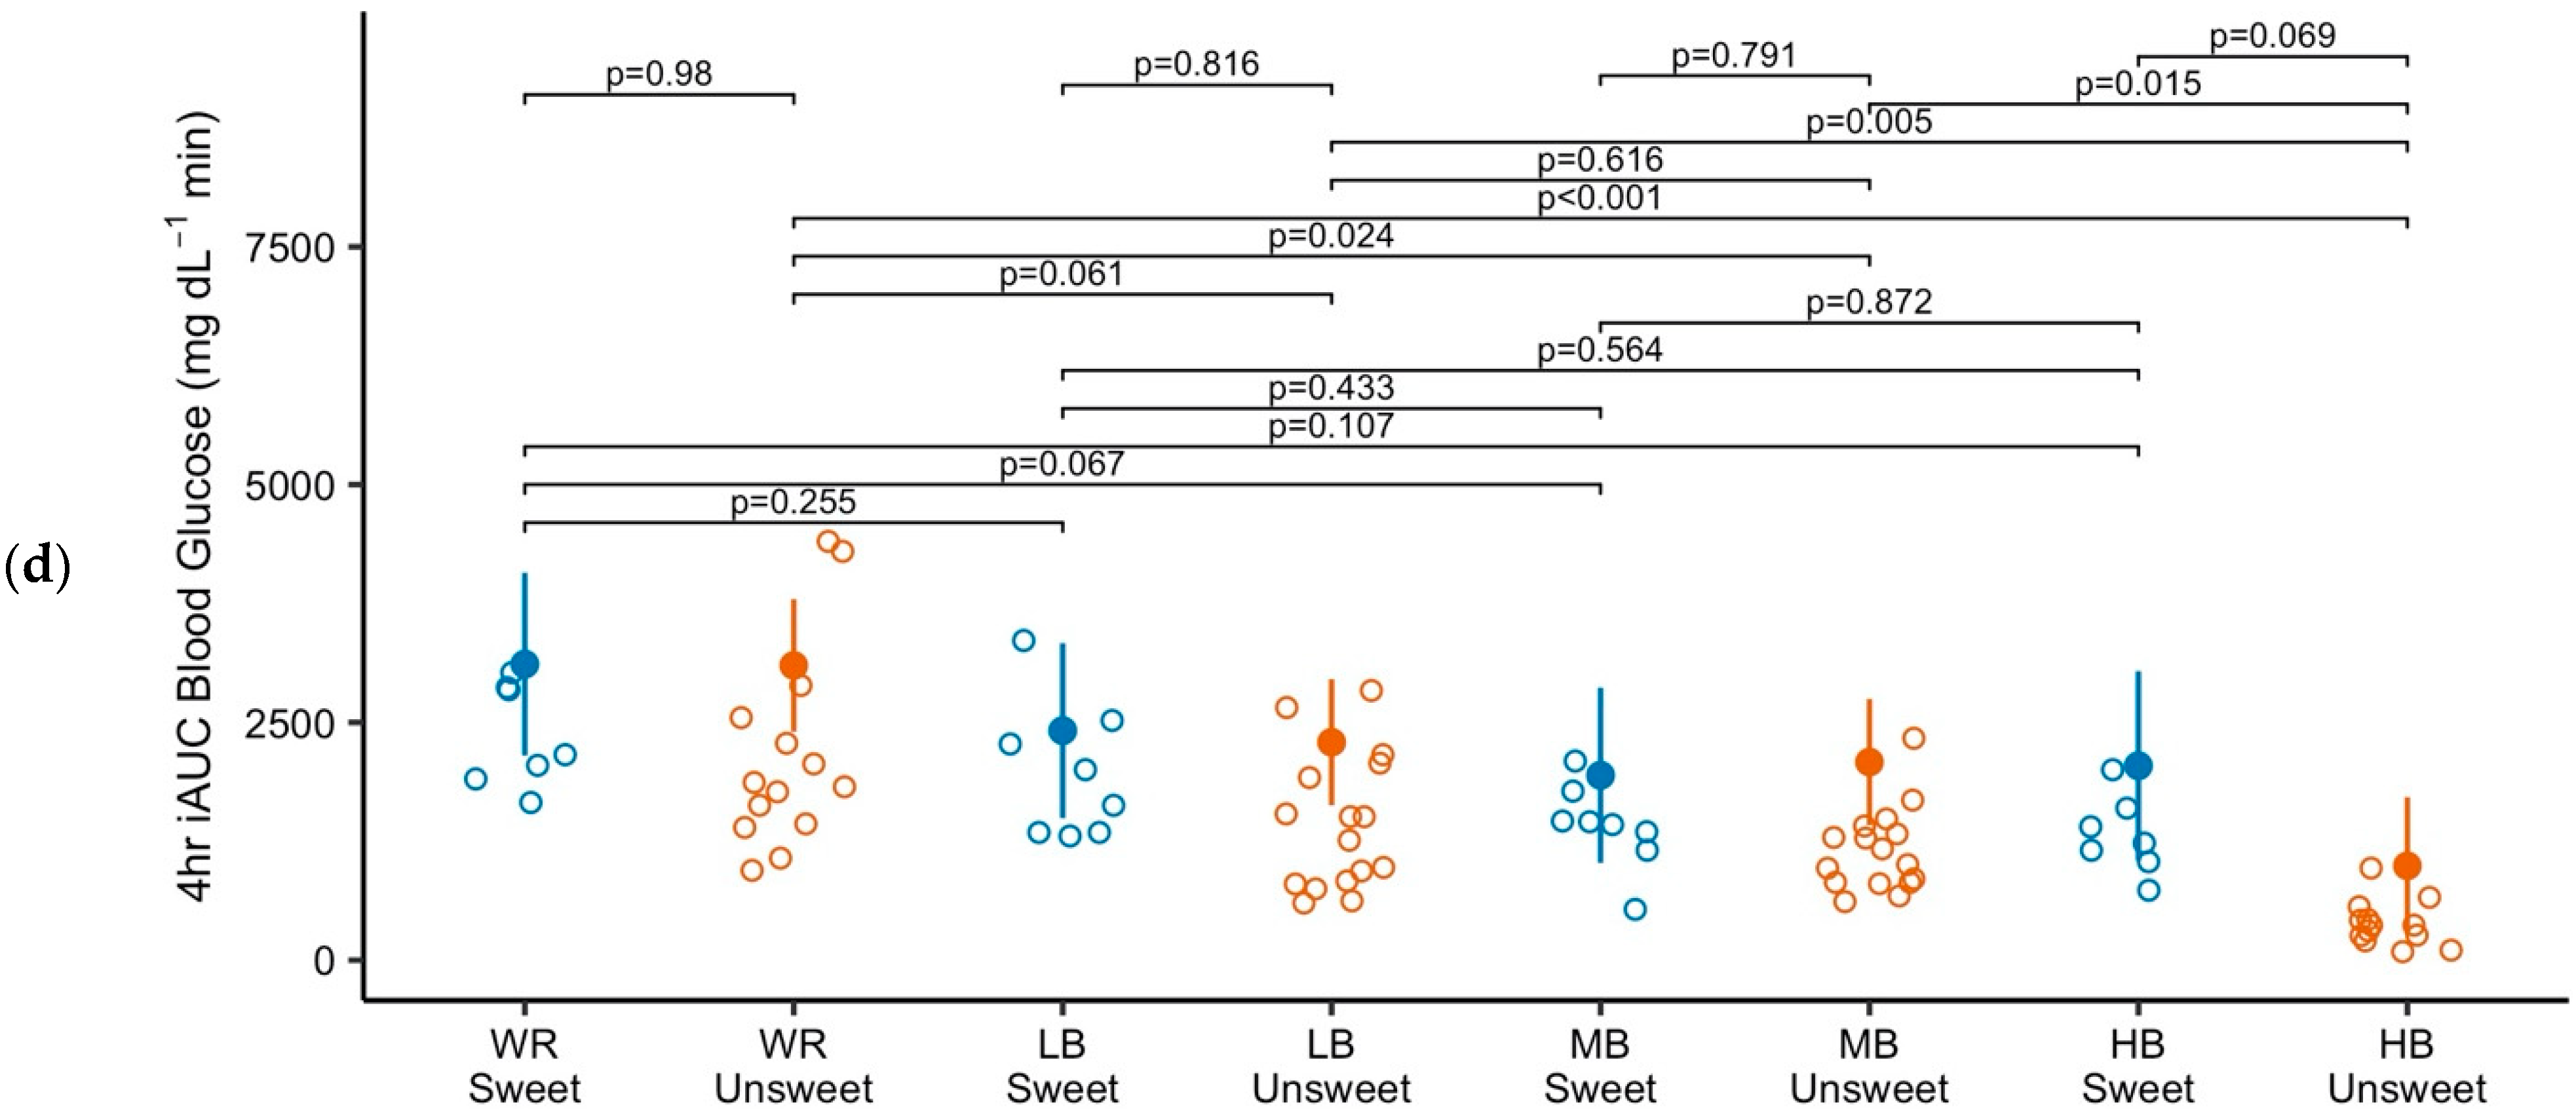
3.2. Blood Glucose
4. Discussion
To Whom Do These Results Apply?
5. Conclusions
Author Contributions
Funding
Institutional Review Board Statement
Informed Consent Statement
Data Availability Statement
Acknowledgments
Conflicts of Interest
Appendix A

| Inclusion criteria | 18–50 years of age |
| Body Mass Index (BMI) values of 18.5–40.0 kg/m2 | |
| Normal fasting blood glucose (<100 mg/dL) | |
| Exclusion criteria | Use of medications known to be associated with weight change (e.g., beta-blockers) |
| Use of steroid pills or shots such as prednisone or cortisone | |
| Use of nicotine | |
| Weight change of ten or more pounds in the last three months | |
| Major daily variation in physical activity (e.g., athletes in training) | |
| History of extensive small bowel surgery or surgery to treat obesity | |
| History of heart attack, stroke, or bypass | |
| History of cancer within the last five years (exception: non-melanoma skin cancer) | |
| Recent or current medical diagnosis or medical treatment that would alter appetite, energy needs, satiety, and/or could impact the results of the trial | |
| Medical diagnoses of diabetes, cardiovascular disease, high levels of blood lipids, asthma, cold, and flu (exception: hypertension, if treated with medication prescribed more than three months prior to the screening activity) | |
| Fear of blood or needles | |
| Dietary restrictions that would interfere with consuming test foods (e.g., gluten intolerance, vegan, corn syrup allergy) | |
| Following a weight modification diet | |
| Sensitive to food textures present in the test foods | |
| Following personal schedules that would not permit attendance at all scheduled testing sessions | |
| Unable to comprehend the nature of the trial or instructions | |
| Unable to understand English sufficiently to complete the trial |
References
- Centers for Disease Control and Prevention. Diabetes in the United States: A Snapshot; U.S. Department of Health and Human Services: Atlanta, GA, USA, 2020.
- Centers for Disease Control and Prevention. National Diabetes Statistics Report 2020; Centers for Disease Control and Prevention; U.S. Department of Health and Human Services: Atlanta, GA, USA, 2020; p. 32.
- Heart Disease and Stroke Statistics—2021 Update. Available online: https://www.ahajournals.org/doi/epub/10.1161/CIR.0000000000000950 (accessed on 8 June 2021).
- Tabák, A.G.; Herder, C.; Rathmann, W.; Brunner, E.J.; Kivimäki, M. Prediabetes: A High-Risk State for Diabetes Development. Lancet 2012, 379, 2279–2290. [Google Scholar] [CrossRef]
- Ford, E.S.; Zhao, G.; Li, C. Pre-Diabetes and the Risk for Cardiovascular Disease. J. Am. Coll. Cardiol. 2010, 55, 1310–1317. [Google Scholar] [CrossRef]
- Hostalek, U. Global Epidemiology of Prediabetes—Present and Future Perspectives. Clin. Diabetes Endocrinol. 2019, 5, 5. [Google Scholar] [CrossRef] [PubMed]
- American Diabetes Association Professional Practice Committee 3. Prevention or Delay of Type 2 Diabetes and Associated Comorbidities: Standards of Medical Care in Diabetes—2022. Diabetes Care 2022, 45, S39–S45. [Google Scholar] [CrossRef]
- Weickert, M.O.; Pfeiffer, A.F. Impact of Dietary Fiber Consumption on Insulin Resistance and the Prevention of Type 2 Diabetes. J. Nutr. 2018, 148, 7–12. [Google Scholar] [CrossRef]
- Dayib, M.; Larson, J.; Slavin, J. Dietary Fibers Reduce Obesity-Related Disorders: Mechanisms of Action. Curr. Opin. Clin. Nutr. Metab. Care 2020, 23, 445–450. [Google Scholar] [CrossRef] [PubMed]
- U.S. Department of Agriculture; U.S. Department of Health and Human Services. Dietary Guidelines for Americans, 2020–2025, 9th ed.; Available at DietaryGuidelines.gov; U.S. Department of Agriculture: Washington, DC, USA, 2020.
- Kranz, S.; Dodd, K.; Juan, W.; Johnson, L.; Jahns, L. Whole Grains Contribute Only a Small Proportion of Dietary Fiber to the U.S. Diet. Nutrients 2017, 9, 153. [Google Scholar] [CrossRef] [PubMed]
- Bouis, H.E.; Saltzman, A. Improving Nutrition through Biofortification: A Review of Evidence from Harvestplus, 2003 through 2016. Glob. Food Sec. 2017, 12, 49–58. [Google Scholar] [CrossRef] [PubMed]
- Sanahuja, G.; Farré, G.; Berman, J.; Zorrilla-López, U.; Twyman, R.M.; Capell, T.; Christou, P.; Zhu, C. A Question of Balance: Achieving Appropriate Nutrient Levels in Biofortified Staple Crops. Nutr. Res. Rev. 2013, 26, 235–245. [Google Scholar] [CrossRef]
- Meints, B.; Cuesta-Marcos, A.; Ross, A.S.; Fisk, S.; Kongraksawech, T.; Marshall, J.M.; Murphy, K.; Hayes, P.M. Developing Winter Food Barley for the Pacific Northwest of the US. Crop Sci. 2015, 55, 1563–1573. [Google Scholar] [CrossRef]
- CGIAR. CGIAR Five-Year Biofortification Strategy 2019–2023; CGIAR: Washington, DC, USA, 2018. [Google Scholar]
- Obert, D.E.; Hang, A.; Hu, G.; Burton, C.; Satterfield, K.; Evans, C.P.; Marshall, J.M.; Jackson, E.W. Registration of ‘Julie’ High β-Glucan Spring Barley. J. Plant Regist. 2013, 7, 1–4. [Google Scholar] [CrossRef]
- Obert, D.E.; Hang, A.; Hu, G.; Burton, C.; Satterfield, K.; Evans, C.P.; Marshall, J.M.; Jackson, E.W. Registration Fo “Transit” High Beta-Glucan Spring Barley. J. Plant Regist. 2011, 5, 270–272. [Google Scholar] [CrossRef]
- El Khoury, D.; Cuda, C.; Luhovyy, B.L.; Anderson, G.H. Beta Glucan: Health Benefits in Obesity and Metabolic Syndrome. J. Nutr. Metab. 2012, 2012, 1–28. [Google Scholar] [CrossRef]
- Behall, K.M.; Schofield, D.J.; Hallfrisch, J. Diets Containing Barley Significantly Reduce Lipids in Mildly Hypercholesterolemic Men and Women. Am. J. Clin. Nutr. 2004, 80, 1185–1193. [Google Scholar] [CrossRef]
- Wang, Y.; Ames, N.P.; Tun, H.M.; Tosh, S.M.; Jones, P.J.; Khafipour, E. High Molecular Weight Barley β-Glucan Alters Gut Microbiota Toward Reduced Cardiovascular Disease Risk. Front. Microbiol. 2016, 7, 129. [Google Scholar] [CrossRef] [PubMed]
- Aoe, S.; Ikenaga, T.; Noguchi, H.; Kohashi, C.; Kakumoto, K.; Kohda, N. Effect of Cooked White Rice with High β-Glucan Barley on Appetite and Energy Intake in Healthy Japanese Subjects: A Randomized Controlled Trial. Plant Foods Hum. Nutr. 2014, 69, 325–330. [Google Scholar] [CrossRef] [PubMed]
- AbuMweis, S.; Thandapilly, S.J.; Storsley, J.; Ames, N. Effect of Barley β-Glucan on Postprandial Glycaemic Response in the Healthy Human Population: A Meta-Analysis of Randomized Controlled Trials. J. Funct. Foods 2016, 27, 329–342. [Google Scholar] [CrossRef]
- Kim, H.; Stote, K.S.; Behall, K.M.; Spears, K.; Vinyard, B.; Conway, J.M. Glucose and Insulin Responses to Whole Grain Breakfasts Varying in Soluble Fiber, β-Glucan: A Dose Response Study in Obese Women with Increased Risk for Insulin Resistance. Eur. J. Nutr. 2009, 48, 170–175. [Google Scholar] [CrossRef]
- Chillo, S.; Ranawana, D.V.; Pratt, M.; Henry, C.J.K. Glycemic Response and Glycemic Index of Semolina Spaghetti Enriched with Barley β-Glucan. Nutrition 2011, 27, 653–658. [Google Scholar] [CrossRef] [PubMed]
- Ames, N.; Blewett, H.; Storsley, J.; Thandapilly, S.J.; Zahradka, P.; Taylor, C. A Double-Blind Randomised Controlled Trial Testing the Effect of a Barley Product Containing Varying Amounts and Types of Fibre on the Postprandial Glucose Response of Healthy Volunteers. Br. J. Nutr. 2015, 113, 1373–1383. [Google Scholar] [CrossRef]
- Soluble Fiber from Certain Foods and Risk of Coronary Heart Disease (CHD), 21 C.F.R. § 101. 2020. Available online: https://www.ecfr.gov/current/title-21/chapter-I/subchapter-B/part-101/subpart-E/section-101.81 (accessed on 17 August 2021).
- Hebelstrup, K.H.; Nielsen, M.M.; Carciofi, M.; Andrzejczak, O.; Shaik, S.S.; Blennow, A.; Palcic, M.M. Waxy and Non-Waxy Barley Cultivars Exhibit Differences in the Targeting and Catalytic Activity of GBSS1a. J. Exp. Bot. 2017, 68, 931–941. [Google Scholar] [CrossRef] [PubMed]
- Kim, H.; Behall, K.M.; Vinyard, B.; Conway, J.M. Short-Term Satiety and Glycemic Response After Consumption of Whole Grains with Various Amounts of β-Glucan. Cereal Foods World 2006, 51, 29–33. [Google Scholar] [CrossRef]
- Makelainen, H.; Anttila, H.; Sihvonen, J.; Hietanen, R.-M.; Tahvonen, R.; Salminen, E.; Mikola, M.; Sontag-Strohm, T. The Effect of B-Glucan on the Glycemic and Insulin Index. Eur. J. Clin. Nutr. 2007, 61, 779–785. [Google Scholar] [CrossRef]
- Thondre, P.S.; Wang, K.; Rosenthal, A.J.; Henry, C.J.K. Glycaemic Response to Barley Porridge Varying in Dietary Fibre Content. Br. J. Nutr. 2012, 107, 719–724. [Google Scholar] [CrossRef] [PubMed]
- Harris, P.A.; Taylor, R.; Thielke, R.; Payne, J.; Gonzalez, N.; Conde, J.G. Research Electronic Data Capture (REDCap)—A Metadata-Driven Methodology and Workflow Process for Providing Translational Research Informatics Support. J. Biomed. Inform. 2009, 42, 377–381. [Google Scholar] [CrossRef] [PubMed]
- Harris, P.A.; Taylor, R.; Minor, B.L.; Elliott, V.; Fernandez, M.; O’Neal, L.; McLeod, L.; Delacqua, G.; Delacqua, F.; Kirby, J.; et al. The REDCap Consortium: Building an International Community of Software Platform Partners. J. Biomed. Inform. 2019, 95, 103208. [Google Scholar] [CrossRef]
- Belobrajdic, D.P.; Regina, A.; Klingner, B.; Zajac, I.; Chapron, S.; Berbezy, P.; Bird, A.R. High-Amylose Wheat Lowers the Postprandial Glycemic Response to Bread in Healthy Adults: A Randomized Controlled Crossover Trial. J. Nutr. 2019, 149, 1335–1345. [Google Scholar] [CrossRef] [PubMed]
- Perrigue, M.M.; Monsivais, P.; Drewnowski, A. Added Soluble Fiber Enhances the Satiating Power of Low-Energy-Density Liquid Yogurts. J. Am. Diet. Assoc. 2009, 109, 1862–1868. [Google Scholar] [CrossRef]
- R Core Team. R: A Language and Environment for Statistical Computing; R Core Team: Vienna, Austria, 2020. [Google Scholar]
- Lenth, R.V.; Buerkner, P.; Herve, M.; Love, J.; Riebl, H.; Singmann, H. Estimated Marginal Means, Aka Least-Squares Means. 2021. Available online: https://cran.r-project.org/web/packages/emmeans/emmeans.pdf (accessed on 17 August 2021).
- Bates, D.; Mächler, M.; Bolker, B.; Walker, S. Fitting Linear Mixed-Effects Models Using Lme4. J. Stat. Soft. 2015, 67, 48. [Google Scholar] [CrossRef]
- Cumming, G.; Finch, S. Inference by Eye: Confidence Intervals and How to Read Pictures of Data. Am. Psychol. 2005, 60, 170–180. [Google Scholar] [CrossRef]
- Perlis, R.H.; Haneuse, S.J.P.A.; Rubenfeld, G.D.; Fihn, S.D.; Rivara, F.P. Reporting Clinical Studies Affected by the COVID-19 Pandemic: Guidelines for Authors. JAMA Netw. Open 2021, 4, e2036155. [Google Scholar] [CrossRef] [PubMed]
- Rosenkranz, G.K. Analysis of Cross-over Studies with Missing Data. Stat. Methods Med. Res. 2015, 24, 420–433. [Google Scholar] [CrossRef] [PubMed]
- Senn, S. Cross-over Trials in Clinical Research, 2nd ed.; Statistics in practice; J. Wiley: Chichester, UK; New York, NY, USA, 2002; ISBN 978-0-471-49653-3. [Google Scholar]
- Pocock, S.J.; McMurray, J.J.V.; Collier, T.J. Making Sense of Statistics in Clinical Trial Reports. J. Am. Coll. Cardiol. 2015, 66, 2536–2549. [Google Scholar] [CrossRef] [PubMed]
- Greenland, S.; Senn, S.J.; Rothman, K.J.; Carlin, J.B.; Poole, C.; Goodman, S.N.; Altman, D.G. Statistical Tests, P Values, Confidence Intervals, and Power: A Guide to Misinterpretations. Eur. J. Epidemiol. 2016, 31, 337–350. [Google Scholar] [CrossRef]
- Tosh, S.M. Review of Human Studies Investigating the Post-Prandial Blood-Glucose Lowering Ability of Oat and Barley Food Products. Eur. J. Clin. Nutr. 2013, 67, 310–317. [Google Scholar] [CrossRef]
- US Preventive Services Task Force; Davidson, K.W.; Barry, M.J.; Mangione, C.M.; Cabana, M.; Caughey, A.B.; Davis, E.M.; Donahue, K.E.; Doubeni, C.A.; Krist, A.H.; et al. Screening for Prediabetes and Type 2 Diabetes: US Preventive Services Task Force Recommendation Statement. JAMA 2021, 326, 736. [Google Scholar] [CrossRef]
- Salacinski, A.J.; Alford, M.; Drevets, K.; Hart, S.; Hunt, B.E. Validity and Reliability of a Glucometer Against Industry Reference Standards. J. Diabetes Sci. Technol. 2014, 8, 95–99. [Google Scholar] [CrossRef]

| Preload | β-Glucan (%, Dry Weight Basis) | β-Glucan (g) | Total Dietary Fiber (g) | Protein (g) | Flour Amount (g) | Energy (Kcal) | Volume (mL) | |
|---|---|---|---|---|---|---|---|---|
| Sweet | WR | 0 | 0.0 | 2.6 | 3.3 | 65.5 | 391 | 240 |
| LB | 8.2 | 4.2 | 10.2 | 3.6 | 60.2 | 391 | 240 | |
| MB | 8.8 | 4.8 | 11.4 | 4.2 | 60.4 | 391 | 240 | |
| HB | 11 | 5.7 | 25.1 | 6.8 | 57.1 | 391 | 240 | |
| Unsweet | WR | 0 | 0.0 | 2.6 | 3.3 | 65.5 | 250 | 240 |
| LB | 8.2 | 4.2 | 10.2 | 3.6 | 60.2 | 250 | 240 | |
| MB | 8.8 | 4.8 | 11.4 | 4.2 | 60.4 | 250 | 240 | |
| HB | 11 | 5.7 | 25.1 | 6.8 | 57.1 | 250 | 240 | |
| Preload Condition | ||||
|---|---|---|---|---|
| WR | LB | MB | HB | |
| Sweet | 7 | 8 | 8 | 7 |
| Unsweet | 14 | 16 | 16 | 13 |
| Males (n = 7) | Females (n = 9) | Total (n = 16) | |
|---|---|---|---|
| Age (y) | 32.3 (9.1) | 28.8 (8.1) | 30.3 (8.4) |
| Body Mass Index (kg/m2) | 24.4 (1.9) | 24.6 (4.6) | 24.4 (3.6) |
| Weight (kg) | 81.0 (5.5) | 66.7 (15.2) | 72.9 (13.8) |
| Blood glucose at screening (mg/dL) | 89.6 (6.5) | 89.6 (7.5) | 89.6 (6.8) |
Disclaimer/Publisher’s Note: The statements, opinions and data contained in all publications are solely those of the individual author(s) and contributor(s) and not of MDPI and/or the editor(s). MDPI and/or the editor(s) disclaim responsibility for any injury to people or property resulting from any ideas, methods, instructions or products referred to in the content. |
© 2025 by the authors. Licensee MDPI, Basel, Switzerland. This article is an open access article distributed under the terms and conditions of the Creative Commons Attribution (CC BY) license (https://creativecommons.org/licenses/by/4.0/).
Share and Cite
Kellogg, J.A.; Monsivais, P.; Murphy, K.M.; Perrigue, M.M. High β-Glucan Whole Grain Barley Reduces Postprandial Glycemic Response in Healthy Adults—Part One of a Randomized Controlled Trial. Nutrients 2025, 17, 430. https://doi.org/10.3390/nu17030430
Kellogg JA, Monsivais P, Murphy KM, Perrigue MM. High β-Glucan Whole Grain Barley Reduces Postprandial Glycemic Response in Healthy Adults—Part One of a Randomized Controlled Trial. Nutrients. 2025; 17(3):430. https://doi.org/10.3390/nu17030430
Chicago/Turabian StyleKellogg, Julianne A., Pablo Monsivais, Kevin M. Murphy, and Martine M. Perrigue. 2025. "High β-Glucan Whole Grain Barley Reduces Postprandial Glycemic Response in Healthy Adults—Part One of a Randomized Controlled Trial" Nutrients 17, no. 3: 430. https://doi.org/10.3390/nu17030430
APA StyleKellogg, J. A., Monsivais, P., Murphy, K. M., & Perrigue, M. M. (2025). High β-Glucan Whole Grain Barley Reduces Postprandial Glycemic Response in Healthy Adults—Part One of a Randomized Controlled Trial. Nutrients, 17(3), 430. https://doi.org/10.3390/nu17030430