Weight Status and Psychological Distress in a Mediterranean Spanish Population: A Symmetric U-Shaped Relationship

 ,
,
Abstract
:
1. Introduction
2. Materials and Methods
2.1. Population and Sample
2.2. Measures
2.3. Data Analysis
 ) were reported as measures of effect size. Following Cohen’s criteria [28], we considered small effect = 0.0099; medium effect = 0.0588 and large effect = 0.1379.
3. Results

| Variable | Value | Total | Underweight | Normal weight | Overweight | Obese | p 1 | |||||
|---|---|---|---|---|---|---|---|---|---|---|---|---|
| N | (%) | N | (%) | N | (%) | N | (%) | N | (%) | |||
| Gender | Male | 235 | (41.7) | 37 | (47.4) | 63 | (44.4) | 67 | (39.4) | 68 | (39.3) | 0.523 |
| Female | 328 | (58.3) | 41 | (52.6) | 79 | (55.6) | 103 | (60.6) | 105 | (60.7) | ||
| Age | 15–24 | 79 | (14.1) | 52 | (66.7) | 929593015 | (6.3) | 18 | (10.6) | 0 | (0) | <0.001 |
| 25–34 | 15 | (20.5) | 17 | (21.8) | 29 | (20.4) | 44 | (25.9) | 25 | (14.5) | ||
| 35–44 | 191 | (34.0) | 3 | (3.8) | 59 | (41.5) | 52 | (30.6) | 77 | (44.8) | ||
| 45–54 | 115 | (20.5) | 6 | (7.7) | 30 | (21.1) | 37 | (21.8) | 42 | (24.4) | ||
| 55–64 | 62 | (11.0) | 0 | (0) | 15 | (10.6) | 19 | (11.2) | 28 | (16.3) | ||
| Education | No studies | 74 | (14.6) | 0 | (0) | 3 | (2.5) | 18 | (11.2) | 53 | (36.6) | <0.001 |
| Primary | 183 | (36.2) | 35 | (44.9 | 46 | (37.7) | 53 | (32.9) | 49 | (33.8) | ||
| Secondary | 162 | (32.0) | 36 | (46.2) | 41 | (33.6) | 60 | (37.3) | 53492518 | (17.2) | ||
| University | 87 | (17.2) | 7 | (9.0) | 32 | (26.2) | 30 | (18.6) | 18 | (12.4) | ||
| Paid work | Yes | 235 | (41.7) | 13 | (16.7) | 85 | (59.9) | 91 | (53.5) | 46 | (26.6) | <0.001 |
| No | 328 | (58.3) | 65 | (83.3) | 57 | (40.1) | 79 | (46.5) | 127 | (73.4) | ||
| Live alone | Yes | 79 | (14.0) | 11 | (14.1) | 11 | (7.7) | 25 | (14.7) | 32 | (18.5) | 0.056 |
| No | 484 | (86.0) | 67 | (85.9) | 131 | (92.3) | 145 | (85.3) | 141 | (81.5) | ||
| Origin | Rural | 74 | (13.1)) | 6 | (7.7) | 16 | (11.3) | 20 | (11.8) | 32 | (18.5) | 0.069 |
| Urban | 489 | (86.9) | 72 | (92.3) | 126 | (88.7) | 150 | (88.2) | 141 | (81.5) | ||
| FH 2 Obesity | Yes | 84 | (14.9) | 12 | (15.4) | 7 | (4.9) | 25 | (14.7) | 40 | (23.1) | <0.001 |
| No | 579 | (85.1) | 66 | (84.6) | 135 | (95.1) | 145 | (85.3) | 133 | (76.9) | ||
| FH 2 Psychiatric Disease | Yes | 98 | (17.4) | 13 | (16.7) | 13 | (9.2) | 23 | (13.5) | 49 | (28.3) | <0.001 |
| No | 465 | (82.6) | 65 | (83.3) | 129 | (90.8) | 147 | (86.5) | 124 | (71.7) | ||
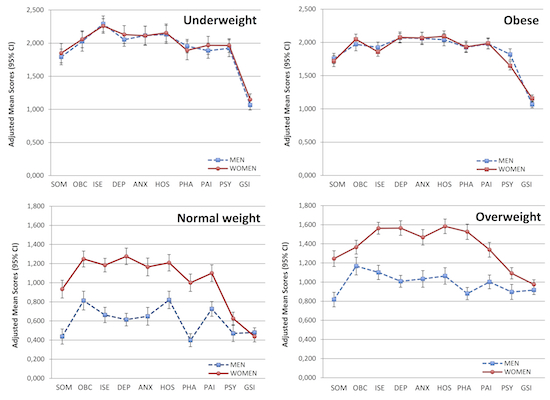
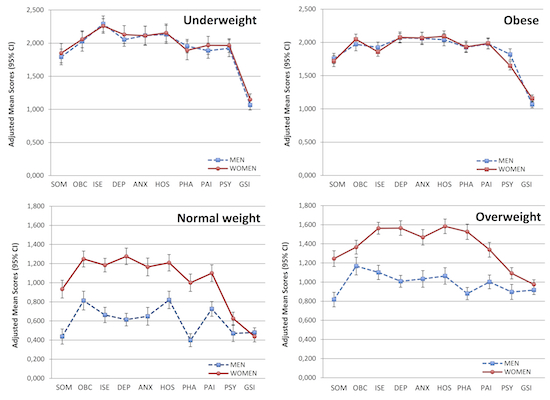
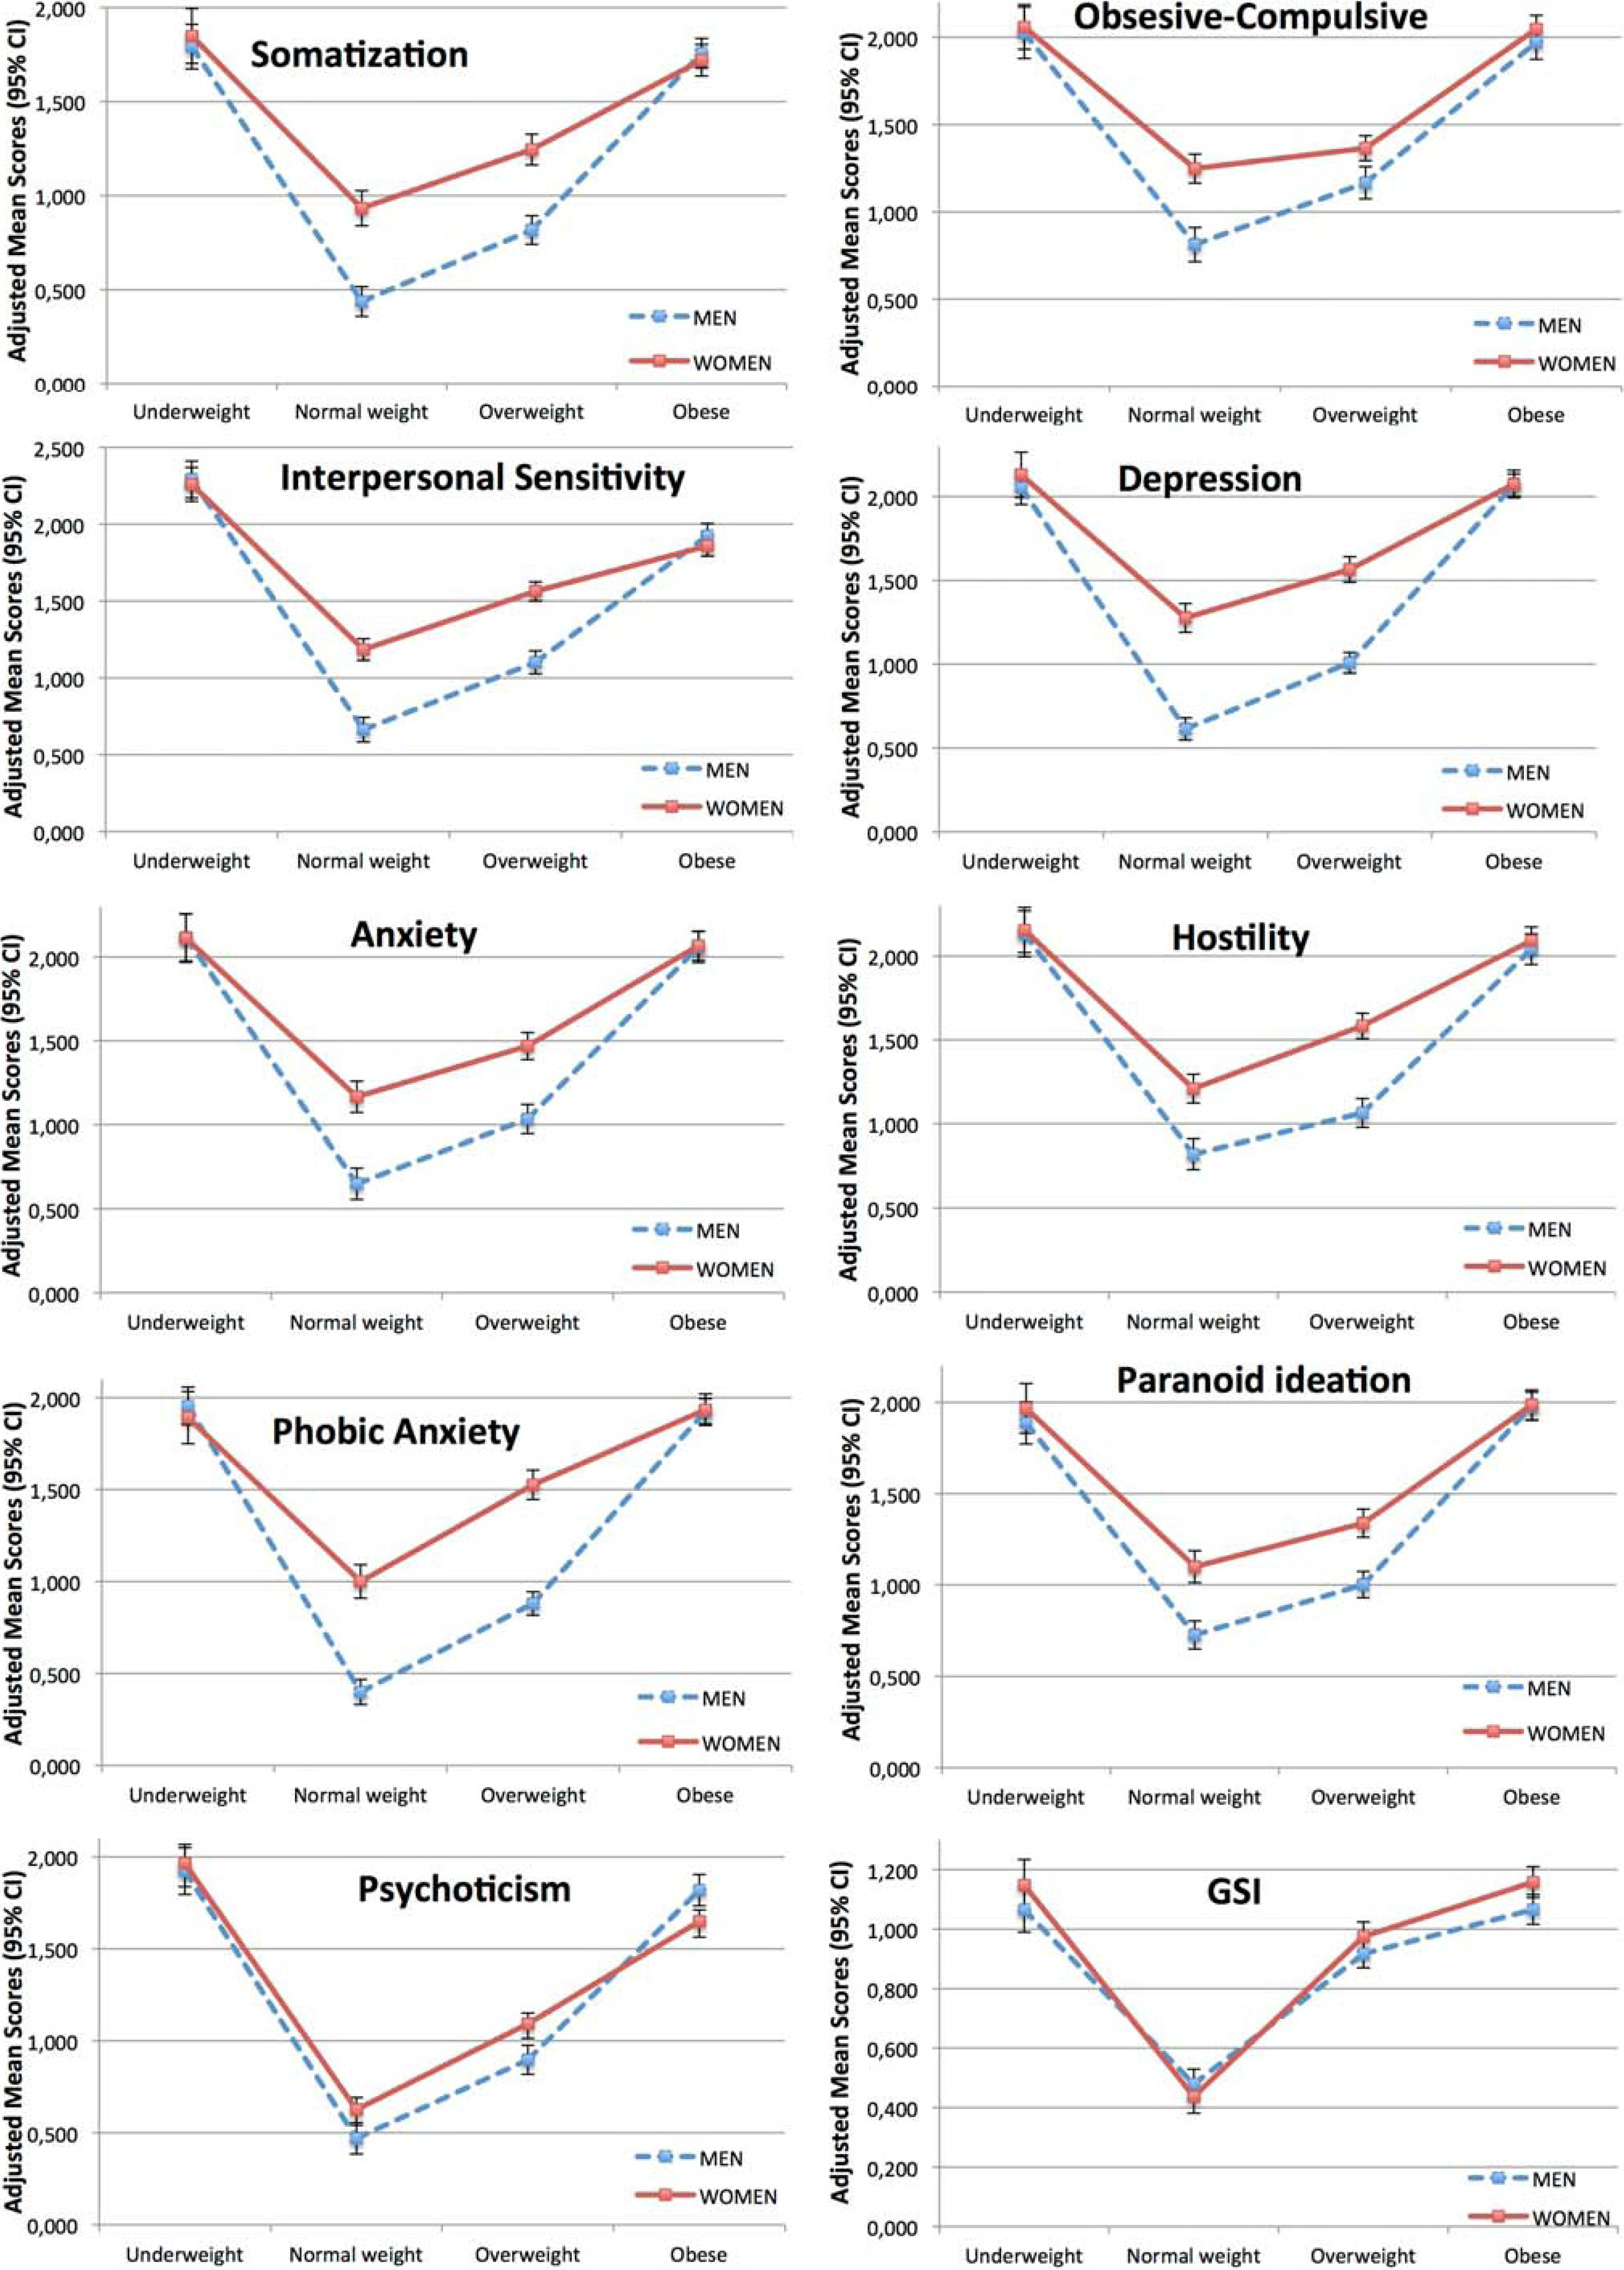
= 0.839) and the lowest was for GSI ( = 0.584).| SCL-90-R dimensions | Underweight | Normal weight | Overweight | Obese | p-value (ANCOVA) | p for quadratic trend | Partial eta squared ( ) |
|---|---|---|---|---|---|---|---|
| Somatization 1 | 1.792 *# (1.673–1.911) | 0.437 (0.358–0.516) | 0.817 * (0.741–0.894) | 1.758 *# (1.680-1.837) | <0.001 | <0.001 | 0.771 |
| Obsesive-compulsive 2 | 2.026 *# (1.879–2.173) | 0.813 (0.715–0.911) | 1.167 * (1.075–1.258) | 1.972 *# (1.874–2.070) | <0.001 | <0.001 | 0.601 |
| Interpersonal sensitivity 2 | 2.291 *#§ (2.171–2.410) | 0.663 (0.583–0.743) | 1.101 * (1.026–1.175) | 1.925 *# (1.845–2.005) | <0.001 | <0.001 | 0.759 |
| Depression 2 | 2.053 *# (1.953–2.153) | 0.614 (0.548–0.681) | 1.008 * (0.946–1.070) | 2.068 *# (2.001–2.135) | <0.001 | <0.001 | 0.834 |
| Anxiety 2 | 2.116 *# (1.976–2.256) | 0.649 (0.556–0.743) | 1.033 * (0.946–1.120) | 2.059 *# (1.966–2.152) | <0.001 | <0.001 | 0.714 |
| Hostility 2 | 2.132 *# (1.995–2.269) | 0.820 (0.729–0.912) | 1.064 * (0.978–1.149) | 2.040 *# (1.949–2.131) | <0.001 | <0.001 | 0.679 |
| Phobic anxiety 2 | 1.955 *# (1.853–2.058) | 0.399 (0.331–0.468) | 0.880 * (0.816–0.944) | 1.926 *# (1.858–1.995) | <0.001 | <0.001 | 0.839 |
| Paranoid ideation 2 | 1.887 *# (1.772–2.003) | 0.726 (0.649–0.803) | 1.002 * (0.930–1.074) | 1.978 *# (1.901–2.056) | <0.001 | <0.001 | 0.737 |
| Psychoticism 2 | 1.923 *# (1.796–2.050) | 0.470 (0.385–0.555) | 0.897 * (0.818–0.976) | 1.819 *# (1.734–1.903) | <0.001 | <0.001 | 0.734 |
| Global Severity Index 2 | 1.065 *# (0.990–1.140) | 0.479 (0.429–0.528) | 0.917 * (0.870–0.963) | 1.066 *# (1.016–1.116) | <0.001 | <0.001 | 0.584 |
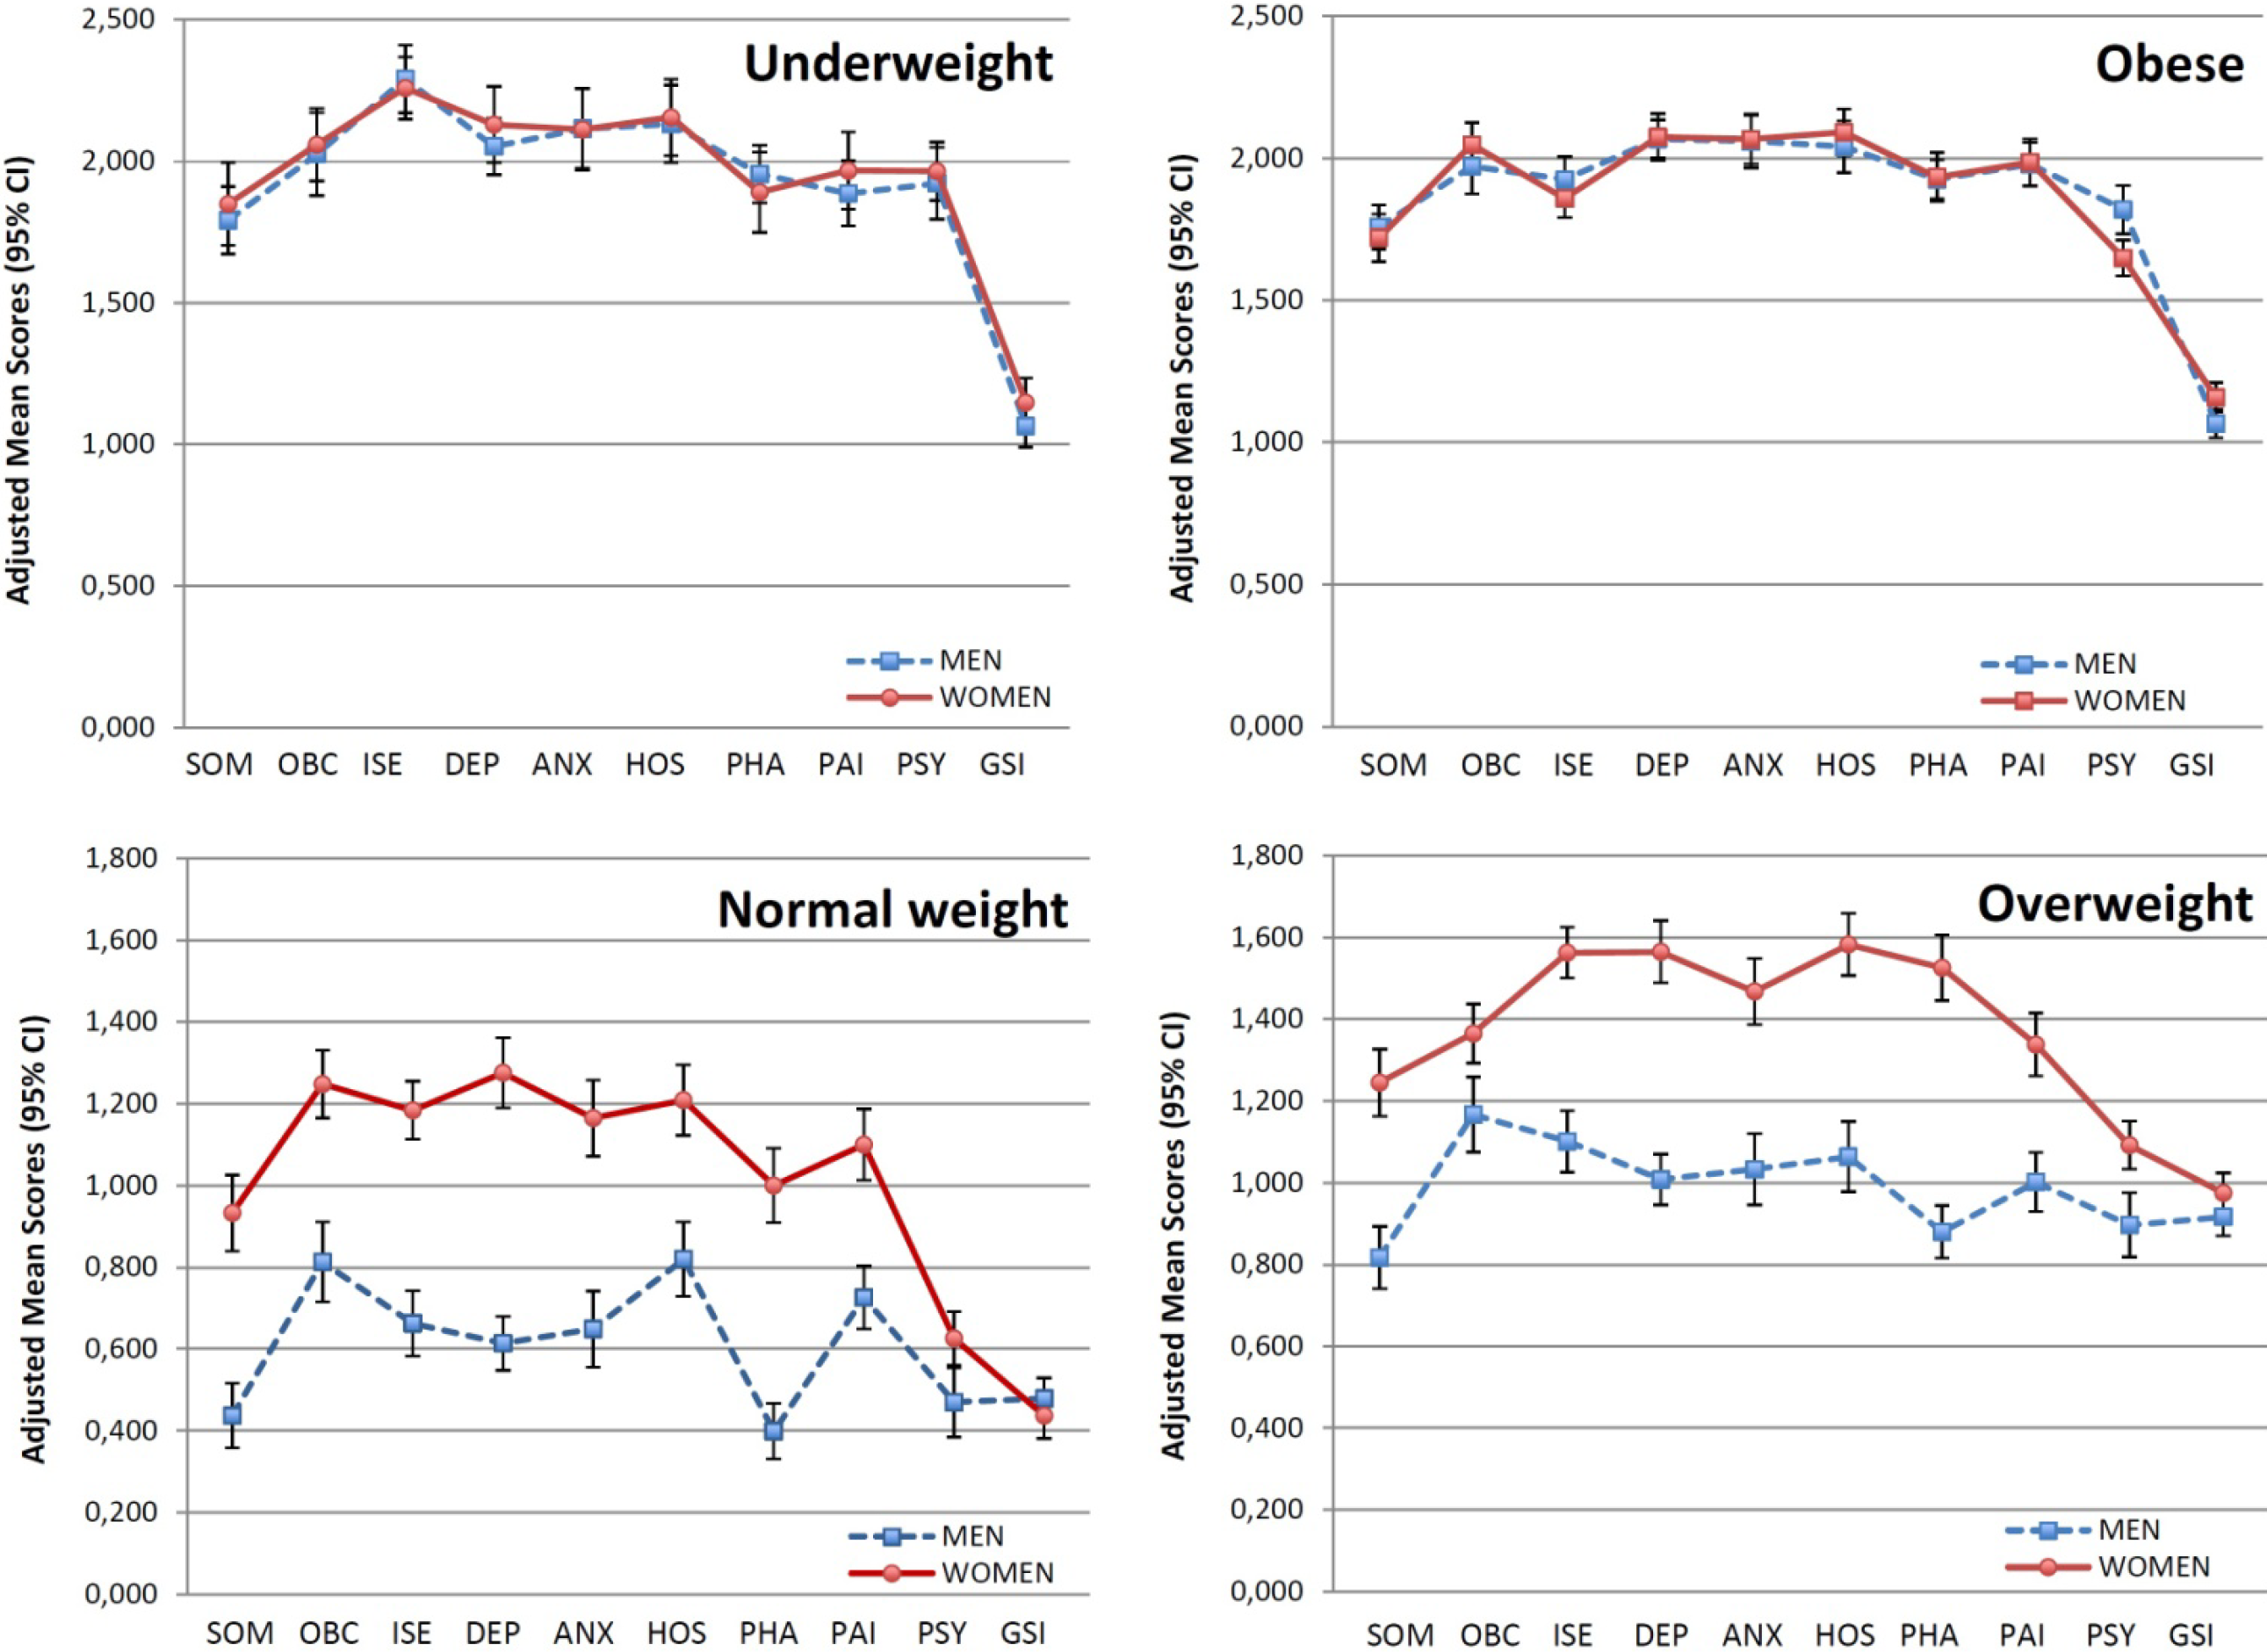
 = 0.690) and the lowest was for somatization ( = 0.410).
| SCL-90-R dimensions | Underweight | Normal weight | Overweight | Obese | p-value (ANCOVA) | p for quadratic trend | Partial eta squared ( ) |
|---|---|---|---|---|---|---|---|
| Somatization 1 | 1.849 * # (1.703–1.994) | 0.933 (0.840–1.027) | 1.245 * (1.163–1.327) | 1.720 *# (1.636–1.803) | <0.001 | <0.001 | 0.401 |
| Obsesive-compulsive 2 | 2.059 *# (1.931–2.187) | 1.248 (1.165–1.330) | 1.365 (1.293–1.437) | 2.047 *# (1.969–2.124) | <0.001 | <0.001 | 0.472 |
| Interpersonal sensitivity 2 | 2.259 *#§ (2.149–2.370) | 1.184 (1.113–1.255) | 1.563 * (1.501–1.625) | 1.858 *# (1.792–1.925) | <0.001 | <0.001 | 0.510 |
| Depression 2 | 2.130 *# (1.995–2.266) | 1.276 (1.190–1.363) | 1.565 * (1.489-1.641) | 2.075 *# (1.993–2.157) | <0.001 | <0.001 | 0.410 |
| Anxiety 2 | 2.113 *# (1.968–2.258) | 1.165 (1.072–1.258) | 1.468 * (1.387–1.550) | 2.067 *# (1.980–2.155) | <0.001 | <0.001 | 0.437 |
| Hostility 2 | 2.155 *# (2.020–2.290) | 1.209 (1.123–1.296) | 1.583 * (1.507–1.659) | 2.091 *# (2.009–2.172) | <0.001 | <0.001 | 0.453 |
| Phobic anxiety 2 | 1.891 *# (1.749–2.033) | 1.000 (0.909–1.091) | 1.526 * (1.446-1.606) | 1.934 *# (1.848–2.020) | <0.001 | <0.001 | 0.428 |
| Paranoid ideation 2 | 1.967 *# (1.831–2.103) | 1.100 (1.013–1.188) | 1.338 * (1.261–1.415) | 1.986 *# (1.904–2.069) | <0.001 | <0.001 | 0.458 |
| Psychoticism 2 | 1.965 *#§ (1.862–2.069) | 0.626 (0.560–0.693) | 1.092 * (1.033–1.150) | 1.649 *# (1.586–1.711) | <0.001 | <0.001 | 0.690 |
| Global Severity Index 2 | 1.148 *# (1.062–1.235) | 0.437 (0.381–0.492) | 0.975 * (0.926–1.023) | 1.158 *# (1.106–1.210) | <0.001 | <0.001 | 0.560 |

4. Discussion
5. Conclusions
Author Contributions
Conflicts of Interest
References
- Wardle, J.; Cooke, L. The Impact of Obesity on Psychological Well-being. Best Pract. Res. Clin. Endocrinol. Metab. 2005, 19, 421–440. [Google Scholar] [CrossRef]
- Atlantis, E.; Baker, M. Obesity Effects on Depression: Systematic Review of Epidemiological Studies. Int. J. Obes. (Lond.) 2008, 32, 881–891. [Google Scholar] [CrossRef]
- Luppino, F.S.; de Wit, L.M.; Bouvy, P.F.; Stijnen, T.; Cuijpers, P.; Penninx, B.W.; Zitman, F.G. Overweight, Obesity, and Depression: A Systematic Review and Meta-Analysis of Longitudinal Studies. Arch. Gen. Psychiatry 2010, 67, 220–229. [Google Scholar] [CrossRef]
- McCrea, R.L.; Berger, Y.G.; King, M.B. Body Mass Index and Common Mental Disorders: Exploring the Shape of the Association and its Moderation by Age, Gender and Education. Int. J. Obes. (Lond.) 2012, 36, 414–421. [Google Scholar] [CrossRef]
- Kelly, S.J.; Daniel, M.; Dal Grande, E.; Taylor, A. Mental Ill-Health Across the Continuum of Body Mass Index. BMC Public Health 2011, 11, 765. [Google Scholar] [CrossRef]
- de Wit, L.M.; van Straten, A.; van Herten, M.; Penninx, B.W.; Cuijpers, P. Depression and Body Mass Index, a U-Shaped Association. BMC Public Health 2009, 9, 14. [Google Scholar] [CrossRef]
- Zhao, G.; Ford, E.S.; Li, C.; Strine, T.W.; Dhingra, S.; Berry, J.T.; Mokdad, A.H. Serious Psychological Distress and its Associations with Body Mass Index: Findings from the 2007 Behavioral Risk Factor Surveillance System. Int. J. Public Health 2009, 54 (Suppl. 1), 30–36. [Google Scholar] [CrossRef]
- Atlantis, E.; Ball, K. Association between Weight Perception and Psychological Distress. Int. J. Obes. (Lond.) 2008, 32, 715–721. [Google Scholar] [CrossRef]
- Petry, N.M.; Barry, D.; Pietrzak, R.H.; Wagner, J.A. Overweight and Obesity are Associated with Psychiatric Disorders: Results from the National Epidemiologic Survey on Alcohol and Related Conditions. Psychosom. Med. 2008, 70, 288–297. [Google Scholar] [CrossRef]
- Marek, R.J.; Ben-Porath, Y.S.; Merrell, J.; Ashton, K.; Heinberg, L.J. Predicting One and Three Month Postoperative Somatic Concerns, Psychological Distress, and Maladaptive Eating Behaviors in Bariatric Surgery Candidates with the Minnesota Multiphasic Personality Inventory-2 Restructured Form (MMPI-2-RF). Obes. Surg. 2014, 24, 631–639. [Google Scholar] [CrossRef]
- Marek, R.J.; Ben-Porath, Y.S.; Windover, A.; Tarescavage, A.M.; Merrell, J.; Ashton, K.; Lavery, M.; Heinberg, L.J. Assessing Psychosocial Functioning of Bariatric Surgery Candidates with the Minnesota Multiphasic Personality Inventory-2 Restructured Form (MMPI-2-RF). Obes. Surg. 2013, 23, 1864–1873. [Google Scholar] [CrossRef]
- Ransom, D.; Ashton, K.; Windover, A.; Heinberg, L. Internal Consistency and Validity Assessment of SCL-90-R for Bariatric Surgery Candidates. Surg. Obes. Relat. Dis. 2010, 6, 622–627. [Google Scholar] [CrossRef]
- Schneider, N.; Salbach-Andrae, H.; Merle, J.V.; Hein, J.; Pfeiffer, E.; Lehmkuhl, U.; Ehrlich, S. Psychopathology in Underweight and Weight-Recovered Females with Anorexia Nervosa. Eat. Weight Disord. 2009, 14, e205–e211. [Google Scholar] [CrossRef]
- Zhao, G.; Ford, E.S.; Dhingra, S.; Li, C.; Strine, T.W.; Mokdad, A.H. Depression and Anxiety among US Adults: Associations with Body Mass Index. Int. J. Obes. (Lond.) 2009, 33, 257–266. [Google Scholar] [CrossRef]
- Scott, K.M.; Bruffaerts, R.; Simon, G.E.; Alonso, J.; Angermeyer, M.; de Girolamo, G.; Demyttenaere, K.; Gasquet, I.; Haro, J.M.; Karam, E.; et al. Obesity and Mental Disorders in the General Population: Results from the World Mental Health Surveys. Int. J. Obes. (Lond.) 2008, 32, 192–200. [Google Scholar] [CrossRef] [Green Version]
- Scott, K.M.; McGee, M.A.; Wells, J.E.; Oakley Browne, M.A. Obesity and Mental Disorders in the Adult General Population. J. Psychosom. Res. 2008, 64, 97–105. [Google Scholar]
- Simon, G.E.; Von Korff, M.; Saunders, K.; Miglioretti, D.L.; Crane, P.K.; van Belle, G.; Kessler, R.C. Association between Obesity and Psychiatric Disorders in the US Adult Population. Arch. Gen. Psychiatry 2006, 63, 824–830. [Google Scholar]
- Brandheim, S.; Rantakeisu, U.; Starrin, B. BMI and Psychological Distress in 68,000 Swedish Adults: A Weak Association when Controlling for an Age-Gender Combination. BMC Public Health 2013, 13, 68. [Google Scholar] [CrossRef]
- Gu, J.K.; Charles, L.E.; Burchfiel, C.M.; Andrew, M.E.; Ma, C.; Bang, K.M.; Violanti, J.M. Associations between Psychological Distress and Body Mass Index among Law Enforcement Officers: The National Health Interview Survey 2004–2010. Saf. Health. Work. 2013, 4, 52–62. [Google Scholar]
- Hodge, A.; Almeida, O.P.; English, D.R.; Giles, G.G.; Flicker, L. Patterns of Dietary Intake and Psychological Distress in Older Australians: Benefits Not just from a Mediterranean Diet. Int. Psychogeriatr. 2013, 25, 456–466. [Google Scholar] [CrossRef]
- Rienks, J.; Dobson, A.J.; Mishra, G.D. Mediterranean Dietary Pattern and Prevalence and Incidence of Depressive Symptoms in Mid-Aged Women: Results from a Large Community-Based Prospective Study. Eur. J. Clin. Nutr. 2013, 67, 75–82. [Google Scholar] [CrossRef]
- Sanchez-Villegas, A.; Martinez-Gonzalez, M.A.; Estruch, R.; Salas-Salvado, J.; Corella, D.; Covas, M.I.; Aros, F.; Romaguera, D.; Gomez-Gracia, E.; Lapetra, J.; et al. Mediterranean Dietary Pattern and Depression: The PREDIMED Randomized Trial. BMC Med. 2013, 11, 208. [Google Scholar] [CrossRef] [Green Version]
- Beunza, J.J.; Toledo, E.; Hu, F.B.; Bes-Rastrollo, M.; Serrano-Martinez, M.; Sanchez-Villegas, A.; Martinez, J.A.; Martinez-Gonzalez, M.A. Adherence to the Mediterranean Diet, Long-Term Weight Change, and Incident Overweight Or Obesity: The Seguimiento Universidad De Navarra (SUN) Cohort. Am. J. Clin. Nutr. 2010, 92, 1484–1493. [Google Scholar] [CrossRef]
- Esposito, K.; Kastorini, C.M.; Panagiotakos, D.B.; Giugliano, D. Mediterranean Diet and Weight Loss: Meta-Analysis of Randomized Controlled Trials. Metab. Syndr. Relat. Disord. 2011, 9, 1–12. [Google Scholar] [CrossRef]
- World Health Organization. Expert Committee on Physical Status. Physical Status: The use and Interpretation of Anthropometry. World Health Organization: Geneva, Switzerland, 1995. [Google Scholar]
- MacCallum, R.C.; Zhang, S.; Preacher, K.J.; Rucker, D.D. On the Practice of Dichotomization of Quantitative Variables. Psychol. Methods 2002, 7, 19–40. [Google Scholar] [CrossRef]
- Derogatis, L.R. SCL-90-R. Cuestionario De 90 Síntomas-Manual. TEA Ediciones: Madrid, Spain, 2002. [Google Scholar]
- Cohen, J. Statistical Power Analysis for the Behavioral Sciences, 2nd ed.Lawrence Erlbaum Associates, Inc.: Hillsdale, NJ, USA, 1988; pp. 284–288. [Google Scholar]
- Gu, D.; He, J.; Duan, X.; Reynolds, K.; Wu, X.; Chen, J.; Huang, G.; Chen, C.S.; Whelton, P.K. Body Weight and Mortality among Men and Women in China. JAMA 2006, 295, 776–783. [Google Scholar] [CrossRef]
- Hjartaker, A.; Adami, H.O.; Lund, E.; Weiderpass, E. Body Mass Index and Mortality in a Prospectively Studied Cohort of Scandinavian Women: The Women’s Lifestyle and Health Cohort Study. Eur. J. Epidemiol. 2005, 20, 747–754. [Google Scholar] [CrossRef]
- Kivimaki, M.; Ferrie, J.E.; Batty, G.D.; Davey Smith, G.; Elovainio, M.; Marmot, M.G.; Shipley, M.J. Optimal Form of Operationalizing BMI in Relation to all-Cause and Cause-Specific Mortality: The Original Whitehall Study. Obesity (Silver Spring) 2008, 16, 1926–1932. [Google Scholar] [CrossRef]
- Denison, F.; Norwood, P.; Bhattacharya, S.; Duffy, A.; Mahmood, T.; Morris, C.; Raja, E.; Norman, J.; Lee, A.; Scotland, G. Association between Maternal Body Mass Index during Pregnancy, Short-Term Morbidity, and Increased Health Service Costs: A Population-Based Study. BJOG 2014, 121, 72–81. [Google Scholar] [CrossRef]
- Phung, D.T.; Wang, Z.; Rutherford, S.; Huang, C.; Chu, C. Body Mass Index and Risk of Pneumonia: A Systematic Review and Meta-Analysis. Obes. Rev. 2013, 14, 839–857. [Google Scholar] [CrossRef]
- Martin-Lopez, R.; Perez-Farinos, N.; Hernandez-Barrera, V.; de Andres, A.L.; Carrasco-Garrido, P.; Jimenez-Garcia, R. The Association between Excess Weight and Self-Rated Health and Psychological Distress in Women in Spain. Public Health Nutr. 2011, 14, 1259–1265. [Google Scholar]
- Algul, A.; Ates, M.A.; Semiz, U.B.; Basoglu, C.; Ebrinc, S.; Gecici, O.; Gulsun, M.; Kardesoglu, E.; Cetin, M. Evaluation of General Psychopathology, Subjective Sleep Quality, and Health-Related Quality of Life in Patients with Obesity. Int. J. Psychiatry Med. 2009, 39, 297–312. [Google Scholar] [CrossRef]
- Kubzansky, L.D.; Gilthorpe, M.S.; Goodman, E. A Prospective Study of Psychological Distress and Weight Status in adolescents/young Adults. Ann. Behav. Med. 2012, 43, 219–228. [Google Scholar] [CrossRef]
- de Wit, L.; Luppino, F.; van Straten, A.; Penninx, B.; Zitman, F.; Cuijpers, P. Depression and Obesity: A Meta-Analysis of Community-Based Studies. Psychiatry Res. 2010, 178, 230–235. [Google Scholar]
- Mouchacca, J.; Abbott, G.R.; Ball, K. Associations between Psychological Stress, Eating, Physical Activity, Sedentary Behaviours and Body Weight among Women: A Longitudinal Study. BMC Public Health 2013, 13, 828. [Google Scholar] [CrossRef]
- Kakizaki, M.; Kuriyama, S.; Sato, Y.; Shimazu, T.; Matsuda-Ohmori, K.; Nakaya, N.; Fukao, A.; Fukudo, S.; Tsuji, I. Personality and Body Mass Index: A Cross-Sectional Analysis from the Miyagi Cohort Study. J. Psychosom. Res. 2008, 64, 71–80. [Google Scholar] [CrossRef]
- Klinkowski, N.; Korte, A.; Pfeiffer, E.; Lehmkuhl, U.; Salbach-Andrae, H. Psychopathology in Elite Rhythmic Gymnasts and Anorexia Nervosa Patients. Eur. Child. Adolesc. Psychiatry. 2008, 17, 108–113. [Google Scholar] [CrossRef]
- Villarejo, C.; Jimenez-Murcia, S.; Alvarez-Moya, E.; Granero, R.; Penelo, E.; Treasure, J.; Vilarrasa, N.; Gil-Montserrat de Bernabe, M.; Casanueva, F.F.; Tinahones, F.J.; et al. Loss of Control Over Eating: A Description of the Eating Disorder/Obesity Spectrum in Women. Eur. Eat. Disord. Rev. 2014, 22, 25–31. [Google Scholar] [CrossRef]
- Divaris, K.; Mafla, A.C.; Villa-Torres, L.; Sanchez-Molina, M.; Gallego-Gomez, C.L.; Velez-Jaramillo, L.F.; Tamayo-Cardona, J.A.; Perez-Cepeda, D.; Vergara-Mercado, M.L.; Simancas-Pallares, M.A.; et al. Psychological Distress and its Correlates among Dental Students: A Survey of 17 Colombian Dental Schools. BMC Med. Educ. 2013, 13, 91. [Google Scholar] [CrossRef]
- Atlantis, E.; Goldney, R.D.; Eckert, K.A.; Taylor, A.W. Trends in Health-Related Quality of Life and Health Service use Associated with Body Mass Index and Comorbid Major Depression in South Australia, 1998–2008. Qual. Life Res. 2012, 21, 1695–1704. [Google Scholar]
- Atlantis, E.; Goldney, R.D.; Wittert, G.A. Obesity and Depression Or Anxiety. BMJ 2009, 339, b3868. [Google Scholar] [CrossRef]
- Brophy, C.J.; Norvell, N.K.; Kiluk, D.J. An Examination of the Factor Structure and Convergent and Discriminant Validity of the SCL-90R in an Outpatient Clinic Population. J. Pers. Assess. 1988, 52, 334–340. [Google Scholar] [CrossRef]
- Prinz, U.; Nutzinger, D.O.; Schulz, H.; Petermann, F.; Braukhaus, C.; Andreas, S. Comparative Psychometric Analyses of the SCL-90-R and its Short Versions in Patients with Affective Disorders. BMC Psychiatry 2013, 13. [Google Scholar] [CrossRef]
- Cyr, J.J.; McKenna-Foley, J.M.; Peacock, E. Factor Structure of the SCL-90-R: Is there One? J. Pers. Assess. 1985, 49, 571–578. [Google Scholar]
- Clark, A.; Friedman, M.J. Factor Structure and Discriminant Validity of the SCL-90 in a Veteran Psychiatric Population. J. Pers. Assess. 1983, 47, 396–404. [Google Scholar] [CrossRef]
© 2014 by the authors; licensee MDPI, Basel, Switzerland. This article is an open access article distributed under the terms and conditions of the Creative Commons Attribution license (http://creativecommons.org/licenses/by/3.0/).
Share and Cite
Martínez, E.V.; Gutiérrez-Bedmar, M.; García-Rodríguez, A.; Mariscal, A.; Muñoz-Bravo, C.; Navajas, J.F.-C. Weight Status and Psychological Distress in a Mediterranean Spanish Population: A Symmetric U-Shaped Relationship. Nutrients 2014, 6, 1662-1677. https://doi.org/10.3390/nu6041662
Martínez EV, Gutiérrez-Bedmar M, García-Rodríguez A, Mariscal A, Muñoz-Bravo C, Navajas JF-C. Weight Status and Psychological Distress in a Mediterranean Spanish Population: A Symmetric U-Shaped Relationship. Nutrients. 2014; 6(4):1662-1677. https://doi.org/10.3390/nu6041662
Chicago/Turabian StyleMartínez, Elena Villalobos, Mario Gutiérrez-Bedmar, Antonio García-Rodríguez, Alberto Mariscal, Carlos Muñoz-Bravo, and Joaquín Fernández-Crehuet Navajas. 2014. "Weight Status and Psychological Distress in a Mediterranean Spanish Population: A Symmetric U-Shaped Relationship" Nutrients 6, no. 4: 1662-1677. https://doi.org/10.3390/nu6041662
APA StyleMartínez, E. V., Gutiérrez-Bedmar, M., García-Rodríguez, A., Mariscal, A., Muñoz-Bravo, C., & Navajas, J. F.-C. (2014). Weight Status and Psychological Distress in a Mediterranean Spanish Population: A Symmetric U-Shaped Relationship. Nutrients, 6(4), 1662-1677. https://doi.org/10.3390/nu6041662