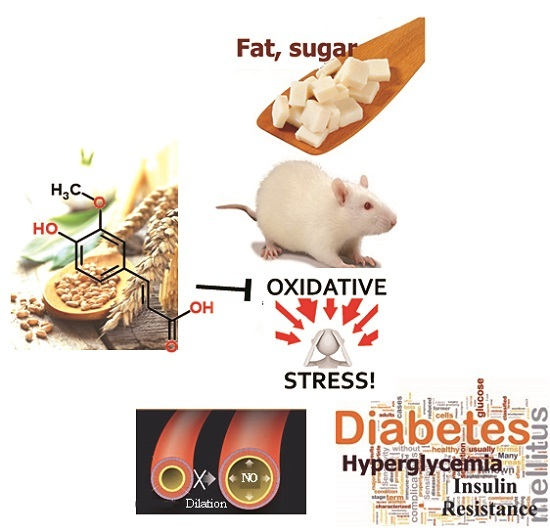
Ferulic Acid Alleviates Changes in a Rat Model of Metabolic Syndrome Induced by High-Carbohydrate, High-Fat Diet

Abstract
:
1. Introduction
2. Experimental Section
2.1. Animals and Diets


| Macronutrient Composition | Standard Chow Diet | HCHF Diet |
|---|---|---|
| Total carbohydrate, g/100g | 56.24 | 55.06 |
| Total fat, g/100g | 5.78 | 18.85 |
| protein, g/100g | 24.76 | 8.83 |
| Crude fiber, g/100g | 1.91 | 0.75 |
| Ash, g/100g | 6.12 | 3.94 |
| Moisture, g/100g | 4.40 | 13.82 |
| Energy, Kcal/100g | 386.82 | 423.21 |
2.2. Physiological and Metabolic Variables
2.3. Indirect Measurement of Blood Pressure in Conscious Rats
2.4. Fasting Blood Glucose, Oral Glucose Tolerance Test
2.5. Fasting Serum Insulin Assessments and Homeostasis Model Assessment-Estimated Insulin Resistance (HOMA-IR) Calculation
2.6. Hemodynamic Measurements
2.7. Oxidative Stress and Inflammation
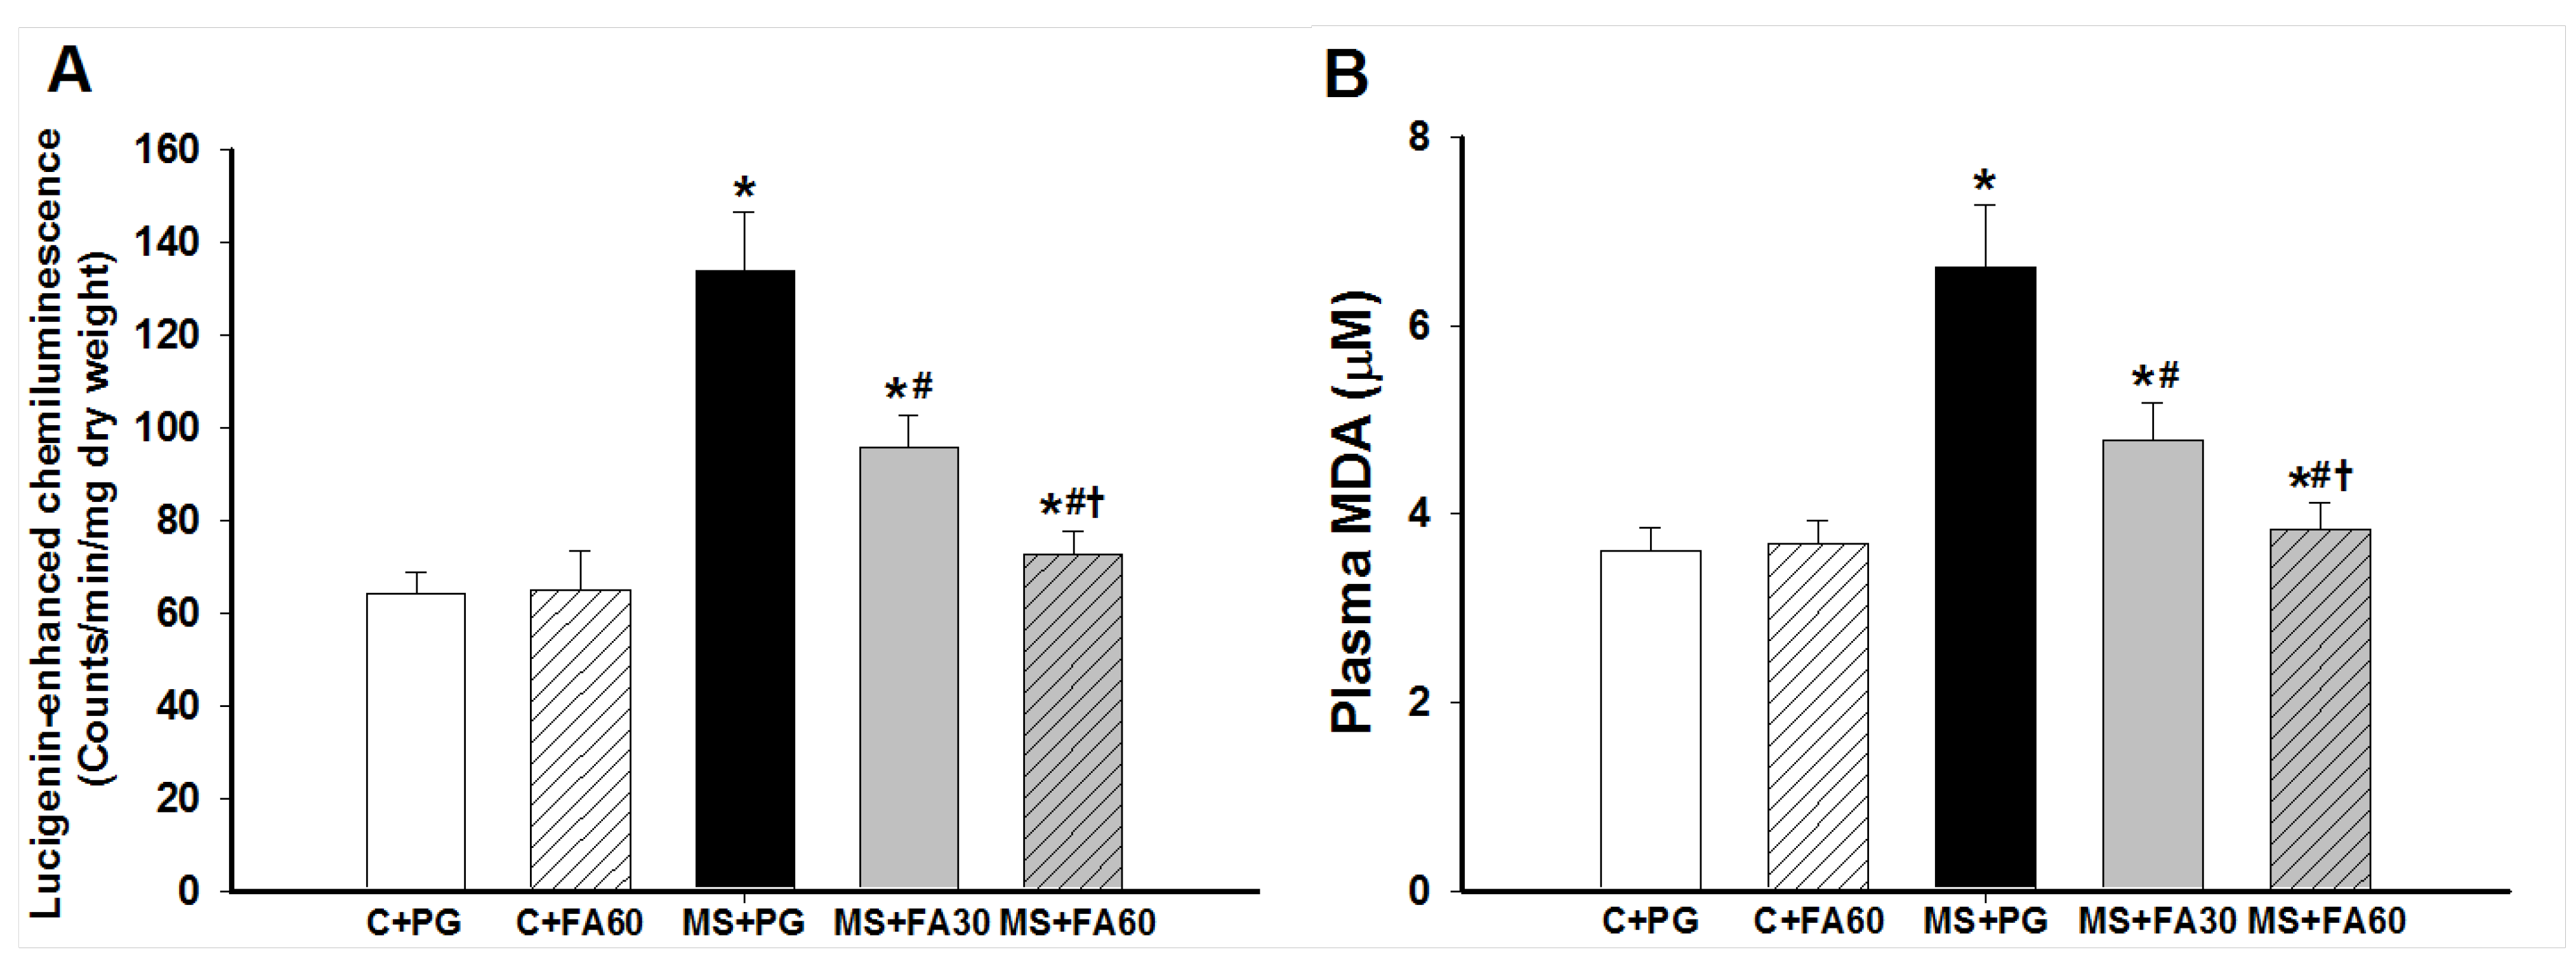
2.7.1. Superoxide Production and Plasma MDA
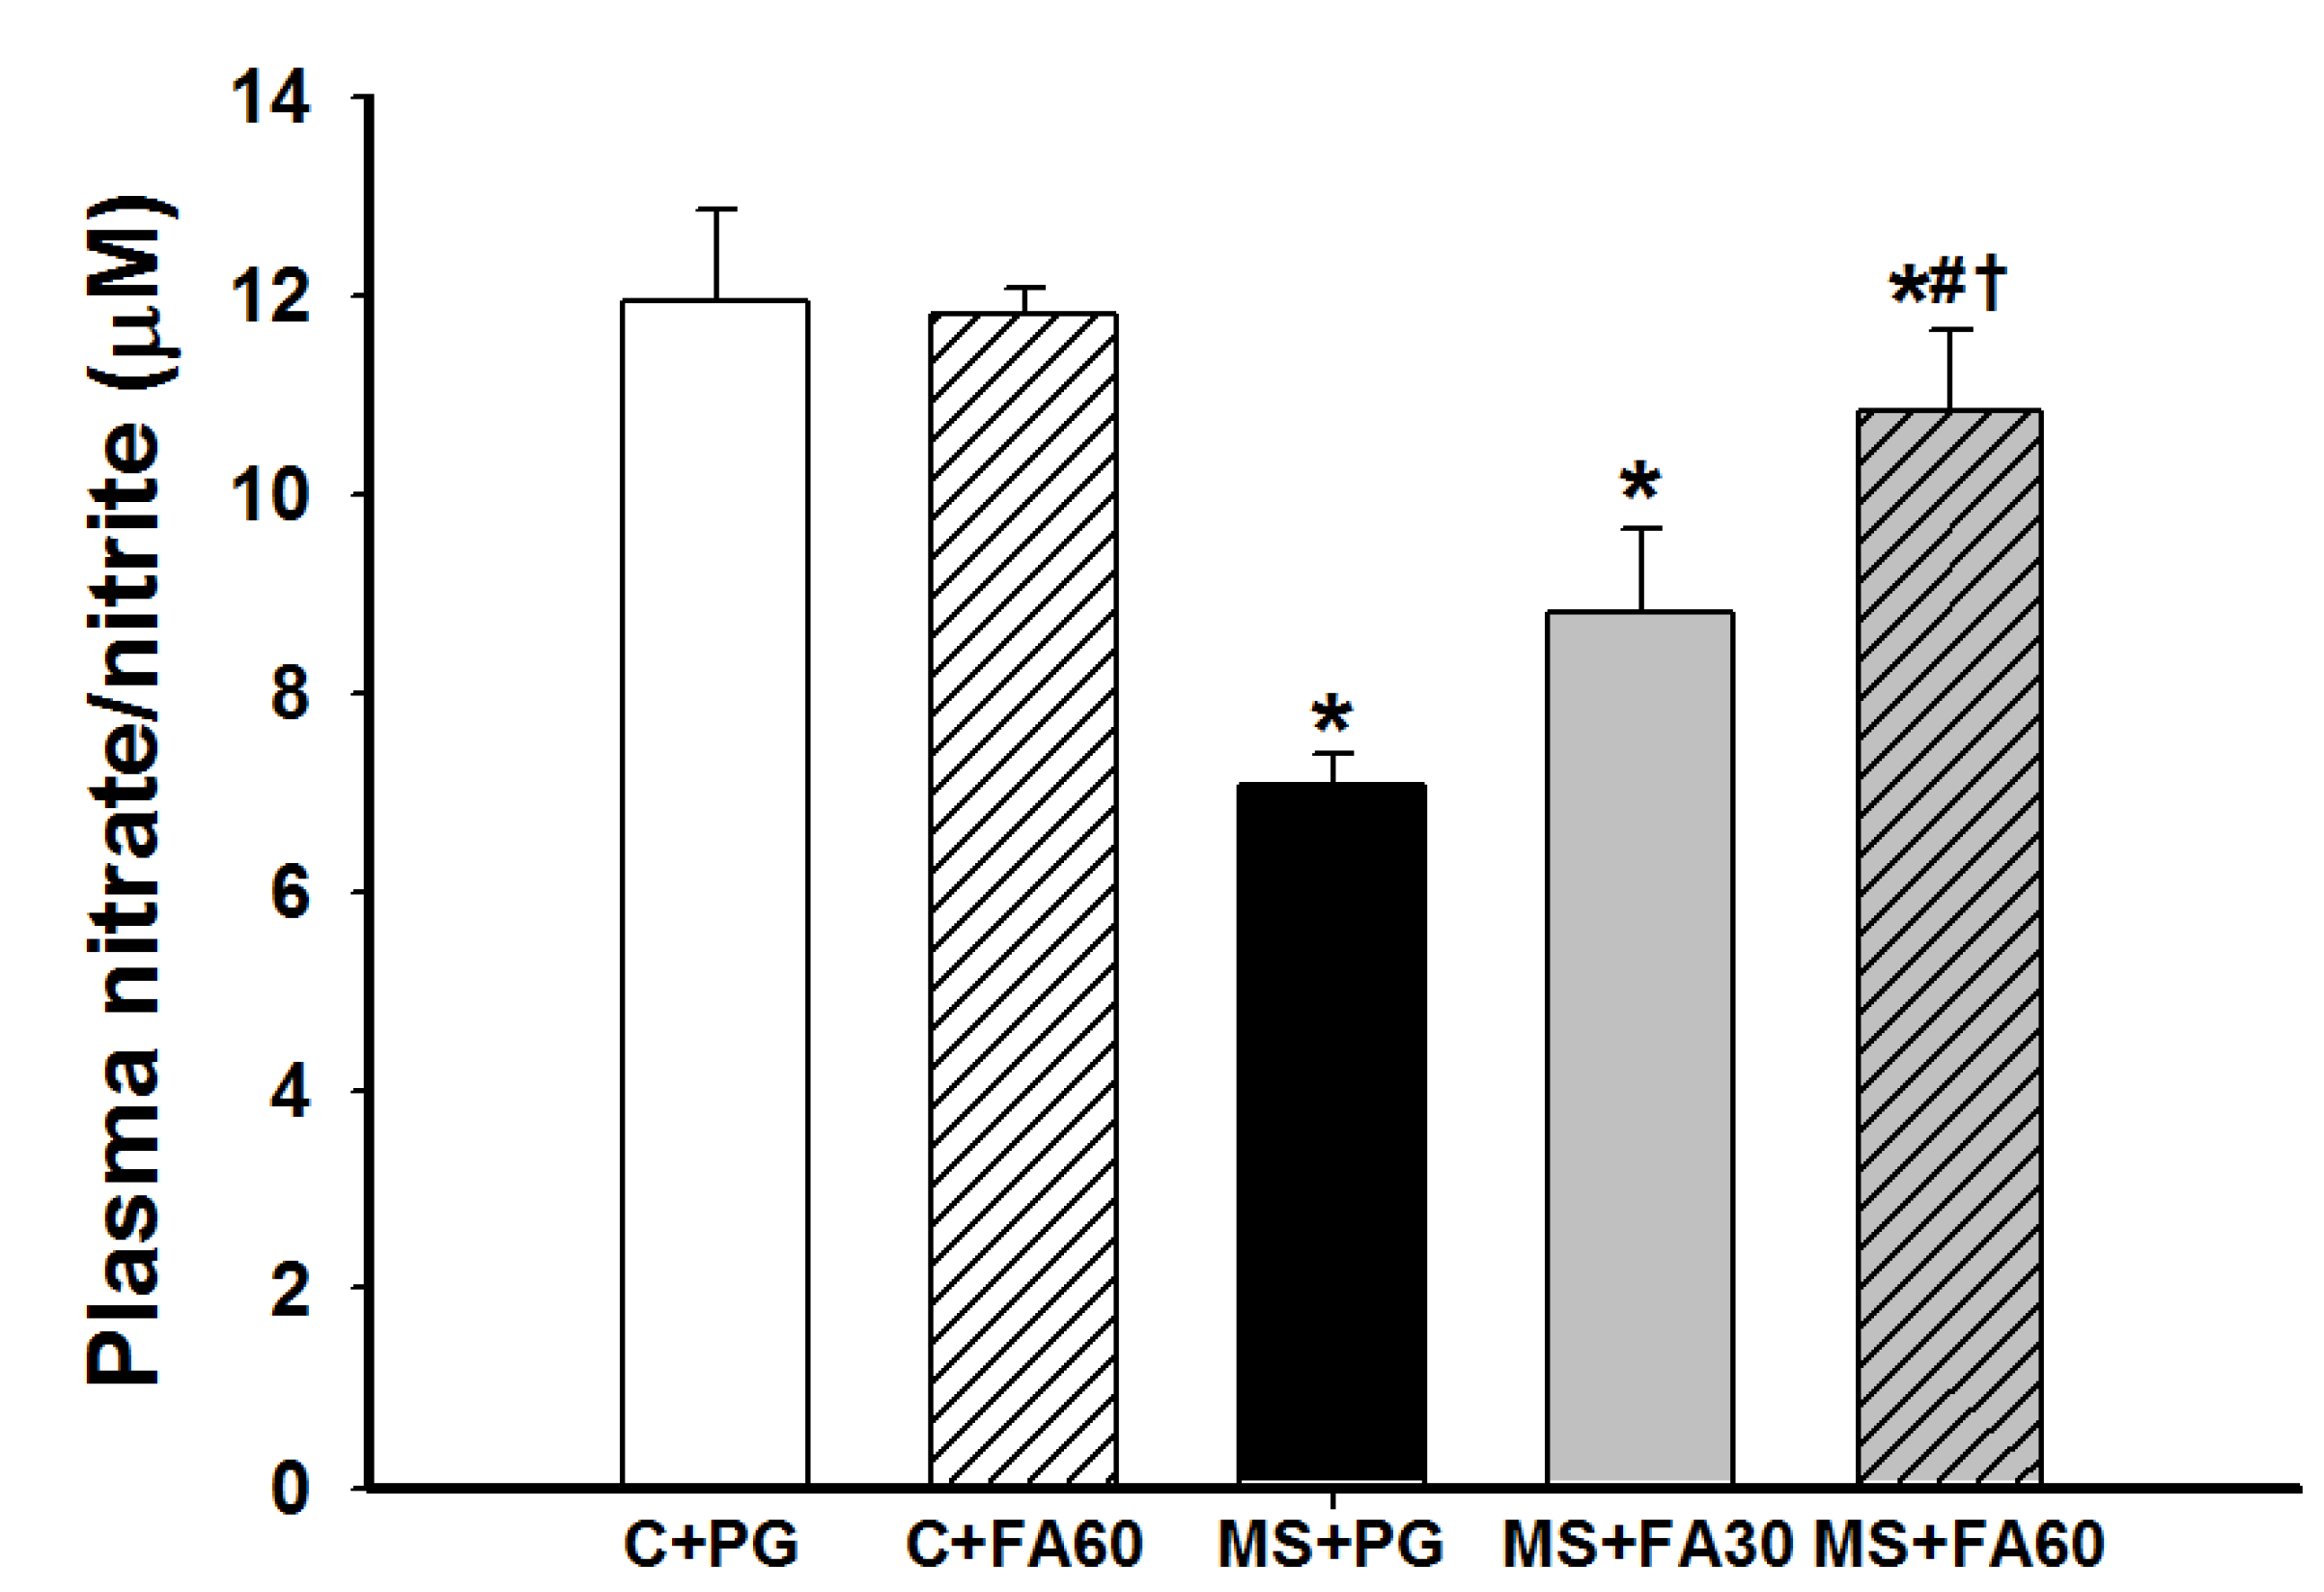
2.7.2. Assay of Nitric Oxide Metabolites
2.7.3. Plasma TNF-α
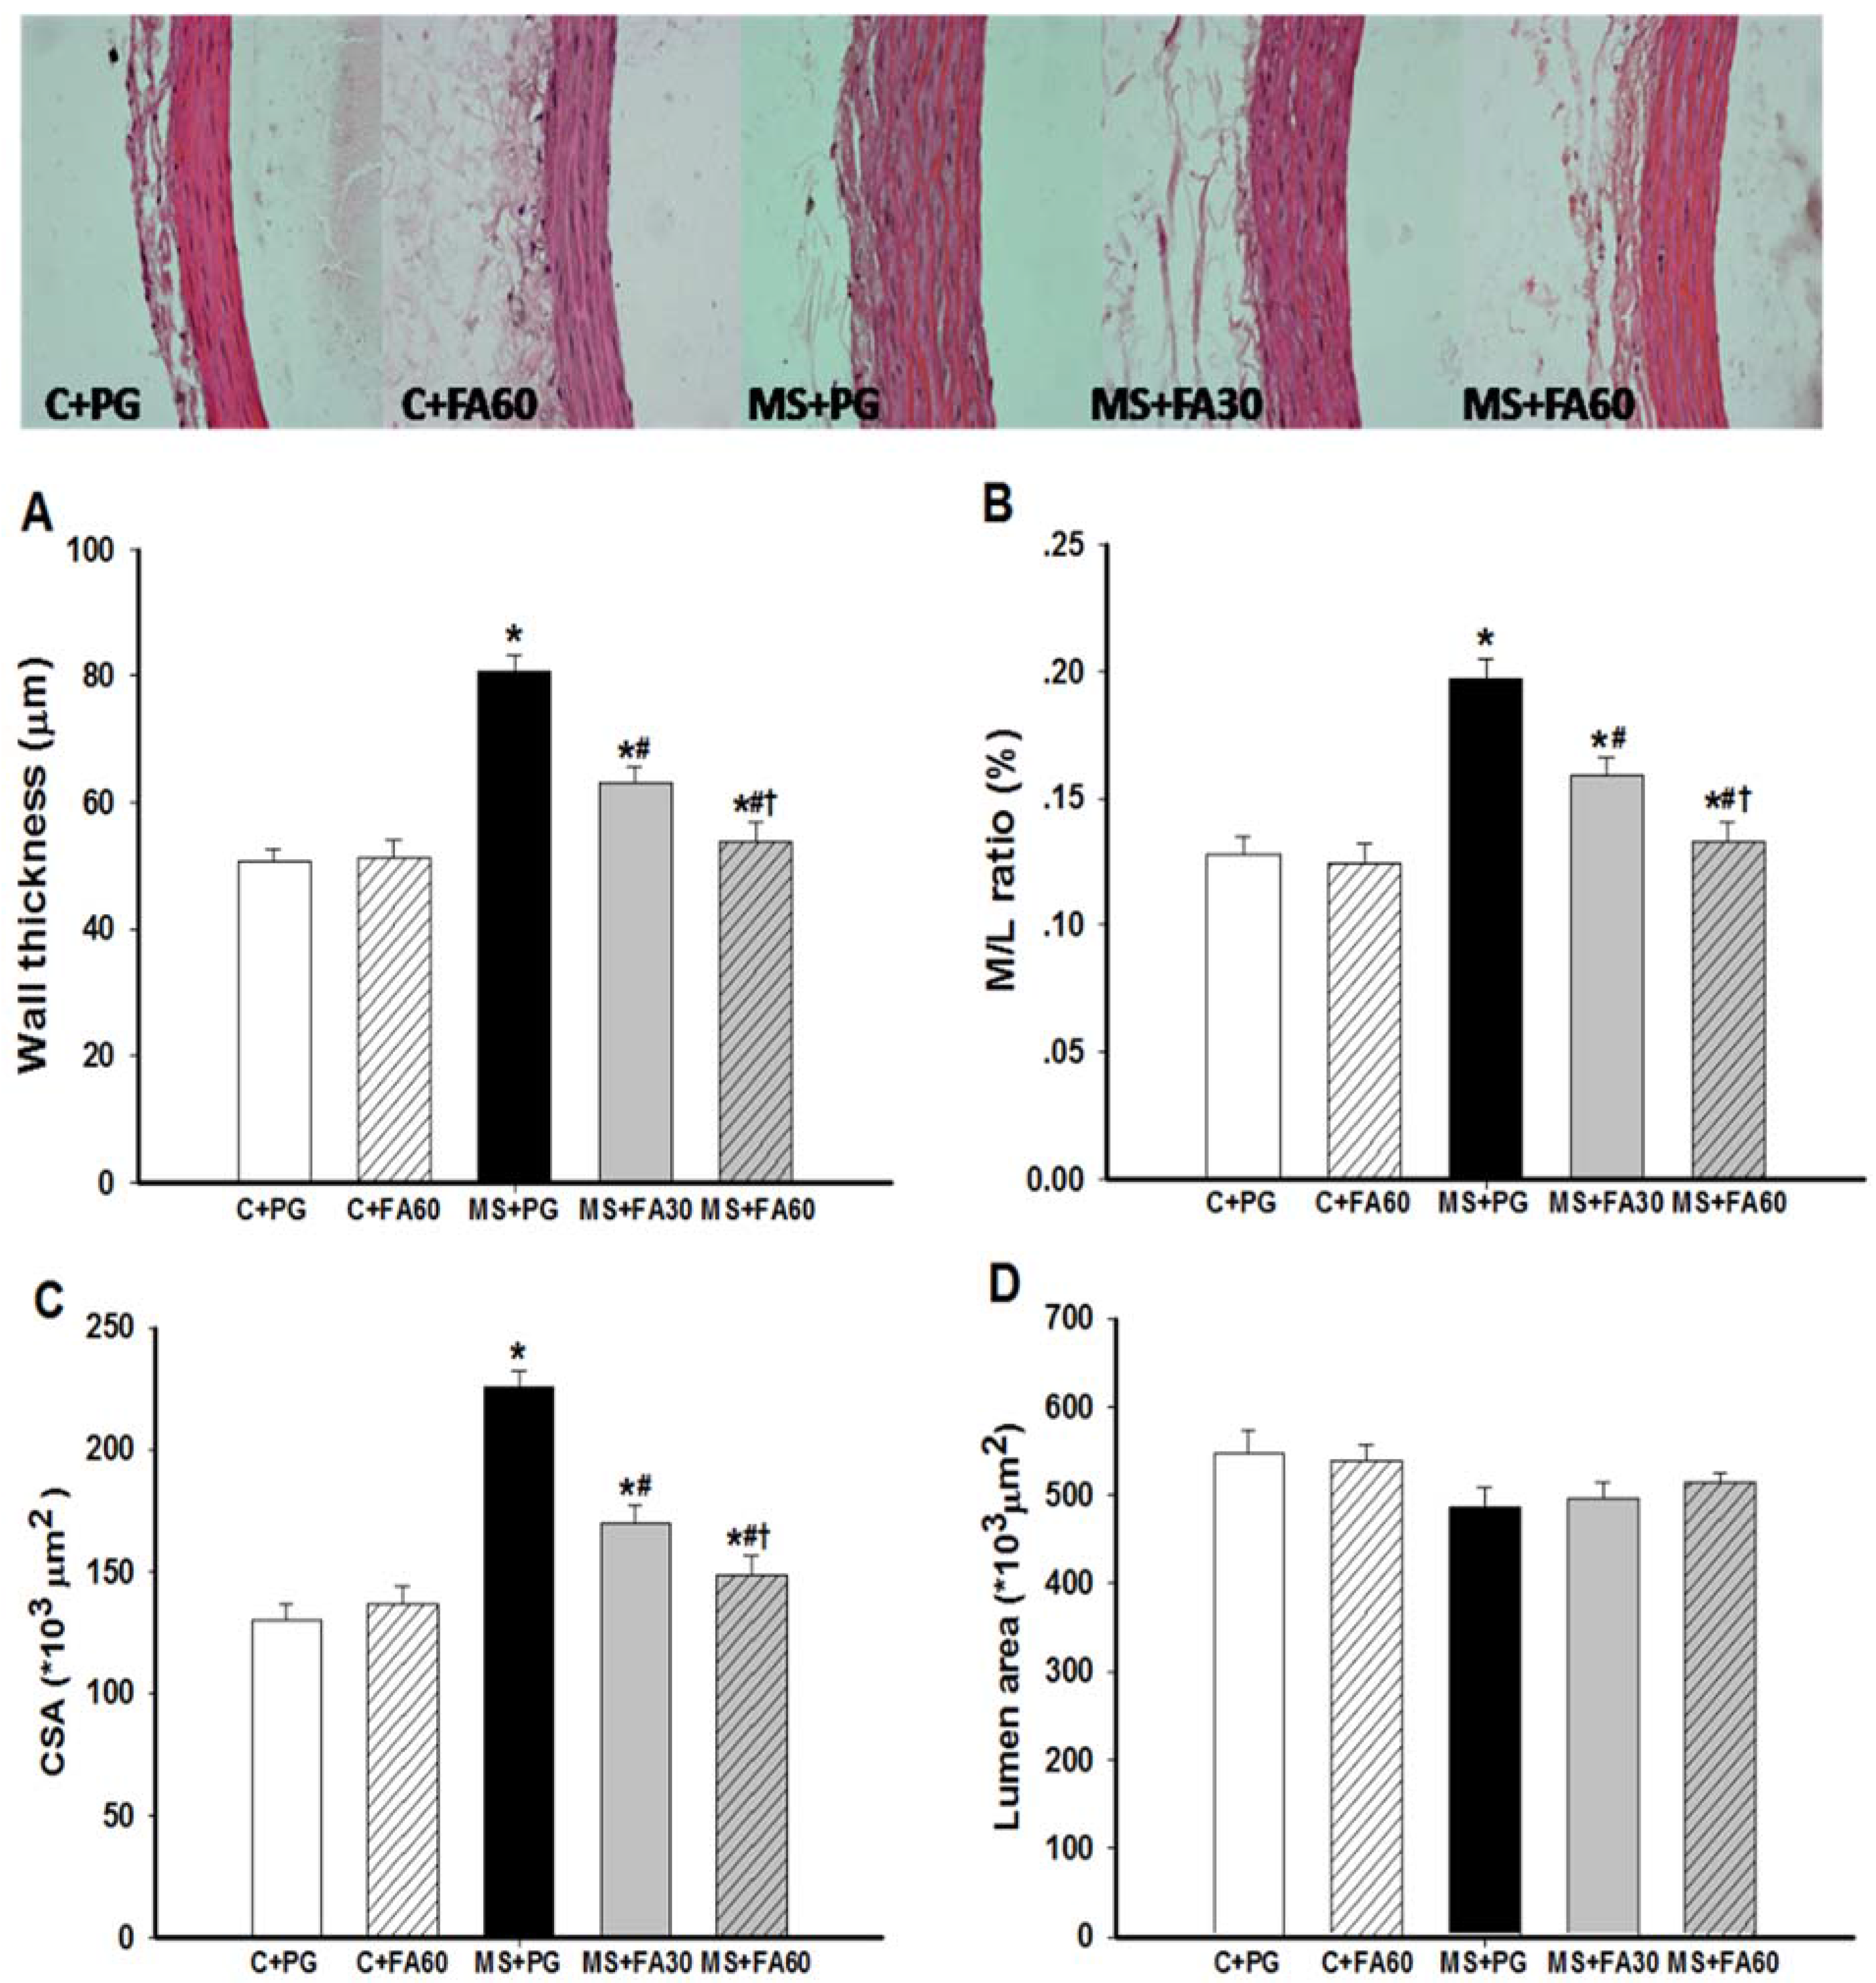
2.8. Histology
2.9. Western Blot Analysis
2.10. Statistical Analysis
3. Results
3.1. Effect of FA on Body Weight and Organ Weight of MS Rats
| Variables | C + PG | C + FA60 | MS + PG | MS + FA30 | MS + FA60 |
|---|---|---|---|---|---|
| Body weight (g) | 460.3 ± 3.7 | 463.2 ± 5.6 | 465.1 ± 8.6 | 449.1 ± 8.1 | 452.1 ± 9.4 |
| Liver wet weight/B.W. (mg/g) | 28.6 ± 0.6 | 28.7 ± 0.4 | 39.8 ± 2.0 * | 30.9 ± 0.2 *# | 29.7 ± 0.7 #† |
| Heart wet weight/ B.W. (mg/g) | 2.76 ± 0.02 | 2.79 ± 0.08 | 3.08 ± 0.04 * | 3.07 ± 0.04 * | 3.07 ± 0.02 * |
| LV wet weight/ B.W. (mg/g) | 1.87 ± 0.14 | 1.93 ± 0.04 | 2.23 ± 0.04 * | 2.16 ± 0.04 * | 2.13 ± 0.02 * |
3.2. Effect of FA on Fasting Blood Glucose and Oral Glucose Tolerance Test
| Variables | C + PG | C + FA60 | MS + PG | MS + FA30 | MS + FA60 |
|---|---|---|---|---|---|
| FBG (mg/dL) | 86.7 ± 1.4 | 87.2 ± 1.7 | 117.0 ± 3.4 * | 100.4 ± 0.9 *# | 93.4 ± 1.2 *#† |
| AUC (mg/dL/120 min) | 14,597 ± 137 | 14,455 ± 433 | 17,609 ± 263 * | 16,808 ± 273 *# | 15,840 ± 248.4 *#† |
| HOMA-IR | 1.73 ± 0.05 | 1.68 ± 0.67 | 17.85 ± 3.2 * | 4.45 ± 0.44 *# | 2.91 ± 0.26 *#† |
| Cholesterol (mg/dL) | 58.1 ± 3.2 | 57.7 ± 2.2 | 87.6 ± 2.0 * | 69.9 ± 1.3 *# | 63.5 ± 4.2 *# |
| Triglycerides (mg/dL) | 38.40 ± 6.15 | 36.14 ± 5.83 | 78.29 ± 3.96 * | 50.60 ± 2.91 *# | 49 ± 2.89 *# |
| HDL-C (mg/dL) | 34.32 ± 1.54 | 34.33 ± 0.95 | 19.07 ± 1.55 * | 33.29 ± 0.97 *# | 33.50 ± 1.49 *# |
| Plasma TNF-α (pg/mL) | 27.77 ± 3.15 | 25.83 ± 3.36 | 173.14 ± 16.30 * | 52.98 ± 8.90 *# | 42.02 ± 3.84 *# |
3.3. Effect of FA on Lipid Profile and Plasma TNF-α
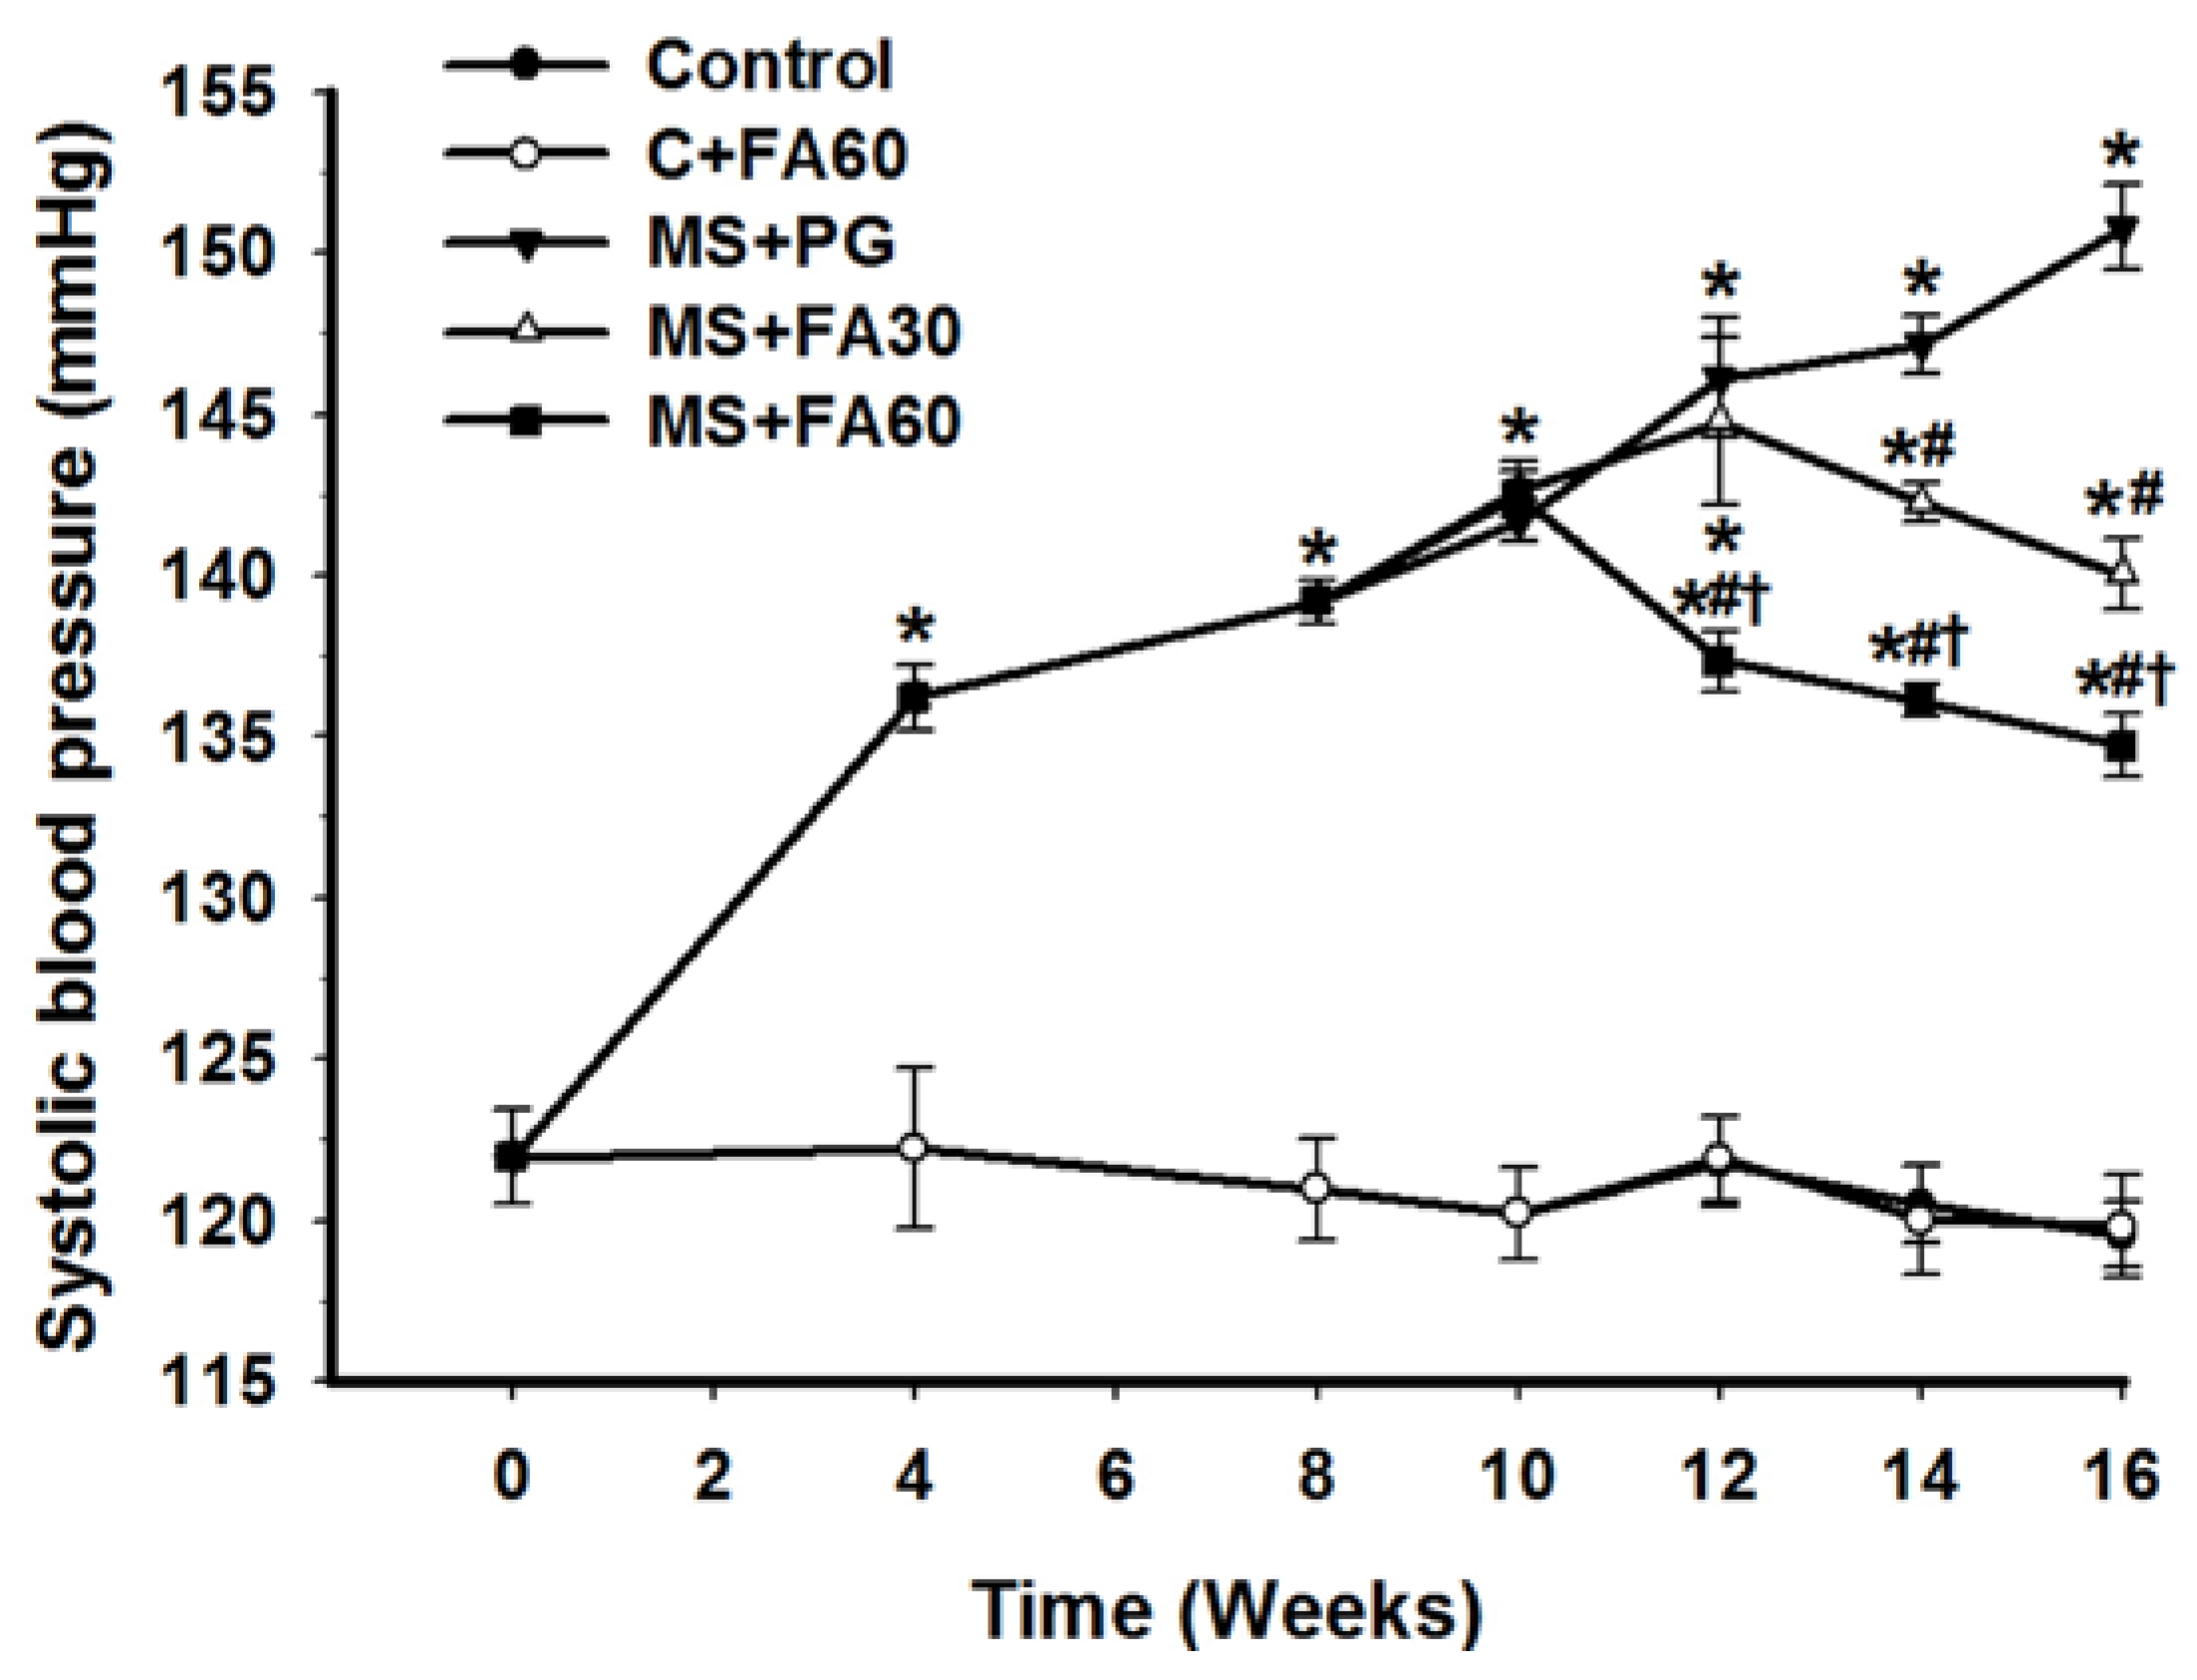
3.4. Effect of FA on Blood Pressure
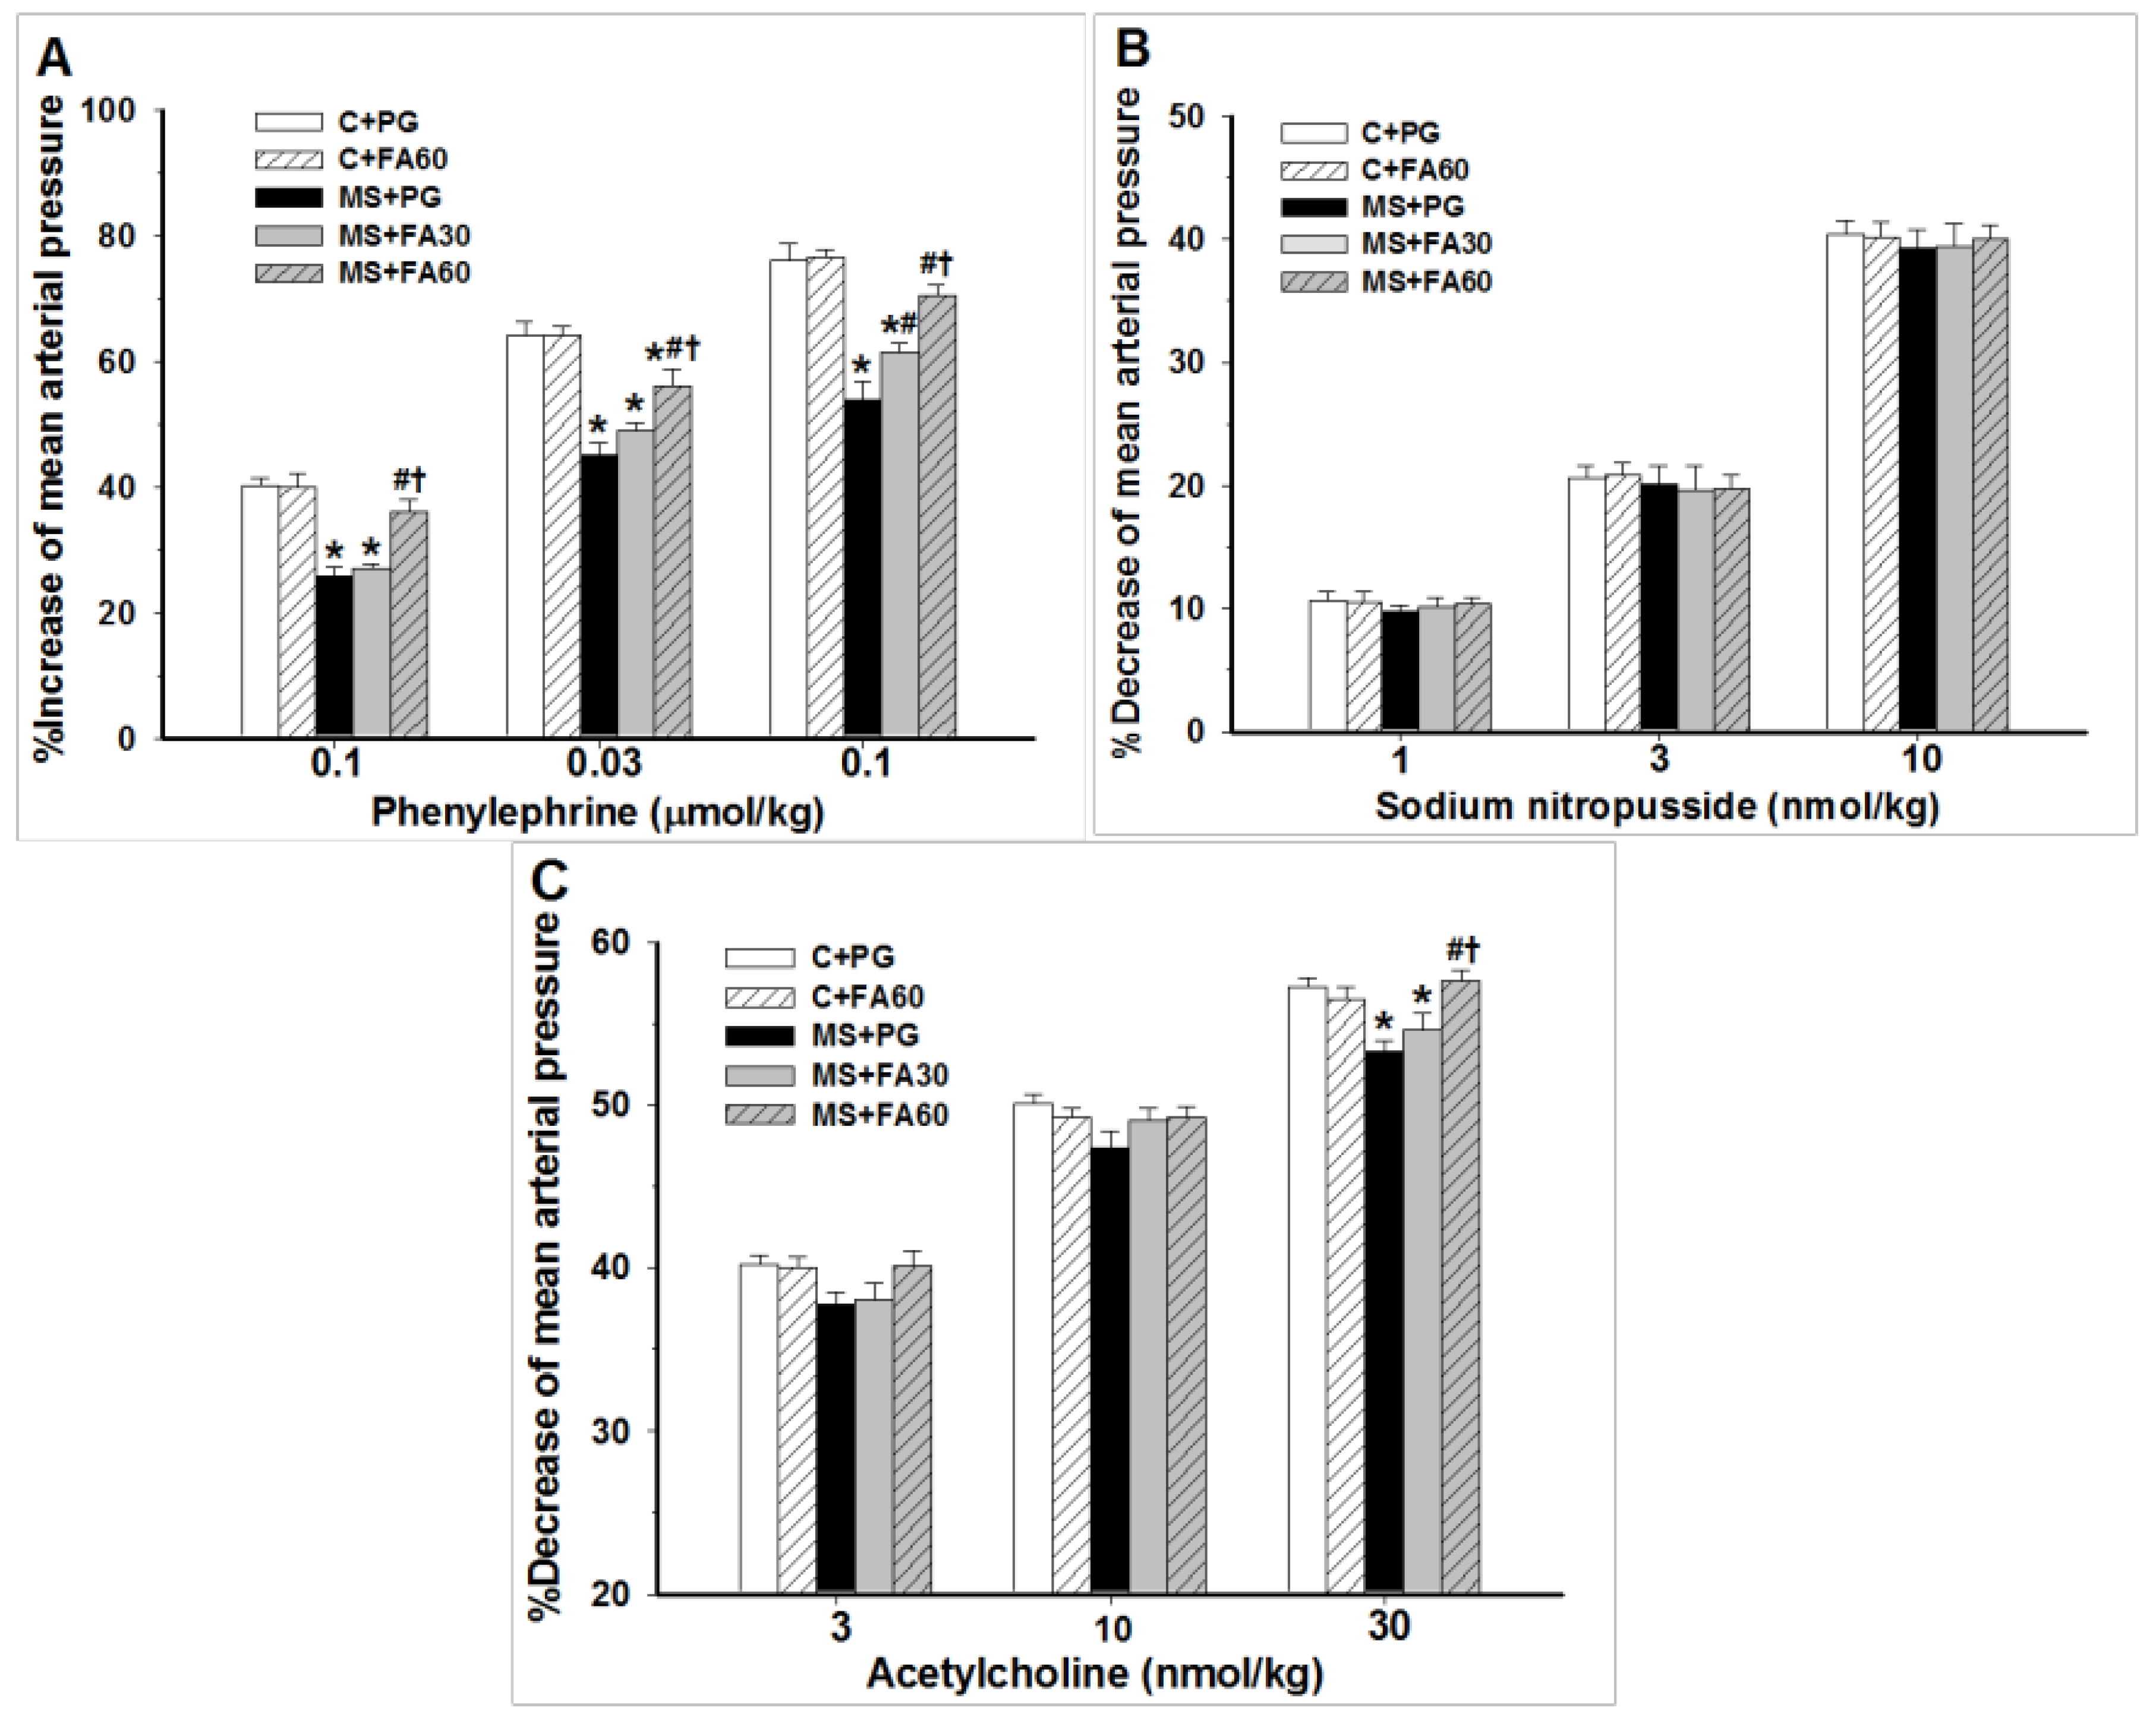
3.5. Effect of FA on Hemodynamic Parameters and Vascular Reactivity

| Variables | C + PG | C + FA60 | MS + PG | MS + FA30 | MS + FA60 |
|---|---|---|---|---|---|
| SBP (mmHg) | 120.4 ± 1.4 | 120.7 ± 1.1 | 151.6 ± 2.0 * | 140.6 ± 3.6 *# | 132.7 ± 1.6 *#† |
| DBP (mmHg) | 78.1 ± 1.7 | 75.6 ± 1.7 | 108.4 ± 1.9 * | 97.7 ± 1.3 *# | 89.4 ± 1.5 *#† |
| MAP (mmHg) | 95.4 ± 1.6 | 94.4 ± 1.2 | 124.5 ± 1.9 * | 117.3 ± 2.4 *# | 109.0 ± 1.3 *#† |
| HR (beat/min) | 344.7 ± 3.4 | 346.6 ± 8.8 | 424.0 ± 3.2 * | 406.3 ± 10.3 * | 383.3 ± 7.6 *#† |
| HBF (mL/min/100 g tissue) | 6.3 ± 0.3 | 6.3 ± 0.2 | 4.0 ± 0.2 * | 5.2 ± 0.1 *# | 5.9 ± 0.2 #† |
| HVR (mmHg/mL/min/100 g tissue) | 15.14 ± 0.30 | 15.68 ± 0.30 | 31.73 ± 0.30 * | 23.93 ± 0.30 *# | 17.72 ± 0.30 *#† |

3.6. Effect of FA on Oxidative Stress

3.7. Effect of FA on Nitric Oxide Formation

3.8. Effect of FA on Arterial Histomorphometry
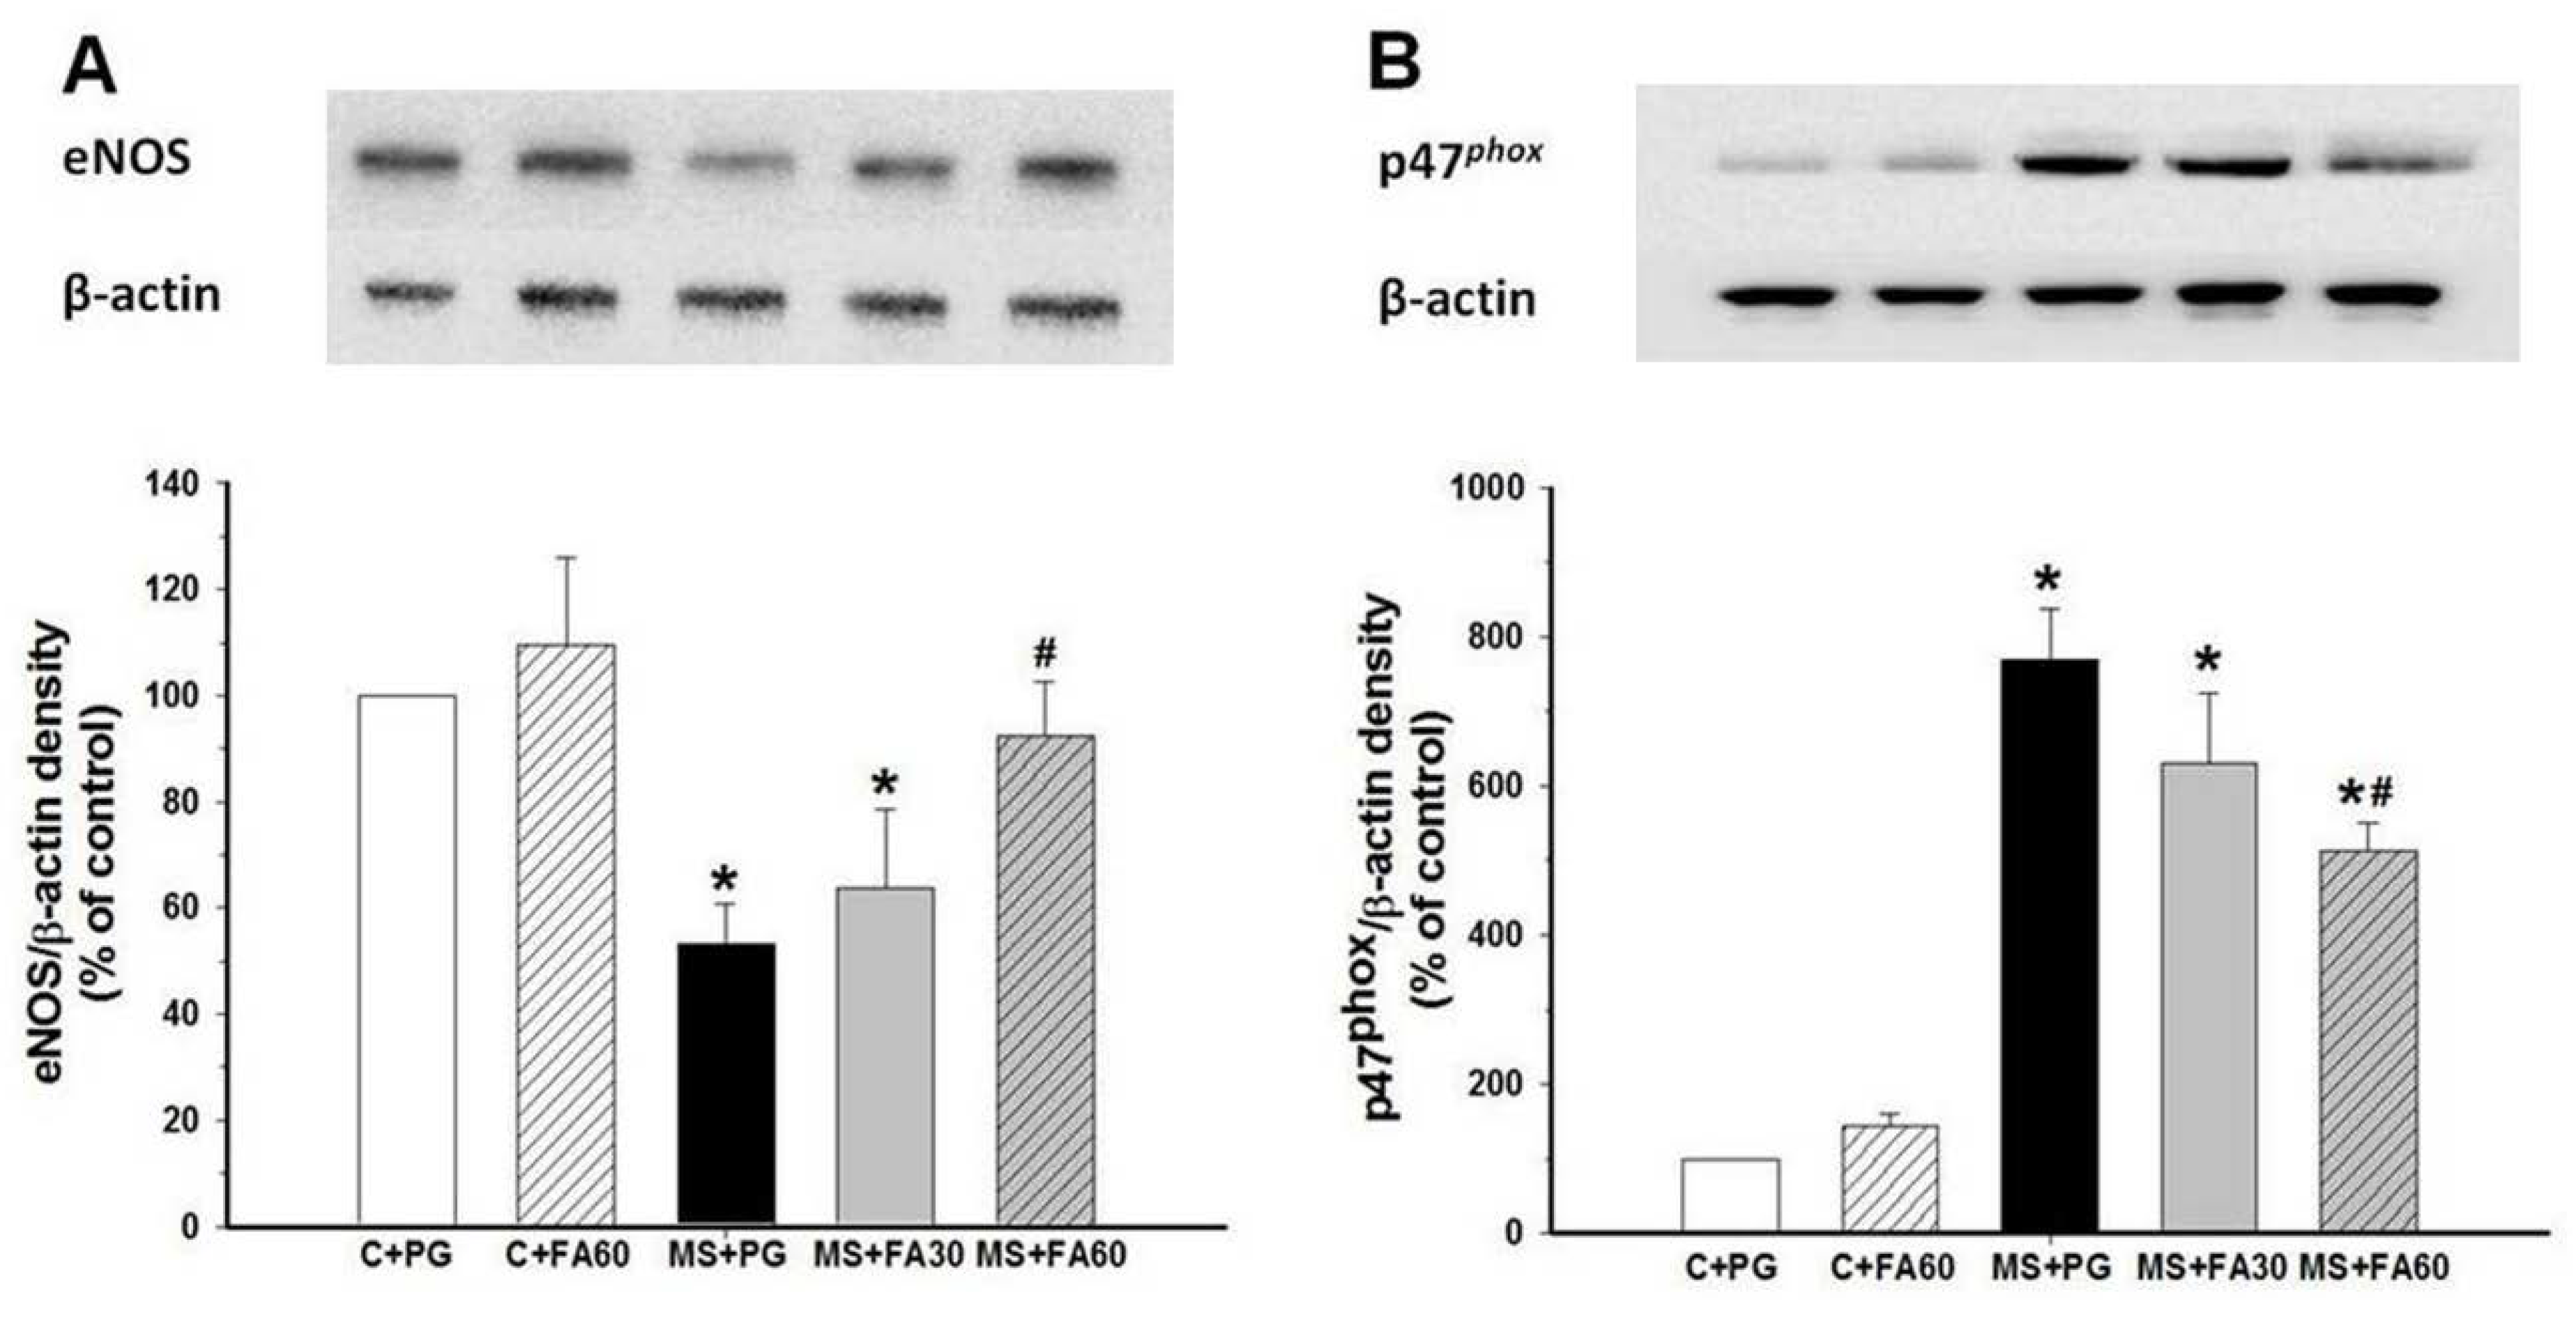
3.9. Effect of FA on Arterial Protein Expression of eNOS and p47phox


4. Discussion
5. Conclusions
Acknowledgments
Author Contributions
Conflicts of Interest
References
- Williamson, G.; Manach, C. Bioavailability and bioefficacy of polyphenols in humans. II. Review of 93 intervention studies. Am. J. Clin. Nutr. 2005, 81, 243S–255S. [Google Scholar] [PubMed]
- Tsao, R. Chemistry and biochemistry of dietary polyphenols. Nutrients 2010, 2, 1231–1246. [Google Scholar] [CrossRef] [PubMed]
- Manach, C.; Scalbert, A.; Morand, C.; Remesy, C.; Jimenez, L. Polyphenols: Food sources and bioavailability. Am. J. Clin. Nutr. 2004, 79, 727–747. [Google Scholar] [PubMed]
- Prakash, D.; Upadhyay, G.; Pushpangadan, P.; Gupta, C. Antioxidant and free radical scavenging activities of some fruits. J. Complement Integr. Med. 2011, 8. [Google Scholar] [CrossRef] [PubMed]
- Zhao, Z.; Moghadasian, M.H. Chemistry, natural sources, dietary intake and pharmacokinetic properties of ferulic acid: A review. Food Chemistry 2008, 109, 691–702. [Google Scholar] [CrossRef] [PubMed]
- Bourne, L.; Paganga, G.; Baxter, D.; Hughes, P.; Rice-Evans, C. Absorption of ferulic acid from low-alcohol beer. Free Radic. Res. 2000, 32, 273–280. [Google Scholar] [CrossRef] [PubMed]
- Mancuso, C.; Santangelo, R. Ferulic acid: Pharmacological and toxicological aspects. Food Chem. Toxicol. 2014, 65, 185–195. [Google Scholar] [CrossRef] [PubMed]
- Ohsaki, Y.; Shirakawa, H.; Koseki, T.; Komai, M. Novel effects of a single administration of ferulic acid on the regulation of blood pressure and the hepatic lipid metabolic profile in stroke-prone spontaneously hypertensive rats. J. Agric. Food Chem. 2008, 56, 2825–2830. [Google Scholar]
- Suzuki, A.; Yamamoto, M.; Jokura, H.; Fujii, A.; Tokimitsu, I.; Hase, T.; Saito, I. Ferulic acid restores endothelium-dependent vasodilation in aortas of spontaneously hypertensive rats. Am. J. Hypertens. 2007, 20, 508–513. [Google Scholar] [CrossRef] [PubMed]
- Wang, B.; Ouyang, J.; Liu, Y.; Yang, J.; Wei, L.; Li, K.; Yang, H. Sodium ferulate inhibits atherosclerogenesis in hyperlipidemia rabbits. J. Cardiovasc. Pharmacol. 2004, 43, 549–554. [Google Scholar] [CrossRef] [PubMed]
- Jung, E.H.; Kim, S.R.; Hwang, I.K.; Ha, T.Y. Hypoglycemic effects of a phenolic acid fraction of rice bran and ferulic acid in C57BL/KsJ-db/db mice. J. Agric. Food Chem. 2007, 55, 9800–9804. [Google Scholar] [CrossRef] [PubMed]
- Sri Balasubashini, M.; Rukkumani, R.; Menon, V.P. Protective effects of ferulic acid on hyperlipidemic diabetic rats. Acta Diabetol. 2003, 40, 118–122. [Google Scholar]
- Son, M.J.; Rico, C.W.; Nam, S.H.; Kang, M.Y. Influence of oryzanol and ferulic Acid on the lipid metabolism and antioxidative status in high fat-fed mice. J. Clin. Biochem. Nutr. 2010, 46, 150–156. [Google Scholar]
- Ou, L.; Kong, L.Y.; Zhang, X.M.; Niwa, M. Oxidation of ferulic acid by Momordica charantia peroxidase and related anti-inflammation activity changes. Biol. Pharm. Bull. 2003, 26, 1511–1516. [Google Scholar] [CrossRef] [PubMed]
- Bonadonna, R.; Cucinotta, D.; Fedele, D.; Riccardi, G.; Tiengo, A. The metabolic syndrome is a risk indicator of microvascular and macrovascular complications in diabetes: Results from Metascreen, a multicenter diabetes clinic-based survey. Diabetes Care. 2006, 29, 2701–2707. [Google Scholar] [PubMed]
- Gupta, N.; Goel, K.; Shah, P.; Misra, A. Childhood obesity in developing countries: Epidemiology, determinants, and prevention. Endocr. Rev. 2012, 33, 48–70. [Google Scholar] [CrossRef] [PubMed]
- Panchal, S.K.; Poudyal, H.; Iyer, A.; Nazer, R.; Alam, M.A.; Diwan, V.; Kauter, K.; Sernia, C.; Campbell, F.; Ward, L.; et al. High-carbohydrate, high-fat diet-induced metabolic syndrome and cardiovascular remodeling in rats. J. Cardiovasc. Pharmacol. 2011, 57, 611–624. [Google Scholar] [CrossRef] [PubMed]
- Aydin, S.; Aksoy, A.; Kalayci, M.; Yilmaz, M.; Kuloglu, T.; Citil, C.; Catak, Z. Today’s and yesterday’s of pathophysiology: biochemistry of metabolic syndrome and animal models. Nutrition 2014, 30, 1–9. [Google Scholar] [CrossRef] [PubMed]
- Kennedy, A.J.; Ellacott, K.L.; King, V.L.; Hasty, A.H. Mouse models of the metabolic syndrome. Dis. Model Mech. 2010, 3, 156–166. [Google Scholar] [CrossRef] [PubMed]
- Panchal, S.K.; Brown, L. Rodent models for metabolic syndrome research. J. Biomed. Biotechnol. 2011, 2011, 351982. [Google Scholar] [CrossRef] [PubMed]
- Nascimento, A.R.; Machado, M.; de Jesus, N.; Gomes, F.; Lessa, M.A.; Bonomo, I.T.; Tibirica, E. Structural and functional microvascular alterations in a rat model of metabolic syndrome induced by a high-fat diet. Obesity 2013, 21, 2046–2054. [Google Scholar] [CrossRef] [PubMed]
- Roberts, C.K.; Barnard, R.J.; Sindhu, R.K.; Jurczak, M.; Ehdaie, A.; Vaziri, N.D. A high-fat, refined-carbohydrate diet induces endothelial dysfunction and oxidant/antioxidant imbalance and depresses NOS protein expression. J. Appl. Physiol. 2005, 98, 203–210. [Google Scholar] [CrossRef] [PubMed]
- Allain, C.C.; Poon, L.S.; Chan, C.S.; Richmond, W.; Fu, P.C. Enzymatic determination of total serum cholesterol. Clin. Chem. 1974, 20, 470–475. [Google Scholar] [PubMed]
- Matthews, D.R.; Hosker, J.P.; Rudenski, A.S.; Naylor, B.A.; Treacher, D.F.; Turner, R.C. Homeostasis model assessment: Insulin resistance and beta-cell function from fasting plasma glucose and insulin concentrations in man. Diabetologia 1985, 28, 412–419. [Google Scholar] [CrossRef] [PubMed]
- Boonla, O.; Kukongviriyapan, U.; Pakdeechote, P.; Kukongviriyapan, V.; Pannangpetch, P.; Prachaney, P.; Greenwald, S.E. Curcumin improves endothelial dysfunction and vascular remodeling in 2K-1C hypertensive rats by raising nitric oxide availability and reducing oxidative stress. Nitric Oxide 2014, 42, 44–53. [Google Scholar] [CrossRef] [PubMed]
- Nakmareong, S.; Kukongviriyapan, U.; Pakdeechote, P.; Donpunha, W.; Kukongviriyapan, V.; Kongyingyoes, B.; Sompamit, K.; Phisalaphong, C. Antioxidant and vascular protective effects of curcumin and tetrahydrocurcumin in rats with l-NAME-induced hypertension. Naunyn Schmiedebergs Arch. Pharmacol. 2011, 383, 519–529. [Google Scholar] [CrossRef] [PubMed]
- Luangaram, S.; Kukongviriyapan, U.; Pakdeechote, P.; Kukongviriyapan, V.; Pannangpetch, P. Protective effects of quercetin against phenylhydrazine-induced vascular dysfunction and oxidative stress in rats. Food Chem. Toxicol. 2007, 45, 448–455. [Google Scholar] [CrossRef] [PubMed]
- Nakmareong, S.; Kukongviriyapan, U.; Pakdeechote, P.; Kukongviriyapan, V.; Kongyingyoes, B.; Donpunha, W.; Prachaney, P.; Phisalaphong, C. Tetrahydrocurcumin alleviates hypertension, aortic stiffening and oxidative stress in rats with nitric oxide deficiency. Hypertens. Res. 2012, 35, 418–425. [Google Scholar] [CrossRef] [PubMed]
- Cai, H.; Harrison, D.G. Endothelial dysfunction in cardiovascular diseases: The role of oxidant stress. Circ. Res. 2000, 87, 840–844. [Google Scholar] [CrossRef] [PubMed]
- Alam, M.A.; Kauter, K.; Brown, L. Naringin improves diet-induced cardiovascular dysfunction and obesity in high carbohydrate, high fat diet-fed rats. Nutrients 2013, 5, 637–650. [Google Scholar] [CrossRef] [PubMed] [Green Version]
- Rotter, V.; Nagaev, I.; Smith, U. Interleukin-6 (IL-6) induces insulin resistance in 3T3-L1 adipocytes and is, like IL-8 and tumor necrosis factor-α, overexpressed in human fat cells from insulin-resistant subjects. J. Biol. Chem. 2003, 278, 45777–45784. [Google Scholar] [CrossRef] [PubMed]
- Boonloh, K.; Kukongviriyapan, U.; Pannangpetch, P.; Kongyingyoes, B.; Senggunprai, L.; Prawan, A.; Thawornchinsombut, S.; Kukongviriyapan, V. Rice bran protein hydrolysates prevented interleukin-6- and high glucose-induced insulin resistance in HepG2 cells. Food Funct. 2015, 6, 566–573. [Google Scholar] [CrossRef] [PubMed]
- Otani, H. Oxidative stress as pathogenesis of cardiovascular risk associated with metabolic syndrome. Antioxid. Redox Signal. 2011, 15, 1911–1926. [Google Scholar] [CrossRef] [PubMed]
- Cooper-DeHoff, R.M.; Gong, Y.; Handberg, E.M.; Bavry, A.A.; Denardo, S.J.; Bakris, G.L.; Pepine, C.J. Tight blood pressure control and cardiovascular outcomes among hypertensive patients with diabetes and coronary artery disease. JAMA 2010, 304, 61–68. [Google Scholar] [CrossRef] [PubMed]
- Chatzizisis, Y.S.; Coskun, A.U.; Jonas, M.; Edelman, E.R.; Feldman, C.L.; Stone, P.H. Role of endothelial shear stress in the natural history of coronary atherosclerosis and vascular remodeling: Molecular, cellular, and vascular behavior. J. Am. Coll. Cardiol. 2007, 49, 2379–2393. [Google Scholar] [CrossRef] [PubMed]
- Alam, M.A.; Sernia, C.; Brown, L. Ferulic acid improves cardiovascular and kidney structure and function in hypertensive rats. J. Cardiovasc. Pharmacol. 2013, 61, 240–249. [Google Scholar] [CrossRef] [PubMed]
- Rodrigo, R.; Gonzalez, J.; Paoletto, F. The role of oxidative stress in the pathophysiology of hypertension. Hypertens. Res. 2011, 34, 431–440. [Google Scholar] [CrossRef] [PubMed]
© 2015 by the authors; licensee MDPI, Basel, Switzerland. This article is an open access article distributed under the terms and conditions of the Creative Commons Attribution license (http://creativecommons.org/licenses/by/4.0/).
Share and Cite
Senaphan, K.; Kukongviriyapan, U.; Sangartit, W.; Pakdeechote, P.; Pannangpetch, P.; Prachaney, P.; Greenwald, S.E.; Kukongviriyapan, V. Ferulic Acid Alleviates Changes in a Rat Model of Metabolic Syndrome Induced by High-Carbohydrate, High-Fat Diet. Nutrients 2015, 7, 6446-6464. https://doi.org/10.3390/nu7085283
Senaphan K, Kukongviriyapan U, Sangartit W, Pakdeechote P, Pannangpetch P, Prachaney P, Greenwald SE, Kukongviriyapan V. Ferulic Acid Alleviates Changes in a Rat Model of Metabolic Syndrome Induced by High-Carbohydrate, High-Fat Diet. Nutrients. 2015; 7(8):6446-6464. https://doi.org/10.3390/nu7085283
Chicago/Turabian StyleSenaphan, Ketmanee, Upa Kukongviriyapan, Weerapon Sangartit, Poungrat Pakdeechote, Patchareewan Pannangpetch, Parichat Prachaney, Stephen E. Greenwald, and Veerapol Kukongviriyapan. 2015. "Ferulic Acid Alleviates Changes in a Rat Model of Metabolic Syndrome Induced by High-Carbohydrate, High-Fat Diet" Nutrients 7, no. 8: 6446-6464. https://doi.org/10.3390/nu7085283
APA StyleSenaphan, K., Kukongviriyapan, U., Sangartit, W., Pakdeechote, P., Pannangpetch, P., Prachaney, P., Greenwald, S. E., & Kukongviriyapan, V. (2015). Ferulic Acid Alleviates Changes in a Rat Model of Metabolic Syndrome Induced by High-Carbohydrate, High-Fat Diet. Nutrients, 7(8), 6446-6464. https://doi.org/10.3390/nu7085283