Chemotherapy-Related Toxicity, Nutritional Status and Quality of Life in Precachectic Oncologic Patients with, or without, High Protein Nutritional Support. A Prospective, Randomized Study

Abstract
:1. Background
The Aims of the Study
2. Material and Methods (and Patients)
2.1. Inclusion Criteria
- -
- Histological confirmed diagnosis of colorectal cancer (CRC) in clinical stage II-IV according to TNM UICC 2010.
- -
- Successful qualification to first line chemotherapy according to protocols with: 5-fluorouracil, leucovorin, oxaliplatin (FOLFOX-4) or 5-fluorouracil, leucovorin, irinotecan (FOLFIRI); 100% dose of chemotherapy (no dose reduction).
- -
- Performance status at least 80% according to Karnofsky scale.
- -
- Cancer-related asymptomatic precachexia diagnosed according to SCRINIO Working Group.
- -
- Absence of contraindications to oral nutrition and practicable realization of oral nutrition.
- -
- Absence of severe, decompensated concomitant diseases—e.g., diabetes, hepatic insufficiency, renal insufficiency (K/DOQI stage ≥ 2).
- -
- Signed informed consent for participation in the study.
2.2. Exclusion Criteria
- -
- Diagnosis of a malignant neoplasm in clinical stage I according to TNM UICC 2010.
- -
- Disqualification from oncologic treatment.
- -
- Cancer cachexia or cancer anorexia–cachexia syndrome.
- -
- Poor performance status—Karnofsky scale < 80% or WHO/ECOG (World Health Organisation/Eastern Cooperative Oncology Group) 2–4.
- -
- Contraindications to oral nutrition or to high protein nutrition (e.g., hepatic or renal failure).
- -
- Regular nutritional support at the moment of qualification to the study.
- -
- Patient incompliance at the moment of qualification to the study.
- -
- caecum—4.0%
- -
- ascending colon—58.6%
- -
- sigmoid colon—16.0%
- -
- rectum—21.3%.
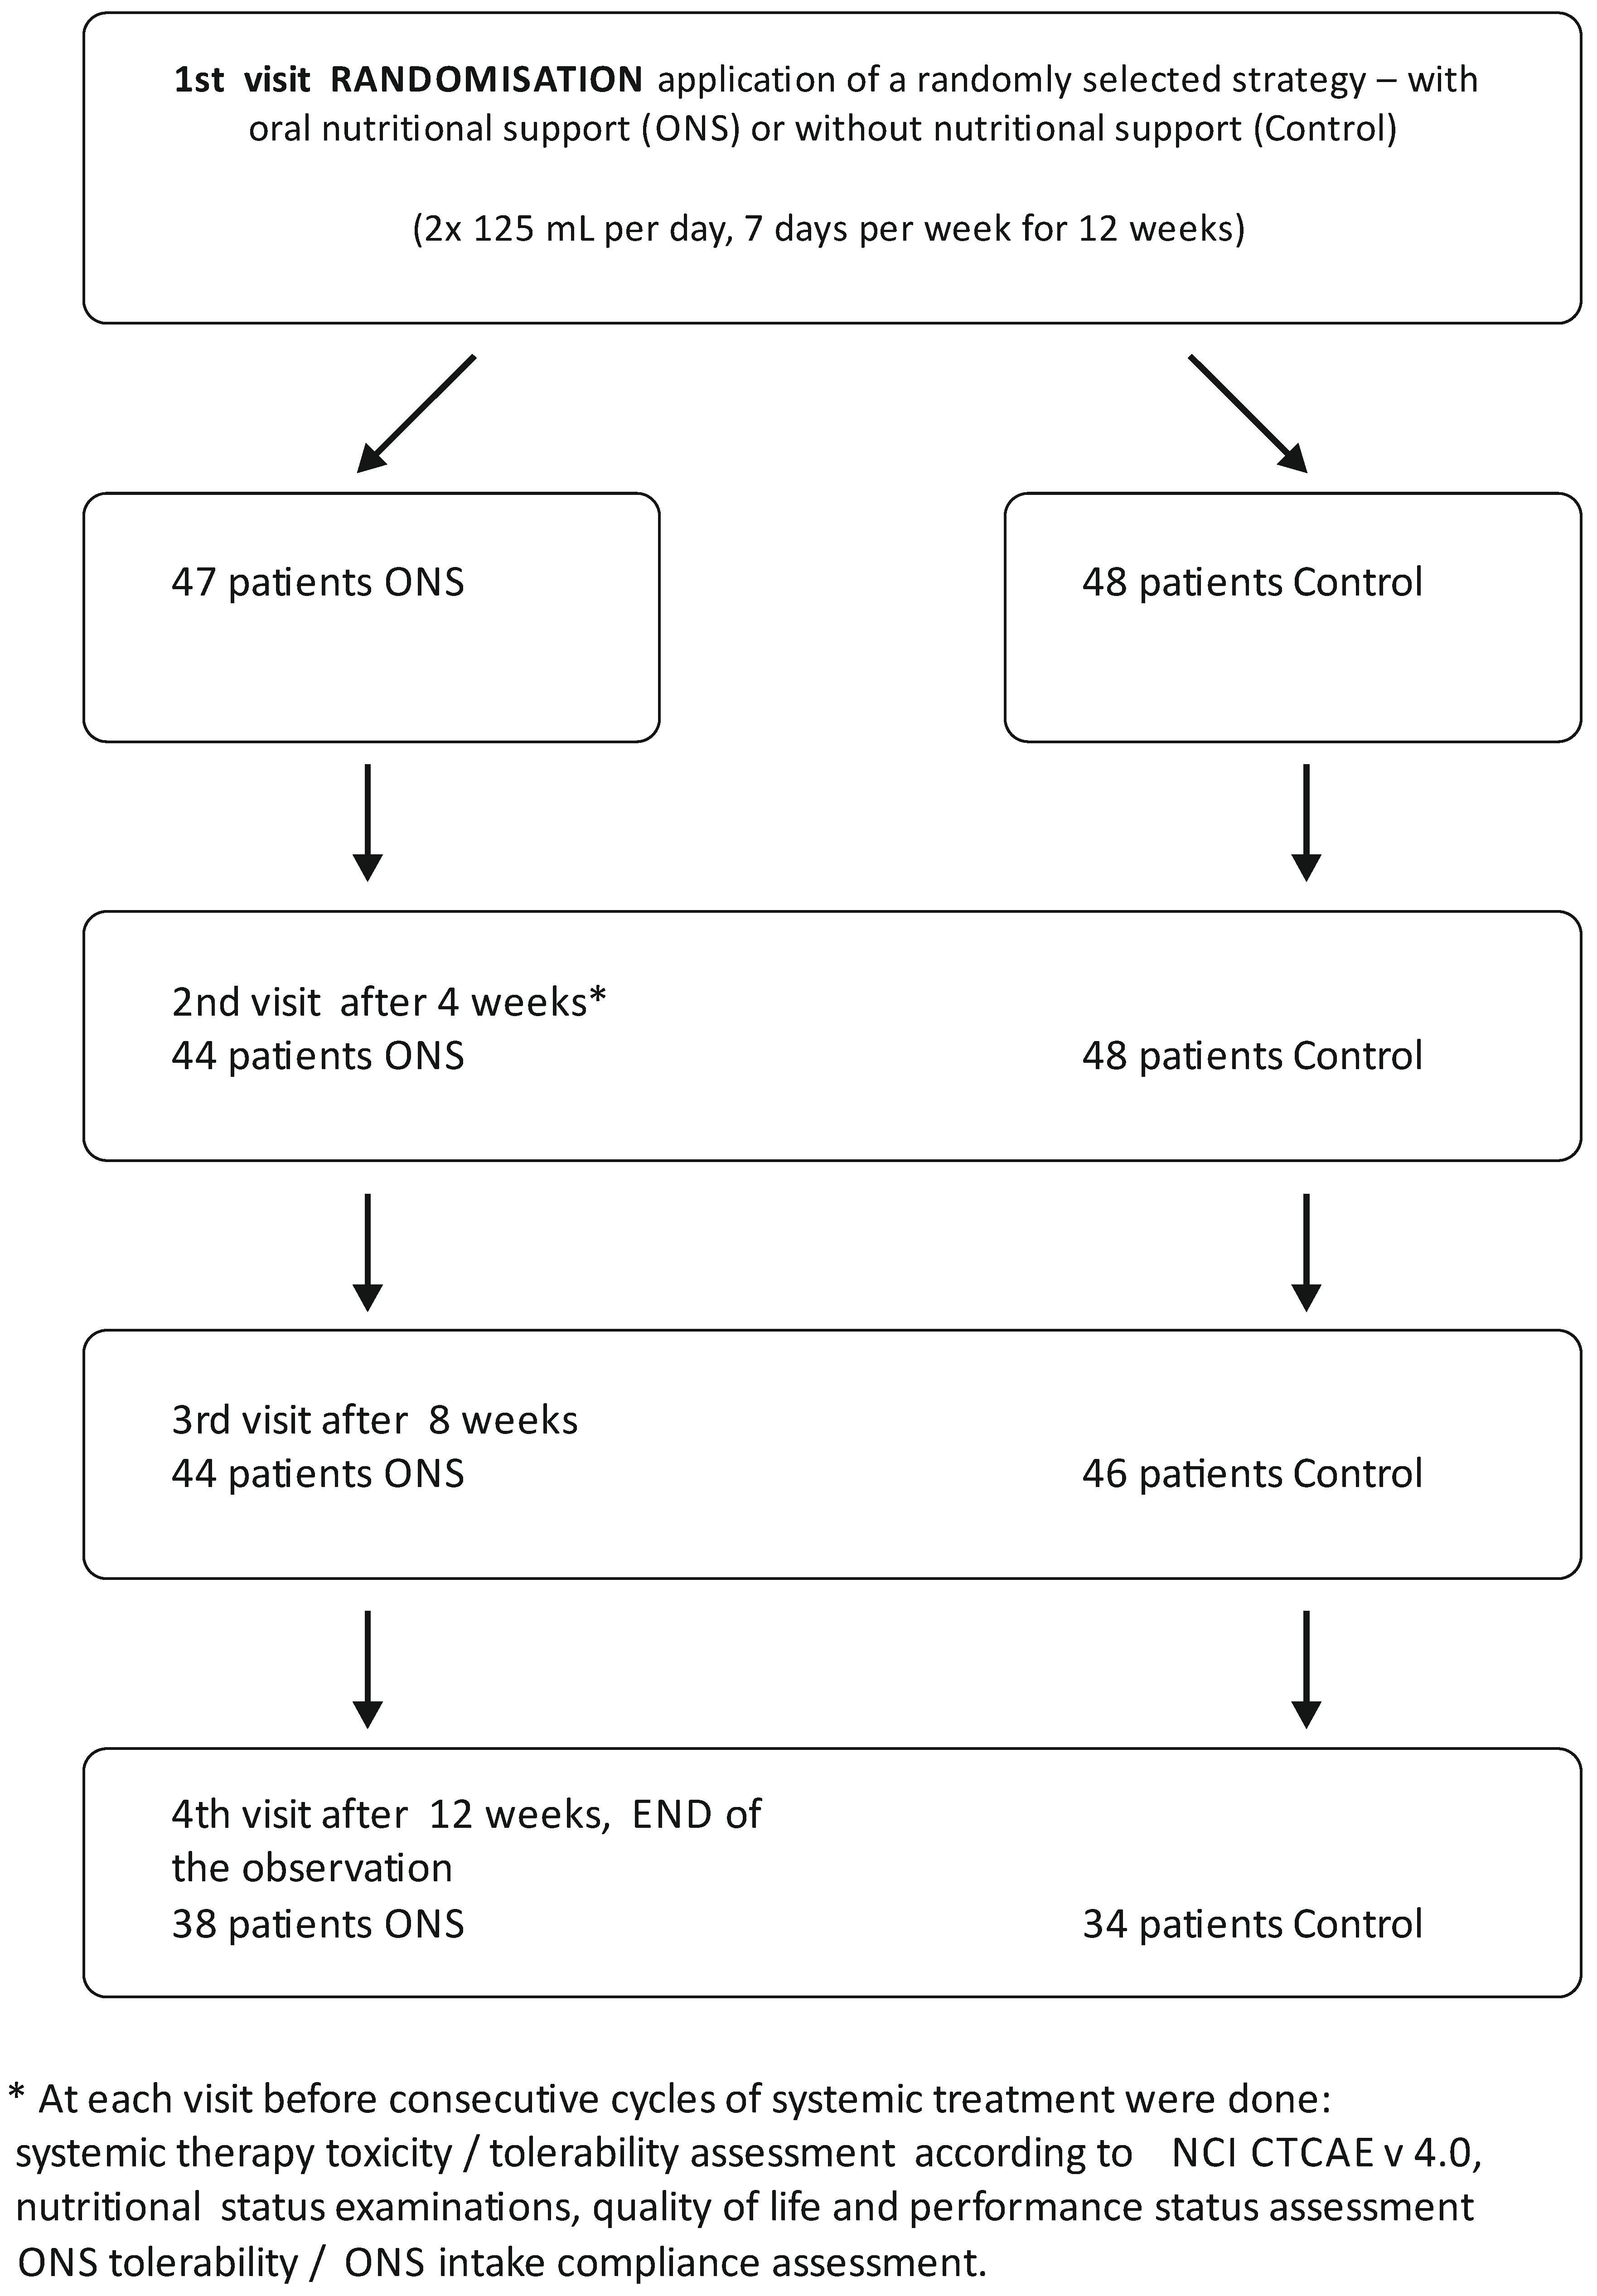
2.3. Dropout Details
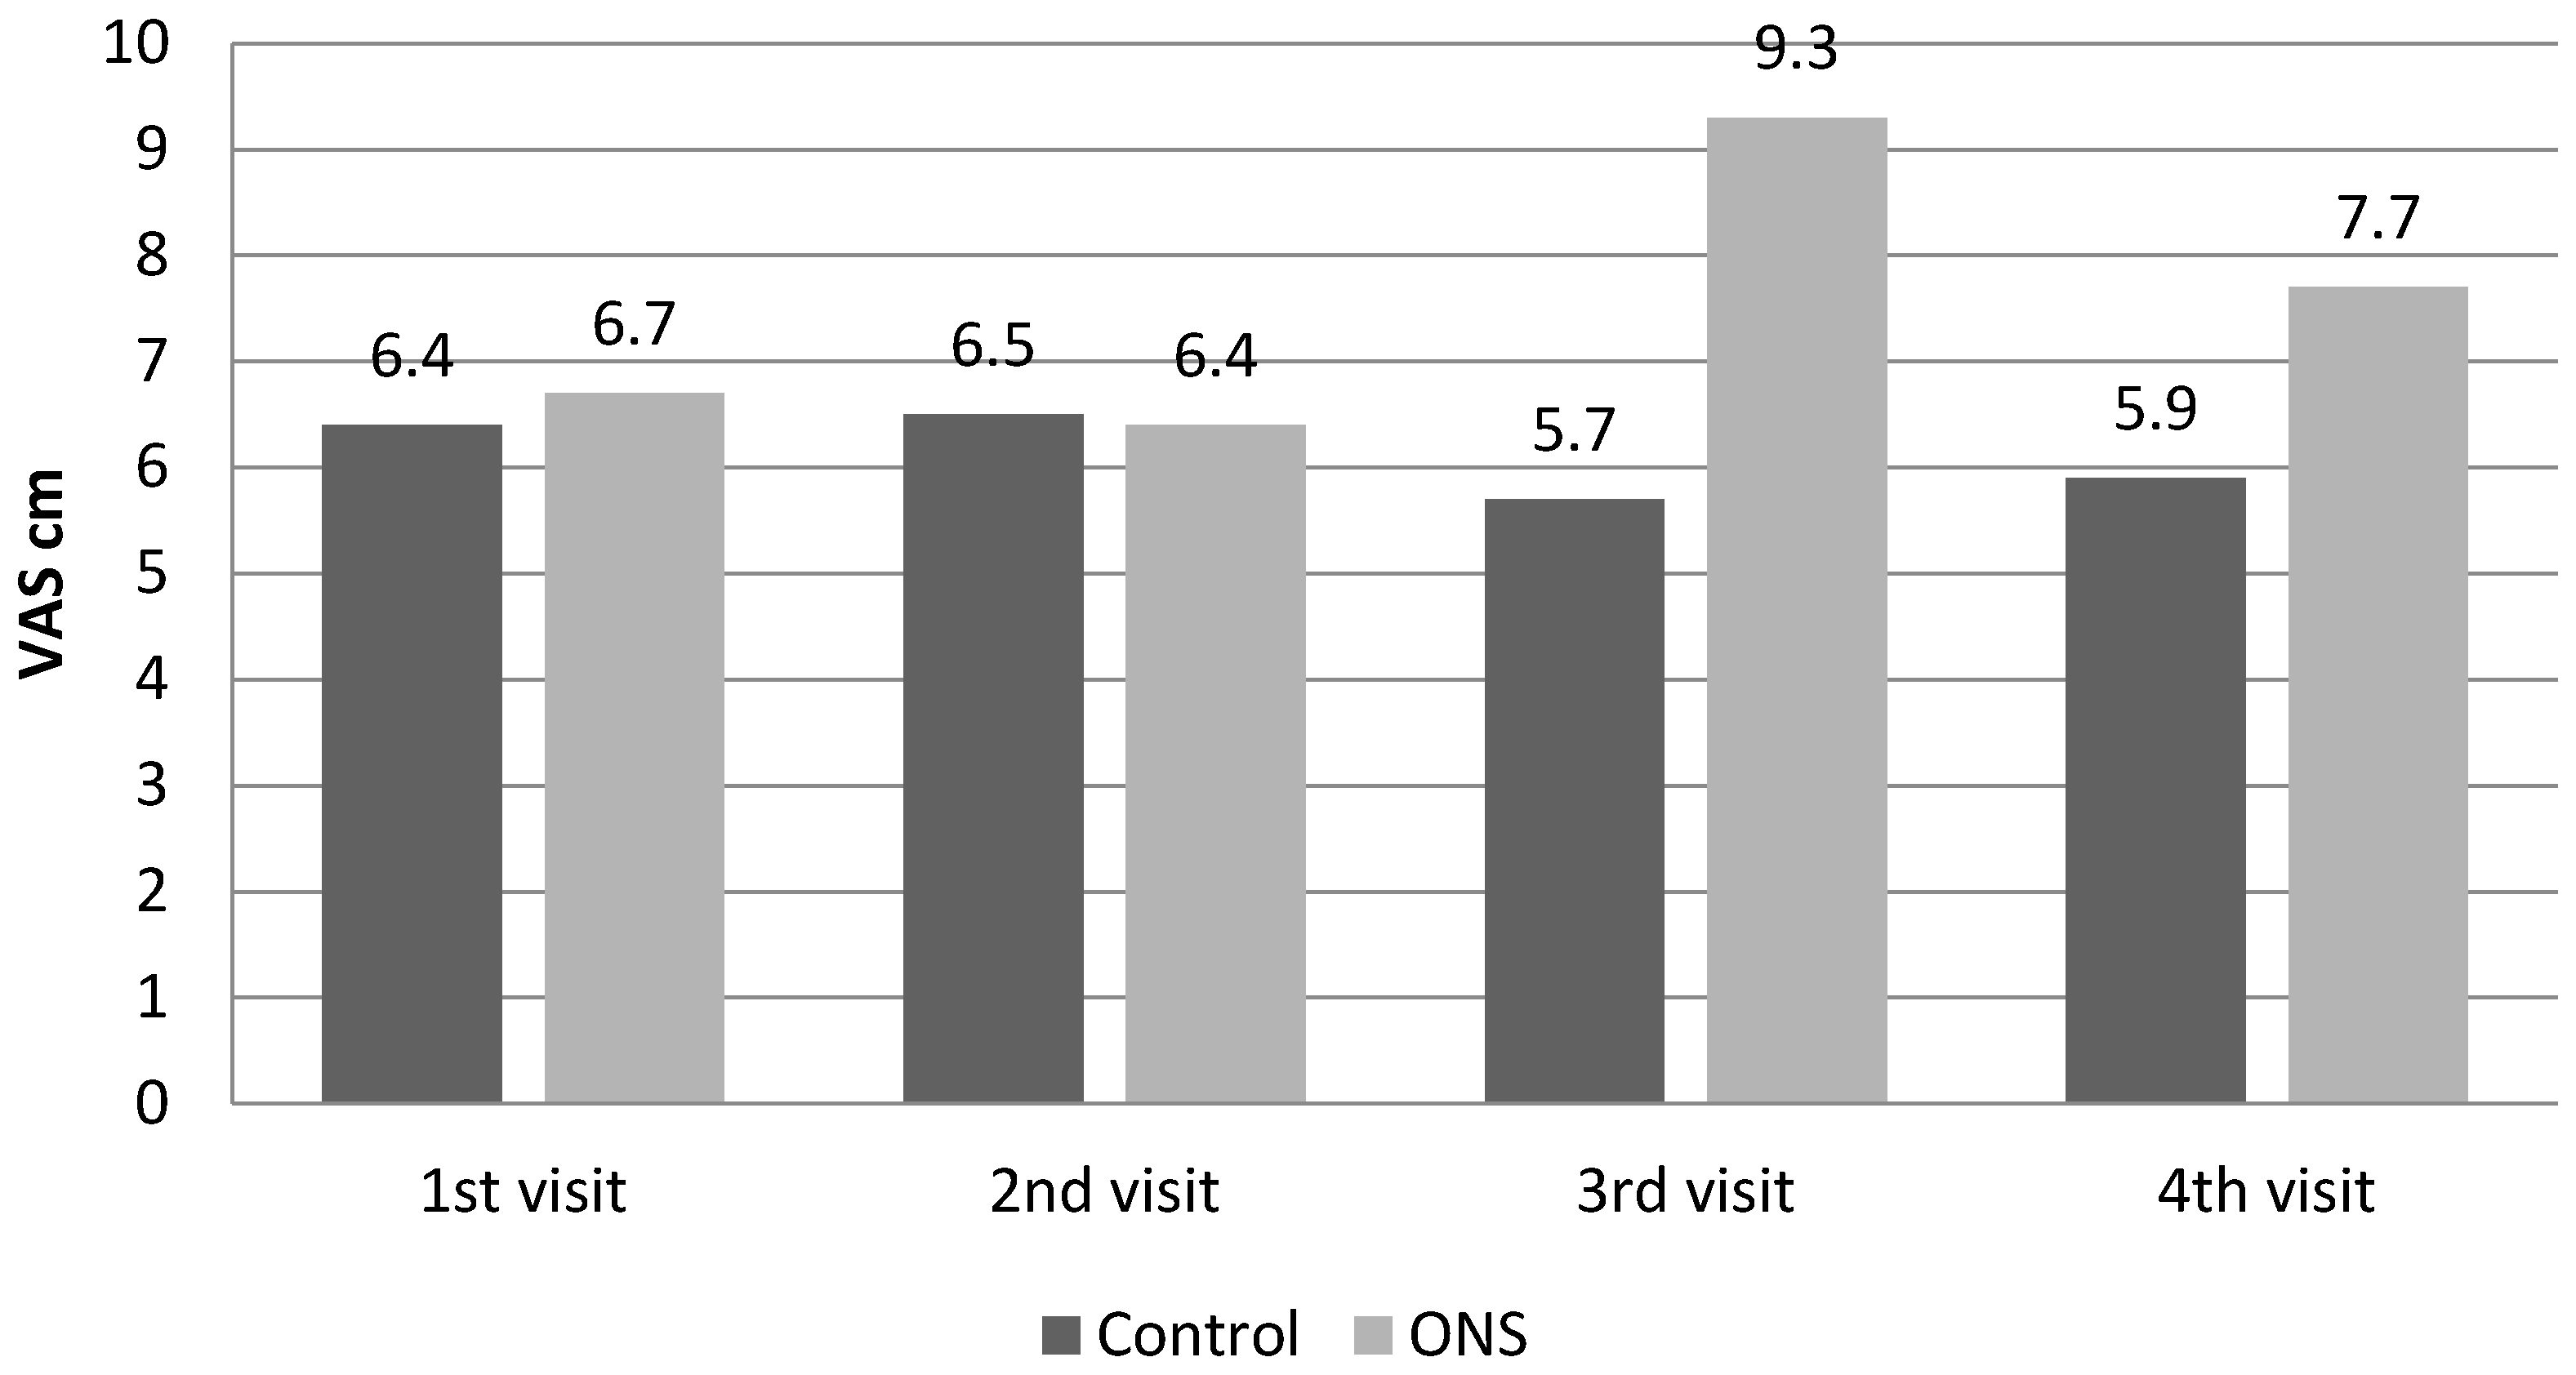
2.4. Nutritional Status, Performance Status and Quality of Life
- <18.5—underweight
- 18.5–24.9—normal body weight
- 25.0–29.9—overweight
- <30.0—obesity
- -
- unintentional weight loss in the past six months <10%
- -
- no anorexia.
2.5. Laboratory Measurements
2.6. Nutritional Intervention
2.7. Statistical Analysis
3. Results
3.1. Baseline Results
3.2. Follow—Up Period
3.2.1. Chemotherapy-Related Toxicity
- -
- in the number and severity of the observed complications, ie neutropenia, leucopenia, thrombocytopenia, anemia, abdominal pain, nausea and vomiting, and diarrhea
- -
- in the number of dose reductions (p = 0.30), delay of chemotherapy cycle (p = 0.24) or disqualification from continuation of chemotherapy.
3.2.2. Compliance/Tolerability
4. Discussion
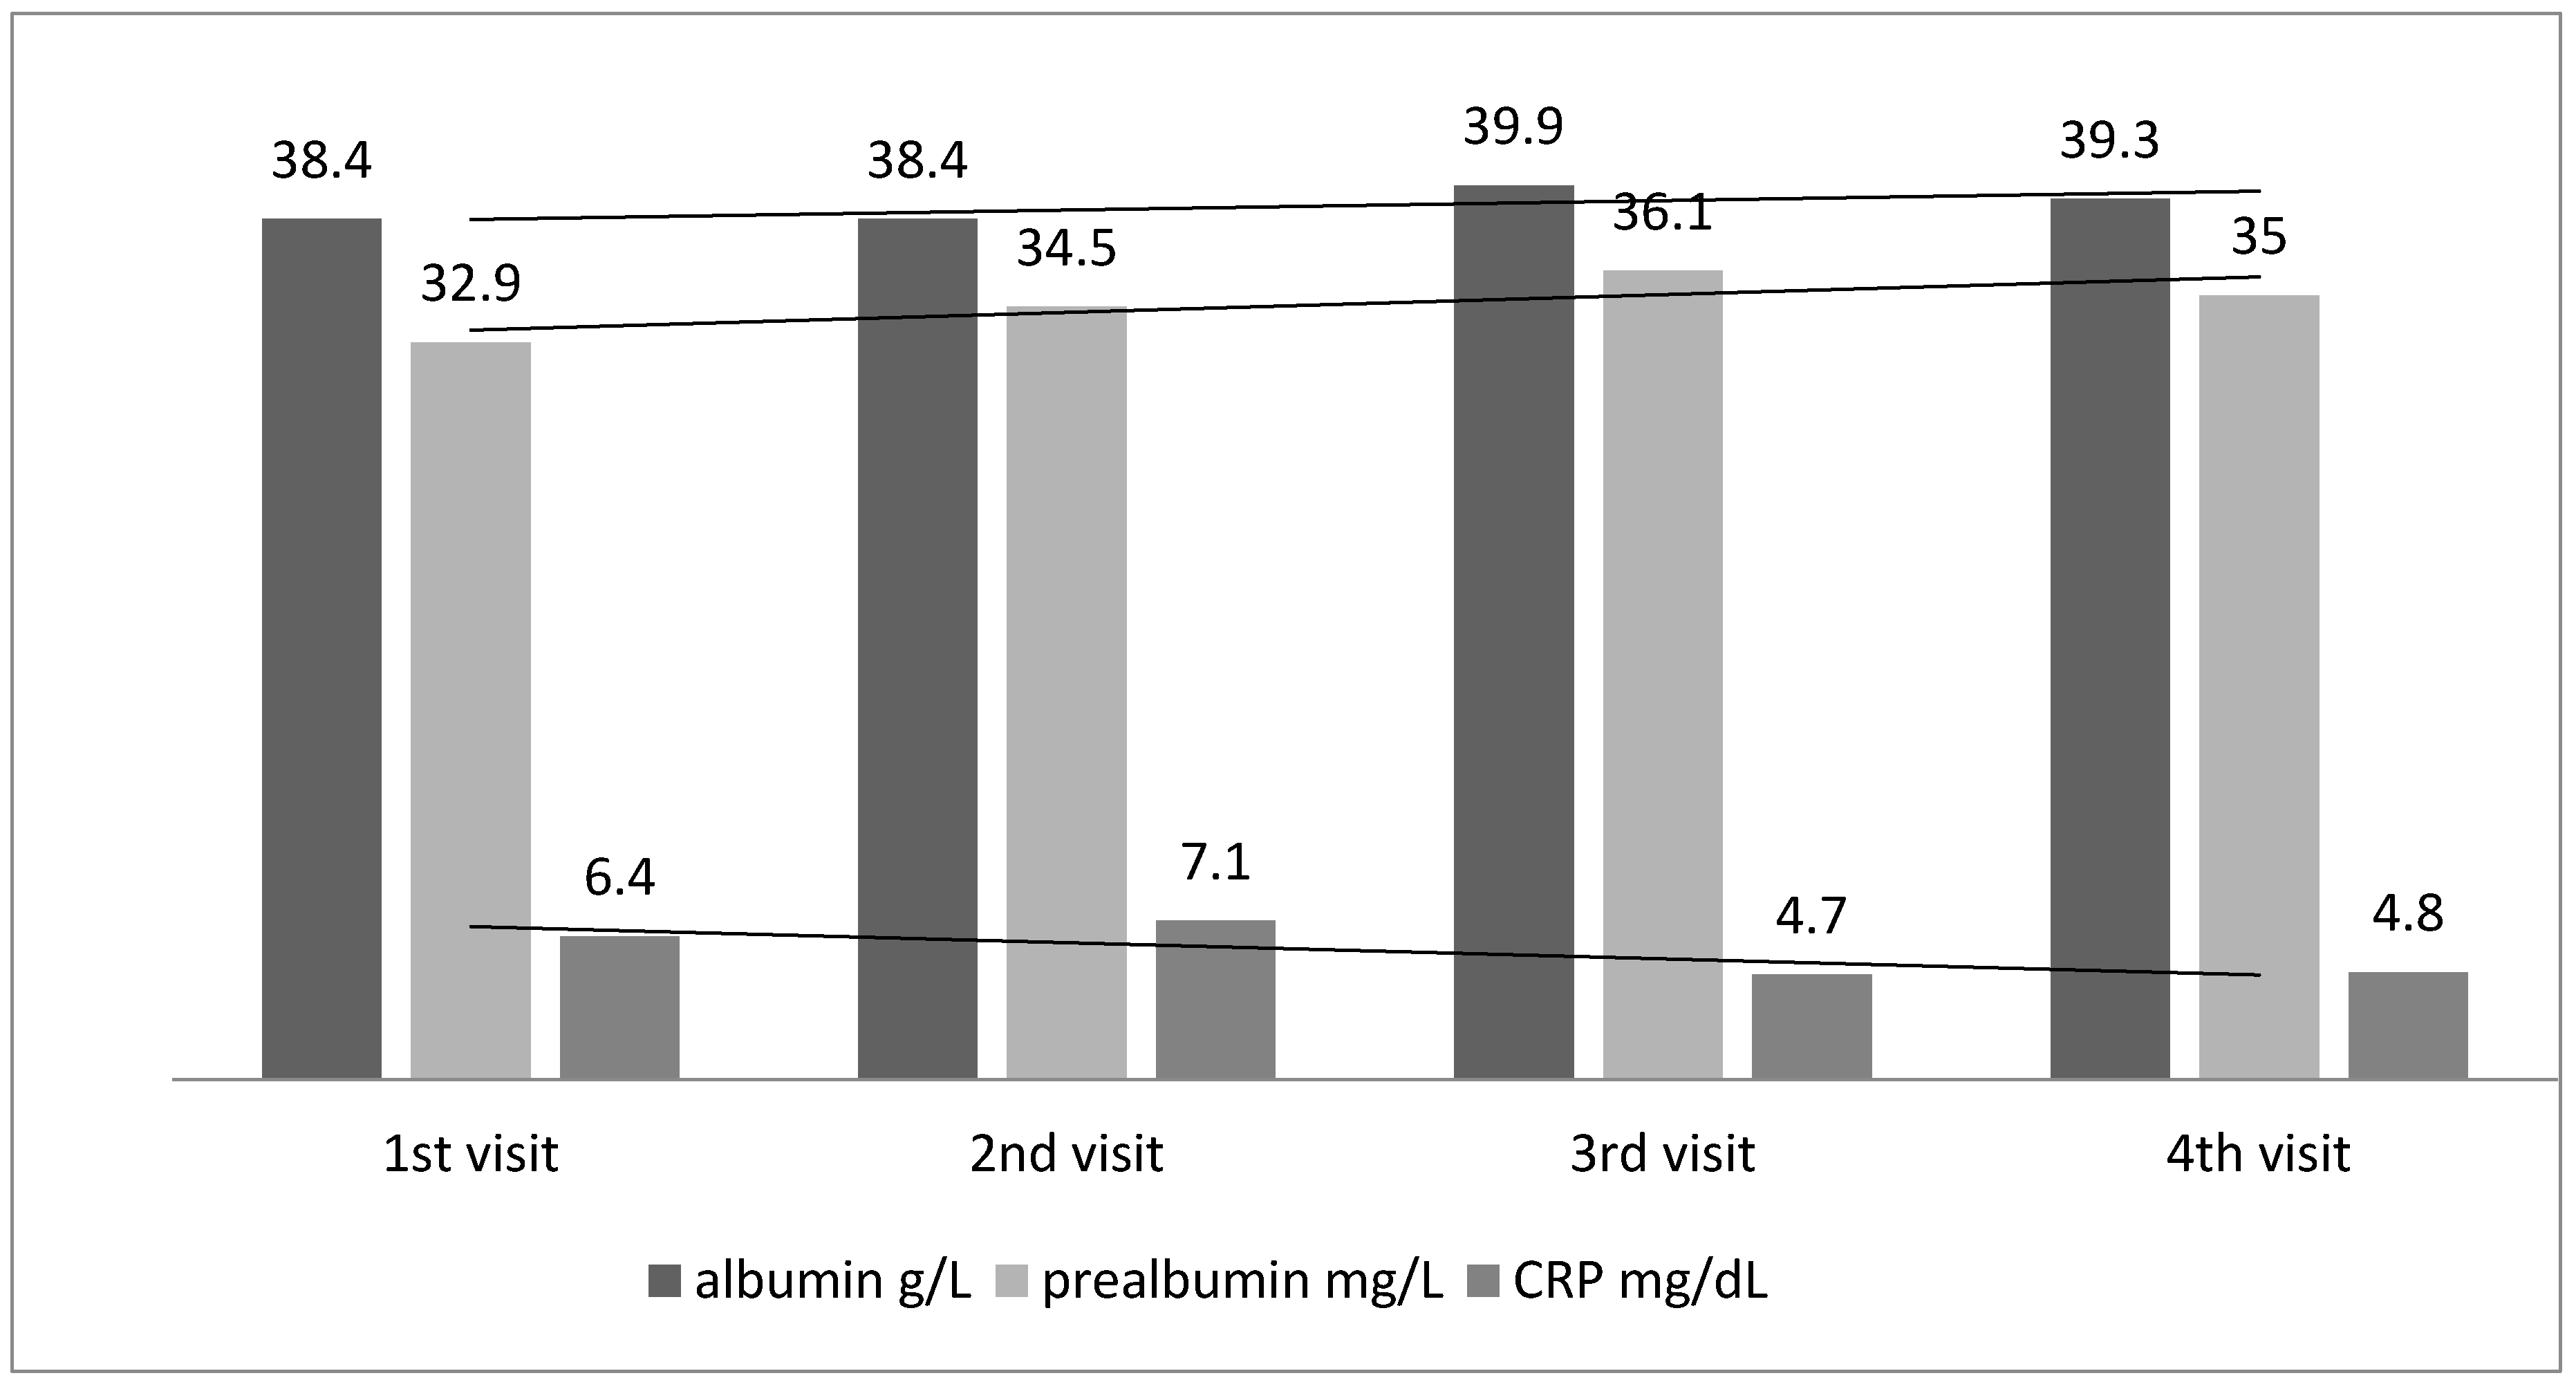
4.1. Nutritional Status
4.2. Inflammation
4.3. Chemotherapy-Related Toxicity
4.4. Limitations and Advantages of the Study
5. Conclusions
- Results of the study did not indicate that nutritional support with high protein ONS in adult oncologic patients in the first step of cancer cachexia—asymptomatic precachexia, had an influence on the toxicity of systemic therapy.
- High protein dietary support improves nutritional status in colorectal cancer patients with precachexia.
- The performance status (based on Karnofsky scale) and quality of life were stable throughout the observation, and was not changed under the supplementation.
- Tolerability of the ONS treatment was good. There were no differences between the groups (ONS vs. Control) in number and severity of nausea, vomiting, diarrhea, abdominal pain.
Acknowledgments
Author Contributions
Conflicts of Interest
Appendix A

| 1st Visit | Randomization Start Observation and Intervention | |
|---|---|---|
| Control Group n = 48 | ONS Group n = 47 | |
| 2nd visit | n = 48 | n = 44 *2 patients resigned from the study (gave up on taking supplements), 1 patient was disqualified from chemotherapy (kidney injury) |
| 3rd visit | n = 46 ** 2 patients moved to another oncology center | n = 44 |
| 4th visit | n = 34 *** 1 patient was hospitalized for sepsis 5 patients were disqualified from chemotherapy because of progression of disease, worsening of overall condition, allergic reactions to treatment (oxaliplatin), 1 patient resigned from the oncology treatment, 5 patients resigned from the study (no time for additional visits, fatigue) | n = 38 *** 1 patient was hospitalized for sepsis 1 patients was disqualified from chemotherapy because of progression of disease and worsening of overall condition, 4 patients resigned from the study (gave up on taking supplements) |
References
- Bozzetti, F.; Mariani, L. Defining and classifying cancer cachexia: A proposal by the SCRINIO Working Group. JPEN J. Parenter. Enter. Nutr. 2009, 33, 361–367. [Google Scholar] [CrossRef] [PubMed]
- Fearon, K.; Strasser, F.; Anker, S.D.; Bosaeus, I.; Bruera, E.; Fainsinger, R.L.; Jatoi, A.; Loprinzi, C.; MacDonald, N.; Mantovani, G.; et al. Definition and classification of cancer cachexia: An international consensus. Lancet Oncol. 2011, 12, 489–495. [Google Scholar] [CrossRef]
- Fearon, K.C.; Voss, A.C.; Hustead, D.S.; Cancer Cachexia Study Group. Definition of cancer cachexia: Effect of weight loss, reduced food intake, and systemic inflammation on functional status and prognosis. Am. J. Clin. Nutr. 2006, 83, 1345–1350. [Google Scholar] [PubMed]
- Dewys, W.D.; Begg, C.; Lavin, P.T.; Band, P.R.; Bennett, J.M.; Bertino, J.R.; Cohen, M.H.; Douglass, H.O., Jr.; Engstrom, P.F.; Ezdinli, E.Z.; et al. Prognostic effect of weight loss prior to chemotherapy in cancer patients. Eastern Cooperative Oncology Group. Am. J. Med. 1980, 69, 491–497. [Google Scholar] [CrossRef]
- Stewart, G.D.; Skipworth, R.J.; Fearon, K.C. Cancer cachexia and fatigue. Clin. Med. 2006, 6, 140–143. [Google Scholar] [CrossRef]
- Fearon, K.C.; Barber, M.D.; Moses, A.G. The cancer cachexia syndrome. Surg. Oncol. Clin. N. Am. 2001, 10, 109–126. [Google Scholar] [PubMed]
- Buskermolen, S.; Langius, J.A.; Kruizenga, H.M.; Ligthart-Melis, G.C.; Heymans, M.W.; Verheul, H.M. Weight loss of 5% or more predicts loss of fat-free mass during palliative chemotherapy in patients with advanced cancer: A pilot study. Nutr. Cancer 2012, 64, 826–832. [Google Scholar] [CrossRef] [PubMed]
- Pausch, T.; Hartwig, W.; Hinz, U.; Swolana, T.; Bundy, B.D.; Hackert, T.; Grenacher, L.; Büchler, M.W.; Werner, J. Cachexia but not obesity worsens the postoperative outcome after pancreatoduodenectomy in pancreatic cancer. Surgery 2012, 152, 81–88. [Google Scholar] [CrossRef] [PubMed]
- Lasheen, W.; Walsh, D. The cancer anorexia-cachexia syndrome: Myth or reality? Support. Care Cancer 2010, 18, 265–272. [Google Scholar] [CrossRef] [PubMed]
- Capuano, G.; Gentile, P.C.; Bianciardi, F.; Tosti, M.; Palladino, A.; Di Palma, M. Prevalence and influence of malnutrition on quality of life and performance status in patients with locally advanced head and neck cancer before treatment. Support. Care Cancer 2010, 18, 433–437. [Google Scholar] [CrossRef] [PubMed]
- MacDonald, N. Terminology in cancer cachexia: Importance and status. Curr. Opin. Clin. Nutr. Metab. Care 2012, 15, 220–225. [Google Scholar] [CrossRef] [PubMed]
- Fearon, K.; Arends, J.; Baracos, V. Understanding the mechanisms and treatment options in cancer cachexia. Nat. Rev. Clin. Oncol. 2013, 10, 90–99. [Google Scholar] [CrossRef] [PubMed]
- Arrieta, O.; Michel Ortega, R.M.; Villanueva-Rodríguez, G.; Serna-Thomé, M.G.; Flores-Estrada, D.; Diaz-Romero, C.; Rodríguez, C.M.; Martínez, L.; Sánchez-Lara, K. Association of nutritional status and serum albumin levels with development of toxicity in patients with advanced non-small cell lung cancer treated with paclitaxel-cisplatin chemotherapy: A prospective study. BMC Cancer 2010, 10, 50. [Google Scholar] [CrossRef] [PubMed]
- Lopes, J.P.; de Castro Cardoso Pereira, P.M.; dos Reis Baltazar Vicente, A.F.; Bernardo, A.; de Mesquita, M.F. Nutritional status assessment in colorectal cancer patients. Nutr. Hosp. 2013, 28, 412–418. [Google Scholar] [PubMed]
- Caro, M.M.M.; Candela, C.G.; Rabaneda, R.C.; Nogueira, T.L.; Huerta, A.G.; Kohen, V.L.; Sanz, M.V.; Auñón, P.Z.; Pérez, L.L.; Sáenz, P.R.; et al. Nutritional risk evaluation and establishment of nutritional support in oncology patients according to the protocol of the Spanish Nutrition and Cancer Group. Nutr. Hosp. 2008, 23, 458–468. [Google Scholar]
- Krawczyk, J.; Korta, T. Niedożywienie jako problem kliniczny u osób z rozpoznaną chorobą nowotworową leczonych systemowo. Postępy Żywienia Klinicznego 2017, 21, 157–161. [Google Scholar]
- Bachmann, J.; Ketterer, K.; Marsch, C.; Fechtner, K.; Krakowski-Roosen, H.; Büchler, M.W.; Friess, H.; Martignoni, M.E. Pancreatic cancer related cachexia: Influence on metabolism and correlation to weight loss and pulmonary function. BMC Cancer 2009, 9, 255. [Google Scholar] [CrossRef] [PubMed]
- Hu, W.H.; Cajas-Monson, L.C.; Eisenstein, S.; Parry, L.; Cosman, B.; Ramamoorthy, S. Preoperative malnutrition assessments as predictors of postoperative mortality and morbidity in colorectal cancer: An analysis of ACS-NSQIP. Nutr. J. 2015, 14, 91. [Google Scholar] [CrossRef] [PubMed]
- Borda, F.; Borda, A.; Jiménez, J.; Zozaya, J.M.; Prieto, C.; Gómez, M.; Urman, J.; Ibáñez, B. Predictive value of pre-treatment hypoalbuminemia in prognosis of resected colorectal cancer. Gastroenterol. Hepatol. 2014, 37, 289–295. [Google Scholar] [CrossRef] [PubMed]
- Ihara, K.; Yamaguchi, S.; Shida, Y.; Ogata, H.; Domeki, Y.; Okamoto, K.; Nakajima, M.; Sasaki, K.; Tsuchioka, T.; Kato, H. Poor nutritional status before and during chemotherapy leads to worse prognosis in unresectable advanced or recurrent colorectal cancer. Int. Surg. 2015. [Google Scholar] [CrossRef] [PubMed]


| Parameters | ONS n = 47 | Control n = 48 |
|---|---|---|
| Age years mean ± SD | 65.00 ± 9.97 | 63.66 ± 9.39 |
| Females/Males n | 20/27 | 26/22 |
| Stadium G n/% | G2 = 33 (70.2%) | G2 = 38 (81.2%) |
| G3 = 11 (23.4%) | G3 = 9 (18.7%) | |
| G4 = 3 (6.4%) | G4 = 1 (2.1%) | |
| Metastases n/% | N = 35 (74.5%) | n = 40 (83.3%) |
| Stoma n/% | N = 23 (48.9%) | N = 13 (27.0) |
| Chemotherapy type n/% | FOLFOX n = 16 (34.1%) | FOLFOX n = 17 (35.4%) |
| FOLFIRI n = 7 (14.8%) | FOLFIRI n = 8 (16.6%) | |
| Other n = 24 (51.1%) | Other n = 23 (47.9%) |
| Parameters | ONS n = 47 | Control n = 48 | ONS n = 38 | Control n = 34 | p ONS vs. Control * |
|---|---|---|---|---|---|
| 1st visit | 4th visit | ||||
| Nutritional Status | |||||
| BMI kg/m2 | 23.99 ± 3.26 | 26.5 ± 4.65 | 24.0 ± 5.2 | 25.32 ± 8.47 | 0.44 |
| SGA points | 4.68 ± 0.91 | 5.10 ± 0.55 | 5.4 ± 0.55 | 5.2 ± 0.59 | 0.05 |
| NRS-2002 points | 3.19 ± 0.77 | 3.02 ± 0.56 | 2.5 ± 0.6 | 2.6 ± 5.00 | 0.47 |
| VAS cm | 6.44 ± 2.68 | 6.40 ± 2.00 | 7.79 ± 1.7 | 5.90 ± 2.22 | 0.0001 |
| Albumin g/L | 37.89 ± 4.65 | 35.68 ± 5.53 | 39.15 ± 4.28 | 35.9 ± 5.30 | 0.006 |
| Prealbumin mg/L | 31.83 ± 7.03 | 28.13 ± 8.60 | 34.68 ± 4.28 | 29.14 ± 7.76 | 0.001 |
| Biochemistry | |||||
| WBC ×109/L | 6.66 ± 2.15 | 6.71 ± 2.96 | 5.35 ± 1.8 | 6.62 ± 3.60 | 0.36 |
| NEUT ×109/L | 3.74 ± 1.69 | 3.78 ± 2.18 | 2.6 ± 1.5 | 3.59 ± 3.46 | 0.12 |
| RBC ×109/L | 4.15 ± 0.52 | 4.27 ± 0.68 | 4.04 ± 0.5 | 3.96 ± 0.59 | 0.49 |
| Hb g/dL | 11.61 ± 1.53 | 12.09 ± 2.06 | 11.7 ± 1.4 | 11.8 ± 1.90 | 0.91 |
| Plt ×109/L | 279.36 ± 121.37 | 263.37 ± 109.07 | 199.5 ± 65.9 | 200.7 ± 82.20 | 0.94 |
| CRP mg/dL | 7.14 ± 4.33 | 8.76 ± 12.21 | 5.0 ± 2.9 | 6.1 ± 3.54 | 0.13 |
| Ferritin µg/dL | 52.89 ± 44.05 | 104.54 ± 107.39 | 42.5 ± 33.9 | 92.9 ± 88.22 | 0.001 |
| Total Cholesterol mg/dL | 176.20 ± 48.02 | 196.53 ± 97.64 | 173.5 ± 46.0 | 172.6 ± 40.1 | 0.93 |
| Triglycerides mg/dL | 149.88 ± 72.96 | 159.07 ± 53.76 | 176.18 ± 99.7 | 148.9 ± 41.4 | 0.14 |
| Quality of Life | |||||
| FAACT points | 78.27 ± 13.28 | 75.89 ± 13.82 | 76.8 ± 13.2 | 74.96 ± 12.8 | 0.55 |
| Performance Status | |||||
| Karnofsky scale % | 91.48 ± 7.21 | 93.95 ± 6.43 | 93.24 ± 6.86 | 92.00 ± 6.64 | 0.45 |
| The Dependent Variable | B | Standard Error | Beta | p |
|---|---|---|---|---|
| Constant | 52.00583 | 0.000013 | ||
| SGA | −0.005915 | 0.196710 | −0.04437 | 0.976225 |
| NRS-2002 | −0.205971 | 0.175000 | −1.32157 | 0.249113 |
| VAS | −0.042075 | 0.200423 | −0.10725 | 0.835241 |
| CRP | −0.524951 | 0.196874 | −0.78814 | 0.012590 |
| Returned drinks | 0.000193 | 0.172006 | 0.00006 | 0.999115 |
© 2017 by the authors. Licensee MDPI, Basel, Switzerland. This article is an open access article distributed under the terms and conditions of the Creative Commons Attribution (CC BY) license (http://creativecommons.org/licenses/by/4.0/).
Share and Cite
Ziętarska, M.; Krawczyk-Lipiec, J.; Kraj, L.; Zaucha, R.; Małgorzewicz, S. Chemotherapy-Related Toxicity, Nutritional Status and Quality of Life in Precachectic Oncologic Patients with, or without, High Protein Nutritional Support. A Prospective, Randomized Study. Nutrients 2017, 9, 1108. https://doi.org/10.3390/nu9101108
Ziętarska M, Krawczyk-Lipiec J, Kraj L, Zaucha R, Małgorzewicz S. Chemotherapy-Related Toxicity, Nutritional Status and Quality of Life in Precachectic Oncologic Patients with, or without, High Protein Nutritional Support. A Prospective, Randomized Study. Nutrients. 2017; 9(10):1108. https://doi.org/10.3390/nu9101108
Chicago/Turabian StyleZiętarska, Monika, Joanna Krawczyk-Lipiec, Leszek Kraj, Renata Zaucha, and Sylwia Małgorzewicz. 2017. "Chemotherapy-Related Toxicity, Nutritional Status and Quality of Life in Precachectic Oncologic Patients with, or without, High Protein Nutritional Support. A Prospective, Randomized Study" Nutrients 9, no. 10: 1108. https://doi.org/10.3390/nu9101108
APA StyleZiętarska, M., Krawczyk-Lipiec, J., Kraj, L., Zaucha, R., & Małgorzewicz, S. (2017). Chemotherapy-Related Toxicity, Nutritional Status and Quality of Life in Precachectic Oncologic Patients with, or without, High Protein Nutritional Support. A Prospective, Randomized Study. Nutrients, 9(10), 1108. https://doi.org/10.3390/nu9101108