Effects of Algicidal Macrophyte Metabolites on Cyanobacteria, Microcystins, Other Plankton, and Fish in Microcosms


 , , , ,
Abstract
:
1. Introduction
2. Results
2.1. Phytoplankton
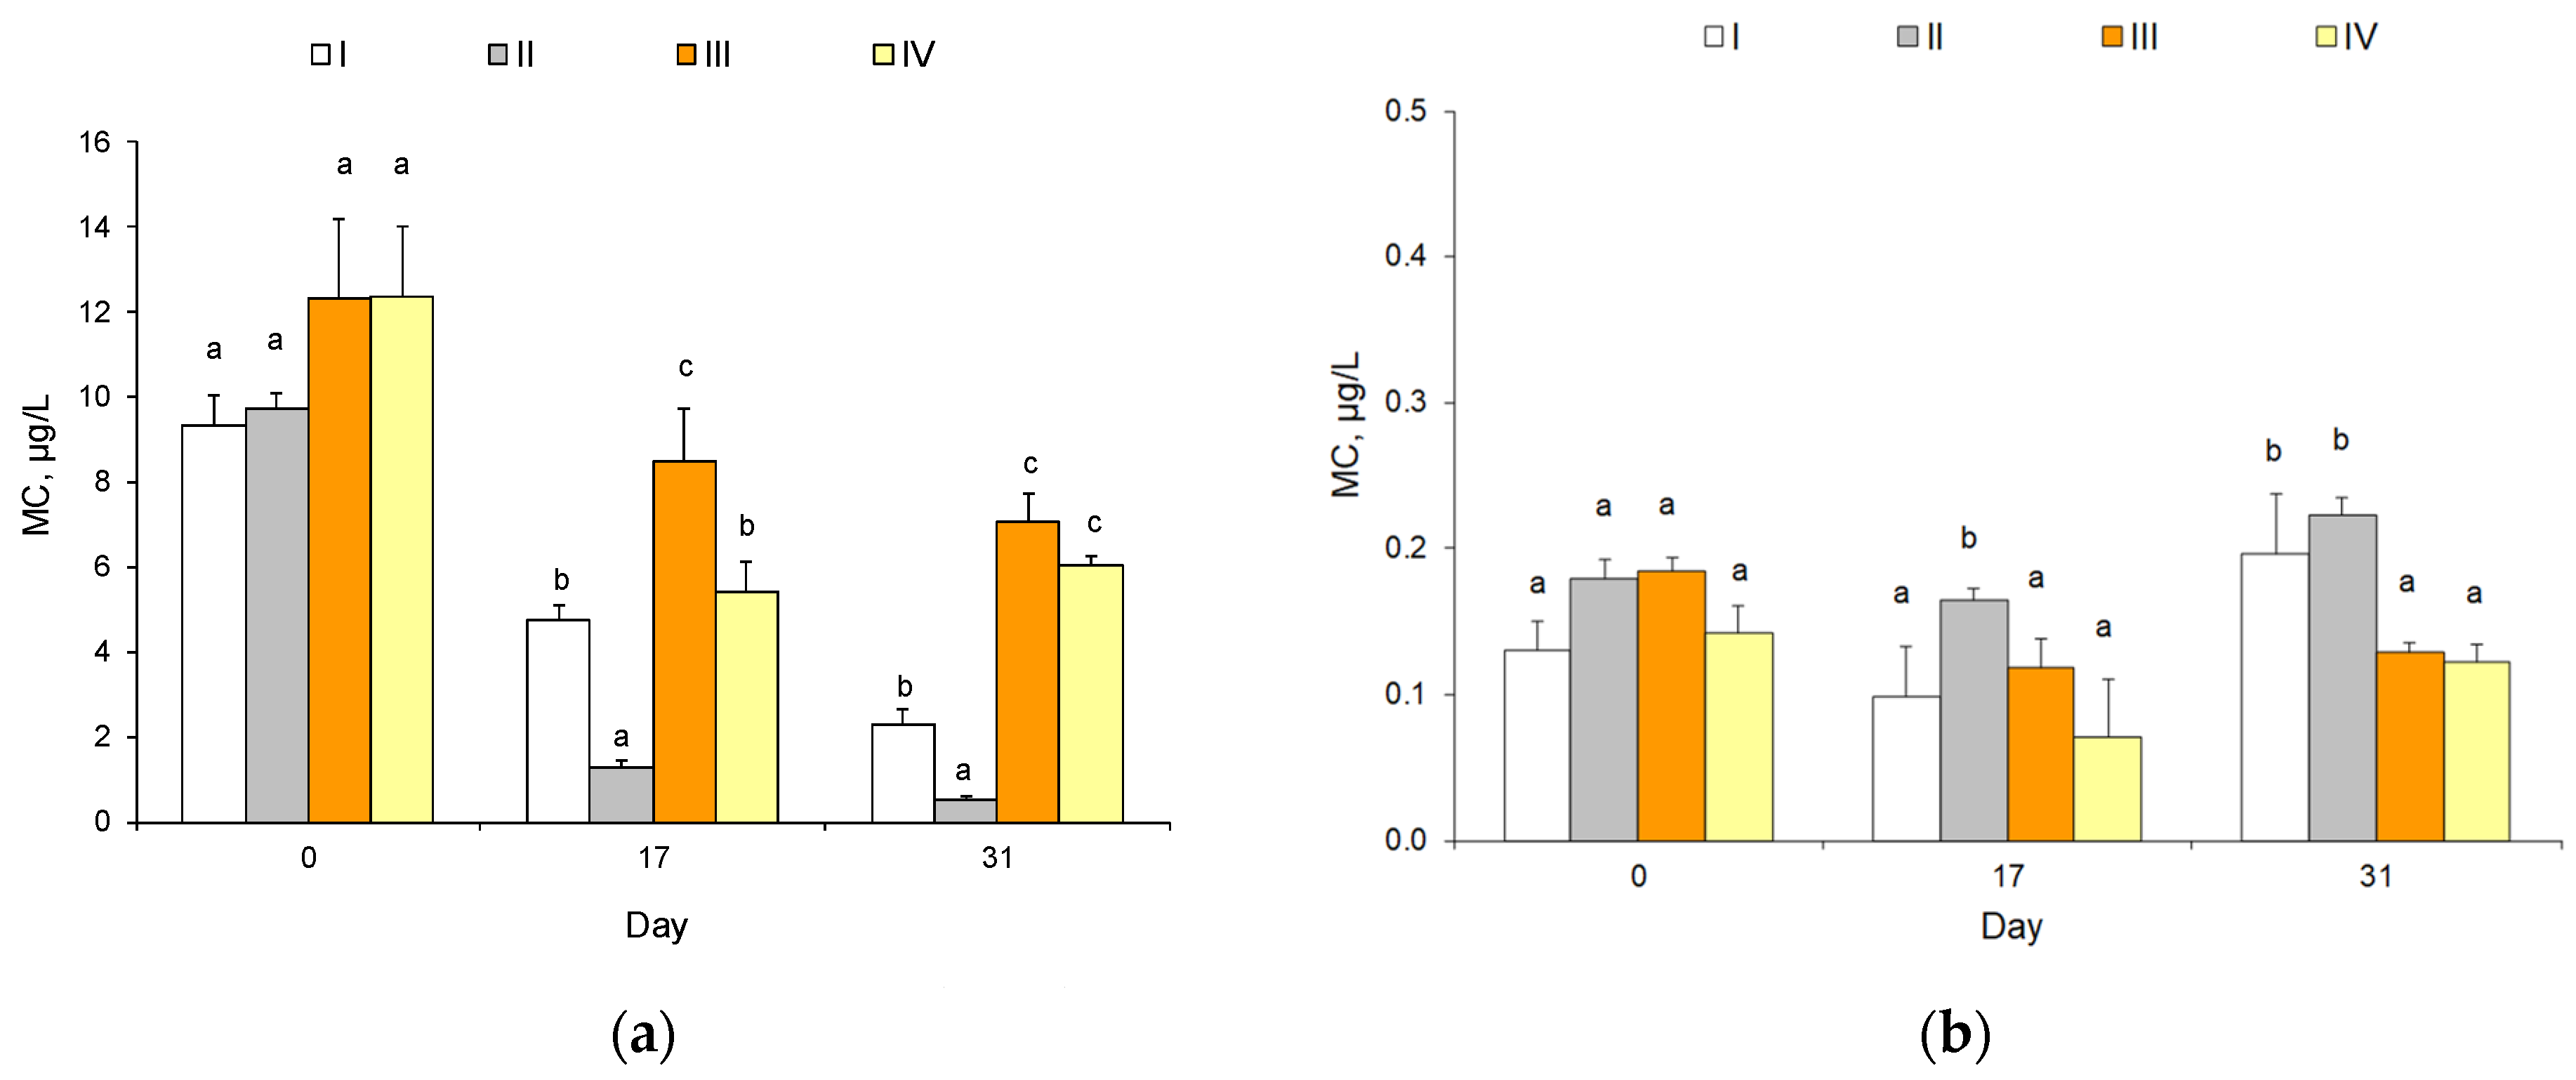
2.2. Cyanotoxins
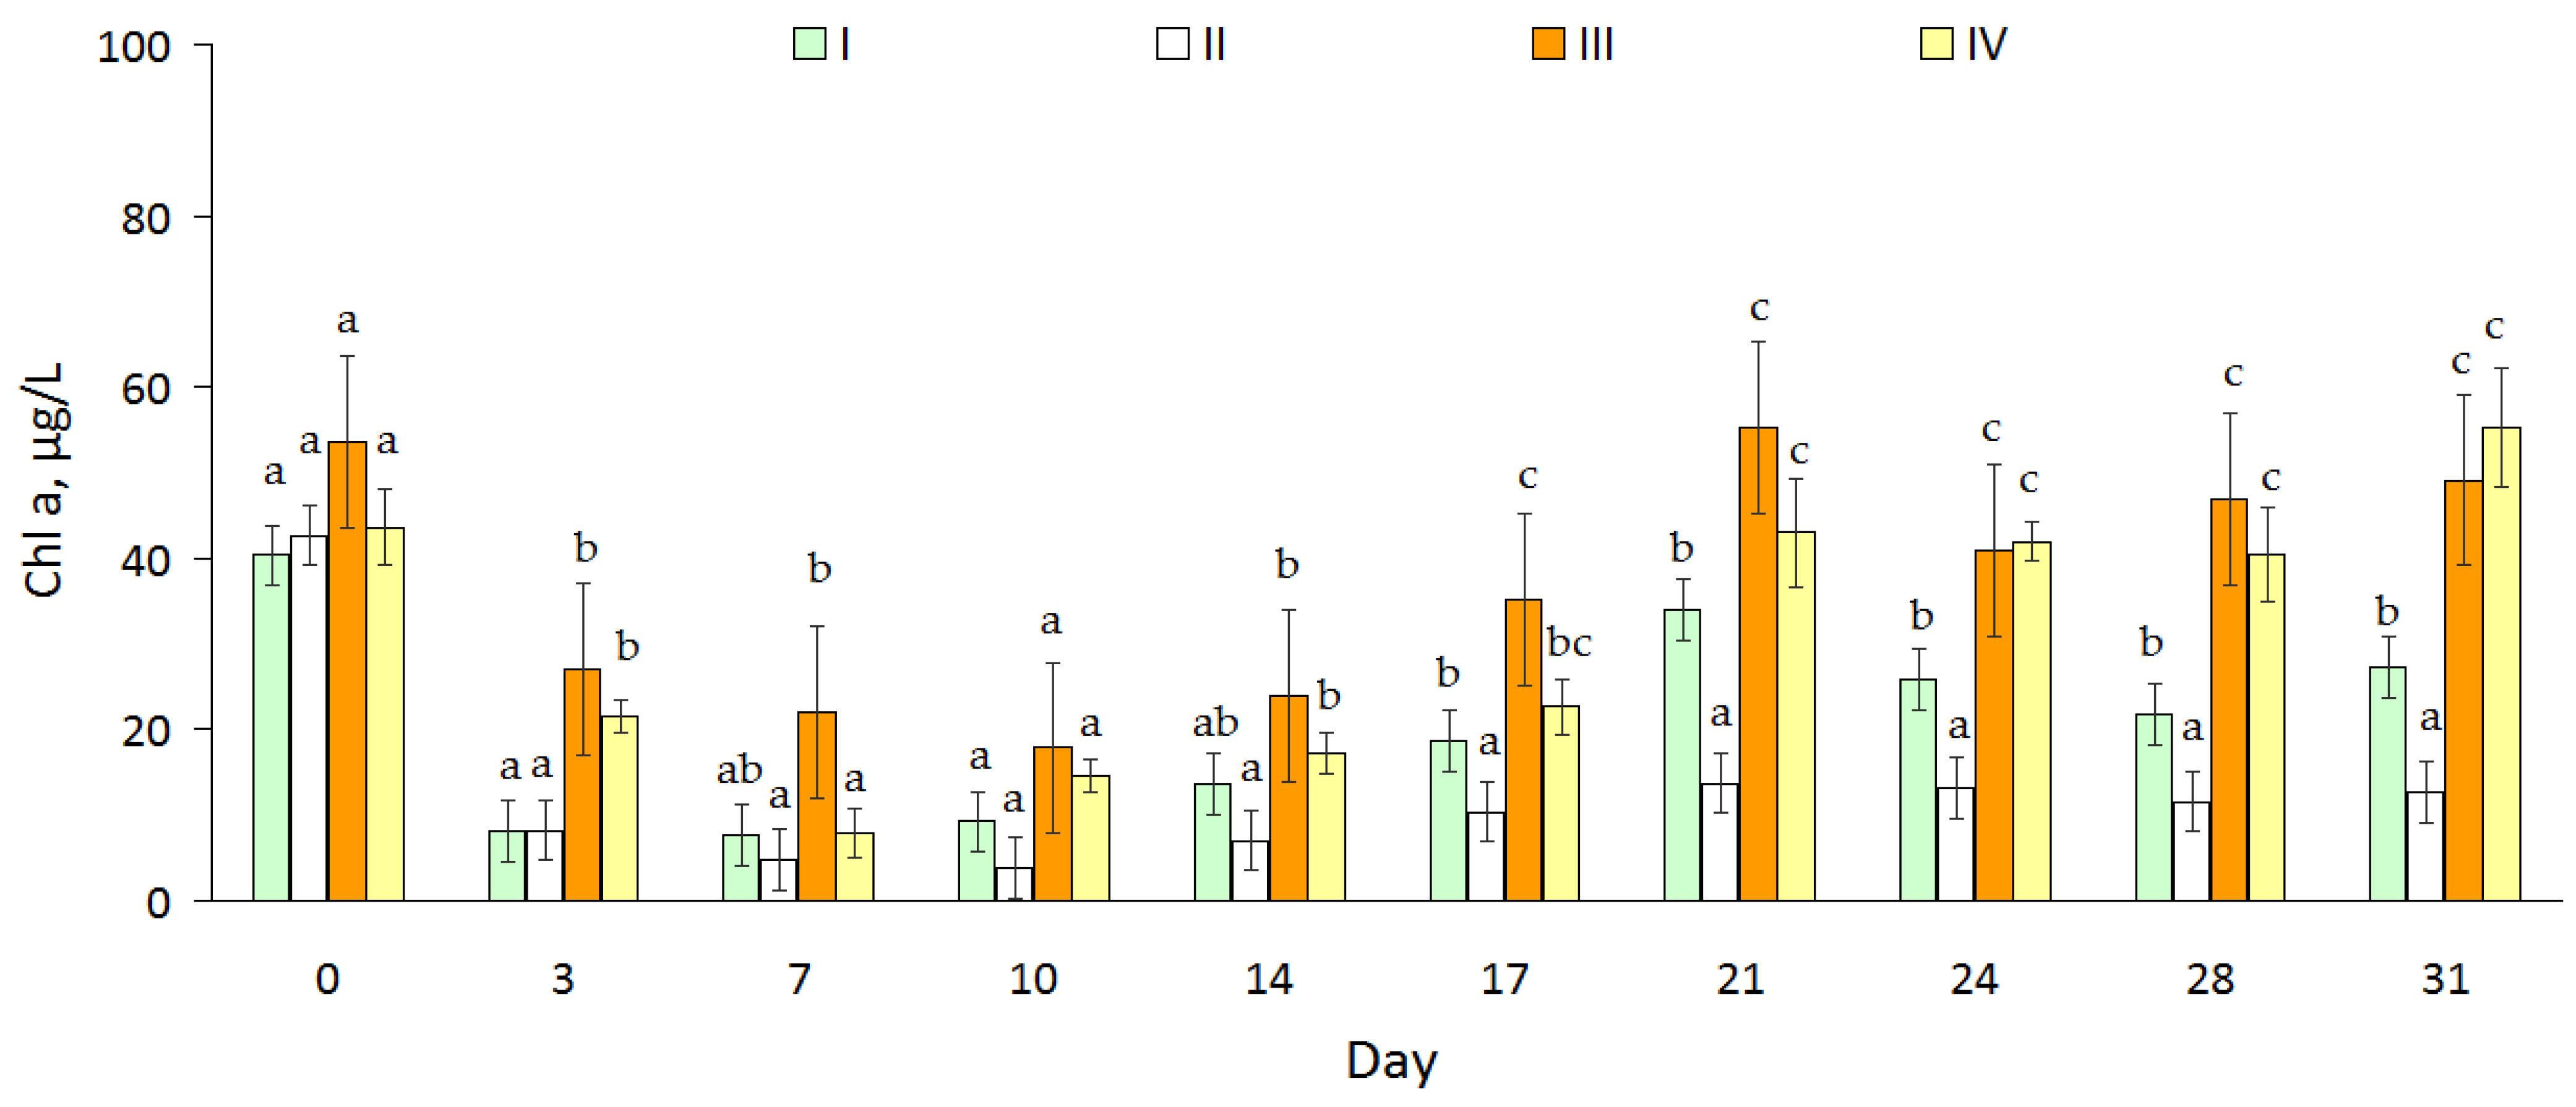
2.3. Chlorophyll-a
2.4. Salt Content, Nutrients, and Physical Parameters of Water
2.5. Zooplankton
2.6. Fish
3. Discussion
4. Materials and Methods
4.1. Experiment Design
4.2. Algicide
4.3. Samples Collection and Laboratory Procedures
4.4. Chemical Methods and Protocols
4.5. Statistics
Supplementary Materials
Author Contributions
Funding
Institutional Review Board Statement
Informed Consent Statement
Data Availability Statement
Acknowledgments
Conflicts of Interest
References
- Karlson, A.M.L.; Duberg, J.; Motwani, N.H.; Hogfors, H.; Klawonn, I.; Ploug, H.; Svedén, B.; Garbaras, A.; Sundelin, B.; Hajdu, S.; et al. Nitrogen fixation by cyanobacteria stimulates production in Baltic food webs. AMBIO 2015, 44, 413–426. [Google Scholar] [CrossRef]
- Pham, T.-L.; Utsumi, M. An overview of the accumulation of microcystins in aquatic ecosystems. J. Environ. Manag. 2018, 213, 520–529. [Google Scholar] [CrossRef]
- Sukharevich, V.I.; Polyak, Y.M. Global occurrence of Cyanobacteria: Causes and effects (Review). Inland. Water Biol. 2020, 13, 566–575. [Google Scholar] [CrossRef]
- DeMott, W.R.; Zhang, Q.X.; Carmichael, W.W. Effects of toxic cyanobacteria and purified toxins on the survival and feeding of a copepod and three species of Daphnia. Limnol. Oceanogr. 1991, 36, 1346–1357. [Google Scholar] [CrossRef]
- Chen, L.; Giesy, J.P.; Adamovsky, O.; Svirčev, Z.; Meriluoto, J.; Codd, G.A.; Mijovic, B.; Shi, T.; Tuo, X.; Li, S.-C.; et al. Challenges of using blooms of Microcystis spp. in animal feeds: A comprehensive review of nutritional, toxicological and microbial health evaluation. Sci. Total Environ. 2021, 764, 142319. [Google Scholar] [CrossRef]
- Kaplan, A.; Harel, M.; Kaplan-Levy, R.N.; Hadas, O.; Sukenik, A.; Dittmann, E. The languages spoken in the water body (or the biological role of cyanobacterial toxins). Front. Microbiol. 2012, 3, 138. [Google Scholar] [CrossRef] [PubMed]
- Babica, P.; Bláha, L.; Maršálek, B. Exploring the natural role of microcystins—A review of effects on photoautotrophic organisms. J. Phycol. 2006, 42, 9–20. [Google Scholar] [CrossRef]
- Sidelev, S. Influence of cyanobacterial toxins on growth of Scenedesmus acutus and Gloeocapsa sp. under laboratory conditions. Voda Khimiya i Ekologia 2013, 9, 60–65. (In Russian) [Google Scholar]
- Leão, P.N.; Vasconcelos, M.T.; Vasconcelos, V.M. Allelopathy in freshwater cyanobacteria. Crit. Rev. Microbiol. 2009, 35, 271–282. [Google Scholar] [CrossRef] [PubMed]
- Nezbrytska, I.; Usenko, O.; Konovets, I.; Leontieva, T.; Abramiuk, I.; Goncharova, M.; Bilous, O. Potential use of aquatic vascular plants to control cyanobacterial blooms: A review. Water 2022, 14, 1727. [Google Scholar] [CrossRef]
- Hilt, S.; Gross, E.M. Can allelopathically active submerged macrophytes stabilise clear-water states in shallow lakes? Basic. Appl. Ecol. 2008, 9, 422–432. [Google Scholar] [CrossRef]
- Blindow, I.; Hargeby, A.; Andersson, G. Seasonal changes of mechanisms maintaining clear water in a shallow lake with abundant Chara vegetation. Aquat. Bot. 2002, 72, 315–334. [Google Scholar] [CrossRef]
- Hu, H.; Hong, Y. Algal-bloom control by allelopathy of aquatic macrophytes—A review. Front. Environ. Sci. Eng. China 2008, 2, 421–438. [Google Scholar] [CrossRef]
- Macías, F.A.; Galindo, J.L.G.; García-Díaz, M.D.; Galindo, J.C.G. Allelopathic agents from aquatic ecosystems: Potential biopesticides models. Phytochem. Rev. 2008, 7, 155–178. [Google Scholar] [CrossRef]
- Kurashov, E.A.; Krylova, J.V.; Mitrukova, G.G.; Chernova, A.M. Low-molecular-weight metabolites of aquatic macrophytes growing on the territory of Russia and their role in hydroecosystems. Contemp. Prob Ecol. 2014, 7, 433–448. [Google Scholar] [CrossRef]
- Zhu, X.; Dao, G.; Tao, Y.; Zhan, X.; Hu, H. A review on control of harmful algal blooms by plant-derived allelochemicals. J. Hazard. Mater. 2021, 401, 123403. [Google Scholar] [CrossRef] [PubMed]
- Zhao, G.; Hong, Y.; Li, L.; Zhang, H.; Xu, R.; Hao, Y. Selection and characterization of plant-derived alkaloids with strong antialgal inhibition: Growth inhibition selectivity and inhibitory mechanism. Harmful Algae 2022, 117, 102272. [Google Scholar] [CrossRef]
- Wium-Andersen, S. Allelopathy among aquatic plants. Arch. Hydrobiol. 1987, 27, 167–172. [Google Scholar]
- Mohamed, Z.A. Macrophytes-cyanobacteria allelopathic interactions and their implications for water resources management—A review. Limnologica 2017, 63, 122–132. [Google Scholar] [CrossRef]
- Tan, K.; Huang, Z.; Ji, R.; Qiu, Y.; Wang, Z.; Liu, J. A review of allelopathy on microalgae. Microbiology 2019, 165, 587–592. [Google Scholar] [CrossRef]
- Korner, S.; Nicklisch, A. Allelopathic growth inhibition of selected phytoplankton species by submerged macrophytes. J. Phycol. 2002, 38, 862–871. [Google Scholar] [CrossRef]
- Gross, E.M.; Erhard, D.; Iványi, E. Allelopathic activity of Ceratophyllum demersum L. and Najas marina ssp. intermedia (Wolfgang) Casper. Hydrobiologia 2003, 506, 583–589. [Google Scholar] [CrossRef]
- Nakai, S.; Yoshihara, T.; Yamada, S.; Hosomi, M. The Allelochemicals Accounting for the Allelopathic Effects of Myriophyllum spicatum on the Cyanobacterium Microcystis aeruginosa. 2005. Available online: http://www.regional.org.au/au/allelopathy/2005/2/1/2244_nakais.htm#TopOfPage (accessed on 13 June 2023).
- Nakai, S.; Zou, G.; Okuda, T.; Nishijima, W.; Hosomi, M.; Okada, M. Polyphenols and fatty acids responsible for anti-cyanobacterial allelopathic effects of submerged macrophyte Myriophyllum spicatum. Water Sci. Technol. 2012, 66, 993–999. [Google Scholar] [CrossRef]
- Qiming, X.; Haidong, C.; Huixian, Z.; Daqiang, Y. Allelopathic activity of volatile substance from submerged macrophytes on Microcystin aeruginosa. Acta Ecol. Sin. 2006, 26, 3549–3554. [Google Scholar]
- Wang, L.X.; Zhang, L.; Zhang, Y.X.; Jin, C.Y.; Lu, C.M.; Wu, G.R. The inhibitory effect of Hydrilla verticillata culture water on Microcystic aeruginosa and its mechanism. J. Plant Physiol. Mol. Biol. 2006, 32, 672–678. [Google Scholar]
- Mulderij, G.; Mau, B.; van Donk, E.; Gross, E.M. Allelopathic activity of Stratiotes aloides on phytoplankton-towards identification of allelopathic substances. Hydrobiologia 2007, 584, 89–100. [Google Scholar] [CrossRef]
- Saraf, M.; Pandya, U.; Thakkar, A. Role of allelochemicals in plant growth promoting rhizobacteria for biocontrol of phytopathogens. Microbiol. Res. 2014, 169, 18–29. [Google Scholar] [CrossRef] [PubMed]
- Pakdel, F.M.; Sim, L.; Beardall, J.; Davis, J. Allelopathic inhibition of microalgae by the freshwater stonewort, Chara australis, and a submerged angiosperm, Potamogeton crispus. Aquat. Bot. 2013, 110, 24–30. [Google Scholar] [CrossRef]
- Bi, Y.L.; Wu, S.M.; Zhou, S.N.; Wu, S.H.; Xu, S.J. Allelopathic effects and allelochemicals of Myriophyllum elatinoides on Microcystis aeruginosa and Selenastrum capricornutum. Environ. Sci. 2019, 40, 2265–2270. [Google Scholar] [CrossRef]
- Wang, H.Q.; Zhang, L.Y. Allelopathic activity of ethyl acetate extracts from typical emergent plants against Microcystis aeruginosa Kütz. Bangladesh J. Bot. 2017, 46, 1025–1029. [Google Scholar]
- Tazart, Z.; Douma, M.; Caldeira, A.T.; Tebaa, L.; Mouhri, K.; Loudiki, M. Highlighting of the antialgal activity of organic extracts of Moroccan macrophytes: Potential use in cyanobacteria blooms control. Environ. Sci. Pollut. Res. 2020, 27, 19630–19637. [Google Scholar] [CrossRef] [PubMed]
- Kurashov, E.; Krylova, J.; Protopopova, E. The Use of allelochemicals of aquatic macrophytes to suppress the development of cyanobacterial “blooms”. In Plankton Communities; Pereira, L., Gonçalves, A.M., Eds.; IntechOpen: London, UK, 2021. [Google Scholar] [CrossRef]
- Wang, X.; Yu, L.; Liu, Y.; Jiang, X. Synthesis and fouling resistance of capsaicin derivatives containing amide groups. Sci. Tot. Environ. 2020, 710, 136361. [Google Scholar] [CrossRef] [PubMed]
- Cheng, F.; Cheng, Z.H. Research progress on the use of plant allelopathy in agriculture and the physiological and ecological mechanisms of allelopathy. Front. Plant Sci. 2015, 6, 16. [Google Scholar] [CrossRef]
- Nature-like and Convergent Technologies Driving the Fourth Industrial Revolution; United Nations Industrial Development Organization: Vienna, Austria, 2019; 79p, Available online: https://www.unido.org/sites/default/files/files/2020-01/Convergent_tech.pdf (accessed on 23 August 2023).
- Zhironkin, S.; Demchenko, S.; Kayachev, G.; Taran, E.; Zhironkina, O. Convergent and nature-like technologies as the basis for sustainable development in the 21st century. E3S Web Conf. 2019, 105, 03008. [Google Scholar] [CrossRef]
- Sinang, S.C.; Daud, N.; Kamaruddin, N.; Poh, K.B. Potential growth inhibition of freshwater algae by herbaceous plant extracts. Acta Ecol. Sin. 2019, 39, 229–233. [Google Scholar] [CrossRef]
- Burford, M.A.; Gobler, C.J.; Hamilton, D.P.; Visser, P.M.; Lurling, M.; Codd, G.A. Solutions for Managing Cyanobacterial Blooms: A Scientific Summary for Policy Makers; IOC/UNESCO: Paris, France, 2019; 17p. [Google Scholar]
- Kurashov, E.A.; Krylova, J.V.; Bataeva, Y.V.; Rusanov, A.G.; Sukhenko, L.T. Algicide for Suppressing the Development of Cyanobacteria and Green Algae Based on Metabolites-Allelochemicals of Aquatic Plants. Patent for Invention RU 2709308 C1, 17.12.2019. Application No. 2019104959, 21 February 2019. Available online: https://patents.s3.yandex.net/RU2709308C1_20191217.pdf (accessed on 13 June 2023).
- Kurashov, E.A.; Mitrukova, G.G.; Krylova, J.V. Interannual variability of low-molecular metabolite composition in Ceratophyllum demersum (Ceratophyllaceae) from a Floodplain lake with a changeable trophic status. Contemp. Prob Ecol. 2018, 11, 179–194. [Google Scholar] [CrossRef]
- Kurbatova, S.A.; Berezina, N.A.; Mavrin, A.S.; Otyukova, N.G. Metabolic Rate in hydrobionts of different ecological groups in an experiment. Inland. Water Biol. 2022, 15, 522–525. [Google Scholar] [CrossRef]
- Salmaso, N.; Tolotti, M. Other Phytoflagellates and Groups of Lesser Importance; Likens, G.E., Ed.; Encyclopedia of Inland Waters; Academic Press: Cambridge, MA, USA, 2009; pp. 174–183. [Google Scholar] [CrossRef]
- Gani, A.; Nilawati, J.; Rizal, A. Studi habitat dan kebiasaan makan (Food Habit) ikanronolindu (Oryzias sarasinorum Popta, 1905) di Danau Lindu, Sulawesi Tengah. J. Sains Dan Teknol. Tadulako 2015, 4, 9–18. [Google Scholar]
- Novalina, S.; Diana, A.; Sri, M.; Djoko, L.T.; Jaya, G.B.A. Food habits of the endemic rice fish (Oryzias nigrimas, Kottelat 1990) in Poso Lake, Central Sulawesi of Indonesia. Russ. J. Agric. Socio-Econ. Sci. 2019, 3, 125–130. [Google Scholar]
- Rinandha, A.; Andy Omar, S.; Tresnati, J.; Yanuarita, D. Food habits of Matano medaka, Oryzias matanensis (Aurich, 1935) at Lake Towuti, South Sulawesi, Indonesia. Plant Archives 2023, 20, 3262–3265. [Google Scholar]
- Cao, X.; Strojsová, A.; Znachor, P.; Zapomelová, E. Detection of extracellular phosphatases in natural spring phytoplankton of a shallow eutrophic lake (Donghu, China). European J. Phycol. 2005, 40, 251–258. [Google Scholar] [CrossRef]
- Salmaso, N.; Capelli, C.; Shams, S.; Cerasino, L. Expansion of bloom-forming Dolichospermum lemmermannii (Nostocales, Cyanobacteria) to the deep lakes south of the Alps: Colonization patterns, driving forces and implications for water use. Harmful Algae 2015, 50, 76–87. [Google Scholar] [CrossRef]
- Capelli, C.; Ballot, A.; Cerasino, L.; Papini, A.; Salmaso, N. Biogeography of bloom-forming microcystin producing and non-toxigenic populations of Dolichospermum lemmermannii (Cyanobacteria). Harmful Algae 2017, 67, 1–12. [Google Scholar] [CrossRef]
- Cerasino, L.; Capelli, C.; Salmaso, N. A comparative study of the metabolic profiles of common nuisance cyanobacteria in southern perialpine lakes. Adv. Oceanogr. Limnol. 2017, 8, 22–32. [Google Scholar] [CrossRef]
- WHO. Guidelines for Drinking-Water Quality. In Addendum to Volume 2: Health Criteria and Other Supporting Information; World Health Organization: Geneva, Switzerland, 1998. [Google Scholar]
- Xie, L.; Xie, P.; Guo, L.; Li, L.; Miyabara, Y.; Park, H.D. Organ distribution and bioaccumulation of microcystins in freshwater fish at different trophic levels from the eutrophic lake Chaohu, China. Environ. Toxicol. 2005, 20, 293–300. [Google Scholar] [CrossRef] [PubMed]
- Magalhães, V.F.; Marinho, M.M.; Domingos, P.; Oliveira, A.C.; Costa, S.M.; Azevedo, L.O.; Azevedo, S.M. Microcystins (cyanobacterial hepatotoxins) bioaccumulation in fish and crustaceans from Septiba Bay (Brasil, RJ). Toxicon 2003, 42, 289–295. [Google Scholar] [CrossRef] [PubMed]
- Mohamed, Z.A.; Carmichael, W.W.; Hussein, A.A. Estimation of microcystins in the freshwater fish Oreochromis niloticus in an Egyptian fish farm containing a Microcystis bloom. Environ. Toxicol. 2003, 18, 137–141. [Google Scholar] [CrossRef]
- Wood, S.A.; Briggs, L.R.; Sprosen, J.; Ruck, J.G.; Wear, R.G.; Holland, P.T.; Bloxham, M. Changes in concentration of microcystins in Rainbow trout, freshwater mussels, and cyanobacteria in Lakes Rotoiti and Rotoehu. Environ. Toxicol. 2006, 21, 205–222. [Google Scholar] [CrossRef]
- Colas, S.; Duval, C.; Marie, B. Toxicity, transfer and depuration of anatoxin-a (cyanobacterial neurotoxin) in medaka fish exposed by single-dose gavage. Aquat. Toxicol. 2020, 222, 105422. [Google Scholar] [CrossRef] [PubMed]
- Litvinchuk, L.F.; Sharov, A.N.; Chernova, E.N.; Smirnov, V.V.; Berezina, N.A. Mutual links between microcystins-producing cyanobacteria and plankton community in clear and brown northern lakes. Food Webs 2023, 35, e00279. [Google Scholar] [CrossRef]
- Jiang, X.; Yang, W.; Zhang, L.; Chen, L.; Niu, Y. Predation and cyanobacteria jointly facilitate competitive dominance of small-bodied cladocerans. J. Plankton Res. 2014, 36, 956–965. [Google Scholar] [CrossRef]
- Jiang, X.; Liang, H.; Chen, Y.; Xu, X.; Huang, D. Microgeographic adaptation to toxic cyanobacteria in two aquatic grazers. Limnol. Oceanogr. 2015, 60, 947–956. [Google Scholar] [CrossRef]
- Major, Y.; Kifle, D.; Niedrist, G.H.; Sommaruga, R. An isotopic analysis of the phytoplankton–zooplankton link in a highly eutrophic tropical reservoir dominated by cyanobacteria. J. Plankton Res. 2017, 39, 220–231. [Google Scholar] [CrossRef]
- Kâ, S.; Mendoza-Vera, J.M.; Bouvy, M.; Champalbert, G.; Gom-Kâ, R.N.; Pagano, M. Can tropical freshwater zooplankton graze efficiently on cyanobacteria? Hydrobiologia 2012, 679, 119–138. [Google Scholar] [CrossRef]
- Agasild, H.; Panksep, K.; Tõnno, I.; Blank, K.; Kõiv, T.; Freiberg, R.; Laugaste, R.; Jones, R.I.; Nõges, P.; Nõges, T. Role of potentially toxic cyanobacteria in crustacean zooplankton diet in a eutrophic lake. Harmful Algae 2019, 89, 101688. [Google Scholar] [CrossRef] [PubMed]
- Berezina, N.A.; Tiunov, A.V.; Tsurikov, S.M.; Kurbatova, S.A.; Korneva, L.G.; Makarova, O.S.; Bykova, S.N. Cyanobacteria as a food source for invertebrates: Results of a model experiment. Russ. J. Ecol. 2021, 52, 247–252. [Google Scholar] [CrossRef]
- Kurashov, E.; Kapustina, L.; Krylova, J.; Mitrukova, G. The use of fluorescence microscopy to assess the suppression of the development of cyanobacteria under the influence of allelochemicals of aquatic macrophytes. In Fluorescence Methods for Investigation of Living Cells and Microorganisms; Grigoryeva, N., Ed.; IntechOpen: London, UK, 2020; 28p. [Google Scholar] [CrossRef]
- Olenina, I.; Hajdu, S.; Edler, L.; Andersson, A.; Wasmund, N.; Busch, S.; Göbel, J.; Gromisz, S.; Huseby, S.; Huttunen, M.; et al. Biovolumes and size-classes of phytoplankton in the Baltic Sea. In Baltic Sea Environment Proceedings No.106; Helsinki Commission; Helsinki, Finland, 2006; p. 144. [Google Scholar]
- Chernova, E.; Russkikh, I.; Voyakina, E.; Zhakovskaya, Z. Occurrence of microcystins and anatoxin-a in eutrophic lakes of Saint Petersburg, northwestern Russia. Oceanol. Hydrobiol. Stud. 2016, 45, 466–484. [Google Scholar] [CrossRef]
- Sirenko, L.A.; Kureishevich, A.V. Determination of Chlorophyll Content in Plankton of Freshwater Reservoirs; Naukova Dumka: Kiev, Ukraine, 1982. (In Russian) [Google Scholar]
- PND F 14.1:2:4.167-2000; Methods for Measuring the Mass Concentrations of Cations of Ammonium, Potassium, Sodium, Lithium, Magnesium, Strontium, Barium, and Calcium in Samples of Drinking, Natural (Including Mineral) and Waste Water Using the Kapel’ Capillary Electrophoresis System. State Ecology Committee of Russia: Moscow, Russia, 2000; (In Russian). Available online: https://docs.cntd.ru/document/1200079417 (accessed on 23 August 2023).
- PND F 14.1:2:4.157-99; Methods for Measuring the Mass Concentrations of Chloride Ions, Nitrite Ions, Sulfate Ions, Nitrate Ions, Fluoride Ions and Phosphate Ions in Samples of Natural, Drinking and Treated Wastewater Using the Kapel’ Capillary Electrophoresis System. State Ecology Committee of Russia: Moscow, Russia, 1999; (In Russian). Available online: https://docs.cntd.ru/document/1200080615 (accessed on 23 August 2023).
- RD 52.24.493–2020; Mass Concentration of Hydrocarbons and Alkalinity of Natural Waters. Measurement Procedure by Titrimetric Method. State Ecology Committee of Russia: Rostov-on-Don, Russia, 2020; (In Russian). Available online: https://files.stroyinf.ru/Index2/1/4293720/4293720280.htm (accessed on 23 August 2023).
- PND F 14.1:2.206-04; Methods for Measuring the Mass Concentrations of the Total Nitrogen in Natural and Treated Wastewater by the Titrimetric Method. State Ecology Committee of Russia: Moscow, Russia, 2004; (In Russian). Available online: https://files.stroyinf.ru/Data2/1/4293832/4293832513.pdf (accessed on 23 August 2023).
- PND F 14.1:2.106-97; Methods for Measuring the Mass Concentration of Total Phosphorus in Samples of Natural and Treated Wastewater by the Photometric Method after Oxidation with Persulfate. State Ecology Committee of Russia: Moscow, Russia, 1997; (In Russian). Available online: https://files.stroyinf.ru/Data2/1/4293818/4293818402.pdf (accessed on 23 August 2023).
- PND F 14.1:2.101-97; Methods for Measuring the Content of Dissolved Oxygen in Samples of Natural and Treated Wastewater by the Iodometric Method. State Ecology Committee of Russia: Moscow, Russia, 1997; (In Russian). Available online: https://files.stroyinf.ru/Data2/1/4293745/4293745562.pdf (accessed on 23 August 2023).


| Treatment | ||||
|---|---|---|---|---|
| I | II | III | IV | |
| Phytoplankton, mg/L | 1.04 ± 0.42 | 0.93 ± 0.43 | 1.04 ± 0.41 | 0.84 ± 0.34 |
| Cyanobacteria, mg/L | 4.29 ± 0.21 | 4.25 ± 0.18 | 4.34 ± 0.23 | 4.69 ± 0.34 |
| Zooplankton, ind./L | 616 ± 113 | 613 ± 156 | 636 ± 139 | 659 ± 156 |
| Fish 1 | No | No | 15 | 15 |
| Algicide 2, mg/L | No | 14 | No | 14 |
| Date (Day) | I | II | III | IV |
|---|---|---|---|---|
| 19–26 July (7) | Aphanizomenon flos-aquae Microcystis aeruginosa Aulacoseira granulata | |||
| 29 July (10) | A. flos-aquae | A. flos-aquae Cryptomonas spp. | A. flos-aquae M. aeruginosa | M. aeruginosa Mougeotia sp. A. granulata |
| 2 August (14) | Cryptomonas spp. Dolichospermum spiralis A. flos-aquae | D. spiralis A. flos-aquae Cryptomonas spp. | D. spiralis A. flos-aquae M. aeruginosa | |
| 5 August (17) | A. flos-aquae Cryptomonas spp. D. spiralis | A. flos-aquae Cryptomonas spp. | A. flos-aquae Cryptomonas spp. D. spiralis | A. flos-aquae D. spiralis |
| 9 August (21) | A. flos-aquae | A. flos-aquae Cryptomonas ssp. | A. flos-aquae | A. flos-aquae M. aeruginosa D. spiralis |
| 12 August (24) | A. flos-aquae Cryptomonas spp. D. spiralis | Cryptomonas spp. | D. spiralis A. flos-aquae Staurastrum sp. | D. spiralis Mougeotia sp. Staurastrum sp. |
| 16 August (28) | A. flos-aquae Cryptomonas spp. D. spiralis | Cryptomonas ssp. Mougeotia sp. A. flos-aquae | D. spiralis A. flos-aquae Staurastrum sp. | D. spiralis A. flos-aquae Staurastrum sp. Mougeotia sp. |
| 19 August (31) | A. flos-aquae D. spiralis | Cryptomonas spp. Mougeotia sp. A. flos-aquae | D. spiralis | Mougeotia sp. Staurastrum sp. A. flos-aquae |
| Period | Value | Treatment | |||
|---|---|---|---|---|---|
| I | II | III | IV | ||
| Start | Mean 95%CI | 4.29 a 0.12 | 4.25 a 0.10 | 4.27 a 0.10 | 4.82 a 0.08 |
| Mid-exposure | Mean 95%CI | 6.31 b 1.24 | 6.09 b 0.85 | 3.44 a 0.66 | 2.75 a 0.15 |
| End | Mean 95% CI | 4.10 c 1.36 | 0.60 a 0.17 | 2.78 b 1.39 | 0.83 a 0.20 |
| MC Forms | Period of Exposure | |||||||||||
|---|---|---|---|---|---|---|---|---|---|---|---|---|
| Start | Mid-Exposure | End | ||||||||||
| I | II | III | IV | I | II | III | IV | I | II | III | IV | |
| Mean concentration, µg/L 95% CI | 9.34 a 0.72 | 9.76 a 0.34 | 12.30 a 1.90 | 12.38 a 1.62 | 4.75 b 0.35 | 1.28 a 0.17 | 8.50 c 1.25 | 5.43 b 0.71 | 2.31 b 0.34 | 0.51 a 0.12 | 7.08 c 0.67 | 6.04 c 0.21 |
| % MC-LR | 68.6 | 69.1 | 76.2 | 75.6 | 5.9 | 31.3 | 27.4 | 37.6 | 5.3 | 28.3 | 9.7 | 20.7 |
| % [D-Asp3]MC-LR | 3.6 | 3.5 | 3.3 | 3.5 | 6.7 | 7.2 | 5.1 | 6.7 | 9.6 | 7.3 | 6.4 | 8.1 |
| % [D-Glu-OCH36]MC-LR | 1.0 | - | 1.1 | 1.2 | - | - | 0.3 | 0.4 | - | - | - | - |
| % MC-YR | 20.5 | 20.4 | 13.3 | 13.0 | 76.6 | 51.3 | 61.5 | 48.3 | 76.0 | 48.8 | 80.5 | 66.7 |
| % [Dha7]MC-YR | 5.7 | 5.9 | 5.0 | 5.6 | 10.9 | 10.0 | 5.5 | 6.8 | 9.0 | 12.8 | 3.4 | 4.3 |
| % MC-LW | 0.2 | 0.2 | 0.3 | 0.3 | - | 0.1 | 0.2 | 0.2 | - | - | - | - |
| % [D-Asp3]MC-RR | 0.1 | - | 0.1 | 0.1 | - | - | - | - | - | - | - | - |
| Variables | I | II | III | IV |
|---|---|---|---|---|
| Na+ | 3.15 (2.43–3.84) | 3.26 (2.43–3.86) | 3.23 (2.33–3.82) | 3.16 (2.23–3.80) |
| K+ | 2.97 (2.33–3.48) | 3.00 (2.31–3.44) | 3.01 (2.30–3.47) | 3.07 (2.40–3.60) |
| Ca2+ | 23.65 (17.63–30.98) | 24.46 (16.97–31.11) | 22.89 (15.61–30.78) | 25.25 (16.29–32.01) |
| Mg2+ | 6.63 (4.85–8.29) | 6.80 (4.76–8.35) | 6.67 (4.42–8.30) | 6.70 (4.33–8.23) |
| Cl− | 3.49 (2.67–4.06) | 3.48 (2.45–4.22) | 3.36 (2.51–3.99) | 3.35 (2.44–3.93) |
| SO42− | 3.61 (1.64–4.84) | 3.71 (1.71–5.24) | 3.51 (1.31–4.67) | 3.61 (1.93–4.61) |
| HCO3− | 107.57 (80.55–138.72) | 111.36 (78.31–139.53) | 106.07 (72.20–133.02) | 113.86 (75.78–142.79) |
| PO43− | 0.03 (0.01–0.08) | 0.02 (0.01–0.05) | 0.02 (0.01–0.03) | 0.02 (0.01–0.03) |
| Ptot | 0.05 (0.03–0.10) | 0.05 (0.03–0.07) | 0.07 (0.05–0.09) | 0.07 (0.04–0.08) |
| Ntot | 1.07 (0.96–1.16) | 0.95 (0.91–0.98) | 1.25 (1.17–1.36) | 1.20 (1.09–1.43) |
| O2 | 8.63 (6.55–9.88) | 8.20 (6.76–9.26) | 8.34 (6.65–9.36) | 7.63 (6.45–9.05) |
| pH | 9.1 (8.8–9.3) | 9.1 (8.7–9.4) | 9.2 (8.8–9.4) | 8.9 (8.6–9.3) |
Disclaimer/Publisher’s Note: The statements, opinions and data contained in all publications are solely those of the individual author(s) and contributor(s) and not of MDPI and/or the editor(s). MDPI and/or the editor(s) disclaim responsibility for any injury to people or property resulting from any ideas, methods, instructions or products referred to in the content. |
© 2023 by the authors. Licensee MDPI, Basel, Switzerland. This article is an open access article distributed under the terms and conditions of the Creative Commons Attribution (CC BY) license (https://creativecommons.org/licenses/by/4.0/).
Share and Cite
Kurbatova, S.; Berezina, N.; Sharov, A.; Chernova, E.; Kurashov, E.; Krylova, Y.; Yershov, I.; Mavrin, A.; Otyukova, N.; Borisovskaya, E.; et al. Effects of Algicidal Macrophyte Metabolites on Cyanobacteria, Microcystins, Other Plankton, and Fish in Microcosms. Toxins 2023, 15, 529. https://doi.org/10.3390/toxins15090529
Kurbatova S, Berezina N, Sharov A, Chernova E, Kurashov E, Krylova Y, Yershov I, Mavrin A, Otyukova N, Borisovskaya E, et al. Effects of Algicidal Macrophyte Metabolites on Cyanobacteria, Microcystins, Other Plankton, and Fish in Microcosms. Toxins. 2023; 15(9):529. https://doi.org/10.3390/toxins15090529
Chicago/Turabian StyleKurbatova, Svetlana, Nadezhda Berezina, Andrey Sharov, Ekaterina Chernova, Evgeny Kurashov, Yulia Krylova, Igor Yershov, Alexander Mavrin, Natalia Otyukova, Elena Borisovskaya, and et al. 2023. "Effects of Algicidal Macrophyte Metabolites on Cyanobacteria, Microcystins, Other Plankton, and Fish in Microcosms" Toxins 15, no. 9: 529. https://doi.org/10.3390/toxins15090529