1. Introduction
Emulsion-based microfluidics has various important applications in chemistry and biology, ranging from drug discovery to biomolecule synthesis [
1,
2,
3,
4]. Emulsions are droplets of one fluid that are dispersed in another fluid, usually oil-in-water or water-in-oil. They provide the advantage of using very small volumes of reagents and samples, which enable different biological and chemical processes to be both fast and inexpensive.
Droplet microfluidics has recently emerged as a powerful technology for single-cell manipulation [
5,
6,
7,
8]. Aqueous droplets in oil provide small isolated volumes, engineered environments, controllable vessels, and reduced shear stress levels on the encapsulated cells. The potential of droplet microfluidics has also been recently demonstrated for the label-free detection of rare cells based on their biomechanical properties [
9]. Different techniques have been used to identify or sort cells within a heterogeneous sample. Affinity-labeled techniques commonly use antibodies against the cell surface protein and have the advantage of high specificity and multiplexing capability [
10,
11], while label-free techniques are based on the detection of physical properties such as cell size, deformability, compressibility, shape, density, surface properties, electrical polarizability, magnetic susceptibility, and refractive index [
12,
13,
14]. Label-free cell identification techniques have the advantages of high sorting throughput, requiring no immunostaining, antibody labeling, or expensive chemical reagents [
15]. Microfluidics label-free cell sorting mechanisms can include microfilters [
16], pinched flow fractionation (PFF) [
17], deterministic lateral displacement (DLD) [
18], inertial sorting [
19], hydrodynamic filtration [
20], magnetophoresis [
21], dielectrophoresis [
22], and acoustophoresis [
23].
Emulsion biomechanics is another label-free biomechanics technique for cell detection, where single cells are encapsulated inside water-in-oil emulsions and studied under various microfluidic conditions [
9]. Emulsion biomechanics techniques can include (1) direct deformation and (2) accelerating flow. In direct deformation, droplets are compressed into an ellipsoidal shape and then allowed to relax back to spherical. Upon relaxation, a flow field results inside the droplet causing the encapsulated cell to respond mechanically through measurable deformation. In accelerating flow, the flow field of a microfluidic channel is coupled to the internal flow field of the droplet through viscous traction at the interface resulting in a rotational flow field inside the droplet. An encapsulated single cell being subjected to this flow field responds by undergoing multiple orbits, spins, and deformations that depend on its physical properties. The rotational flow field (vortex) inside the droplet is the result of the coupling between the external flow field—outside the droplet—and the internal flow field—inside the droplet. The flow fields are very complex and depend on several factors, including the viscosity
of the dispersed and continuous phases and the capillary number. In addition, the position and number of vortices inside a droplet depends on the size and the shape of the droplet, as well as the interfacial tension.
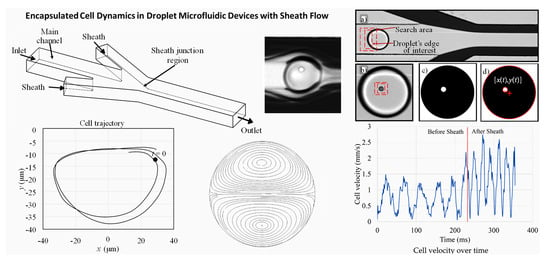
In this paper, we study the dynamics of single cells encapsulated in water-in-oil emulsions in a microchannel. Monitoring the cell dynamics, using a high-speed camera, can lead to the development of new label-free methods for the detection of rare cells, based on their biomechanical properties. A sheath flow microchannel is proposed to strengthen the rotational flow field inside droplets flowing in Poiseuille flow conditions. A numerical model is developed to investigate the effect of various parameters, including the sheath flow rate, on the rotational flow field inside a droplet. The effect of the sheath flow rate on the cell dynamics was demonstrated experimentally.
2. Rotational Flow Field Inside a Droplet
Emulsions are considered as controlled microenvironments, where the physical and chemical parameters of this environment control the behavior of the encapsulated cells. They are usually generated using T-junction, cross-junctions, or co-flow microchannels [
24,
25]. To maintain the stabilization of the droplets, chemical agents called surfactants are used. The fluidic conditions inside the droplet differ from outside in two main aspects: (1) the existence of a rotational flow field (vortex) inside the droplet and (2) the pressure difference between the inside of the droplet and the outside fluid (
) is positive [
26].
can be expressed using the following Young–Laplace equation:
where
is the radius of the spherical droplet, and
is the interfacial tension between the droplet (dispersed phase) and the surrounding fluid (continuous phase). The surfactant type affects
, thus also affecting the shape and size of the droplet, in addition to the pressure inside.
When a droplet is disturbed from its stationary position, a rotational flow field emerges inside the droplet, which causes encapsulated cells to spin. Without this perturbation, no flow field will form inside the droplet and the encapsulated cell will remain stationary. Means to perturb a droplet from its stationary position include forcing the droplet to vertically drop or rise inside a microchannel, where both the density difference between the continuous and dispersed phases and the viscous stresses along the interfacial surface of the droplet will cause external and internal flow fields to emerge [
27]. Electrowetting has been used to disturb droplets by using electric fields that introduce electrical forces that act as body forces onto the droplets, controlling the flow field inside [
28]. The presence of the interfacial tension gradient causes the Marangoni effect, where a flow gradient forms along the surface, hence, causing a rotational flow field [
29]. The interfacial tension gradient can result from a temperature gradient along the surface of the droplet or from the presence of a surfactant [
30]. This effect usually interferes with other rotational flow fields, resulting from viscous stresses inside the droplet, complicating the flow field and making it hard to model.
Another source of droplet disturbance is the application of an external flow field, which causes the droplets to deform, generating strong rotational flow fields inside. The field is a result of the viscous traction forces generated during the relaxation of the droplet, which depends on the capillary number
, as was first introduced by Taylor [
31]. The capillary number
represents the ratio between the viscous forces and the interfacial tension of the droplet, represented as:
where
is the viscosity of the external fluid,
is the shear rate of the external flow field,
is the radius of the spherical droplet, and
is the interfacial tension of the fluid–fluid interface.
While the viscous forces of the external fluid work on deforming the droplet, the interfacial tension acts as a spring that opposes this deformation such as to restore the droplet back to its original shape. Droplets with low values indicate that the interfacial tension is the most dominant parameter; hence, the droplet becomes more resistant to deformation. Consequently, the rotational flow field inside the droplet becomes weaker. On the other hand, droplets with high values tend to deform under the effect of external flow fields, thus, stronger internal flow fields are generated.
2.1. Analytical Model of the Droplet Flow Field
Analytical expressions of internal and external flow fields are driven under very restrictive assumptions, which include that: (a) droplets are small, (b) droplets remain spherical during the flow, (c) there is a condition of no-slip at the droplet interface, and (d) the tangential stress across the interface is continuous [
31,
32]. The extensional flow and the simple shear flow can be expressed in the spherical coordinates (
r,
) along a streamline
k inside a droplet of radius
as:
where
is the ratio between the dispersed phase and the continuous phase viscosities.
2.2. Numerical Model of the Droplet Flow Field
Taylor and other researchers worked on experimentally verifying their analytical models. However, doing so was difficult due to the complex effect of the surfactants. Taylor proposed a device called the four-roll mill that was capable of inducing extensional as well as simple shear flow [
31,
32,
33]. This device was unstable, as it was difficult to maintain the droplet at the center of the apparatus. Similarly, Lee et al. introduced a microfluidic chip that consists of four inlets and outlets [
34]. The fluid flow rate inside each channel determined the type of the external flow field applied to the centered droplet. As a result of its symmetric design, it was possible to obtain a pure rotational external flow field.
The numerical model in this paper is developed based on Taylor’s concept to further investigate the effect of various parameters on the rotational flow field inside a water-in-oil emulsion droplet. In contrast to single-phase flow problems, the modeling of multi-phase flow problems is complex due to the need to solve a time-dependent problem. Furthermore, modeling multi-phase flow requires the tracking of the fluid–fluid interface, which deforms over time or, more complexly, breaks up. The complexity of the boundary conditions and the interfacial tension gradient, which causes the Marangoni effect, also increases the overall complexity of the model.
3. Modeling
The model was constructed as in [
33,
34], where the droplets are kept stagnant while being introduced to a Poiseuille flow. Our approach to solving this multi-phase model begins by solving Navier–Stokes momentum equations to get the pressure and velocity fields. These fields are then applied to the interface as boundary conditions in the form of shear stresses. The fluid–fluid interface is tracked while deforming over time due to the applied shear stresses. Finally, the distribution of phase in each fluid is evaluated and the process is repeated until convergence is achieved, as in [
35,
36]. The effect of the generated droplet flow fields on the dynamics of a cell suspended inside of the droplet is investigated. It is worth mentioning that the Reynolds numbers for the multiple phases are low; thus, laminar flow models are used.
3.1. Model Definitions
A continuous-phase fluid of viscosity
enters a channel of width
W and length
L with a flow rate
, as illustrated in
Figure 1. In this model, the water-in-oil emulsion droplet of diameter
and viscosity
is kept stagnant by means of the body force
; hence, the droplet velocity is kept at zero. The difference between the continuous phase velocity and the droplet velocity generates viscous forces on the droplet. These viscous forces, coupled with the interfacial tension of the fluid–fluid interface
, generate the rotational flow field. The droplet encapsulates a suspended cell, which is modeled as a fluid droplet of diameter
and viscosity
, as shown in
Figure 1.
Computational Fluid Dynamics (CFD) simulations were performed numerically by solving the following non-slip, incompressible flow Navier–Stokes equations using a finite element package (COMSOL Multiphysics
®, Stockholm, Sweden):
where
is the density of the droplet (kg/m
),
is the droplet velocity field (m/s),
t is the time (s),
is the pressure field on droplet (Pa),
is the viscosity of the droplet (Pa·s),
g is the gravitational acceleration (m/s
),
is the surface force resulting from the interfacial tension (N), and
is the body force acting on the droplet (N).
Simulation of cell movement inside the droplet is performed numerically by solving the following Newtonian equation of motion for the cell:
where
is the mass of the cell (kg), and
is the velocity of the cell (m/s). The drag force (
) acting on the cell (N) is represented by:
where
is the viscosity of the cell (Pa·s),
is the density of the cell (kg/m
),
is cell diameter (m),
is the velocity field of the droplet obtained from solving (
5) and (
6), and
is the drag coefficient, represented by:
where
is the Reynolds number of the cell:
3.2. Numerical Simulations: Flow Field
The governing equations were solved for the case where the cell diameter
µm, cell viscosity
mPa·s, droplet diameter
µm, droplet viscosity
mPa·s, flow rate
µL/min, and the fluid viscosity
mPa·s. The shear modulus of the membrane of the cell
was set to 1 mN/m. The interfacial tension
mN/m is a typical value for water-in-oil emulsions [
9]. The body force per cell volume acting on the droplet was determined by trial and error as 3.25 nN/m
(i.e.,
Volume). The dimensions of the channel were 150 × 150 × 50 µm for the length (
L), width (
W), and thickness (
T), respectively.
The equations were solved using PARDISO time dependent solver with nested dissection multithreaded preordering algorithm. We used Quad elements to create the mesh of the external fluid with a maximum element size of 6.75 µm. The droplet was meshed using triangular elements with a maximum element size of 0.5 µm. The complete mesh consisted of 6628 domain elements and 408 boundary elements. Channel walls had no-slip boundary conditions. The inlet of the external fluid had an entrance length of 1200 µm to ensure that the flow is fully developed. More details about the numerical model are available as
Supplementary Material.
CFD simulations resulted in a
mm/s velocity difference between the droplet and the external fluid, as depicted in
Figure 2, which also shows the continuous phase fluid streamlines flow around the droplet. This disturbance causes the generation of a viscous force that opposes the interfacial tension to generate a rotational flow field inside the droplet. The velocity field streamlines in
Figure 2 indicate that the two vortices inside the droplet are symmetrical. Furthermore, there are two stagnant points, which can be observed at the coordinates (0, 15) and (0, −15).
3.3. Numerical Simulations: Cell Dynamics
CFD simulations resulted in the cell trajectory presented in
Figure 3a, at three different flow rates:
0.5, 1, and 2 µL/min. Body forces
1.625, 3.25, and 6.5 nN/m
were required to hold the droplet in place. As a result, the velocity difference between the droplet and the surrounding fluid were calculated as 2.25, 4.5, and 9 mm/s, respectively.
The initial cell position was arbitrarily selected at the position (, ). The cell continued to move repeatedly in an elliptical orbit, while also spinning around its center. It is worth mentioning that the streamline at which the cell orbits depends on the cell’s initial position. If the cell initial position was at the stagnation point, it will continue to spin around its center while maintaining its position relative to the droplet.
Figure 3a also shows that the flow rate
had a negligible effect on the cell trajectory, which means that increasing the flow rate does not affect the shape of the streamlines inside the droplet. On the other hand,
seems to have a highly significant effect on the cell velocity. As depicted in
Figure 3b, cells had average velocities of 293, 503, 905 µm/s at the flow rates
0.5, 1, 2 µL/min, respectively. There was an almost linear relation between the increase in the flow rate and the increase in average cell velocity. With the droplet held stationary, the increase in the velocity of the continuous phase was translated into an increase in the relative velocity between the dispersed and continuous phases. This increased the strength of the rotational flow field inside the droplet, which in turn increased the velocity of the encapsulated cell.
Figure 3c plots the translational velocity (
) of the encapsulated cell with time, which fluctuates with the changing cell position in the elliptical orbit. It shows that the velocity of the cell is higher when it is orbiting farther from the droplet center than nearer.
Figure 3c also shows that increasing
leads to an increase in both the cell orbiting frequency and the velocity amplitude. This result is very important as it will later be discussed how strong rotational flow fields can be used to collect more cell-biomechanics information in less time compared to at weaker flow fields.
4. Sheath Flow for Increased Encapsulated Cell Velocity
Sheath flow microchannels were proposed to strengthen the rotational flow field inside droplets flowing in Poiseuille flow conditions.
Figure 4 shows a schematic of the rotational flow-inducing sheath-flow channels. Two sheath flow microchannels, (A) and (B), were designed, inclined at 18
and 30
angles to the horizontal main channel (C). The widths of the main and sheath channels are selected as 200 µm, and 100 µm, respectively. A 125 µm horizontal offset was created between the two sheath channels. The asymmetry of the sheath channels (A) and (B), in addition to the horizontal offset, generate a moment on the flowing droplet. In turn, this moment strengthens the rotational flow field inside the droplet. Furthermore, the vertical components of the sheath flow from both (A) and (B) work on deforming the droplet as it passes through the sheath junction region shown in
Figure 4a.
After passing the sheath region, a strong rotational flow field is generated inside this droplet, caused by the viscous traction forces that occur during the relaxation of the droplet, which depends on the droplet’s capillary number . The sheath flow rate should be selected within a reasonable range so that the deformation of the droplet does not affect the encapsulated cell viability.
4.1. Numerical Simulations
Computational Fluid Dynamics (CFD) simulations were conducted to numerically study the parameters that affect the rotational flow field inside a droplet that flows in a sheath flow microchannel. The studied parameters include the core flow rate
, the sheath flow rate
, the generated droplet diameter
, the cell diameter
, the continuous phase viscosity
, and the droplet viscosity
. The percent increase in the velocity of the encapsulated cell after passing through the sheath region
was selected as the parameter that represents the effect of the sheath region on the flow field inside the droplet:
where
is the average velocity of the cell before introduction to sheath flow, while
is the average velocity of the cell after introduction to sheath flow. The sheath flow rate in both sheath channels
(µL/min) is assumed to be equal, as shown in
Figure 4b.
The CFD simulations of the droplet movement were performed by solving the non-slip, incompressible flow Navier–Stokes Equations (
5) and (
6). Simulation of cell movement inside the droplet was performed numerically as described in
Section 3.3. The simulations were conducted to screen all parameters and determine the ones that had the most significant effect on the percent increase in cell velocity
, which also represents the increase in the rotational flow field. Each parameter had its value varied between a lower and a higher value, as presented in
Table 1.
was selected between 0.5 and 2 µL/min. Higher sheath flow rates are not permissible as they may affect the viability of the cells.
was varied between 70 and 190 µm. It worth mentioning that
is not directly controlled but depends on the flow rates at the emulsification junction [
37].
was varied between 7 µm, a typical value of RBCs, and 25 µm, which corresponds to larger WBCs.
was varied between 50 mPa·s as in light mineral oil and 200 mPa·s as in heavier mineral oils. The interfacial tension
was kept at 5 mN/m.
was varied between 1 mPa·s as in phosphate-buffered saline (PBS) and 5 mPa·s as in typical cell growth medium. Finally, the cell viscosity
was kept constant at 450 mPa·s as in circulating tumor cells [
9].
The equations were solved using the PARDISO time-dependent solver with nested dissection multithreaded preordering algorithm. We used triangular elements to create the mesh of the external fluid and the droplet with maximum element size of 15 µm, and 1 µm, respectively. The complete mesh consisted of 14,553 domain elements and 797 boundary elements. Channel walls had no-slip boundary condition. The inlet of the external fluid had an entrance length of 4200 µm to ensure that the flow is fully developed.
4.2. Numerical Simulation Results
Figure 5a–f plot the individual effect of each parameter on the rotational flow field due to passing through the sheath flow region, represented by the increase in the rotational flow field
(see Equation (
11)). The figure reveals that
,
, and
have the largest slopes, hence the greatest effects on
.
Figure 5a indicates that as
increased from 70 µm to 190 µm,
increased from 25% to 80%. That is due to the increase of the viscous stress effect on the droplet with the increase of
.
Figure 5b,c show a significant increase in
with the increase in
and
. An increase in
and
causes the viscous forces acting on the droplet to also increase, which leads to an increase in the viscous stresses, thus an increase in both the rotational flow field inside the droplet and
.
Figure 5d–f show the effect of some less significant parameters on the flow field of the droplet. As depicted in
Figure 5d,
decreased from 61% to 38% as
increased from 1 mPa·s to 5 mPa·s, in an inverse correlation. This correlation can be explained by the fact that the droplet fluid acts as a viscous damper for the encapsulated cell. As
increases, the droplet damping coefficient increases, leading to the decrease in the velocity of the cell.
Figure 5e,f show that the correlation lines are nearly horizontal, indicating that the effects of
, and
on the rotational flow field are almost negligible, and also indicate that the sheath flow microchannel can achieve an acceptable velocity increase regardless of the size of the encapsulated cell.
Figure 5g is a Pareto chart that presents the effects of all seven parameters on the flow field. The bars’ lengths resemble the standardized effects, also known as the
T-
. For a linear relationship, the
T-
is calculated by the following formula [
38]:
where
and
are the means of the response,
, at the factor’s higher and lower values, respectively,
is the standard deviation of the response, and
n is the number of readings.
Figure 5g confirms that
has the biggest effect, followed by the continuous phase fluid viscosity
and sheath flow rate
. The vertical dashed line in
Figure 5g represents the significance threshold at a 90% confidence level. The value of this threshold is calculated based on Pseudo-standard error (PSE) using Minitab statistical analysis software (Minitab Inc., State College, PA, USA). According to the threshold,
,
, and
are confirmed as statistically insignificant parameters due to their negligible effect on the viscous stresses or the interfacial tension of the emulsion. Only
and
have direct effects on the viscous stresses.
5. Experimental Cell Dynamics in Emulsions
Here, experiments were performed to investigate the dynamics of an encapsulated cell inside a water-in-oil emulsion, which reflects the rotational flow field inside the droplet. Furthermore, the effects of the sheath flow microchannels, the droplet diameter , and the core fluid flow rate on the cell dynamics are also investigated.
5.1. Experimental Setup
Figure 6a shows the microfluidic chip design drawn to scale. The chip has six ports: one sample inlet port (1), two core oil inlet ports (2), two sheath oil inlet ports (3 & 3’), and one outlet port (4). Each inlet port contains a set of microposts that filter the fluids before entering the channel (see
Figure 6b). This helps prevent unwanted particles from clogging the channels.
Cell growth medium, with suspended cells, is used as the dispersed phase and is flown into the chip through the inlet port (1). At the emulsification region (A), the medium meets the emulsification oil, used as the continuous phase, supplied through the inlet ports (2). In region (A), droplets of cell growth medium are generated inside the emulsifying oil fluid, as depicted in
Figure 6c.
The shape and size of the cross junction, surfactant concentration, in addition to the flow rates of the continuous and dispersed phases, determine the size of the generated droplet [
37,
39]. Here, all cross-junction channels are 200 µm wide and 60 µm deep. After the droplets are generated, they are flown towards the sheath flow stage (B), which consists of two sheath flow microchannels (3) and (3’), inclined at 18
and 30
to the horizontal main channel, as shown in
Figure 4b. There is a 125 µm horizontal offset between channels (3) and (3’). The widths of the main and sheath channels are 200 µm and 100 µm, respectively. The microfluidic circuit is 60 µm deep.
Dual-syringe pumps (Pump 11 Pico Plus Elite, Harvard Apparatus, Cambridge, MA, USA) were used to supply the input fluids to the microfluidic device inlet ports through 22-gauge steel pins and Tygon tubing (Instech Laboratories, Plymouth Meeting, PA, USA). Mineral oil (Sigma-Aldrich, St. Louis, MO, USA) was used as the continuous phase. Span80 surfactant (Sigma-Aldrich, St. Louis, MO, USA) was used at a 0.75% [wt/wt] percentage to stabilize the droplets, prevent coalescing, and reduce surface tension. For the sheath flow, we used a mineral oil-based ferrofluid that was prepared as described by [
40]. Ferrofluid was selected such that the contrast between the sheath and the dispersed phase is visible during the imaging of droplets. The image capture system included a high-speed sCMOS camera (Andor
TM Zyla 4.2, South Windsor, CT, USA), connected to an inverted fluorescent microscope (Eclipse Ti-E, Nikon, Tokyo, Japan) with a 10× objective lens (CFI ACHRO ADL 10× NA .25 WD 5.2 mm Ph1, Nikon, Tokyo, Japan).
5.2. Chip Fabrication
The chips were fabricated from Polydimethylsiloxane (PDMS) using soft lithography techniques [
41]. The master mold was made on a silicon wafer using SU-8 photoresist (MicroChem, Newton, MA, USA) by standard photolithography techniques. After the preparation of the master mold, uncured Sylgard 184 PDMS and curing agent (Dow Corning, Midland, MI, USA), mixed at a 10:1 ratio, were applied to the mold. The mixture was then cured by baking in an oven at 60
C for 2 hours. The cured PDMS was then peeled from the PDMS, where the port holes were punched. The chips were cut and bonded to cover-slip glass using air-plasma activation in a plasma cleaner (Harrick Plasma PDS-32G, Ithaca, NY, USA).
5.3. Cell Preparation
We used the MCF-10A cell line (CRL-10317, ATCC, Manassas, VA, USA), which is a non-tumorigenic epithelial cell line. The cell line was cultured in DMEM/F12 cell culture medium (Dulbecco’s Modified Eagle Medium: Nutrient Mixture F-12), supplemented with 10% Fetal Bovine Serum (FBS) and 1% penicillin-streptomycin (Invitrogen, Grand Island, NY, USA). Cells were kept in a 5% CO incubator (VWR, Radnor, PA, USA) at 37. For the experiments, cells were centrifuged twice for 5 min at 800 rpm and suspended in PBS (Phosphate-Buffered Saline) with 0.1% Pluronic F68 (BASF, Florham Park, NJ, USA), and 10% Ficoll PM400 (Sigma Aldrich, St. Louis, MO, USA) at concentrations between and cells/mL. Pluronic F68 was added to prevent biofouling, while Ficoll was added to increase the buoyancy of the cell suspension.
5.4. Experiments
Experiments were conducted at core flow rates , varied between 0.35 µL/min and 4.9 µL/min, and droplets of diameters that ranged from 70 µm to 197 µm. The sheath flow rate was kept constant at 1 µL/min for all experiments. MCF-10A cell lines have cell diameters ranging between 14 and 18 µm. The MCF-10A cell line is naturally fluorescent; thus, image sequences of MCF-10A were performed using fluorescence microscopy, in addition to dim bright field illumination. The frame rates of the imaged sequences ranged between 278 and 933 fps.
Raw image sequence data were recorded for all experimental runs using the high-speed camera. These data was then processed and features were extracted to calculate the cell displacement and velocity using the following procedure: (1) Droplets and encapsulated cells were detected and tracked using a contour tracking algorithm to identify and track the droplet’s edge within the defined search region in a frame by frame basis (see
Figure 7a). (2) A similar contour tracking algorithm was used for the identification and tracking of the cells (see
Figure 7b). (3) The resulting image sequences were black droplets containing white-colored cells, whose centroids were tracked using the MATLAB circular Hough transform algorithm (MathWorks
®, Natick, MA, USA) [
42] (see
Figure 7c,d). The position of cell centroids with respect to droplet center was then calculated to obtain the position of the cell. (4) The cell position data were numerically differentiated to obtain the cell velocity.
5.5. Results
As discussed in
Section 2, viscous stresses acting on a droplet generate a rotational flow field inside the droplet, causing an encapsulated cell to rotate in an elliptical orbit. This behavior was confirmed experimentally, as shown in
Figure 8a, which shows the cell’s movement over time. The cell depicted in
Figure 8a is an MCF-10A cell encapsulated by a droplet of diameter
= 95 µm, at core flow rate
= 1.9 µL/min and sheath flow rate
= 1 µL/min. The capture frame rate was 406.9 fps.
Figure 8b shows how the cell spins in an elliptical orbit.
5.5.1. Cell Dynamics in Sheath Flow
The sheath flow microchannel was used to increase the rotational flow field strength inside the droplet, hence increasing the translational velocity of the encapsulated cell.
Figure 9 shows the
x-direction movement of an MCF-10A cell encapsulated inside a droplet of
= 74 µm diameter, at a core fluid flow rate
2.05 µL/min, while keeping the sheath flow rate
at 1 µL/min. The capture frame rate was 933 fps. The time rate of change in cell’s
x-position corresponds to the cell’s speed of rotation
(rev/s).
Figure 9a shows how
increased after the droplet was subjected to the sheath flow (at
t = 230 ms). The speed of rotation
increased from 22 rev/s to 40 rev/s with an 85% increase. The change in the cell translational velocity is also presented in
Figure 9b, where the average velocity of the cell increased from approximately 0.74 mm/s to 1.42 mm/s after the droplet was subjected to sheath flow (at
t = 230 ms). This corresponds to a 90% increase in the average cell velocity (i.e.,
).
The effect of parameters, including the droplet diameter
and the core fluid flow rate
on the increase in cell velocity (
) were also investigated.
Figure 10a shows that the increase in
led to a small reduction in
. Similarly,
Figure 10b shows that
had a limited effect on
. For all performed experiments, the velocity increase (
) when using a sheath flow rate (
) of 1
L/min was approximately 100%.
5.5.2. Cell Dynamics—After Sheath
The effect of parameters, including the droplet diameter
and the core fluid flow rate
on the cell speed of rotation (
) after a sheath flow rate
L/min, was investigated.
Figure 11 reveals that
decreased as the droplet diameter increased. On the other hand, an increase in the core fluid flow rate
led to an increase in
. Thus, to achieve a high cell rotation speed
,
should be maximized, while keeping the dispersed-to-continuous flow rate ratio (
) small, which results in larger droplets [
37].
6. Discussion and Conclusions
This paper studies the rotational flow fields inside water-in-oil emulsions flowing in Poiseuille flow conditions and how they affect the dynamics of encapsulated single cells. Numerical simulations were performed, which showed a velocity difference between the droplet and the external fluid. This disturbance causes the generation of a viscous force that opposes the interfacial tension, resulting in a rotational flow field inside the droplet. Simulation results showed that encapsulated cells spun in elliptical orbits, as was also confirmed experimentally. Results also revealed that the streamline along which a cell orbits depends on its initial position inside the droplet.
Tracking the cell dynamics, using a high-speed camera, can lead to the development of new label-free methods for the detection of rare cells based on their biomechanical properties. An encapsulated single cell being subjected to the droplet’s rotational flow fields responds by undergoing multiple orbits, spins, and deformations that depend on its physical properties. The encapsulated cell orbiting speed should be high to obtain sufficient data about the cell dynamics within field-of-view limitations. Sheath flow microchannels were therefore proposed to increase the relative velocity between the droplet and its surrounding fluid, thus strengthening the rotational flow field inside the droplet. This accelerates the rotational motion of the encapsulated cell.
Numerical simulations were again conducted for the system with sheath flow. Results revealed that the droplet diameter, droplet viscosity, and the sheath flow rate have the most significant effects on the acceleration of encapsulated cells. On the other hand, generated droplet diameters and core flow rates are the most significant parameters affecting cell velocity after subjection to sheath flow. The effect of sheath flow on the encapsulated cells dynamics was investigated experimentally using MCF-10A cells. The cell movement was tracked using image processing and feature recognition techniques. The ability of the proposed sheath flow technique to increase the translational velocity of encapsulated cells was evident for all performed experiments, where the cells speeds were almost doubled. Meanwhile, the effect of the droplet size or the core flow rate on the increase in speed was minimal. These results provide design guidelines for microfluidic chips, fluid selection, and flow rates for use in label-free biomechanical cell sorting.
Author Contributions
Conceptualization, P.E.B., S.S.J., R.T.H. and Y.H.A.; Data curation, P.E.B. and Y.H.A.; Formal analysis, P.E.B. and Y.H.A.; Funding acquisition, R.T.H.; Investigation, P.E.B. and Y.H.A.; Methodology, P.E.B., A.M.I. and Y.H.A.; Project administration, Y.H.A.; Software, P.E.B.; Supervision, S.S.J., R.T.H. and Y.H.A.; Validation, P.E.B. and Y.H.A.; Visualization, P.E.B.; Writing—original draft, P.E.B. and Y.H.A.; Writing—review and editing, A.M.I., S.S.J., R.T.H. and Y.H.A. All authors have read and agreed to the published version of the manuscript.
Funding
This work was supported in part by NIH-P01HG000205 (R. Howe, J. Padovani). The microfabrication was performed in the Stanford Nanofabrication Facility, supported by the National Science Foundation under award ECS-1542152.
Acknowledgments
The authors gratefully acknowledge former Stanford University graduate student Jose Padovani (now at Medtronic) for his assistance with the fabrication. The authors also acknowledge Vishnu Ramani and Rakhi Gupta for their assistance with the preparation of the MCF-10A cells.
Conflicts of Interest
The authors declare no conflict of interest.
Abbreviations
The following abbreviations are used in this manuscript:
| CFD | Computational Fluid Dynamics |
| PDMS | Polydimethylsiloxane |
References
- Suea-Ngam, A.; Howes, P.D.; Srisa-Art, M.; DeMello, A.J. Droplet microfluidics: From proof-of-concept to real-world utility? Chem. Commun. 2019, 55, 9895–9903. [Google Scholar] [CrossRef] [Green Version]
- Ding, Y.; Howes, P.D.; deMello, A.J. Recent advances in droplet microfluidics. Anal. Chem. 2019, 92, 132–149. [Google Scholar] [CrossRef] [PubMed]
- Shang, L.; Cheng, Y.; Zhao, Y. Emerging droplet microfluidics. Chem. Rev. 2017, 117, 7964–8040. [Google Scholar] [CrossRef]
- Schneider, T.; Kreutz, J.; Chiu, D.T. The potential impact of droplet microfluidics in biology. Anal. Chem. 2013, 85, 3476–3482. [Google Scholar] [CrossRef] [Green Version]
- Ling, S.D.; Geng, Y.; Chen, A.; Du, Y.; Xu, J. Enhanced single-cell encapsulation in microfluidic devices: From droplet generation to single-cell analysis. Biomicrofluidics 2020, 14, 061508. [Google Scholar] [CrossRef]
- Chen, Q.; Lin, J.M. Droplet-Based Microfluidics for Single-Cell Encapsulation and Analysis. In Microfluidics for Single-Cell Analysis; Springer: Berlin/Heidelberg, Germany, 2019; pp. 119–141. [Google Scholar]
- Joensson, H.N.; Svahn, H.A. Droplet microfluidics—A tool for single-cell analysis. Angew. Chem. Int. Ed. 2012, 51, 12176–12192. [Google Scholar] [CrossRef]
- Mazutis, L.; Gilbert, J.; Ung, W.L.; Weitz, D.A.; Griffiths, A.D.; Heyman, J.A. Single-cell analysis and sorting using droplet-based microfluidics. Nat. Protoc. 2013, 8, 870–891. [Google Scholar] [CrossRef]
- Crippen, S.M. Emulsion Biomechanics for Single Cells. Ph.D. Thesis, Stanford University, Stanford, CA, USA, 2013. [Google Scholar]
- Eisenstein, M. Cell sorting: Divide and conquer. Nature 2006, 441, 1179–1185. [Google Scholar] [CrossRef] [Green Version]
- Hulett, H.R.; Bonner, W.A.; Barrett, J.; Herzenberg, L.A. Cell sorting: Automated separation of mammalian cells as a function of intracellular fluorescence. Science 1969, 166, 747–749. [Google Scholar] [CrossRef]
- Cho, H.; Kim, J.; Song, H.; Sohn, K.Y.; Jeon, M.; Han, K.H. Microfluidic technologies for circulating tumor cell isolation. Analyst 2018, 143, 2936–2970. [Google Scholar] [CrossRef] [PubMed]
- Chen, Y.; Li, P.; Huang, P.H.; Xie, Y.; Mai, J.D.; Wang, L.; Nguyen, N.T.; Huang, T.J. Rare cell isolation and analysis in microfluidics. Lab Chip 2014, 14, 626–645. [Google Scholar] [CrossRef] [Green Version]
- Shields IV, C.W.; Reyes, C.D.; López, G.P. Microfluidic cell sorting: A review of the advances in the separation of cells from debulking to rare cell isolation. Lab Chip 2015, 15, 1230–1249. [Google Scholar] [CrossRef] [Green Version]
- Nasiri, R.; Shamloo, A.; Ahadian, S.; Amirifar, L.; Akbari, J.; Goudie, M.J.; Lee, K.; Ashammakhi, N.; Dokmeci, M.R.; Di Carlo, D.; et al. Microfluidic-Based Approaches in Targeted Cell/Particle Separation Based on Physical Properties: Fundamentals and Applications. Small 2020, 16, 2000171. [Google Scholar] [CrossRef]
- Zheng, S.; Lin, H.; Liu, J.Q.; Balic, M.; Datar, R.; Cote, R.J.; Tai, Y.C. Membrane microfilter device for selective capture, electrolysis and genomic analysis of human circulating tumor cells. J. Chromatogr. A 2007, 1162, 154–161. [Google Scholar] [CrossRef]
- Pødenphant, M.; Ashley, N.; Koprowska, K.; Mir, K.U.; Zalkovskij, M.; Bilenberg, B.; Bodmer, W.; Kristensen, A.; Marie, R. Separation of cancer cells from white blood cells by pinched flow fractionation. Lab Chip 2015, 15, 4598–4606. [Google Scholar] [CrossRef] [Green Version]
- Liu, Z.; Huang, F.; Du, J.; Shu, W.; Feng, H.; Xu, X.; Chen, Y. Rapid isolation of cancer cells using microfluidic deterministic lateral displacement structure. Biomicrofluidics 2013, 7, 011801. [Google Scholar] [CrossRef] [PubMed]
- Di Carlo, D. Inertial microfluidics. Lab Chip 2009, 9, 3038–3046. [Google Scholar] [CrossRef] [PubMed]
- Yamada, M.; Seki, M. Hydrodynamic filtration for on-chip particle concentration and classification utilizing microfluidics. Lab Chip 2005, 5, 1233–1239. [Google Scholar] [CrossRef] [PubMed]
- Alnaimat, F.; Dagher, S.; Mathew, B.; Hilal-Alnqbi, A.; Khashan, S. Microfluidics based magnetophoresis: A review. Chem. Rec. 2018, 18, 1596–1612. [Google Scholar] [CrossRef] [PubMed]
- Cheng, I.F.; Chang, H.C.; Hou, D.; Chang, H.C. An integrated dielectrophoretic chip for continuous bioparticle filtering, focusing, sorting, trapping, and detecting. Biomicrofluidics 2007, 1, 021503. [Google Scholar] [CrossRef] [PubMed] [Green Version]
- Petersson, F.; Åberg, L.; Swärd-Nilsson, A.M.; Laurell, T. Free flow acoustophoresis: Microfluidic-based mode of particle and cell separation. Anal. Chem. 2007, 79, 5117–5123. [Google Scholar] [CrossRef]
- Zhu, Y. Micro segmented flow-functional elements and biotechnical applications. Front. Biosci. 2013, S5, 284–304. [Google Scholar] [CrossRef] [Green Version]
- Vladisavljević, G.T.; Kobayashi, I.; Nakajima, M. Production of uniform droplets using membrane, microchannel and microfluidic emulsification devices. Microfluidics Nanofluidics 2012, 13, 151–178. [Google Scholar] [CrossRef] [Green Version]
- Baroud, C.N.; Gallaire, F.; Dangla, R. Dynamics of microfluidic droplets. Lab Chip 2010, 10, 2032. [Google Scholar] [CrossRef] [PubMed] [Green Version]
- Spells, K.E. A Study of Circulation Patterns within Liquid Drops moving through a Liquid. Proc. Phys. Soc. Sect. B 1952, 65, 541–546. [Google Scholar] [CrossRef]
- Fair, R.B.; Khlystov, A.; Tailor, T.D.; Ivanov, V.; Evans, R.D. Chemical and biological applications of digital-microfluidic devices. IEEE Des. Test Comput. 2007, 24, 10–24. [Google Scholar] [CrossRef] [Green Version]
- Kelly, R. (Ed.) Advances in Microfluidics; InTech: London, UK, 2012. [Google Scholar] [CrossRef]
- Baret, J.C. Surfactants in droplet-based microfluidics. Lab Chip 2011, 12, 422–433. [Google Scholar] [CrossRef] [PubMed]
- Taylor, G.I. The Formation of Emulsions in Definable Fields of Flow. Proc. R. Soc. A Math. Phys. Eng. Sci. 1934, 146, 501–523. [Google Scholar] [CrossRef] [Green Version]
- Taylor, G.I. The Viscosity of a Fluid Containing Small Drops of Another Fluid. Proc. R. Soc. A Math. Phys. Eng. Sci. 1932, 138, 41–48. [Google Scholar] [CrossRef]
- Galindo-Rosales, F.J.; Alves, M.A.; Oliveira, M.S.N. Microdevices for extensional rheometry of low viscosity elastic liquids: A review. Microfluidics Nanofluidics 2013, 14, 1–19. [Google Scholar] [CrossRef] [Green Version]
- Lee, J.S.; Dylla-Spears, R.; Teclemariam, N.P.; Muller, S.J. Microfluidic four-roll mill for all flow types. Appl. Phys. Lett. 2007, 90, 074103. [Google Scholar] [CrossRef]
- Wörner, M. Numerical modeling of multiphase flows in microfluidics and micro process engineering: A review of methods and applications. Microfluidics Nanofluidics 2012, 12, 841–886. [Google Scholar] [CrossRef]
- Cristini, V.; Tan, Y.C.; Burns, M.A.; Johnson, B.N.; Brahmasandra, S.N.; Handique, K.; Webste. Theory and numerical simulation of droplet dynamics in complex flows—A review. Lab Chip 2004, 4, 257–264. [Google Scholar] [CrossRef] [PubMed]
- Ibrahim, A.M.; Padovani, J.I.; Howe, R.T.; Anis, Y.H. Modeling of Droplet Generation in a Microfluidic Flow-Focusing Junction for Droplet Size Control. Micromachines 2021, 12, 590. [Google Scholar] [CrossRef]
- González-Rodríguez, R.M.; Rial-Otero, R.; Cancho-Grande, B.; Simal-Gándara, J. Occurrence of fungicide and insecticide residues in trade samples of leafy vegetables. Food Chem. 2008, 107, 1342–1347. [Google Scholar] [CrossRef]
- Padovani, J.I.; Ibrahim, A.M.; Jeffrey, S.S.; Anis, Y.H.; Howe, R.T. Electropermanent magnet-driven droplet size modulation for two-phase ferromicrofluidics. Microfluidics Nanofluidics 2020, 24, 1–12. [Google Scholar] [CrossRef]
- Padovani, J.I.; Jeffrey, S.S.; Howe, R.T. Electropermanent magnet actuation for droplet ferromicrofluidics. Technology 2016, 4, 110–119. [Google Scholar] [CrossRef] [Green Version]
- Xia, Y.; Whitesides, G.M. Soft lithography. Annu. Rev. Mater. Sci. 1998, 28, 153–184. [Google Scholar] [CrossRef]
- Yuen, H.K.; Princen, J.J.I.; Kittler, J. Comparative study of Hough transform methods for circle finding. Image Vis. Comput. 1990, 8, 71–77. [Google Scholar] [CrossRef] [Green Version]
Figure 1.
Modeling of rotational flow of a single cell is encapsulated inside an droplet.
Figure 1.
Modeling of rotational flow of a single cell is encapsulated inside an droplet.
Figure 2.
External flow field inside and outside a droplet at = 1 µL/min due to the 4.5 mm/s velocity difference between the droplet and the external fluid.
Figure 2.
External flow field inside and outside a droplet at = 1 µL/min due to the 4.5 mm/s velocity difference between the droplet and the external fluid.
Figure 3.
Effect of flow rate on encapsulated cell dynamics: (a) cell trajectory, (b) cell average velocity, and (c) cell velocity profile.
Figure 3.
Effect of flow rate on encapsulated cell dynamics: (a) cell trajectory, (b) cell average velocity, and (c) cell velocity profile.
Figure 4.
Schematic of the sheath flow microchannel, consisting of three inlet ports: one for core flow and two for sheath flow: (a) microchannel inlets and outlet, and (b) microchannel dimensions.
Figure 4.
Schematic of the sheath flow microchannel, consisting of three inlet ports: one for core flow and two for sheath flow: (a) microchannel inlets and outlet, and (b) microchannel dimensions.
Figure 5.
Effect of various microfluidic and cell related parameters on the rotational flow field: (a) Effect of on , (b) Effect of on , (c) Effect of on , (d) Effect of on , (e) Effect of on , (f) Effect of on , (g) Pareto chart with parameters sorted in the order of significance.
Figure 5.
Effect of various microfluidic and cell related parameters on the rotational flow field: (a) Effect of on , (b) Effect of on , (c) Effect of on , (d) Effect of on , (e) Effect of on , (f) Effect of on , (g) Pareto chart with parameters sorted in the order of significance.
Figure 6.
Sheath flow microfluidic chip: (a) The chip contains five inlet ports, one for the sample, two for the continuous oil phase, and two for sheath flow. (b) Micropost filtration. (c) Cross junction emulsification stage.
Figure 6.
Sheath flow microfluidic chip: (a) The chip contains five inlet ports, one for the sample, two for the continuous oil phase, and two for sheath flow. (b) Micropost filtration. (c) Cross junction emulsification stage.
Figure 7.
Image sequence processing approach: (a) droplet edge is detected and tracked within a defined search area, (b) cell is detected and tracked within a defined search area, (c) image sequence is converted to black stagnant droplet containing a white moving cell, (d) cell position is recorded at every time frame using circular Hough transform.
Figure 8.
Experimental cell behavior: (a) time lapse still images showing MCF-10A cell position at different time frames, (b) cell spiral trajectory.
Figure 8.
Experimental cell behavior: (a) time lapse still images showing MCF-10A cell position at different time frames, (b) cell spiral trajectory.
Figure 9.
Effect of sheath flow on MCF-10A cell velocity. Cell mean velocity increased by 90%.
Figure 9.
Effect of sheath flow on MCF-10A cell velocity. Cell mean velocity increased by 90%.
Figure 10.
Increase in cell velocity () due to the sheath flow at different values of: (a) droplet diameter , and (b) core flow rate .
Figure 10.
Increase in cell velocity () due to the sheath flow at different values of: (a) droplet diameter , and (b) core flow rate .
Figure 11.
Cell rotational speed () after sheath flow at different values of: (a) droplet diameter , and (b) core flow rate .
Figure 11.
Cell rotational speed () after sheath flow at different values of: (a) droplet diameter , and (b) core flow rate .
Table 1.
Parameters with a potential effect on the rotational flow field and the average cell velocity .
Table 1.
Parameters with a potential effect on the rotational flow field and the average cell velocity .
| Parameter | Lower Value | Higher Value |
|---|
| Sheath flow rate [µL/min] | 0.5 | 2 |
| Core flow rate [µL/min] | 0.5 | 5 |
| Generated droplet diameter [µm] | 70 | 190 |
| Cell diameter [µm] | 7 | 25 |
| Continuous phase viscosity [mPa·s] | 50 | 200 |
| Droplet viscosity [mPa·s] | 1 | 5 |
| Publisher’s Note: MDPI stays neutral with regard to jurisdictional claims in published maps and institutional affiliations. |
© 2021 by the authors. Licensee MDPI, Basel, Switzerland. This article is an open access article distributed under the terms and conditions of the Creative Commons Attribution (CC BY) license (https://creativecommons.org/licenses/by/4.0/).


 ,
, 


