Abstract
The present research investigates the effect of a heat source/sink on nanofluid flow through a cone, wedge, and plate when using a suspension of aluminium alloys (AA7072 and AA7075) as nanoparticles in base fluid water. The activation energy and porous material are also considered in the modelling. Using similarity transformations, the modelling equations were converted into an ordinary differential equation (ODEs) system. The Runge Kutta Fehlberg 45 fourth fifth-order (RKF 45) technique and shooting approach were used to numerically solve these equations. The influence of essential aspects on flow fields, heat, and mass transfer rates was studied and addressed using graphical representations. The outcome reveals that the case of fluid flow past a plate shows improved heat transfer for augmented heat source/sink parameter values than the cases for fluid flow past a cone and wedge does. Furthermore, we observed the least heat transfer for the case of fluid flow past the cone. The mass transfer for the case of fluid flow past the cone increased more slowly for growing activation energy parameter values than in the other cases. Moreover, we observed higher mass transfer rates for the case of fluid flow past the plate. The augmented values of the heat source/sink parameter decayed the heat transfer rate in all three flow cases.
1. Introduction
Nanofluids are heat transfer liquids that include nanoparticle (1–100 nm) suspensions that are dispersed throughout liquid. Water, organic fluids, motor oil, bio-liquids, and other basic liquids are usually included in base liquids. Choi was the first to investigate thermal conductivity augmentation in nanofluids. Recently, many studies have been conducted using two kinds of nanoparticles suspended in a base liquid known as a hybrid nanofluid. The main advantage of using a hybrid nanofluid is that by selecting the right mix of nanoparticles, favourable characteristics may be enhanced, and drawbacks can be mitigated due to their synergistic impact. These hybrid nanofluids are a relatively new type of nanofluids and have a wide range of heat transfer applications, including in microfluidics, transport, medical, defence, naval construction, and acoustics applications. Hybrid nanoparticles provide a colossal advantage and have remarkably high effective heat conductivity when the nano-sized particles are spread correctly. In particular, nanofluid flow is well-known for its high heat transfer compared to conventional fluid. Hybrid nanofluids are utilized to augment this heat transfer ability even further. Recently, Gul [1] analyzed thermal management in hybrid nanofluid flow within a narrowed gap among a disk and cone. Abbas et al. [2] investigated the stagnation point stream of a hybrid nanofluid over a moving cylinder with a magnetic field. Madhukesh et al. [3] swotted alloy–water-based hybrid nanoliquid flow past a coiled sheet with Newtonian heating. Gowda et al. [4] swotted carbon nanotube–water-based hybrid nanoliquid flow past a poignant spinning disk. Mabood et al. [5] educed radiative melting heat transport in copper–alumina–water-based hybrid nanoliquid flow.
Due to its vast variety of applications in science and technology, researchers have been paying close attention to liquid flow through various geometries, such as a vertical cone, wedge, and plate geometries, among others. Many scientists and researchers have looked at this issue from various angles. Waini et al. [6] investigated heat transfer through a hybrid nanofluid using a wedge. Maleki et al. [7] investigated nanofluid flow heat transfer via a moving porous plate. Anwar et al. [8] used a plate embedded in porous media to study the impact of radiation on a second-grade liquid. Kumar et al. [9] looked at how heat radiation affected MHD nanofluid flow across an upright plate. Khan et al. [10] studied the entropic generation of a viscous MHD fluid stream flowing through a spinning cone. Maxwell hybrid nanofluid flow over an upright cone with Cattaneo–Christov heat flux was investigated by Reddy et al. [11]. The effect of non-Fourier heat flux on dusty liquid flow across a plate, cone, and wedge was explained by Mahanthesh et al. [12]. The effect of suction/injection on Williamson liquid flow via a cone and wedge was elucidated by Dawar et al. [13]. The influence of Gyrotactic Microorganisms on Carreau fluid flow via a cone and wedge was explained by Muntazir et al. [14].
A porous medium is a material volume that is made up of a solid matrix and a network of voids. Flows across porous media have a variety of practical uses in nature, including slurries, petroleum reservoir rocks, sand beds, and sedimentation. Furthermore, because of its wide range of practical applications, the study of fluid flow issues in porous media has sparked a lot of interest. Jamshed et al. [15] educed the dissipative stream of a Cu–Al2O3 /engine oil hybrid nanofluid with a porous medium. Gowda et al. [16] quizzed the dual-phase flow of titania–copper/water-based hybrid nanoliquid flow past a cylinder with a porous medium. Kumar et al. [17] conferred the flow of Casson liquid with a dual nanoparticle suspension on a poignant disk with a porous medium. Jawad et al. [18] illuminated the convective Marangoni stream of nanoliquid above a porous surface. Madhukesh et al. [19,20] educed the stream of different liquids past different surfaces in the presence of a porous medium.
Many researchers have conducted experiments on porous media. Longo et al. [21] verified power-law non-Newtonian axisymmetric porous gravity currents experimentally. They discovered good agreement between theoretical and experimental outcomes in their investigation. Federico et al. [22] investigated radial gravity currents in vertically graded porous media, describing both theory and experiments for Newtonian and power-law fluids. The behaviour of axisymmetric gravity currents of Newtonian and power-law fluids in inhomogeneous porous media is investigated theoretically and empirically in this paper. The obtained results reveal that the rheological characteristics of the invading fluid and changes in permeability have a substantial effect on the radius and profile of the gravity-driven currents that are propagated in porous media. Axisymmetric gravity currents in porous media were experimentally validated by Longo and Federico [23]. Both first-order and zero-order theoretical models were subjected to a sensitivity and uncertainty analysis. The study revealed that porosity fluctuations are more sensitive to the flow process than other parameters are. Some important works highlighting experimental studies in porous media are reported in [24,25,26,27,28].
During cooling processes, heat source/sink (HSS) influence is critical. In most published publications, it is also worth noting that the impact of an interior heat source/sink is usually treated as a temperature-dependent uniform heat source/sink or a space-dependent heat source. All of these studies discovered that the internal heat source mechanism accelerates the formation of the thermal boundary layer. The HSS feature on a nanoliquid stream initiated by a rotating geometry was investigated by Awais et al. [29]. The influence of HSS on nanoliquid flow across a permeable rotating disc was investigated by Nadeem et al. [30]. The effect of HSS on a liquid flow generated by a thin needle was elucidated by Ramzan et al. [31]. Heat transference in nanoliquid over a stretching surface (SS) was defined by Upreti et al. [32] using HSS. Jamaludin et al. [33] investigated the flow pattern of a nanoliquid across an SS using HSS. The activation energy mechanism in hybrid carbon nanotubes and induced magnetic slip flow with a heat source/sink was studied by Ramesh and Madhukesh [34].
Due to its uses in many industrial and mechanical processes, such as fog formation, fibre insulation, air pollution, and catalysis, engineers and scientists have been paying close attention to investigation into the activation energy in binary chemical reactions. It has several practical applications in biochemical systems, combustion, and ceramic manufacture. These applications have prompted a number of researchers to study the influence of these effects on various liquid streams with different geometries. Zaib et al. [35] highlighted the aspects of the radiation effect on a stream Carreau nanoliquid by considering the activation energy. Ijaz et al. [36] debriefed the nanoliquid stream over a revolving disk by considering the activation energy. Ramesh et al. [37] probed the significance of particle movement across parallel plates with activation energy and chemical reaction in aluminium alloys. Bhatti and Michaelides [38] typified the bioconvection flow of nanofluids above a Riga plate. Khan and Nadeem [39] typified the activation energy impact on a Maxwell nanoliquid past an exponentially stretching sheet.
Considering the above-cited articles, we examined the effect of the uniform heat sink/source effect on an incompressible stream of nanofluid across a cone, wedge, and plate in the presence of a porous medium that has not been previously study. Furthermore, activation energy is considered in the modelling. However, to the best of the authors’ knowledge, no numerical solution has been examined for the impact of the heat sink/source effect on the flow of nanoliquid through a cone, wedge, and plate. The main focus of the present paper is on numerically examining the previously stated flow.
2. Mathematical Formulation
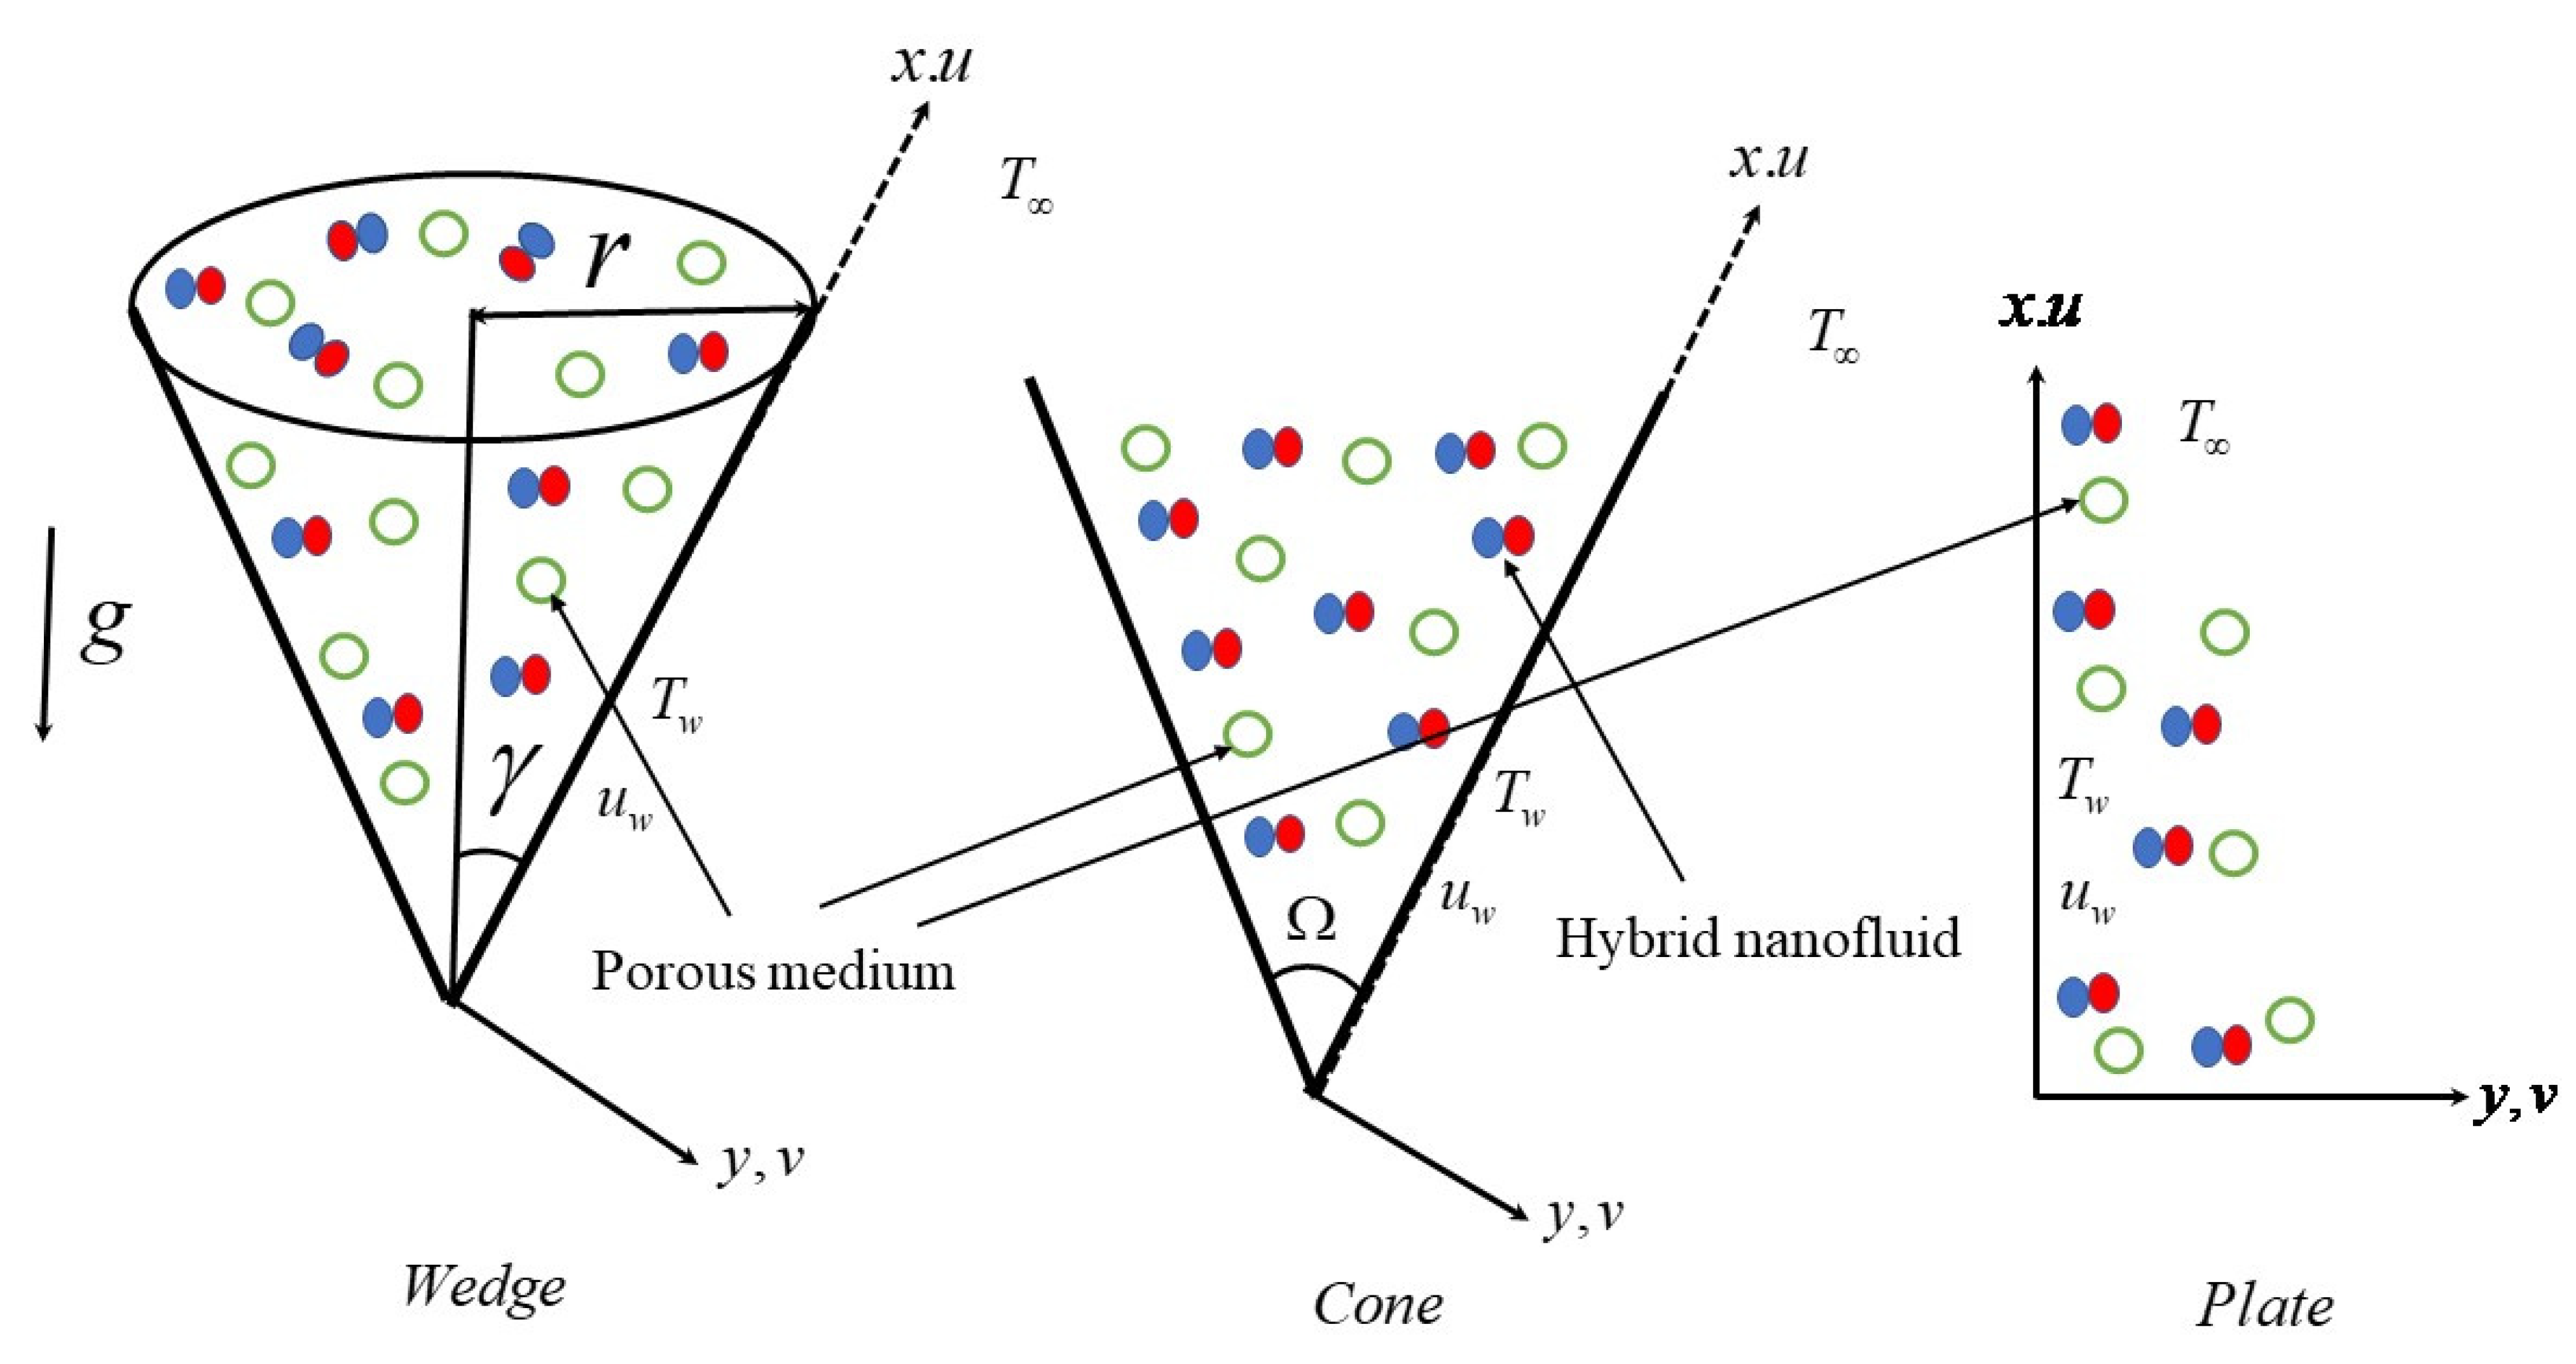
Consider a steady, two-dimensional, and incompressible hybrid nanofluid flow over three different geometries (cone, wedge, and plate) in the presence of a porous medium, heat source/sink, and activation energy. The axis is considered to be along the body’s surface, and is normal to its surface. Figure 1 shows the physical model of the model. Let us assume that are the half-angle of the cone/wedge, full angle of the wedge, and radius of the cone, respectively, and is the temperature near the surface (i.e., ); furthermore it is assumed that an applied temperature routinely warms the novel solid structure, and is the far-field temperature (i.e., ), is the concentration near the surface (i.e., ), and is the far-field concentration (i.e., ), representing thermodynamic boundary circumstances.
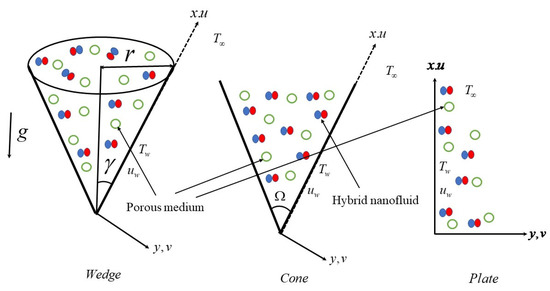
Figure 1.
Flow geometry.
The governing equations for continuity, momentum, temperature, and concentration are below and are based on the assumptions stated above (see Vajravelu and Nayfeh [40], Chetteti and Chukka [41]).
The boundary conditions are below, (see Ali and Sandeep [42]) and
In Equations (1)–(5), signifies the velocity components along the directions. is acceleration due to gravity, is the volumetric thermal expansion coefficient, is the permeability of the porous medium, is the half angle of the cone/wedge, is the kinematic viscosity of the fluid, is the density of the fluid, is the dynamic viscosity of the fluid, is the uniform heat source/sink coefficient, is the temperature, and denotes temperature near the surface and ambient temperature, respectively, is the specific heat at constant pressure, is the thermal conductivity, is the heat capacitance, is the reaction rate, is the fitted rate constant, is the activation energy, is the Boltzmann constant, is the modified Arrhenius function, is the concentration, is the concentration at the surface, is the ambient concentration, is the Brownian diffusion, is the characteristic length, and the subscript denotes the hybrid nanoparticles
Based on the following assumptions, three alternative geometries are presented for the suggested problem:
- (a)
- Case 1: Wedge— and ;
- (b)
- Case 2: Cone— and ;
- (c)
- Case 3: Plate— and .
Similarity variables are introduced below:
From Equation (6), the term represents the velocity components. denotes the dimensionless similarity variable, and and represent the dimensionless temperature and concentration profiles, respectively.
The thermophysical properties of the base fluid and nanoparticles are given in Table 1. The expressions for the density, dynamic viscosity, thermal conductivity, and specific heat capacity of hybrid nanofluid are as follows (see Devi and Devi [43]):

Table 1.
Thermophysical properties of base fluid and nanoparticles. (See Hayat et al. [44], Olatundun and Makinde [45]).
In the above expressions, and represent the solid volume fractions of AA7075 and AA7072, respectively, and the subscripts and represent the fluid, nanofluid, hybrid nanofluid, and solid particles of AA7075 and AA7072, respectively.
The reduced equations can be expressed as follows
and,
where , and
The flow control parameters are as follows:
is the Grashof number, is the Activation energy parameter, is the porosity parameter, is the Prandtl number, is the heat source/sink parameter, is the reaction rate parameter, is the Schmidt number, and is the temperature difference.
Using the appropriate similarity transformations, the main physical variables of importance, such as skin friction, Nusselt number, and Sherwood number, are provided below.
Substituting Equation (12) into (11), we have
3. Numerical Procedure and Validation
The RKF-45 approach and shooting technique were used to solve the governing Equations (7)–(9) and to reduce the boundary conditions with the aid of well-known computing tools. We transformed the reduced equations into a first-order system.
Let us take
, , , , , and
Through this, we obtain
Additionally, the boundary conditions become
The initial value problem (IVP) in Equations (14)–(16) and (17) is solved numerically with the aid of the RKF-45-order method, and unknown values are attained with the help of a shooting technique by assigning the error tolerance and step size to be and respectively, further gratifying the boundary conditions at the infinity level. The numerical estimations were obtained by utilizing the build-in function of bvp4c in MATLAB by setting the parameters ranges as and Furthermore, the numerical solutions are compared to those from previous studies, resulting in similar findings (see Table 2 and Table 3).
Table 2.
Validation of the code for diverse values of when .
Table 3.
Computational values of for various values of in the absence of .
4. Results and Discussion
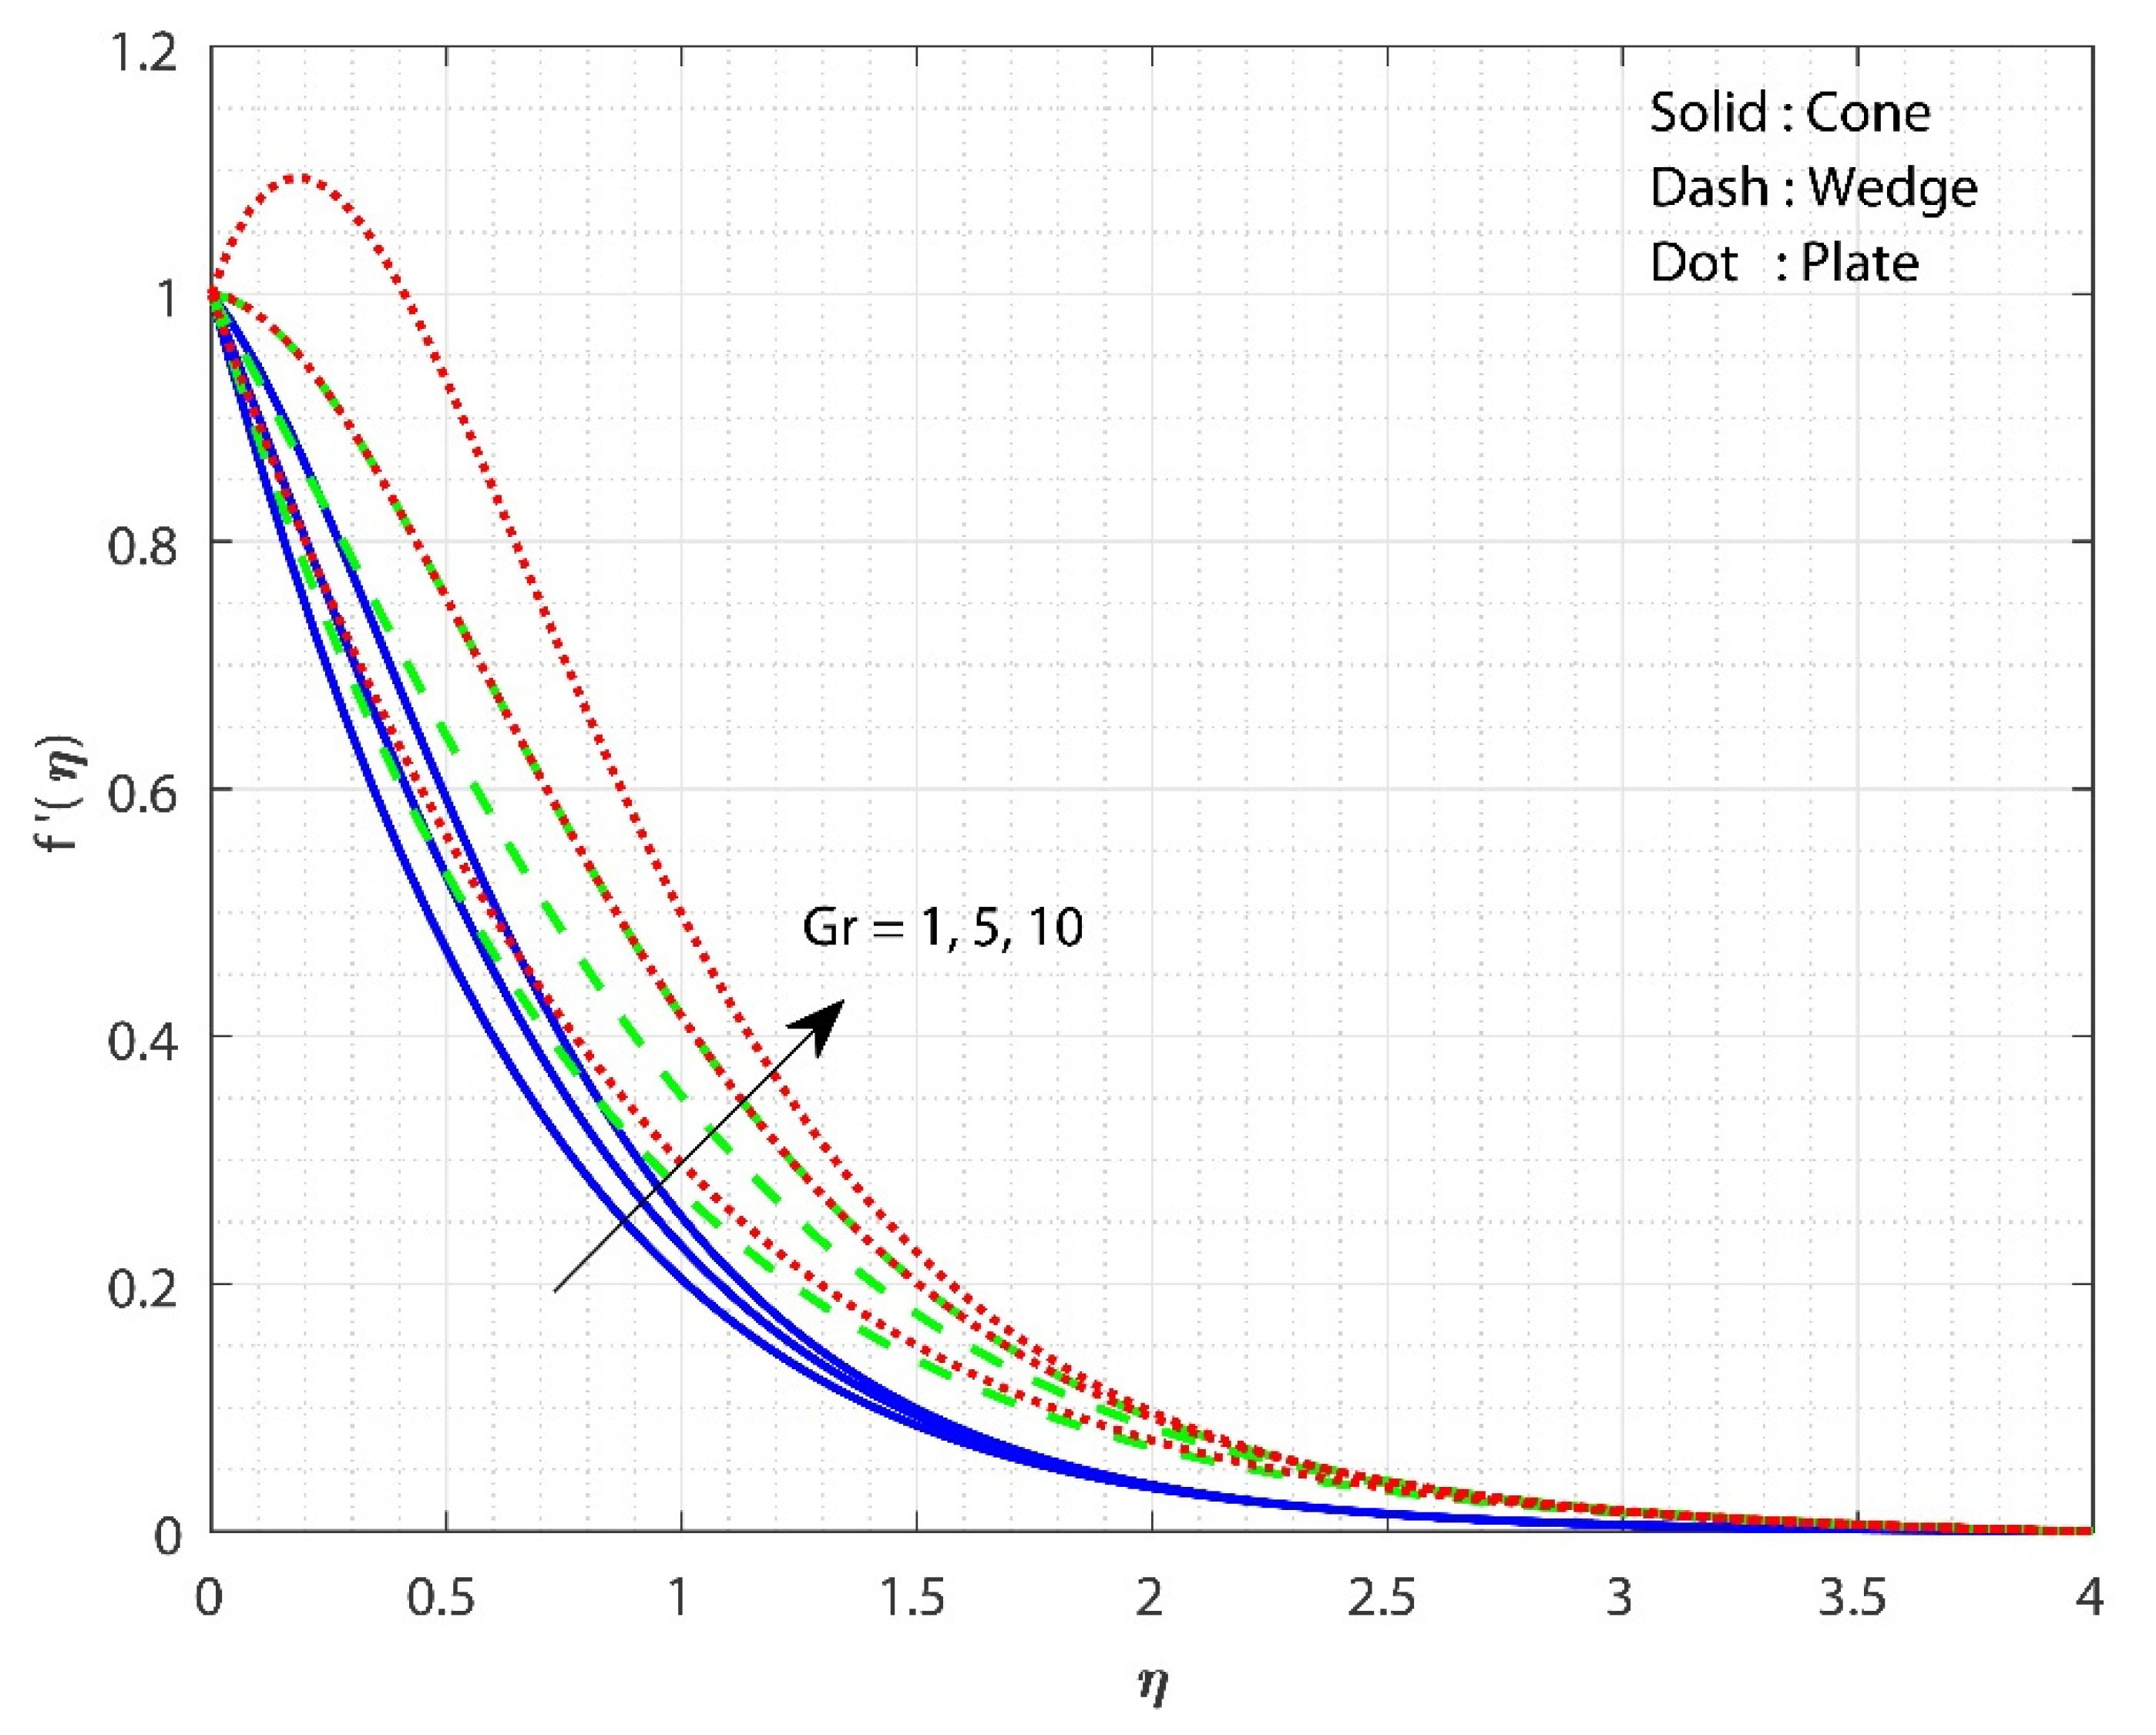
This section explains how to graphically represent the important and pertinent parameters on the involved profiles. With proper plots, the physical quantities of importance, such as skin friction and Nusselt number, are also elucidated. In the current study, we examined fluid flow past three different surfaces: (i) fluid flow past a cone, (ii) fluid flow past a wedge, and (iii) fluid flow past a plate. In the graphs, the dashed curves show flow through a wedge, solid lines indicate flow past a cone, and dotted lines indicate flow past a plate.
The impact of on is displayed in Figure 2 for three different fluid flow cases. The increase in the value declines the for all three flow cases. As the value of rises, so does the system’s resistance. As a significance of the increased frictional force, the fluid flow is reduced. As a result of the additional resistance, the liquid’s velocity decreases. Furthermore, the for fluid flow past the cone declines faster as the values increase than in the remaining cases. The influence of on is displayed for all the three flow cases in Figure 3. The upsurge in the value of improved the for all three flow cases. An increase in the values decreases the thickness of the boundary layer due to variations in the buoyancy forces caused by the temperature differences. Furthermore, the for the fluid flow the past plate inclines faster as the values increase than in the remaining two cases. Figure 4 shows the effect of on for all the three flow cases. The upsurge in the values improves the for all three flow cases. Moreover, the fluid flow past plate case shows improved heat transfer than the remaining two cases. Here, we observed the least heat transfer for the case of fluid flow past a cone. Internal heat absorption/generation either helps or degrades heat transport. As the grows, the layer thickens. The heat source restrictions in the flow state will exhibit better heat transfer. The presence of a heat source energizes the fluid. Consequently, as heat is consumed, the buoyancy force accelerates the flow and improves heat transfer.
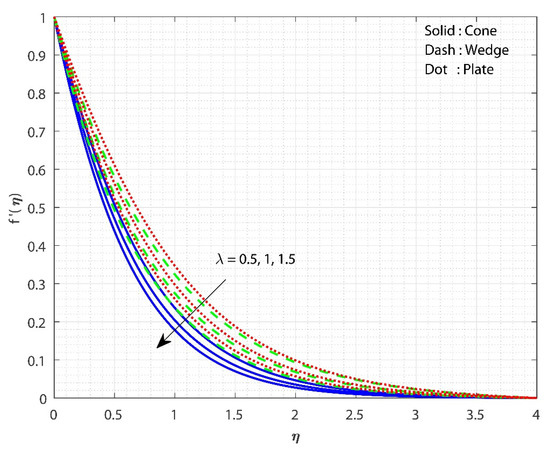
Figure 2.
The impact of on when keeping , .
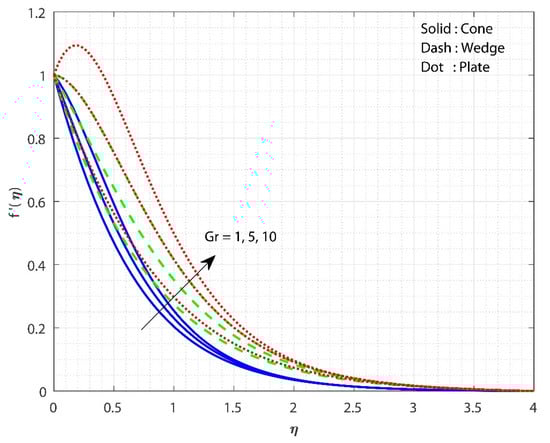
Figure 3.
The upshot of on when keeping , .
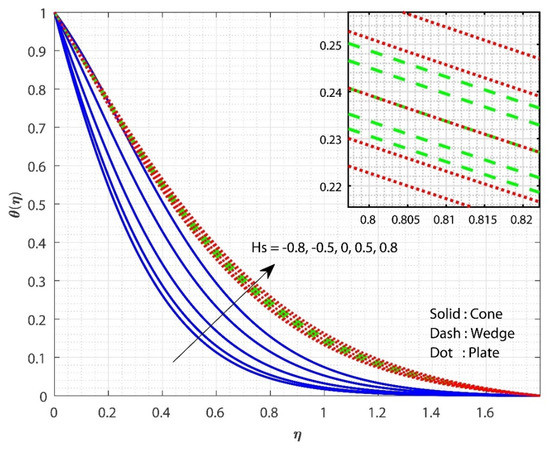
Figure 4.
The upshot of on when keeping , .
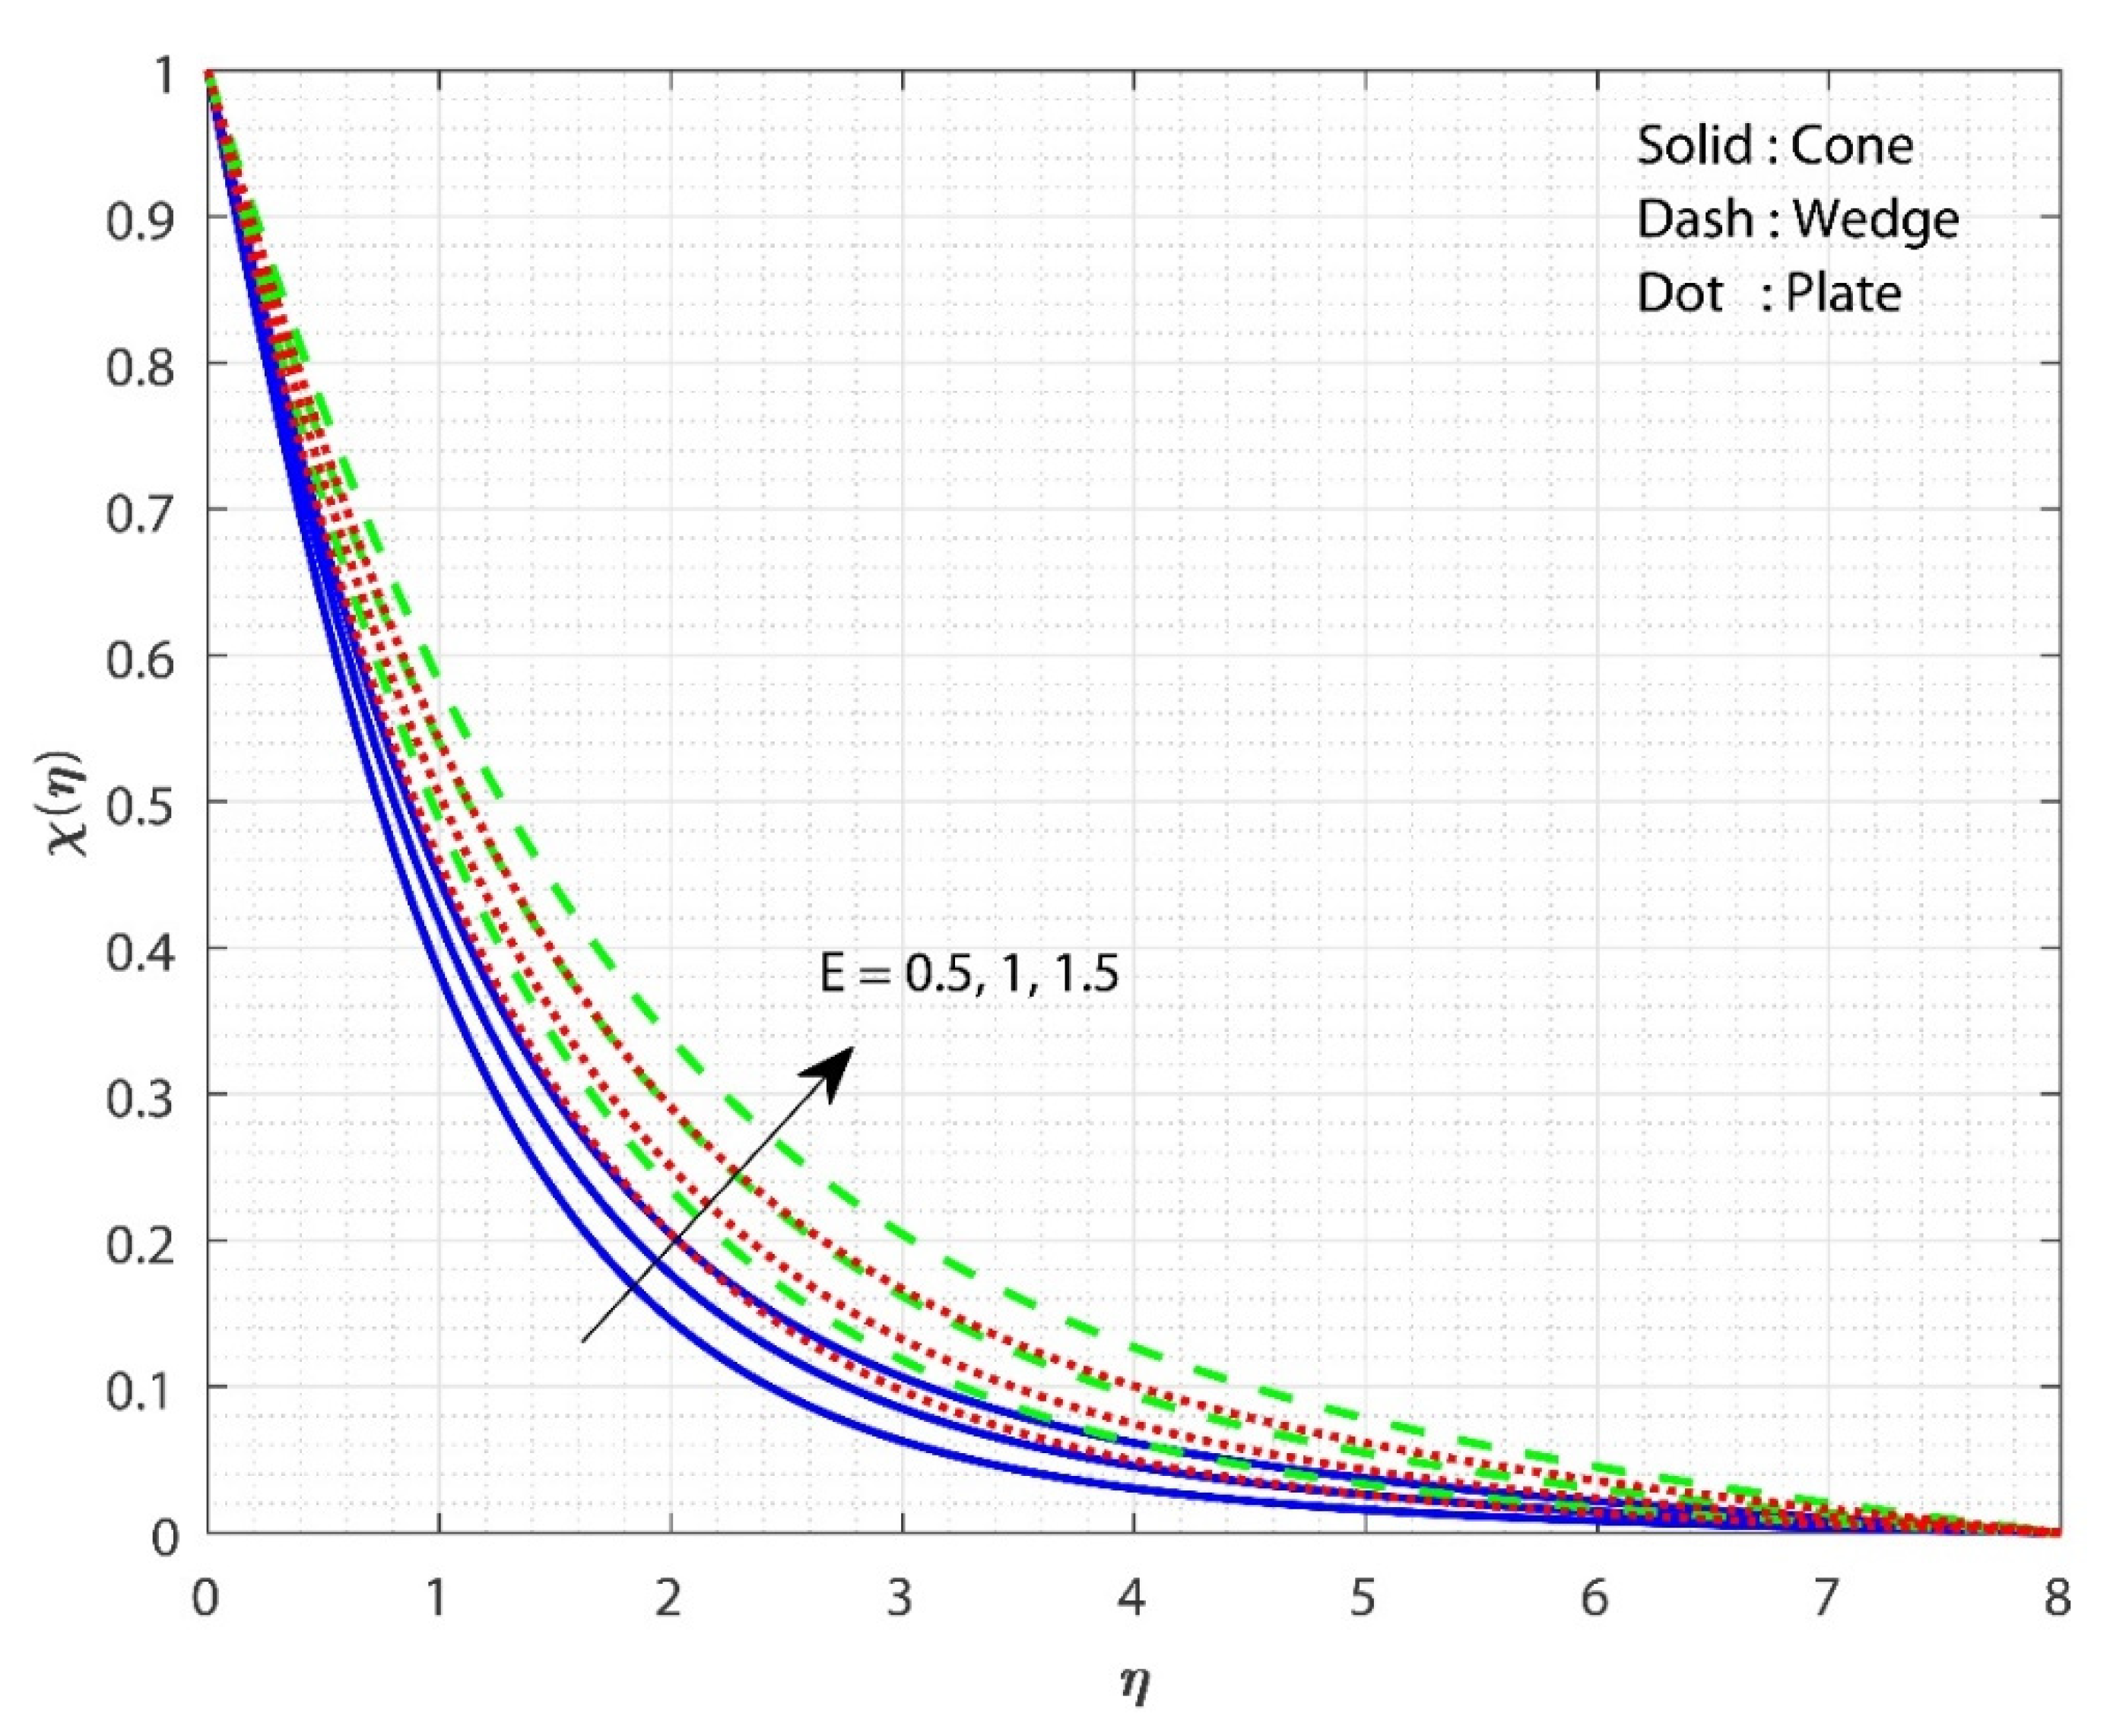
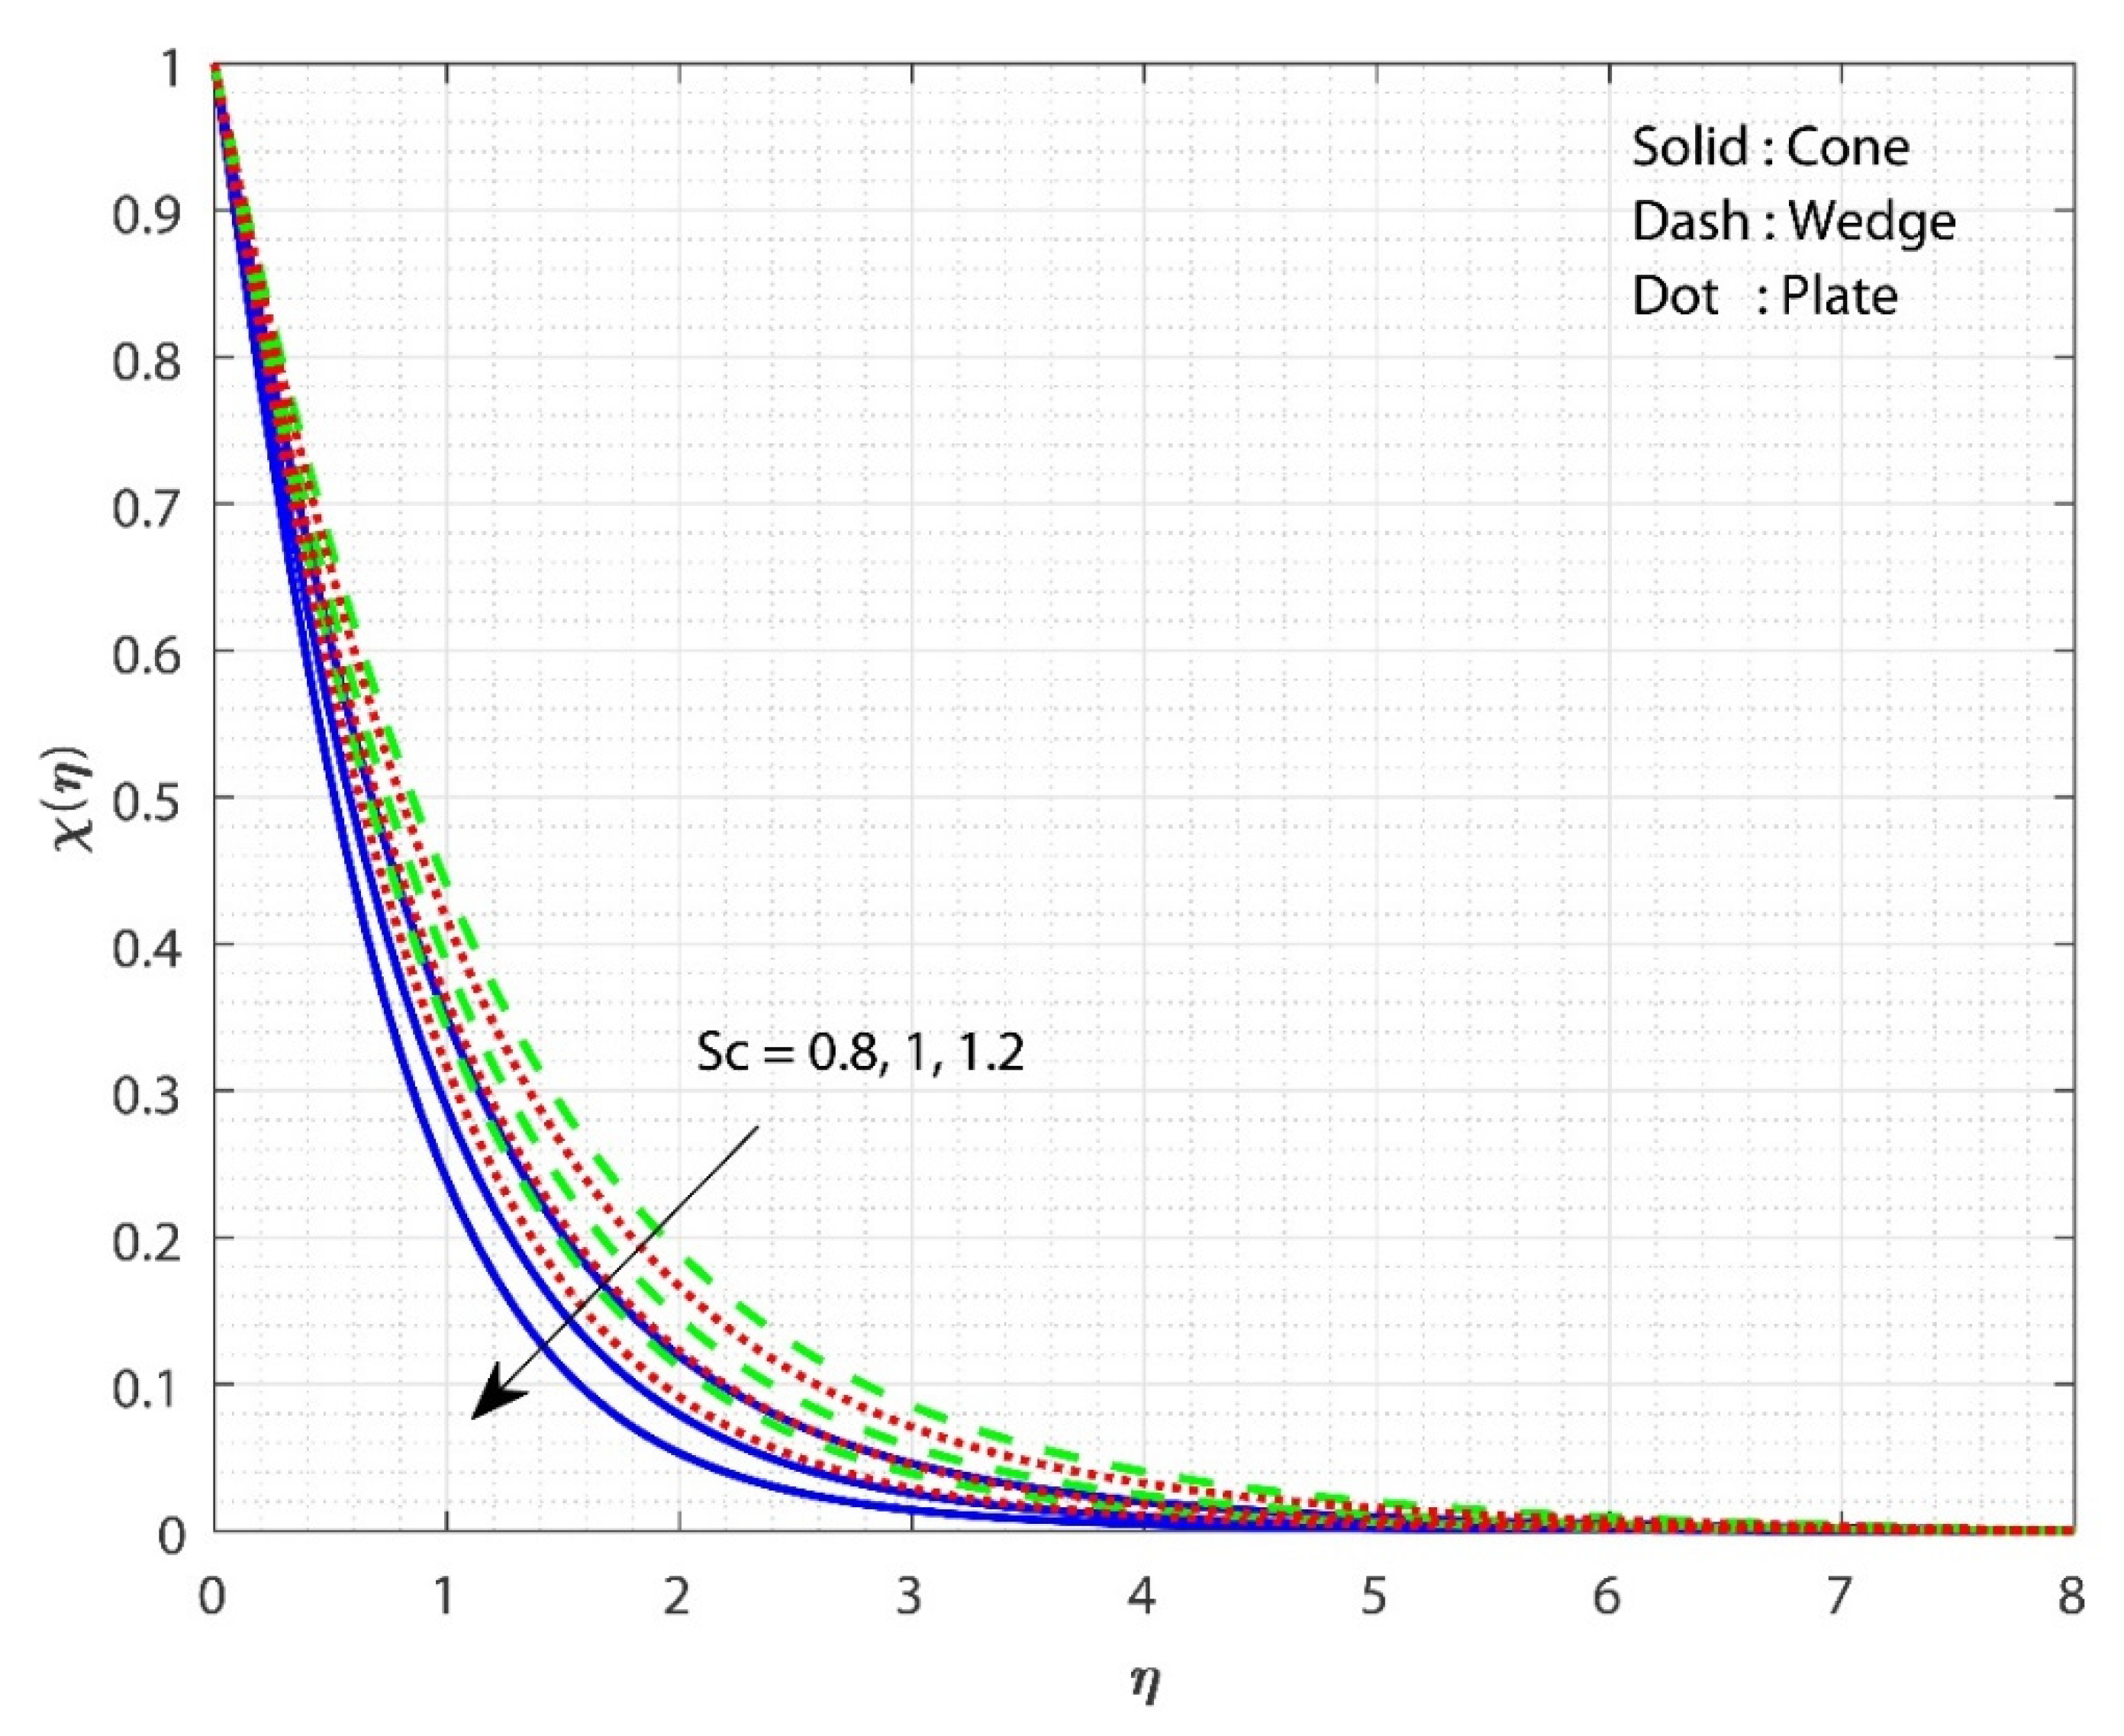
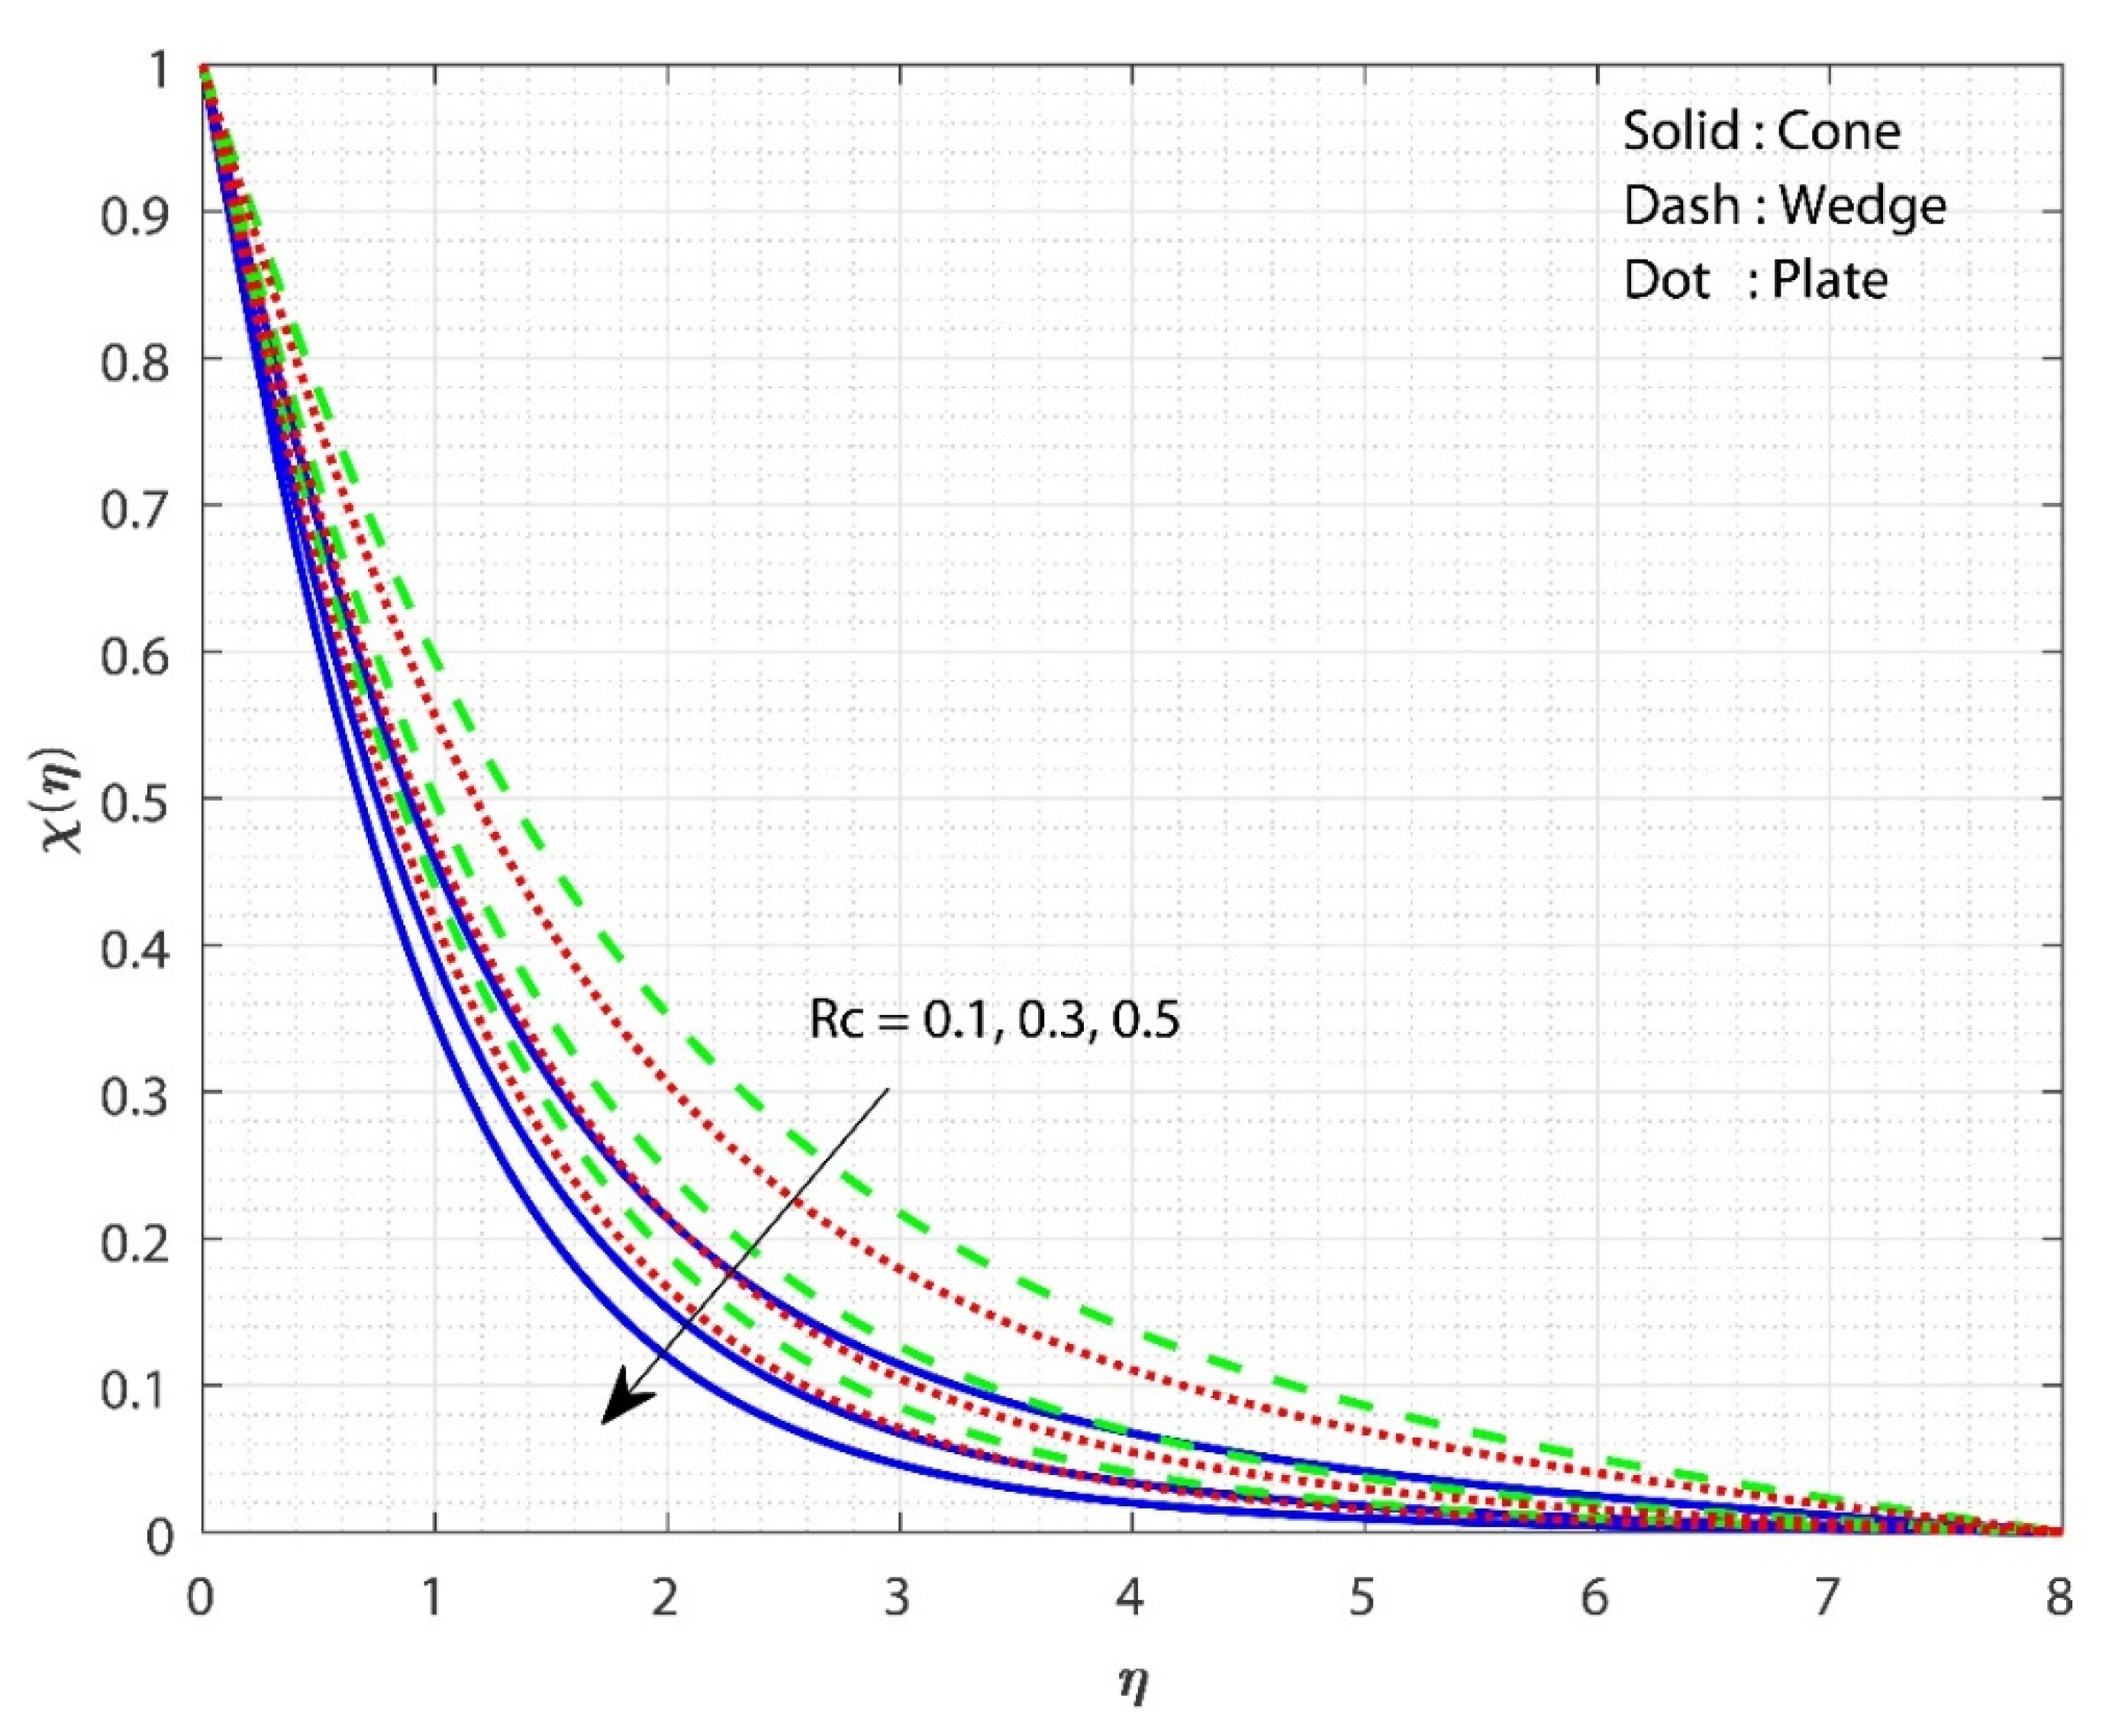
In Figure 5, the impact of on is displayed for the three different fluid flow cases. The increase in the value increases the for all three flow cases. The impact of the porosity parameter on is the same as the impact of on . The Arrhenius equation shows that injecting activation energy into any system causes a reduction in heat and acceleration, resulting in a low response rate constant. As a result, the chemical reaction takes longer to complete, resulting in a larger particle concentration. As grows, the modified Arrhenius process decays. Consequently, the generative chemical process is accelerated, resulting in an increase in the nanoparticle concentration. As a consequence, the increases in value. Furthermore, the for fluid flow past the cone increases more slowly as the value grows than in the remaining cases. Here, we observe higher fluid flow mass transfer when flowing past the plate. Figure 6 shows the effect of on for all the three flow cases. The upsurge in the value decreases the for all three flow cases. The smallest number indicates the highest concentration of nanoparticles. Momentum diffusivity increases as the rises, causing mass transport to decline. As increases, the diffusion coefficient reduces, lowering the mass transfer. Moreover, the case of fluid flow past the wedge shows better mass transfer than the remaining two cases. Here, we observe the least fluid flow mass transfer when flowing past the wedge. Figure 7 shows the influence of on for the three different fluid flow cases. Increasing the value declines the for all three flow cases. A larger chemical reaction has a negative impact on the reactant species, degrading them. When increases, the is lowered as a result. Furthermore, the for the case of fluid flow past a wedge decreases more slowly as the value increases than in the remaining cases. Here, we observe higher mass transfer for the case of fluid flow past a wedge.
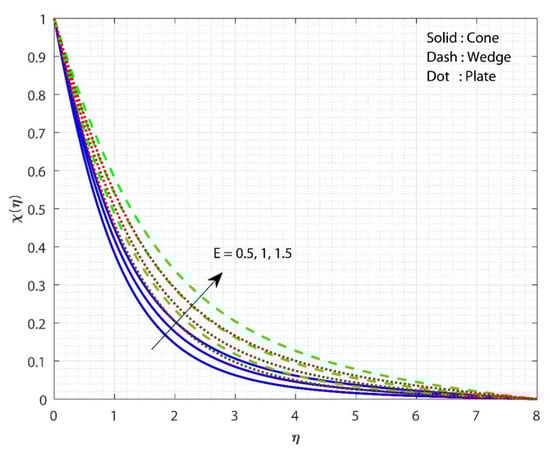
Figure 5.
The upshot of on when keeping , .
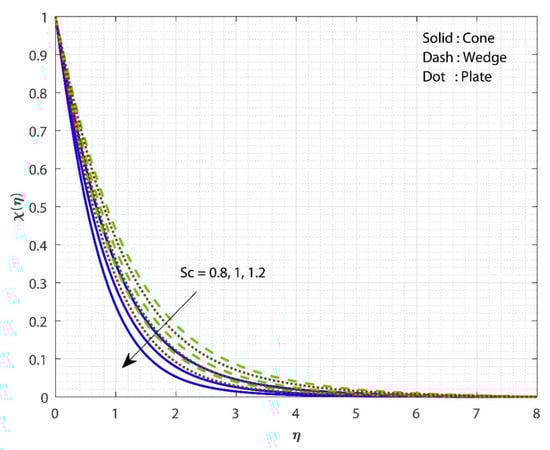
Figure 6.
The upshot of on when keeping , .
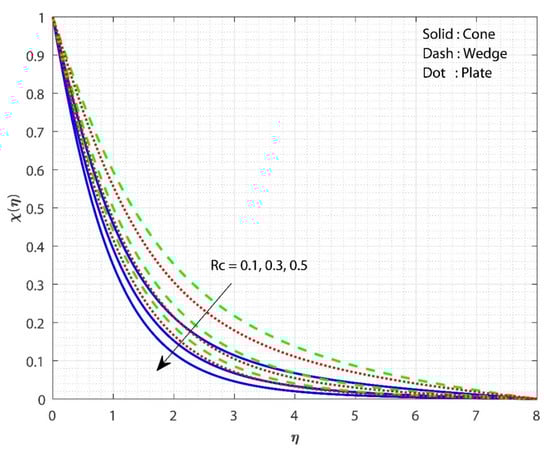
Figure 7.
The upshot of on . when keeping , .
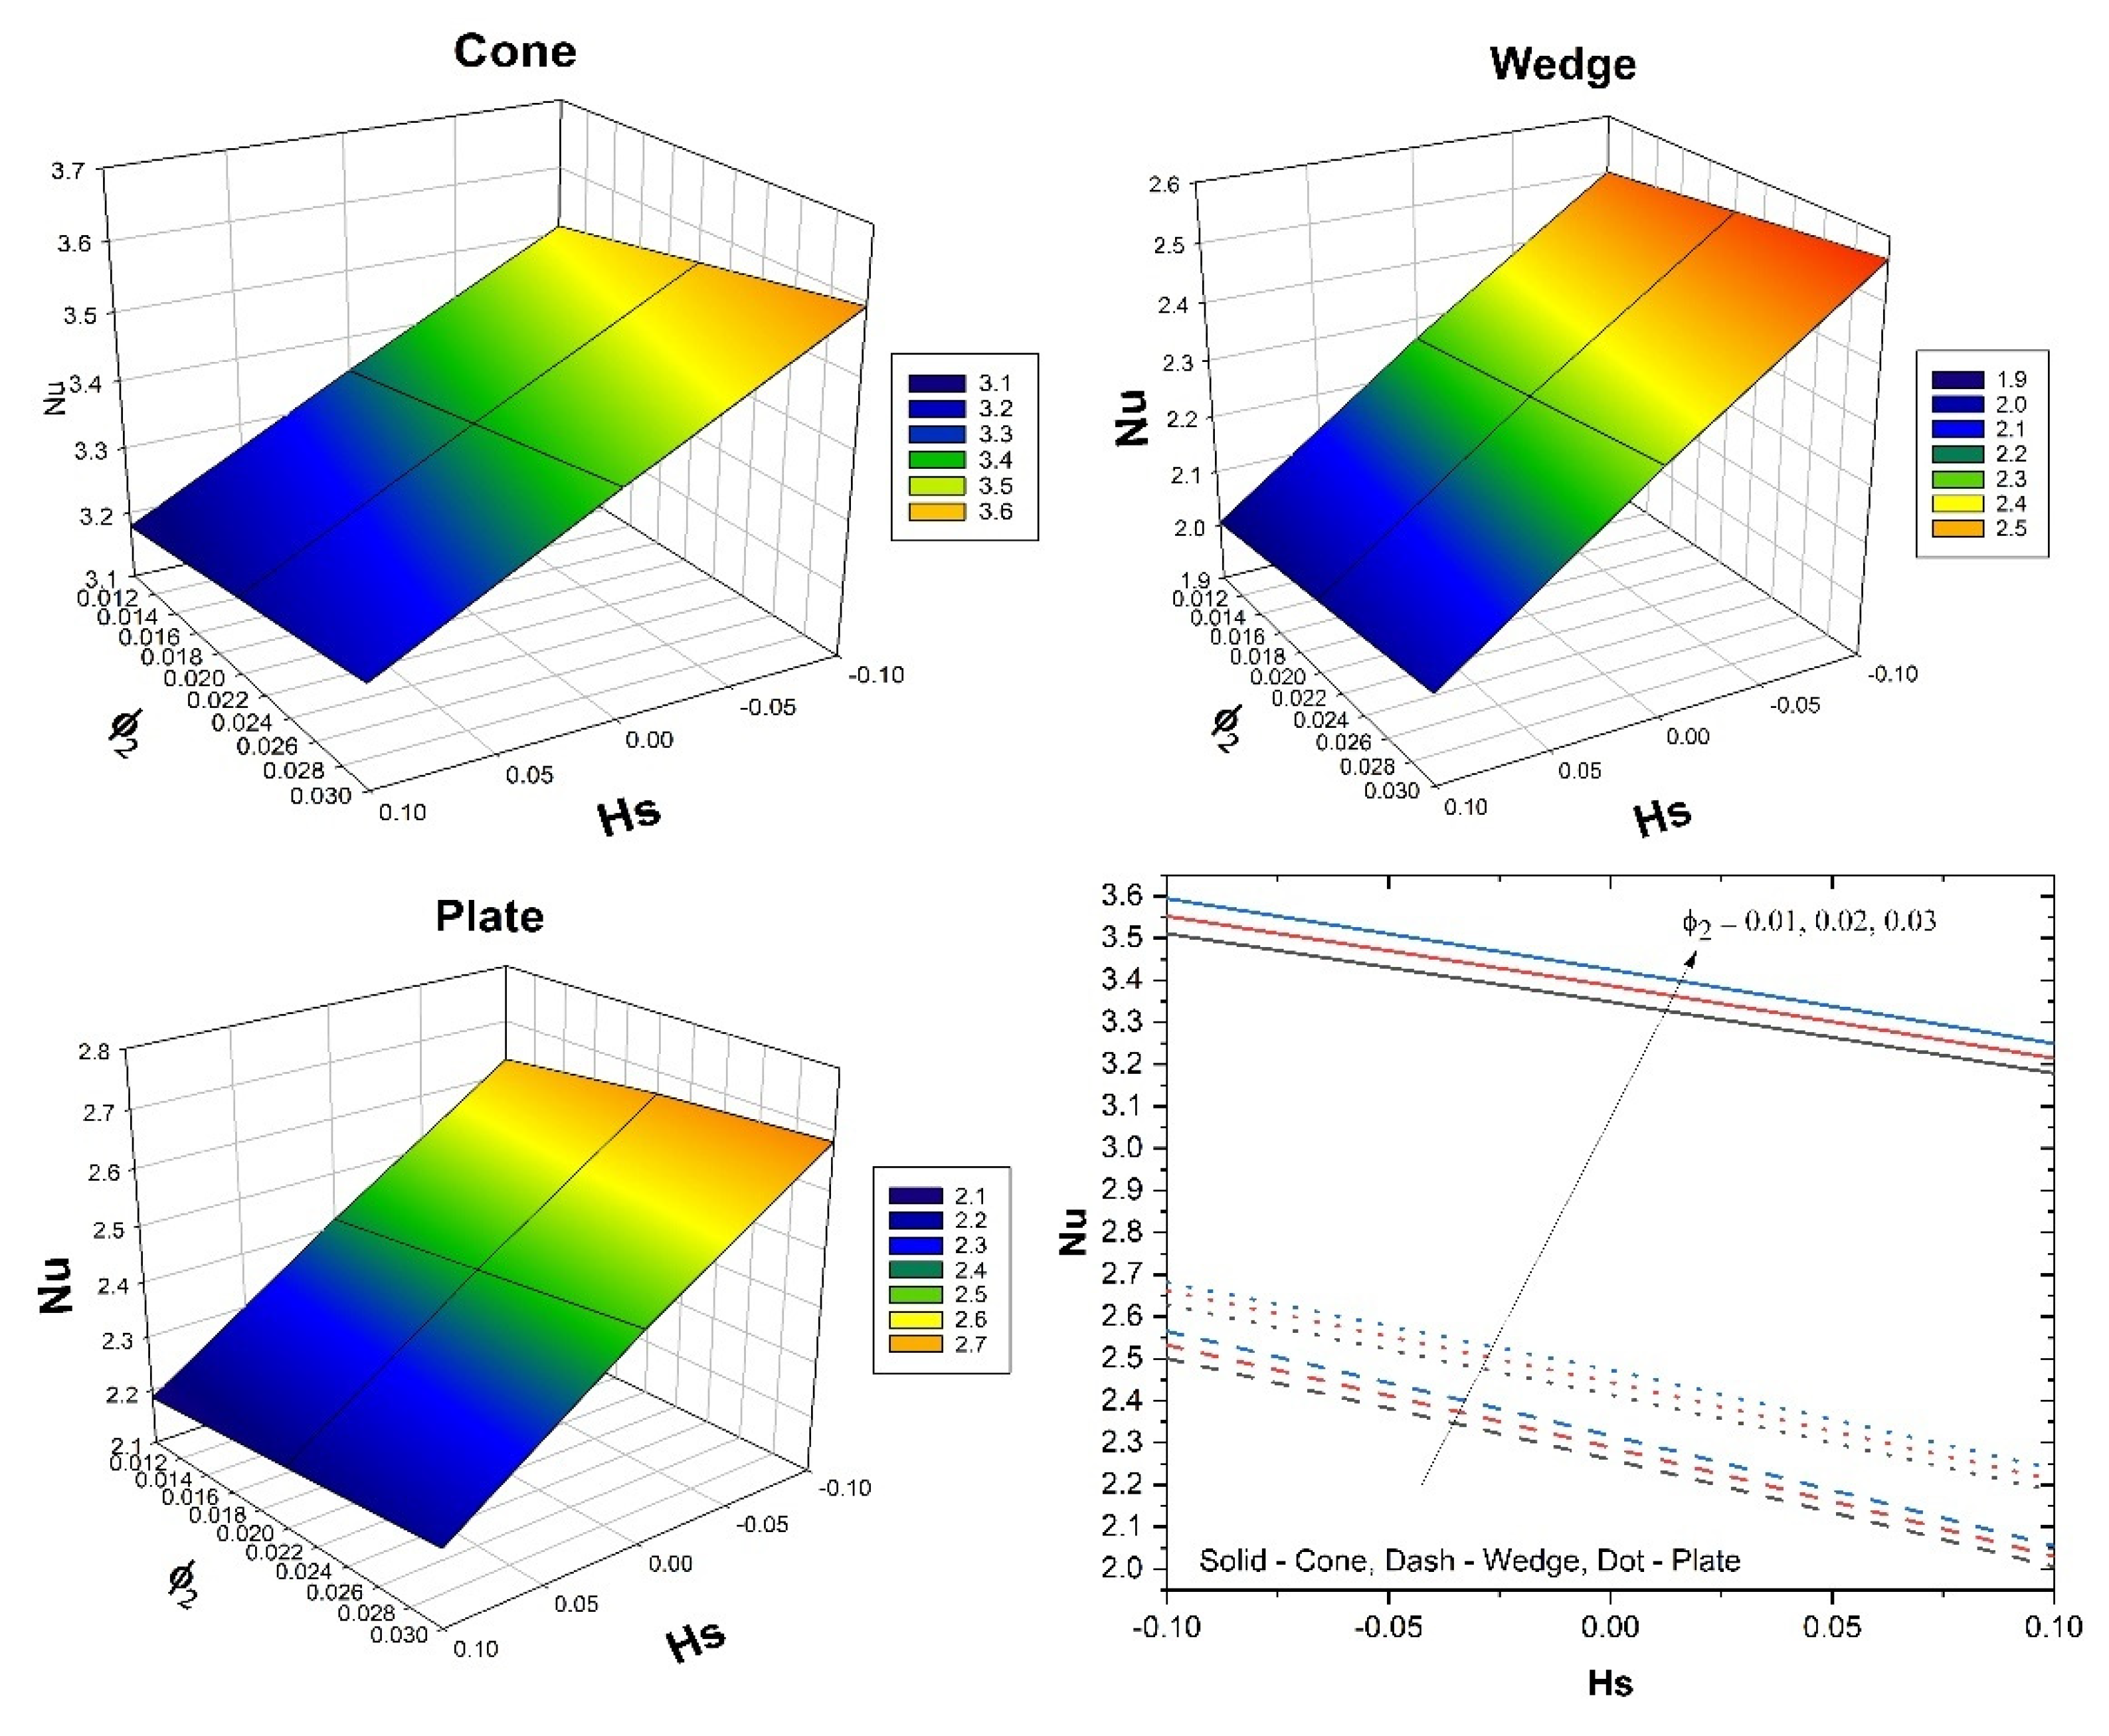
Figure 8 shows the impact of on the skin friction versus the for all the three flow cases. Additionally, the three-dimensional plots in Figure 8 show variation in skin friction for varied values of and . Here, the augmented values improve the skin friction for all three flow cases, but the inverse behaviour is seen for improved values. Further, the case of fluid flow past the cone shows improved skin friction than the remaining cases. The influence of on the Nusselt number versus for all the three flow cases is shown in Figure 9. Additionally, the three-dimensional plots in Figure 9 show the variation in the Nusselt number for varied and values. Here, the augmented values improve the heat transfer rate for all three flow cases, but the inverse behaviour is seen for improved values. Furthermore, in the case of fluid flow past a cone, an improved heat transfer rate is seen than the remaining cases. The influence of on the Sherwood number versus the for all the three flow cases is shown in Figure 10. Additionally, the three-dimensional plots in Figure 9 show the variation in the Sherwood number for varied and values. Here, the augmented and values decrease the mass transfer rate in all three flow cases. Further, the case of fluid flow past a cone shows improved mass transfer rates than the remaining cases. Table 4 shows the variation in for various parameters in the cone case when for different volume fraction combinations. The increase in the values enhances the surface drag force coefficient. From the table, it can be observed that the surface drag force coefficient is higher for the hybrid nanofluid than it is for the nanofluid. This is due to variation in the buoyancy forces caused by the temperature differences. The reverse trend is seen in the case of the coefficient for the rate of thermal distribution. An increase in the values reduces the surface drag force coefficient and enhances the rate of thermal distribution. This is due to the presence of the porous medium experiencing the frictional force. It can be seen from the table that in both the cases, the hybrid nanofluid shows better performance than the nanofluid does. An increase in the values increases the surface drag force and thermal distribution coefficients. An increase in the values helps the distribution of heat from the system to the fluid. The Hybrid nanofluid demonstrated better performance than the nanofluid did. Table 5 displays the variation in and for various parameters in the wedge case when for different volume fraction combinations. The surface drag force coefficient increases as the values increase. In the case of the coefficient for the rate of thermal dispersion, the opposite tendency is observed. An increase in the values decreases the surface drag force coefficient and increases the rate of heat dispersion. Increases in the values increase the surface drag force and heat distribution coefficients. The table shows that in both cases, the hybrid nanofluid has a greater impact than the nanofluid. Table 5 displays the variation in and for various parameters in the plate case when for different volume fraction combinations. The surface drag force coefficient increases as the value increases. In the case of the coefficient for the rate of thermal dispersion, the opposite behavior is observed. An increase in the values decreases the surface drag force coefficient and increases the pace of heat dispersion. As the values rise, so do the surface drag force and thermal dispersion coefficients. The table demonstrates that hybrid nanofluid has a bigger influence than nanofluid does in both circumstances. From Table 4, Table 5 and Table 6, it is clear that the surface drag force and rate of thermal distribution coefficients have a greater impact in the plate case than in the cone and wedge cases. Table 7 shows the variation in for various parameters for all three flow cases when . It can be observed form Table 6 that an increase in the values improves the coefficient for the mass transfer rate. An improvement in the values decreases the coefficient for the mass transfer rate. Increases in the values reduce the coefficient for the mass transfer rate. In the case of , , and the influence of the nanofluid is greater than that of the hybrid nanofluid. For all three cases, the wedge shows a better coefficient for mass transfer rate than the other two geometries.
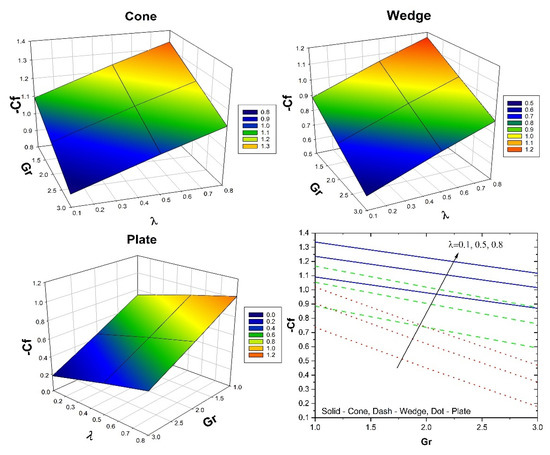
Figure 8.
The upshot of on skin friction versus for all the three flow cases.
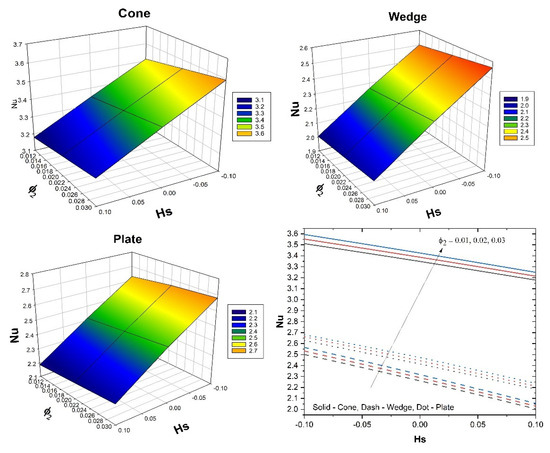
Figure 9.
The upshot of on Nusselt number versus for all the three flow cases.
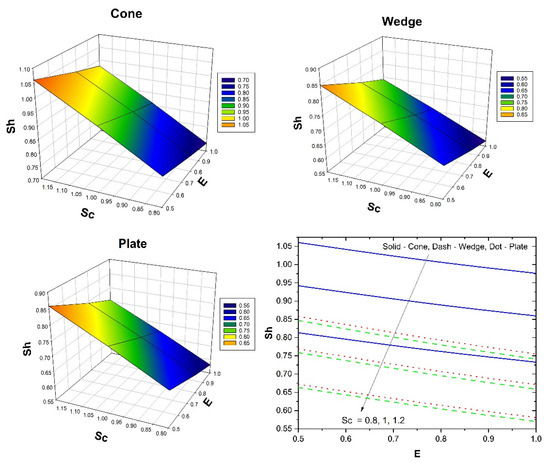
Figure 10.
The upshot of on Sherwood number versus for all the three flow cases.
Table 4.
Variation in for various parameters in the cone when .
Table 5.
Variation in for various parameters in the wedge when .
Table 6.
Variation in for various parameters in plate when .
Table 7.
Variation in for various parameters in three geometries when .
5. Conclusions
The present research investigates the effect of heat source/sink on nanofluid flow through a cone, wedge, and plate when a suspension of aluminium alloys (AA7072 and AA7075) is used as nanoparticles in base liquid water. The activation energy and porous material are also considered in the modelling. By employing the appropriate transformations, a set of governing equations was reduced to ODEs, which were then numerically solved using the RKF-45 process using the shooting approach. Graphically, the behaviour of the concentration, temperature, and velocity fields is examined. The main conclusions of the study are listed below:
- -
- The for the case of fluid flow past cone declines faster for growing values than in the remaining two cases.
- -
- The for the case of fluid flow past the plate increases faster with growing values than in the remaining two cases.
- -
- The case of fluid flow past the plate shows improved heat transfer for augmented values than in the remaining two cases. Further, we observed the least heat transfer in the case of fluid flow past the cone.
- -
- The for the case of fluid flow past the cone increases slower with growing values than in the remaining cases. Moreover, we observed higher mass transfer in the case of fluid flow past the plate.
- -
- The for the case of fluid flow past the wedge declines more slowly for growing values than in the remaining cases. Furthermore, we observed higher mass transfer in the case of fluid flow past the wedge.
- -
- Augmented values improved the heat transfer rate for all three flow cases, but the inverse behaviour was seen for improved values. Further, the case of fluid flow past the cone shows an improved heat transfer rate than the remaining two cases.
Author Contributions
Formal analysis, J.K.M.; investigation, M.B.R. and K.R.R.; writing—original draft preparation, B.C.P.; writing—review and editing, I.E.S. All authors have read and agreed to the published version of the manuscript.
Funding
This research received no external funding.
Conflicts of Interest
The authors declare no conflict of interest.
References
- Gul, T.; Kashifullah, M.; Bilal, W.; Alghamdi, M.I.; Asjad, T. Abdeljawad. Hybrid nanofluid flow within the conical gap between the cone and the surface of a rotating disk. Sci. Res. 2021, 11, 1180. [Google Scholar] [CrossRef]
- Abbas, N.; Nadeem, S.; Saleem, A.; Malik, M.Y.; Issakhov, A.; Alharbi, F.M. Models base study of inclined MHD of hybrid nanofluid flow over nonlinear stretching cylinder. Chin. J. Phys. 2021, 69, 109–117. [Google Scholar] [CrossRef]
- Madhukesh, J.K.; Naveen Kumar, R.; Punith Gowda, R.J.; Prasannakumara, B.C.; Ramesh, G.K.; Ijaz Khan, M.; Ullah Khan, S.; Chu, Y.-M. Numerical simulation of AA7072-AA7075/water-based hybrid nanofluid flow over a curved stretching sheet with Newtonian heating: A non-Fourier heat flux model approach. J. Mol. Liq. 2021, 335, 116103. [Google Scholar] [CrossRef]
- Gowda, R.J.; Naveenkumar, E.; Madhukesh, J.K.; Prasannakumara, B.C.; Gorla, R.S.R. Theoretical analysis of SWCNT-MWCNT/H2O hybrid flow over an upward/downward moving rotating disk. Proc. Inst. Mech. Eng. Part N J. Nanomater. Nanoeng. Nanosyst. 2021, 235, 97–106. [Google Scholar] [CrossRef]
- Mabood, F.; Yusuf, T.A.; Khan, W.A. Cu-Al2O3-H2O hybrid nanofluid flow with melting heat transfer, irreversibility analysis and nonlinear thermal radiation. J. Therm. Anal. Calorim. 2021, 143, 973–984. [Google Scholar] [CrossRef]
- Waini, I.; Ishak, A.; Pop, I. MHD flow and heat transfer of a hybrid nanofluid past a permeable stretching/shrinking wedge. Appl. Math. Mech. 2020, 41, 507–520. [Google Scholar] [CrossRef]
- Maleki, H.; Safaei, M.R.; Togun, H.; Dahari, M. Heat transfer and fluid flow of pseudo-plastic nanofluid over a moving permeable plate with viscous dissipation and heat absorption/generation. J. Therm. Anal. Calorim. 2019, 135, 1643–1654. [Google Scholar] [CrossRef]
- Anwar, T.; Kumam, P.; Khan, I.; Thounthong, P. An exact analysis of radiative heat transfer and unsteady MHD convective flow of a second-grade fluid with ramped wall motion and temperature. Heat Transf. 2021, 50, 196–219. [Google Scholar] [CrossRef]
- Kumar, M.A.; Reddy, Y.D.; Rao, V.S.; Goud, B.S. Thermal radiation impact on MHD heat transfer natural convective nano fluid flow over an impulsively started vertical plate. Case Stud. Therm. Eng. 2021, 24, 100826. [Google Scholar] [CrossRef]
- Khan, S.A.; Hayat, T.; Ijaz Khan, M.; Alsaedi, A. Salient features of Dufour and Soret effect in radiative MHD flow of viscous fluid by a rotating cone with entropy generation. Int. J. Hydrogen Energy 2020, 45, 14552–14564. [Google Scholar] [CrossRef]
- Reddy, S.; Sreedevi, P.; Chamkha, A. Maxwell hybrid nanoliquid flow over vertical cone with Cattaneo-Christov heat flux and convective boundary condition. Authorea Prepr. 2020. [Google Scholar] [CrossRef]
- Mahanthesh, B.; Makinde, O.D.; Gireesha, B.J.; Krupalakshmi, K.L.; Animasaun, I.L. Two-Phase Flow of Dusty Casson Fluid with Cattaneo-Christov Heat Flux and Heat Source Past a Cone, Wedge and Plate. Defect Diffus. Forum 2018, 387, 625–639. [Google Scholar] [CrossRef]
- Dawar, A.; Shah, Z.; Tassaddiq, A.; Kumam, P.; Islam, S.; Khan, W. A convective flow of Williamson nanofluid through cone and wedge with non-isothermal and non-isosolutal conditions: A revised Buongiorno model. Case Stud. Therm. Eng. 2021, 24, 100869. [Google Scholar] [CrossRef]
- Muntazir, R.M.A.; Mushtaq, M.; Jabeen, K. A Numerical Study of MHD Carreau Nanofluid Flow with Gyrotactic Microorganisms over a Plate, Wedge, and Stagnation Point. Math. Probl. Eng. 2021, e5520780. [Google Scholar] [CrossRef]
- Jamshed, W.; Nisar, K.S.; Gowda, R.J.; Kumar, R.N.; Prasannakumara, B.C. Radiative heat transfer of second grade nanofluid flow past a porous flat surface: A single-phase mathematical model. Phys. Scr. 2021, 96, 064006. [Google Scholar] [CrossRef]
- Punith Gowda, R.J.; Naveen Kumar, R.; Prasannakumara, B.C. Two-Phase Darcy-Forchheimer Flow of Dusty Hybrid Nanofluid with Viscous Dissipation Over a Cylinder. Int. J. Appl. Comput. Math. 2021, 7, 95. [Google Scholar] [CrossRef]
- Naveen Kumar, R.; Gowda, R.J.; Gireesha, B.J.; Prasannakumara, B.C. Non-Newtonian hybrid nanofluid flow over vertically upward/downward moving rotating disk in a Darcy-Forchheimer porous medium. Eur. Phys. J. Spec. Top. 2021, 230, 1227–1237. [Google Scholar] [CrossRef]
- Jawad, M.; Saeed, A.; Kumam, P.; Shah, Z.; Khan, A. Analysis of boundary layer MHD Darcy-Forchheimer radiative nanofluid flow with soret and dufour effects by means of marangoni convection. Case Stud. Therm. Eng. 2021, 23, 100792. [Google Scholar] [CrossRef]
- Madhukesh, J.K.; Ramesh, G.K.; Prasannakumara, B.C.; Shehzad, S.A.; Abbasi, F.M. Bio-Marangoni convection flow of Casson nanoliquid through a porous medium in the presence of chemically reactive activation energy. Appl. Math. Mech. 2021, 42, 1191–1204. [Google Scholar] [CrossRef]
- Madhukesh, J.; Alhadhrami, A.; Naveen Kumar, R.; Punith Gowda, R.; Prasannakumara, B.; Varun Kumar, R. Physical insights into the heat and mass transfer in Casson hybrid nanofluid flow induced by a Riga plate with thermophoretic particle deposition. Proc. Inst. Mech. Eng. Part E J. Process Mech. Eng. 2021, 09544089211039305. [Google Scholar] [CrossRef]
- Longo, S.; Di Federico, V.; Chiapponi, L.; Archetti, R. Experimental verification of power-law non-Newtonian axisymmetric porous gravity currents. J. Fluid Mech. 2013, 731, R2. [Google Scholar] [CrossRef] [Green Version]
- Di Federico, V.; Longo, S.; Chiapponi, L.; Archetti, R.; Ciriello, V. Radial gravity currents in vertically graded porous media: Theory and experiments for Newtonian and power-law fluids. Adv. Water Resour. 2014, 70, 65–76. [Google Scholar] [CrossRef]
- Longo, S.; Di Federico, V. Axisymmetric gravity currents within porous media: First order solution and experimental validation. J. Hydrol. 2014, 519, 238–247. [Google Scholar] [CrossRef]
- Longo, S.; Ciriello, V.; Chiapponi, L.; Di Federico, V. Combined effect of rheology and confining boundaries on spreading of gravity currents in porous media. Adv. Water Resour. 2015, 79, 140–152. [Google Scholar] [CrossRef]
- Longo, S.; Di Federico, V.; Chiapponi, L. A dipole solution for power-law gravity currents in porous formations. J. Fluid Mech. 2015, 778, 534–551. [Google Scholar] [CrossRef]
- Longo, S.; Di Federico, V. Unsteady Flow of Shear-Thinning Fluids in Porous Media with Pressure-Dependent Properties. Transp. Porous. Med. 2015, 110, 429–447. [Google Scholar] [CrossRef]
- Ciriello, V.; Longo, S.; Chiapponi, L.; Di Federico, V. Porous gravity currents: A survey to determine the joint influence of fluid rheology and variations of medium properties. Adv. Water Resour. 2016, 92, 105–115. [Google Scholar] [CrossRef]
- Di Federico, V.; Longo, S.; King, S.E.; Chiapponi, L.; Petrolo, D.; Ciriello, V. Gravity-driven flow of Herschel-Bulkley fluid in a fracture and in a 2D porous medium. J. Fluid Mech. 2017, 821, 59–84. [Google Scholar] [CrossRef] [Green Version]
- Awais, M.; Bilal, S.; Malik, M.Y. Numerical Analysis of Magnetohydrodynamic Navier’s Slip Visco Nanofluid Flow Induced by Rotating Disk with Heat Source/Sink. Commun. Theor. Phys. 2019, 71, 1075. [Google Scholar] [CrossRef]
- Nadeem, S.; Ijaz, M.; Ayub, M. Darcy-Forchheimer flow under rotating disk and entropy generation with thermal radiation and heat source/sink. J. Therm. Anal. Calorim. 2021, 143, 2313–2328. [Google Scholar] [CrossRef]
- Ramzan, M.; Shaheen, N.; Kadry, S.; Ratha, Y.; Nam, Y. Thermally Stratified Darcy Forchheimer Flow on a Moving Thin Needle with Homogeneous Heterogeneous Reactions and Non-Uniform Heat Source/Sink. Appl. Sci. 2020, 10, 432. [Google Scholar] [CrossRef] [Green Version]
- Upreti, H.; Pandey, A.K.; Kumar, M.; Makinde, O.D. Ohmic Heating and Non-uniform Heat Source/Sink Roles on 3D Darcy—Forchheimer Flow of CNTs Nanofluids Over a Stretching Surface. Arab. J. Sci. Eng. 2020, 45, 7705–7717. [Google Scholar] [CrossRef]
- Jamaludin, A.; Naganthran, K.; Nazar, R.; Pop, I. MHD mixed convection stagnation-point flow of Cu-Al2O3/water hybrid nanofluid over a permeable stretching/shrinking surface with heat source/sink. Eur. J. Mech. B Fluids 2020, 84, 71–80. [Google Scholar] [CrossRef]
- Ramesh, G.K.; Madhukesh, J.K. Activation energy process in hybrid CNTs and induced magnetic slip flow with heat source/sink. Chin. J. Phys. 2021, 73, 375–390. [Google Scholar] [CrossRef]
- Zaib, A.; Rashidi, M.M.; Chamkha, A.J.; Mohammad, N.F. Impact of nonlinear thermal radiation on stagnation-point flow of a Carreau nanofluid past a nonlinear stretching sheet with binary chemical reaction and activation energy. Proc. Inst. Mech. Eng. Part C J. Mech. Eng. Sci. 2018, 232, 962–972. [Google Scholar] [CrossRef]
- Ijaz, M.; Ayub, M.; Malik, M.Y.; Khan, H.; Alderremy, A.A.; Aly, S. Entropy analysis in nonlinearly convective flow of the Sisko model in the presence of Joule heating and activation energy: The Buongiorno model. Phys. Scr. 2020, 95, 025402. [Google Scholar] [CrossRef]
- Ramesh, G.K.; Madhukesh, J.K.; Prasannakumara, B.C.; Roopa, G.S. Significance of aluminium alloys particle flow through a parallel plates with activation energy and chemical reaction. J. Therm. Anal. Calorim. 2021. [Google Scholar] [CrossRef]
- Bhatti, M.M.; Michaelides, E.E. Study of Arrhenius activation energy on the thermo-bioconvection nanofluid flow over a Riga plate. J. Therm. Anal. Calorim. 2021, 143, 2029–2038. [Google Scholar] [CrossRef]
- Khan, M.N.; Nadeem, S. A comparative study between linear and exponential stretching sheet with double stratification of a rotating Maxwell nanofluid flow. Surf. Interfaces 2021, 22, 100886. [Google Scholar] [CrossRef]
- Vajravelu, K.; Nayfeh, J. Hydromagnetic convection at a cone and a wedge. Int. Commun. Heat Mass Transf. 1992, 19, 701–710. [Google Scholar] [CrossRef]
- Chetteti, R.; Chukka, V.R. Effects of Arrhenius Activation Energy and Binary Chemical Reaction on Convective Flow of a Nanofluid over Frustum of a Cone with Convective Boundary Condition. Int. J. Chem. React. Eng. 2018, 16, 20160188. [Google Scholar] [CrossRef]
- Ali, M.E.; Sandeep, N. Cattaneo-Christov model for radiative heat transfer of magnetohydrodynamic Casson-ferrofluid: A numerical study. Results Phys. 2017, 7, 21–30. [Google Scholar] [CrossRef] [Green Version]
- Devi, S.A.; Devi, S.S.U. Numerical Investigation of Hydromagnetic Hybrid Cu–Al2O3/Water Nanofluid Flow over a Permeable Stretching Sheet with Suction. Int. J. Nonlinear Sci. Numer. Simul. 2016, 17, 249–257. [Google Scholar] [CrossRef]
- Hayat, T.; Saif, R.S.; Ellahi, R.; Muhammad, T.; Ahmad, B. Numerical study for Darcy-Forchheimer flow due to a curved stretching surface with Cattaneo-Christov heat flux and homogeneous-heterogeneous reactions. Results Phys. 2017, 7, 2886–2892. [Google Scholar] [CrossRef]
- Olatundun, A.T.; Makinde, O.D. Analysis of Blasius Flow of Hybrid Nanofluids over a Convectively Heated Surface. Defect Diffus. Forum 2017, 377, 29–41. [Google Scholar] [CrossRef]
- Hassanien, I.A.; Abdullah, A.A.; Gorla, R.S.R. Flow and heat transfer in a power-law fluid over a nonisothermal stretching sheet. Math. Comput. Model. 1998, 28, 105–116. [Google Scholar] [CrossRef]
- Salleh, M.Z.; Nazar, R.; Pop, I. Boundary layer flow and heat transfer over a stretching sheet with Newtonian heating. J. Taiwan Inst. Chem. Eng. 2010, 41, 651–655. [Google Scholar] [CrossRef]
- Kameswaran, K.; Shaw, S.; Sibanda, P.; Murthy, P.V.S.N. Homogeneous-heterogeneous reactions in a nanofluid flow due to a porous stretching sheet. Int. J. Heat Mass Transf. 2013, 57, 465–472. [Google Scholar] [CrossRef]


Publisher’s Note: MDPI stays neutral with regard to jurisdictional claims in published maps and institutional affiliations. |
© 2022 by the authors. Licensee MDPI, Basel, Switzerland. This article is an open access article distributed under the terms and conditions of the Creative Commons Attribution (CC BY) license (https://creativecommons.org/licenses/by/4.0/).