
Determination of Transdermal Rate of Metallic Microneedle Array through an Impedance Measurements-Based Numerical Check Screening Algorithm

 ,
,
Abstract
:1. Introduction
2. Materials and Methods
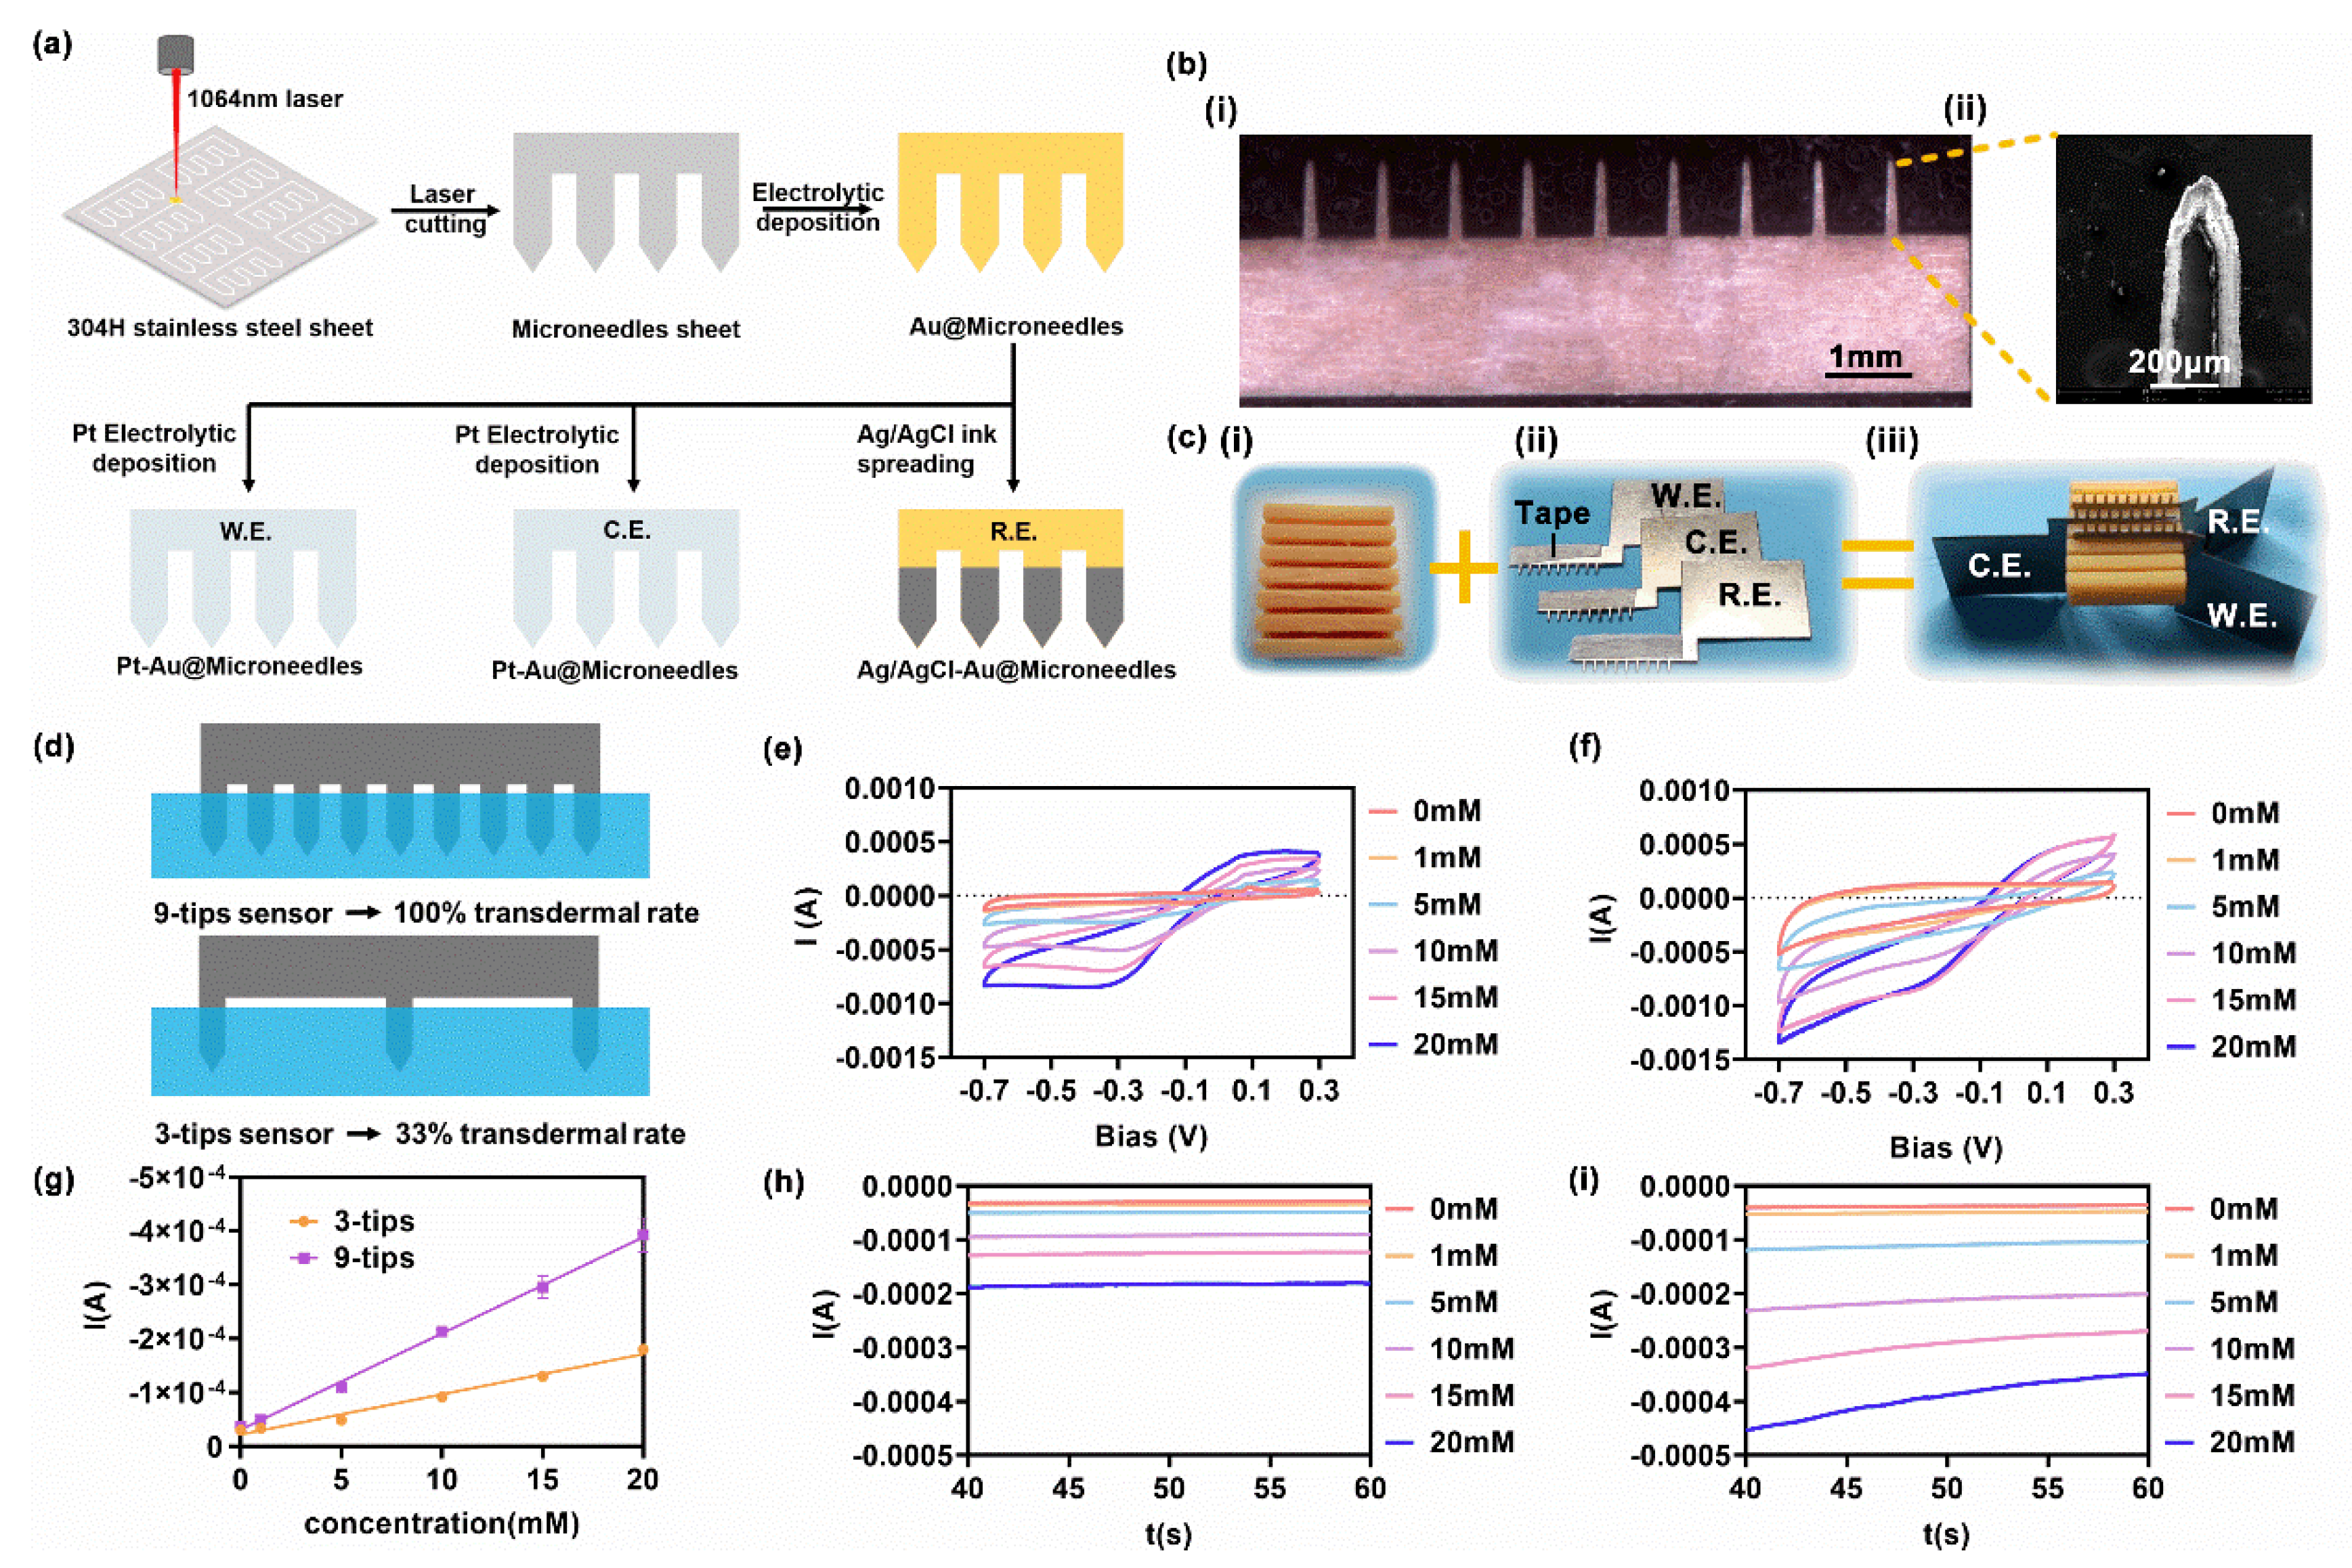
2.1. Fabrication of the Metallic Sheet Microneedle Sensor
2.2. In Vitro H2O2 Sensing
2.3. Finite Element Model
2.3.1. Geometry and Materials
2.3.2. Physics Setup and Study Strategy
2.4. Estimation of Microneedle Array Characteristics
3. Results and Discussion
3.1. In Vitro H2O2 Sensing
3.2. Relation between Transdermal Rate and Test Current
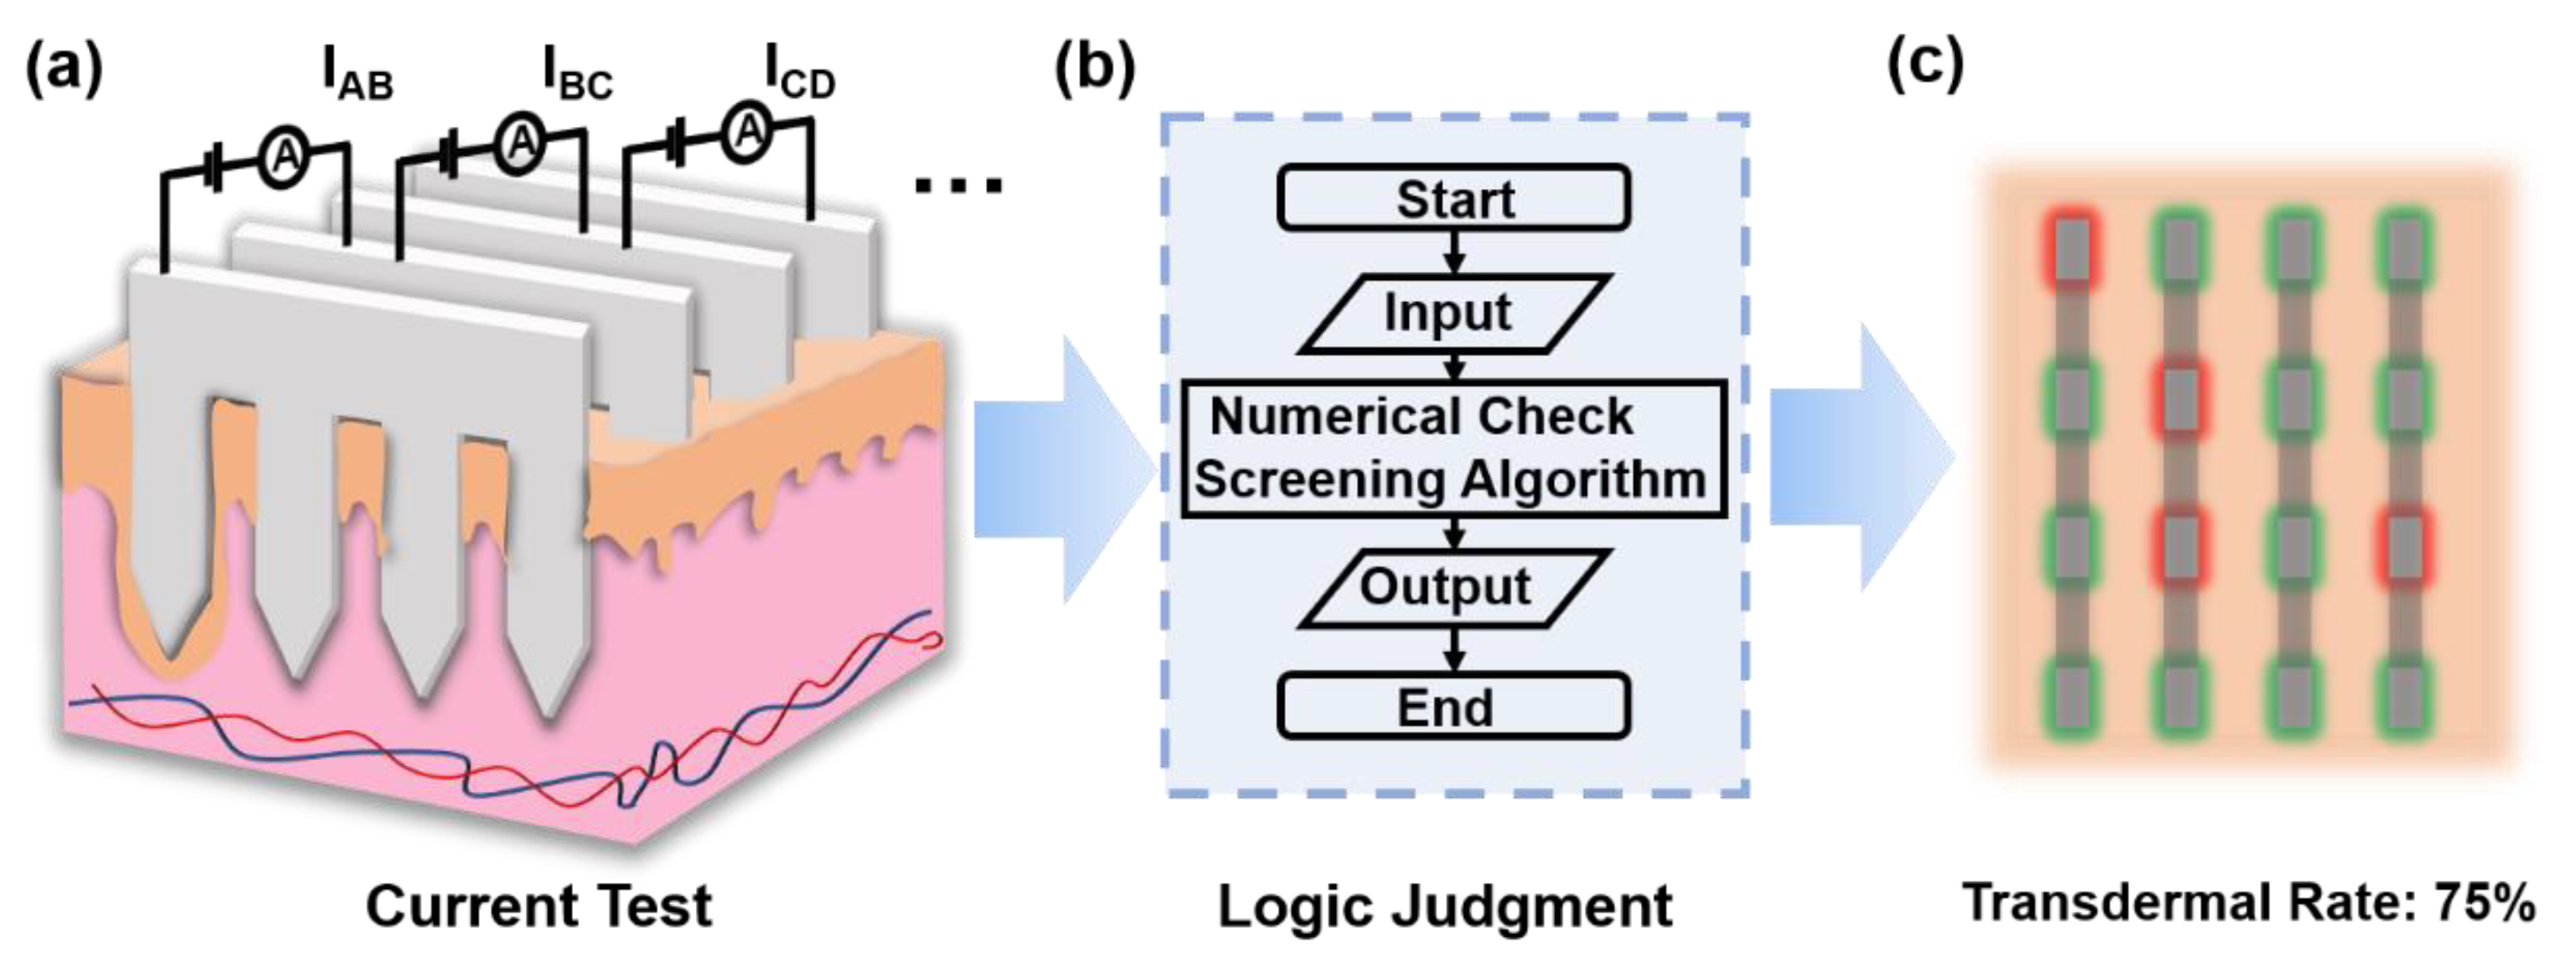
3.3. Transdermal Rate Evaluation via a Test Current
3.3.1. Exact Method
3.3.2. Fuzzy Logic Method
4. Conclusions
Supplementary Materials
Author Contributions
Funding
Data Availability Statement
Acknowledgments
Conflicts of Interest
References
- Drain, P.K.; Hyle, E.P.; Noubary, F.; Freedberg, K.A.; Wilson, D.; Bishai, W.R.; Rodriguez, W.; Bassett, I.V. Diagnostic point-of-care tests in resource-limited settings. Lancet Infect. Dis. 2014, 14, 239–249. [Google Scholar] [CrossRef] [Green Version]
- Vashist, S.K.; Luppa, P.B.; Yeo, L.Y.; Ozcan, A.; Luong, J.H.T. Emerging Technologies for Next-Generation Point-of-Care Testing. Trends Biotechnol. 2015, 33, 692–705. [Google Scholar] [CrossRef] [PubMed]
- Roberts, J.D.; Wells, G.A.; Le May, M.R.; Labinaz, M.; Glover, C.; Froeschl, M.; Dick, A.; Marquis, J.-F.; O’Brien, E.; Goncalves, S.; et al. Point-of-care genetic testing for personalisation of antiplatelet treatment (RAPID GENE): A prospective, randomised, proof-of-concept trial. Lancet 2012, 379, 1705–1711. [Google Scholar] [CrossRef]
- Baltekin, O.; Boucharin, A.; Tano, E.; Andersson, D.I.; Elf, J. Antibiotic susceptibility testing in less than 30 min using direct single-cell imaging. Proc. Natl. Acad. Sci. USA 2017, 114, 9170–9175. [Google Scholar] [CrossRef] [PubMed] [Green Version]
- Chen, H.; Liu, K.; Li, Z.; Wang, P. Point of care testing for infectious diseases. Clin. Chim. Acta 2019, 493, 138–147. [Google Scholar] [CrossRef] [PubMed]
- Liu, Z.; Liu, J.; Sun, T.; Zeng, D.; Yang, C.; Wang, H.; Yang, C.; Guo, J.; Wu, Q.; Chen, H.J.; et al. Integrated Multiplex Sensing Bandage for In Situ Monitoring of Early Infected Wounds. ACS Sens. 2021, 6, 3112–3124. [Google Scholar] [CrossRef] [PubMed]
- Feng, W.; Newbigging, A.M.; Le, C.; Pang, B.; Peng, H.; Cao, Y.; Wu, J.; Abbas, G.; Song, J.; Wang, D.-B.; et al. Molecular Diagnosis of COVID-19: Challenges and Research Needs. Anal. Chem. 2020, 92, 10196–10209. [Google Scholar] [CrossRef]
- Dincer, C.; Bruch, R.; Costa-Rama, E.; Teresa Fernandez-Abedu, M.; Merkoci, A.; Manz, A.; Urban, G.A.; Gueder, F. Disposable Sensors in Diagnostics, Food, and Environmental Monitoring. Adv. Mater. 2019, 31, e1806739. [Google Scholar] [CrossRef]
- Ghaffari, A.; Meurant, R.; Ardakani, A. COVID-19 Serological Tests: How Well Do They Actually Perform? Diagnostics 2020, 10, 453. [Google Scholar] [CrossRef]
- Li, X.; Huang, X.; Mo, J.; Wang, H.; Huang, Q.; Yang, C.; Zhang, T.; Chen, H.J.; Hang, T.; Liu, F.; et al. A Fully Integrated Closed-Loop System Based on Mesoporous Microneedles-Iontophoresis for Diabetes Treatment. Adv. Sci. (Weinh) 2021, 8, e2100827. [Google Scholar] [CrossRef]
- Soh, J.H.; Chan, H.-M.; Ying, J.Y. Strategies for developing sensitive and specific nanoparticle-based lateral flow assays as point-of-care diagnostic device. Nano Today 2020, 30, 100831. [Google Scholar] [CrossRef]
- Jung, W.E.; Han, J.; Choi, J.-W.; Ahn, C.H. Point-of-care testing (POCT) diagnostic systems using microfluidic lab-on-a-chip technologies. Microelectron. Eng. 2015, 132, 46–57. [Google Scholar] [CrossRef]
- Goerlinger, K.; Dirkmann, D.; Hanke, A.A.; Kamler, M.; Kottenberg, E.; Thielmann, M.; Jakob, H.; Peters, J. First-line Therapy with Coagulation Factor Concentrates Combined with Point-of-Care Coagulation Testing Is Associated with Decreased Allogeneic Blood Transfusion in Cardiovascular Surgery A Retrospective, Single-center Cohort Study. Anesthesiology 2011, 115, 1179–1191. [Google Scholar] [CrossRef] [PubMed] [Green Version]
- Weber, C.F.; Goerlinger, K.; Meininger, D.; Herrmann, E.; Bingold, T.; Moritz, A.; Cohn, L.H.; Zacharowski, K. Point-of-Care Testing A Prospective, Randomized Clinical Trial of Efficacy in Coagulopathic Cardiac Surgery Patients. Anesthesiology 2012, 117, 531–547. [Google Scholar] [CrossRef] [Green Version]
- Schmitt, F.C.F.; Manolov, V.; Morgenstern, J.; Fleming, T.; Heitmeier, S.; Uhle, F.; Al-Saeedi, M.; Hackert, T.; Bruckner, T.; Schoechl, H.; et al. Acute fibrinolysis shutdown occurs early in septic shock and is associated with increased morbidity and mortality: Results of an observational pilot study. Ann. Intensive Care 2019, 9, 1–15. [Google Scholar] [CrossRef]
- Halder, J.; Gupta, S.; Kumari, R.; Gupta, G.D.; Rai, V.K. Microneedle Array: Applications, Recent Advances, and Clinical Pertinence in Transdermal Drug Delivery. J. Pharm. Innov. 2021, 16, 558–565. [Google Scholar] [CrossRef]
- Yadav, P.R.; Han, T.; Olatunji, O.; Pattanayek, S.K.; Das, D.B. Mathematical Modelling, Simulation and Optimisation of Microneedles for Transdermal Drug Delivery: Trends and Progress. Pharmaceutics 2020, 12, 693. [Google Scholar] [CrossRef]
- Kim, E.; Erdos, G.; Huang, S.; Kenniston, T.W.; Balmert, S.C.; Carey, C.D.; Raj, V.S.; Epperly, M.W.; Klimstra, W.B.; Haagmans, B.L.; et al. Microneedle array delivered recombinant coronavirus vaccines: Immunogenicity and rapid translational development. EBioMedicine 2020, 55, 102743. [Google Scholar] [CrossRef]
- Teymourian, H.; Tehrani, F.; Mahato, K.; Wang, J. Lab under the Skin: Microneedle Based Wearable Devices. Adv. Healthc Mater. 2021, 10, e2002255. [Google Scholar] [CrossRef]
- Singh, A.; Yadav, S. Microneedling: Advances and widening horizons. Indian Dermatol. Online J. 2016, 7, 244–254. [Google Scholar]
- Guillot, A.J.; Cordeiro, A.S.; Donnelly, R.F.; Montesinos, M.C.; Garrigues, T.M.; Melero, A. Microneedle-Based Delivery: An Overview of Current Applications and Trends. Pharmaceutics 2020, 12, 569. [Google Scholar] [CrossRef] [PubMed]
- Lee, K.J.; Jeong, S.S.; Roh, D.H.; Kim, D.Y.; Choi, H.K.; Lee, E.H. A practical guide to the development of microneedle systems—In clinical trials or on the market. Int. J. Pharm. 2020, 573, 118778. [Google Scholar] [CrossRef] [PubMed]
- Baek, S.H.; Shin, J.H.; Kim, Y.C. Drug-coated microneedles for rapid and painless local anesthesia. Biomed. Microdevices 2017, 19, 2. [Google Scholar] [CrossRef] [PubMed]
- Yang, T.; Huang, D.; Li, C.; Zhao, D.; Li, J.; Zhang, M.; Chen, Y.; Wang, Q.; Liang, Z.; Liang, X.-J.; et al. Rolling microneedle electrode array (RoMEA) empowered nucleic acid delivery and cancer immunotherapy. Nano Today 2021, 36, 101017. [Google Scholar] [CrossRef]
- Liu, F.; Lin, Z.; Jin, Q.; Wu, Q.; Yang, C.; Chen, H.J.; Cao, Z.; Lin, D.A.; Zhou, L.; Hang, T.; et al. Protection of Nanostructures-Integrated Microneedle Biosensor Using Dissolvable Polymer Coating. ACS Appl. Mater. Interfaces 2019, 11, 4809–4819. [Google Scholar] [CrossRef] [PubMed]
- Shu, W.; Heimark, H.; Bertollo, N.; Tobin, D.J.; O’Cearbhaill, E.D.; Annaidh, A.N. Insights into the mechanics of solid conical microneedle array insertion into skin using the finite element method. Acta Biomater. 2021, 135, 403–413. [Google Scholar] [CrossRef]
- Sawon, M.A.; Samad, M.F. Design and optimization of a microneedle with skin insertion analysis for transdermal drug delivery applications. J. Drug Deliv. Sci. Technol. 2021, 63, 102477. [Google Scholar] [CrossRef]
- Makvandi, P.; Kirkby, M.; Hutton, A.R.J.; Shabani, M.; Yiu, C.K.Y.; Baghbantaraghdari, Z.; Jamaledin, R.; Carlotti, M.; Mazzolai, B.; Mattoli, V.; et al. Engineering Microneedle Patches for Improved Penetration: Analysis, Skin Models and Factors Affecting Needle Insertion. Nanomicro Lett. 2021, 13, 93. [Google Scholar] [CrossRef]
- Chen, S.; Chen, J.; Li, N. Finite element analysis of microneedle insertion into skin. Micro Nano Lett. 2012, 7, 1206–1209. [Google Scholar] [CrossRef]
- Kong, X.Q.; Zhou, P.; Wu, C.W. Numerical simulation of microneedles’ insertion into skin. Comput. Methods Biomech. Biomed. Eng. 2011, 14, 827–835. [Google Scholar] [CrossRef]
- Kim, J.; Park, S.; Nam, G.; Choi, Y.; Woo, S.; Yoon, S.H. Bioinspired microneedle insertion for deep and precise skin penetration with low force: Why the application of mechanophysical stimuli should be considered. J. Mech. Behav. Biomed. Mater. 2018, 78, 480–490. [Google Scholar] [CrossRef] [PubMed]
- Ma, G.; Wu, C. Microneedle, bio-microneedle and bio-inspired microneedle: A review. J. Control. Release 2017, 251, 11–23. [Google Scholar] [CrossRef] [Green Version]
- Chen, Z.; Lin, Y.; Lee, W.; Ren, L.; Liu, B.; Liang, L.; Wang, Z.; Jiang, L. Additive Manufacturing of Honeybee-Inspired Microneedle for Easy Skin Insertion and Difficult Removal. ACS Appl. Mater. Interfaces 2018, 10, 29338–29346. [Google Scholar] [CrossRef] [PubMed]
- Ling, J.; Song, Z.; Wang, J.; Chen, K.; Li, J.; Xu, S.; Ren, L.; Chen, Z.; Jin, D.; Jiang, L. Effect of honeybee stinger and its microstructured barbs on insertion and pull force. J. Mech. Behav. Biomed. Mater. 2017, 68, 173–179. [Google Scholar] [CrossRef] [PubMed]
- Liu, L.; Kai, H.; Nagamine, K.; Ogawa, Y.; Nishizawa, M. Porous polymer microneedles with interconnecting microchannels for rapid fluid transport. RSC Advances 2016, 6, 48630–48635. [Google Scholar] [CrossRef]
- Gabriel, C.; Peyman, A.; Grant, E.H. Electrical conductivity of tissue at frequencies below 1 MHz. Phys. Med. Biol. 2009, 54, 4863–4878. [Google Scholar] [CrossRef] [PubMed]
- Pavselj, N.; Miklavcic, D. A numerical model of permeabilized skin with local transport regions. IEEE Trans Biomed. Eng. 2008, 55, 1927–1930. [Google Scholar] [CrossRef] [Green Version]
- Jin, Q.; Chen, H.J.; Li, X.; Huang, X.; Wu, Q.; He, G.; Hang, T.; Yang, C.; Jiang, Z.; Li, E.; et al. Reduced Graphene Oxide Nanohybrid-Assembled Microneedles as Mini-Invasive Electrodes for Real-Time Transdermal Biosensing. Small 2019, 15, e1804298. [Google Scholar] [CrossRef]


| 3 × 3 Array | IAB | IAC | |||
|---|---|---|---|---|---|
| Interval Number | Transdermal State | Current Range (μA) | Interval Length (μA) | Current Range (μA) | Interval Length (μA) |
| 1 | 0-0 | 360- | - | 289- | - |
| 2 | 0-1 | 301–360 | 59 | 250–289 | 39 |
| 3 | 1-1 | 246–301 | 55 | 210–250 | 39 |
| 4 | 0-2 | 204–246 | 42 | 179–210 | 31 |
| 5 | 1-2 | 171–204 | 34 | 152–179 | 27 |
| 6 | 2-2 | 83–177 | 87 | 76–152 | 76 |
| 7 | 3+ | 0–83 | 65 | 0–76 | 58 |
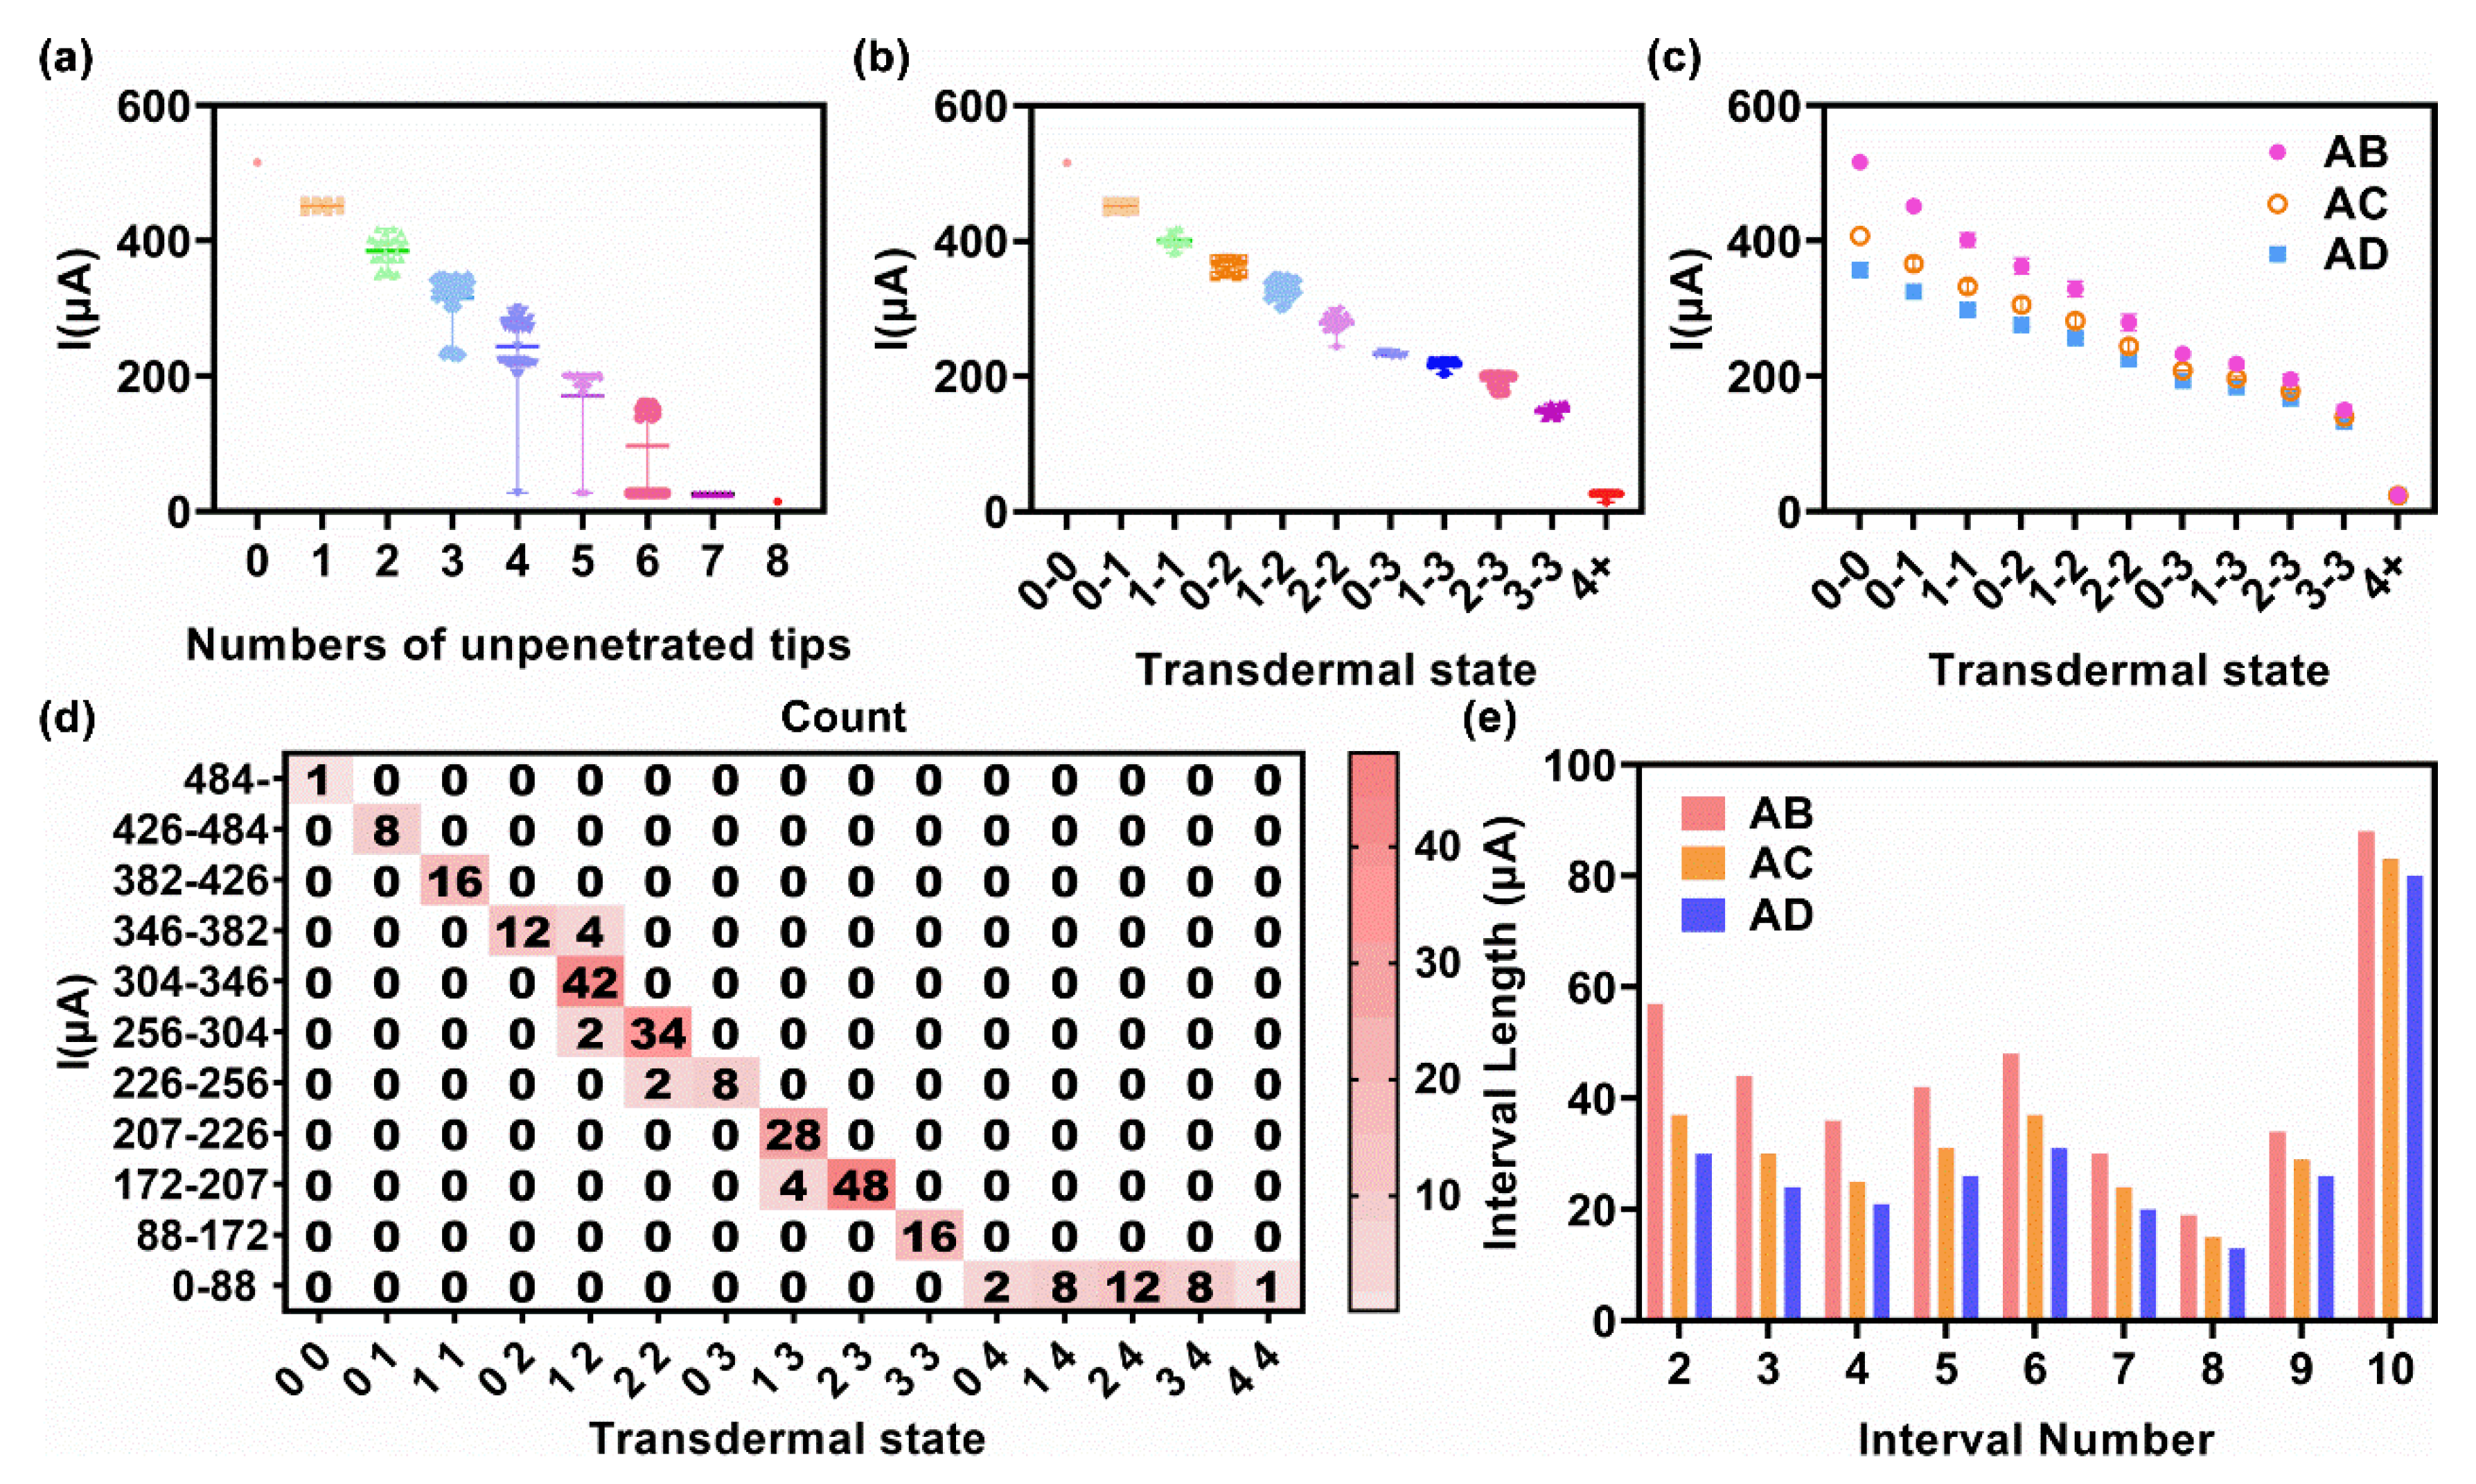
| 4 × 4 Array | IAB | IAC | IAD | ||||
|---|---|---|---|---|---|---|---|
| Interval Number | Transdermal State | Current Range (μA) | Interval Length (μA) | Current Range (μA) | Interval Length (μA) | Current Range (μA) | Interval Length (μA) |
| 1 | 0-0 | 484- | - | 387- | - | 341- | - |
| 2 | 0-1 | 426–484 | 57 | 349–387 | 37 | 311–341 | 30 |
| 3 | 1-1 | 382–426 | 44 | 319–349 | 30 | 287–311 | 24 |
| 4 | 0-2 | 346–382 | 36 | 294–319 | 25 | 266–287 | 21 |
| 5 | 1-2 | 304–346 | 42 | 263–394 | 31 | 240–266 | 26 |
| 6 | 2-2 | 256–304 | 48 | 226–263 | 37 | 209–240 | 31 |
| 7 | 0-3 | 226–256 | 30 | 203–226 | 24 | 189–209 | 20 |
| 8 | 1-3 | 207–226 | 19 | 187–203 | 15 | 176–189 | 13 |
| 9 | 2-3 | 172–207 | 34 | 159–187 | 29 | 150–176 | 26 |
| 10 | 3-3 | 88–172 | 84 | 83–159 | 76 | 80–150 | 70 |
| 11 | 4+ | 0–88 | 88 | 0–83 | 83 | 0–80 | 80 |
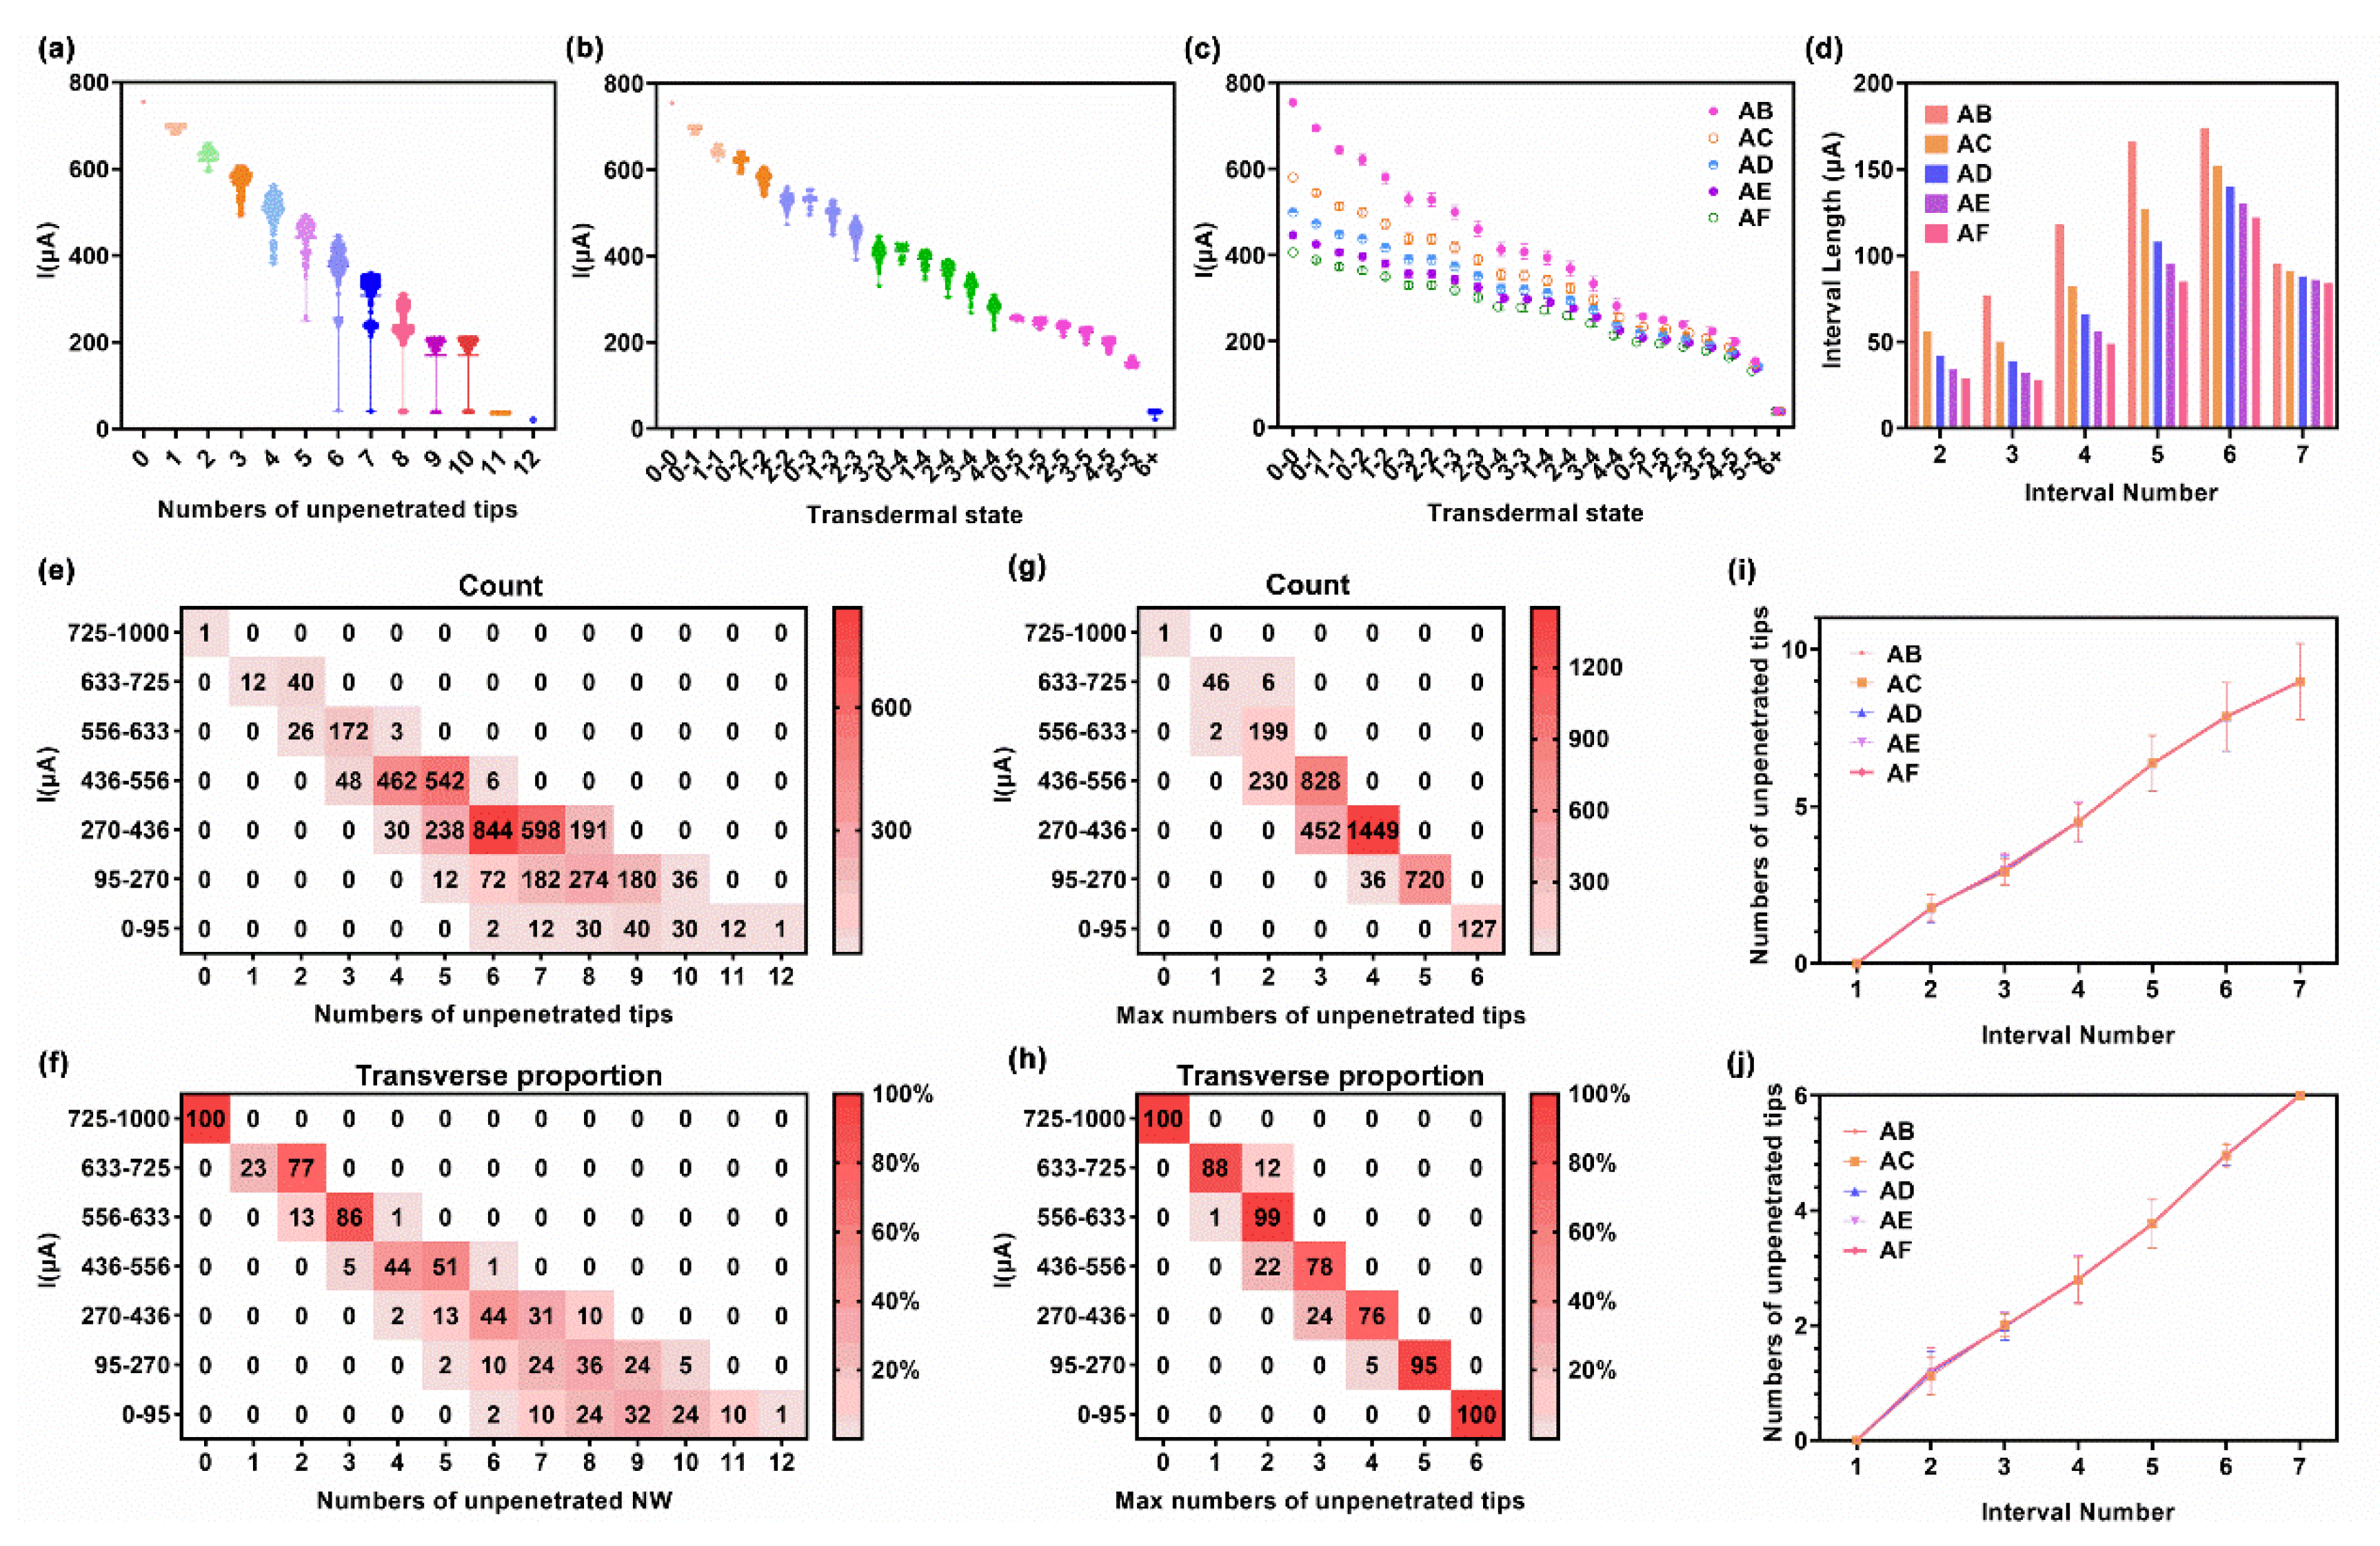
| 6 × 6 Array | IAB | IAC | IAD | IAE | IAF | ||||||
|---|---|---|---|---|---|---|---|---|---|---|---|
| Interval Number | Transdermal State | Current Range (μA) | Interval Length (μA) | Current Range (μA) | Interval Length (μA) | Current Range (μA) | Interval Length (μA) | Current Range (μA) | Interval Length (μA) | Current Range (μA) | Interval Length (μA) |
| 1 | 0-0 | 725- | - | 562- | - | 486- | - | 436- | - | 397- | - |
| 2 | 0-1, 1-1 | 633–725 | 91 | 506–562 | 56 | 443–486 | 42 | 401–436 | 34 | 368–397 | 29 |
| 3 | 0-2, 1-2 | 556–633 | 77 | 455–506 | 50 | 403–443 | 39 | 369–401 | 32 | 340–368 | 28 |
| 4 | 0-3, 2-2, 1-3, 2-3 | 436–556 | 118 | 373–455 | 82 | 337–403 | 66 | 312–369 | 56 | 291–340 | 49 |
| 5 | 0-4, 3-3, 1-4, 2-4, 3-4, 4-4 | 270–436 | 166 | 245–373 | 127 | 229–337 | 108 | 217–312 | 95 | 206–291 | 85 |
| 6 | 0-5, 1-5, 2-5, 3-5, 4-5, 5-5 | 95–270 | 174 | 92–245 | 152 | 89–229 | 140 | 86–217 | 130 | 84–206 | 122 |
| 7 | 6+ | 0–95 | 95 | 0–92 | 91 | 0–89 | 88 | 0–86 | 86 | 0–84 | 84 |
Publisher’s Note: MDPI stays neutral with regard to jurisdictional claims in published maps and institutional affiliations. |
© 2022 by the authors. Licensee MDPI, Basel, Switzerland. This article is an open access article distributed under the terms and conditions of the Creative Commons Attribution (CC BY) license (https://creativecommons.org/licenses/by/4.0/).
Share and Cite
Mo, J.; Liu, J.; Huang, S.; Liang, B.; Huang, X.; Yang, C.; Chen, M.; Liu, J.; Zhang, T.; Xie, X.; et al. Determination of Transdermal Rate of Metallic Microneedle Array through an Impedance Measurements-Based Numerical Check Screening Algorithm. Micromachines 2022, 13, 718. https://doi.org/10.3390/mi13050718
Mo J, Liu J, Huang S, Liang B, Huang X, Yang C, Chen M, Liu J, Zhang T, Xie X, et al. Determination of Transdermal Rate of Metallic Microneedle Array through an Impedance Measurements-Based Numerical Check Screening Algorithm. Micromachines. 2022; 13(5):718. https://doi.org/10.3390/mi13050718
Chicago/Turabian StyleMo, Jingshan, Junqing Liu, Shuang Huang, Baoming Liang, Xinshuo Huang, Cheng Yang, Meiwan Chen, Jing Liu, Tong Zhang, Xi Xie, and et al. 2022. "Determination of Transdermal Rate of Metallic Microneedle Array through an Impedance Measurements-Based Numerical Check Screening Algorithm" Micromachines 13, no. 5: 718. https://doi.org/10.3390/mi13050718