Article

Atomization Characteristics of Hydrogen Peroxide Solutions in Electrostatic Field

1
Institute of Energy, Department of Physics, Hangzhou Dianzi University, Hangzhou 310018, China
2
College of Materials and Environmental Engineering, Hangzhou Dianzi University, Hangzhou 310018, China
*
Author to whom correspondence should be addressed.
Micromachines 2022, 13(5), 771; https://doi.org/10.3390/mi13050771
Submission received: 18 April 2022 / Revised: 8 May 2022 / Accepted: 11 May 2022 / Published: 13 May 2022

Abstract

:
Hydrogen peroxide (H2O2) can be considered as a sterilant or a green propellant. For a common use in industrial application, spray is an effective method to form fine H2O2 droplets. In this paper, electrostatic atomization based on the configuration of needle ring electrodes is proposed to produce H2O2 spray by minimizing its effective surface tension. The breakup performances of H2O2 ligaments can be improved by increasing the electric field intensity, reducing the nozzle size, and adjusting suitable volume flow rate. The smallest average diameter of breakup droplets for 35 wt. % concentration H2O2 solution reached 92.8 μm under optimum operation conditions. The H2O2 concentration significantly influenced the breakup performance owing to the concentration effect on comprehensive physical properties such as density, surface tension, viscosity, and permittivity. The average diameters of breakup droplets decreased with decreasing H2O2 concentration. At 8 wt. % concentration, the average breakup droplet diameter was reduced to 67.4 μm. Finally, electrostatic atomization mechanism of H2O2 solution was analyzed by calculating dimensionless parameters of Re, We, and Oh numbers with the combination of the operation conditions and physical properties for in-depth understanding the breakup behaviors. The calculation showed that the minimum average diameter of breakup droplets was obtained at 8 wt. % concentration at the investigated range of H2O2 concentration, which kept in agreement with the experimental results.

1. Introduction

Owing to the active chemical properties and strong oxidation, H2O2 has been widely used as the sterilant in sterilizers for medical instruments [1,2,3], also for microbial reduction in NASA planetary protection [4]. H2O2 is a slightly light blue gas, which can be miscible with water in any proportion. Different concentrations of H2O2 solutions are utilized in different fields for specific purposes. Generally, low-concentration H2O2 solution of 3 wt. % is mainly used for bacteriostatic disinfection of skin, oral mucosa, and wound surfaces. H2O2 solutions of 25~50% concentration are applied in the field of industrial disinfection, such as GMP standard workshops, medical precision instruments and equipment, pipe tuyere, pulp, fabric bleaching, etc. [5]. Its nontoxic, harmless, and pure characteristics make it an ideal medical disinfectant. Food-grade H2O2 solution is used in aseptic dairy product packaging and aquatic product disinfection.
Highly concentrated H2O2 solution is considered as a nontoxic, noncarcinogenic, and green propellant [6,7], as well as a liquid oxidizer [8,9] for propulsion systems, owing to being able to decompose exothermically into steam and oxygen. Nagiev et al. [10] and Quinn et al. [11] conducted the ignition test of 90% high-concentration H2O2 and hydrocarbon mixed fuel and concluded that the ignition delay reached 16 ms. Since then, a propellant named D- α code for the external 3.8 kN thrust has been developed, and its ignition delay time was shortened to 7.9 ms. H2O2 was preferentially adopted by NASA as the fuel in the rocket-based combined cycle-propulsion system (RBCC) because of its high combustion propulsion efficiency and high ignition characteristic speed [12,13]. A three-strand injection device was adopted inside the engine to strictly control the composition and fuel ratio. The main components of the propellant contain H2O2 with a concentration of more than 89%. After ignition, the peak pressure in the combustion propulsion chamber reached 10 MPa, and the working time limit of flame maintenance was up to 6 min, which provided strong endurance for propulsion, and has successfully completed dozens of engine tests [14]. In the recent FP7 research program in Europe, H2O2 solution was used as an advanced green space propellant (grasp) in the development of rocket thrusters [15,16,17]. H2O2 has strong oxidation characteristics similar with other liquid oxidants, such as nitrogen oxide, nitric acid, and liquid oxygen. It can be utilized as double-based propellant or mixed propellant with other oxidants. The combination of H2O2 solution of 87.5% with kerosene or ethanol has proved to be the best choice of green propellant.
When used as a sterilizing agent, H2O2 mostly needs to be atomized into small droplets and/or vaporized. After evaporation, water vapor and H2O2 gas fill with the chamber, and water vapor tends to condensate on drops in the chamber, which interferes with the sterilizing action of gas-phase H2O2. The water condensation will also prejudice the observation. When used as a propellant, the H2O2 solution forms a droplet group by atomization before combustion. The uniform dispersion of atomization determines the sufficient mixing degree of different fuels, combustion efficiency, and jet flame stability in the process of combustion. These drive us to find an alternative atomization method for the H2O2 solution.
Electrostatic atomization, known as electrospray or electrohydrodynamic atomization, is a method in which the fluid breaks up into fine charged droplets with diameters between ten and several hundred micrometers and a relatively narrow size distribution. By contrast with other atomization techniques, electrostatic atomization has some advantages, namely relative ease of droplet generation, great control of droplet transport, ability to avoid coalescence of droplets due to electric charge of the same polarity on the droplets, enhanced adhesion, deposition, and so on [18,19].
The charges significantly affect the particle-size distribution and fragmentation size of droplets, providing better atomization characteristics, mixing ratio, uniformity, permeability, and surface adhesion. Therefore, to charge the solution as soon as possible in a short time, the charge is injected into the liquid through an external electrostatic device. The common charging methods are corona charging, induction charging, and contact charging [20]. Hara et al. [21] studied the current waveform of corona charging and the relationship between specific charge and droplet size. The maximum charge ratio of distilled water could be confirmed to be 5 × 10⁻³ C/kg, and the duration of the current was closely related to the force that determines the deformation of water droplets. Maski et al. [22] explored the induced charging performance of liquid in 4 kV voltage and low flow rate (30, 45, 60 mL/min) mode. The combination of low flow rate and inductive charging characteristics could increase the charging power of the electrostatic spray and the spray electrification capacity. Chen et al. [23] measured the droplet size, velocity, and gas temperature in a flame by means of a special electrostatic needle spray device. According to the flame structure caused by the countercurrent diffusion of monodisperse heptane, the droplet had evaporated completely before the direct interaction with the flame, and the droplet diffusion surface was large. The atomization effect was infinitely close to the pure gasification diffusion. Kreitzer et al. [24] demonstrated that conical electrodes were used to generate spray to reduce heat transfer and improve the cooling system. When the charging voltage exceeded 15 kV, a great change in the spray flow pattern was observed.
Among the patterns of charging, contact charging possesses higher efficiency. In addition, a difficulty of low breakup efficiency needs to be solved due to relatively high surface tension of H2O2 solution. Therefore, to improve the breakup performance of H2O2 solution, in this study, we propose to investigate the electrostatic atomization characteristics of H2O2 solution by contact charging pattern based on the needle ring electrodes. The objectives of present work will be involving: (1) to investigate the effects of the applied electric field voltage, volume flow rate, nozzle size, and concentration on the electrostatic breakup and droplet formation of H2O2 jet mode in detail, and then to achieve the optimized electrostatic atomization parameters; (2) to reveal the electrostatic atomization mechanism of H2O2 by a more in-depth analysis of dimensionless parameters, including Reynolds number, Weber number, and Ohnesorge number.

2. Materials and Methods

2.1. Materials

Two concentrations of H2O2 solutions (8 wt. % and 35 wt. %) were provided from Zhejiang TAILIN Bioengineering Co., Ltd., Hangzhou, China. The H2O2 solution of 35 wt. % was diluted by adding the deionized water to prepare different concentrations of H2O2 solutions to perform the concentration effect test, i.e., 15 wt. %, 20 wt. %, 25 wt. %, and 30 wt. %, respectively.
At the room temperature of ~20 °C, the physical properties of H2O2 solutions including the density, surface tension, viscosity, and permittivity are shown in Figure 1 [25]. They were measured by a dilatometer, capillary rise method, Ostwald viscometer, and a resonance method, respectively. Their relations with H2O2 concentration (φ) are listed into Table 1. The density has a linear function with the concentration at the slope of 0.0044. The surface tension is a binomial function as the concentration. The viscosity and permittivity vary with a trinomial function with the concentration. In the range of 0~35 wt. %, the four physical properties of H2O2 solutions increase with increasing H2O2 concentration.
The physical properties of H2O2 solutions also depend on temperature. Therefore, during the experiments, it is necessary to control the stability of the laboratory-room temperature to prevent the volatilization of the solution.

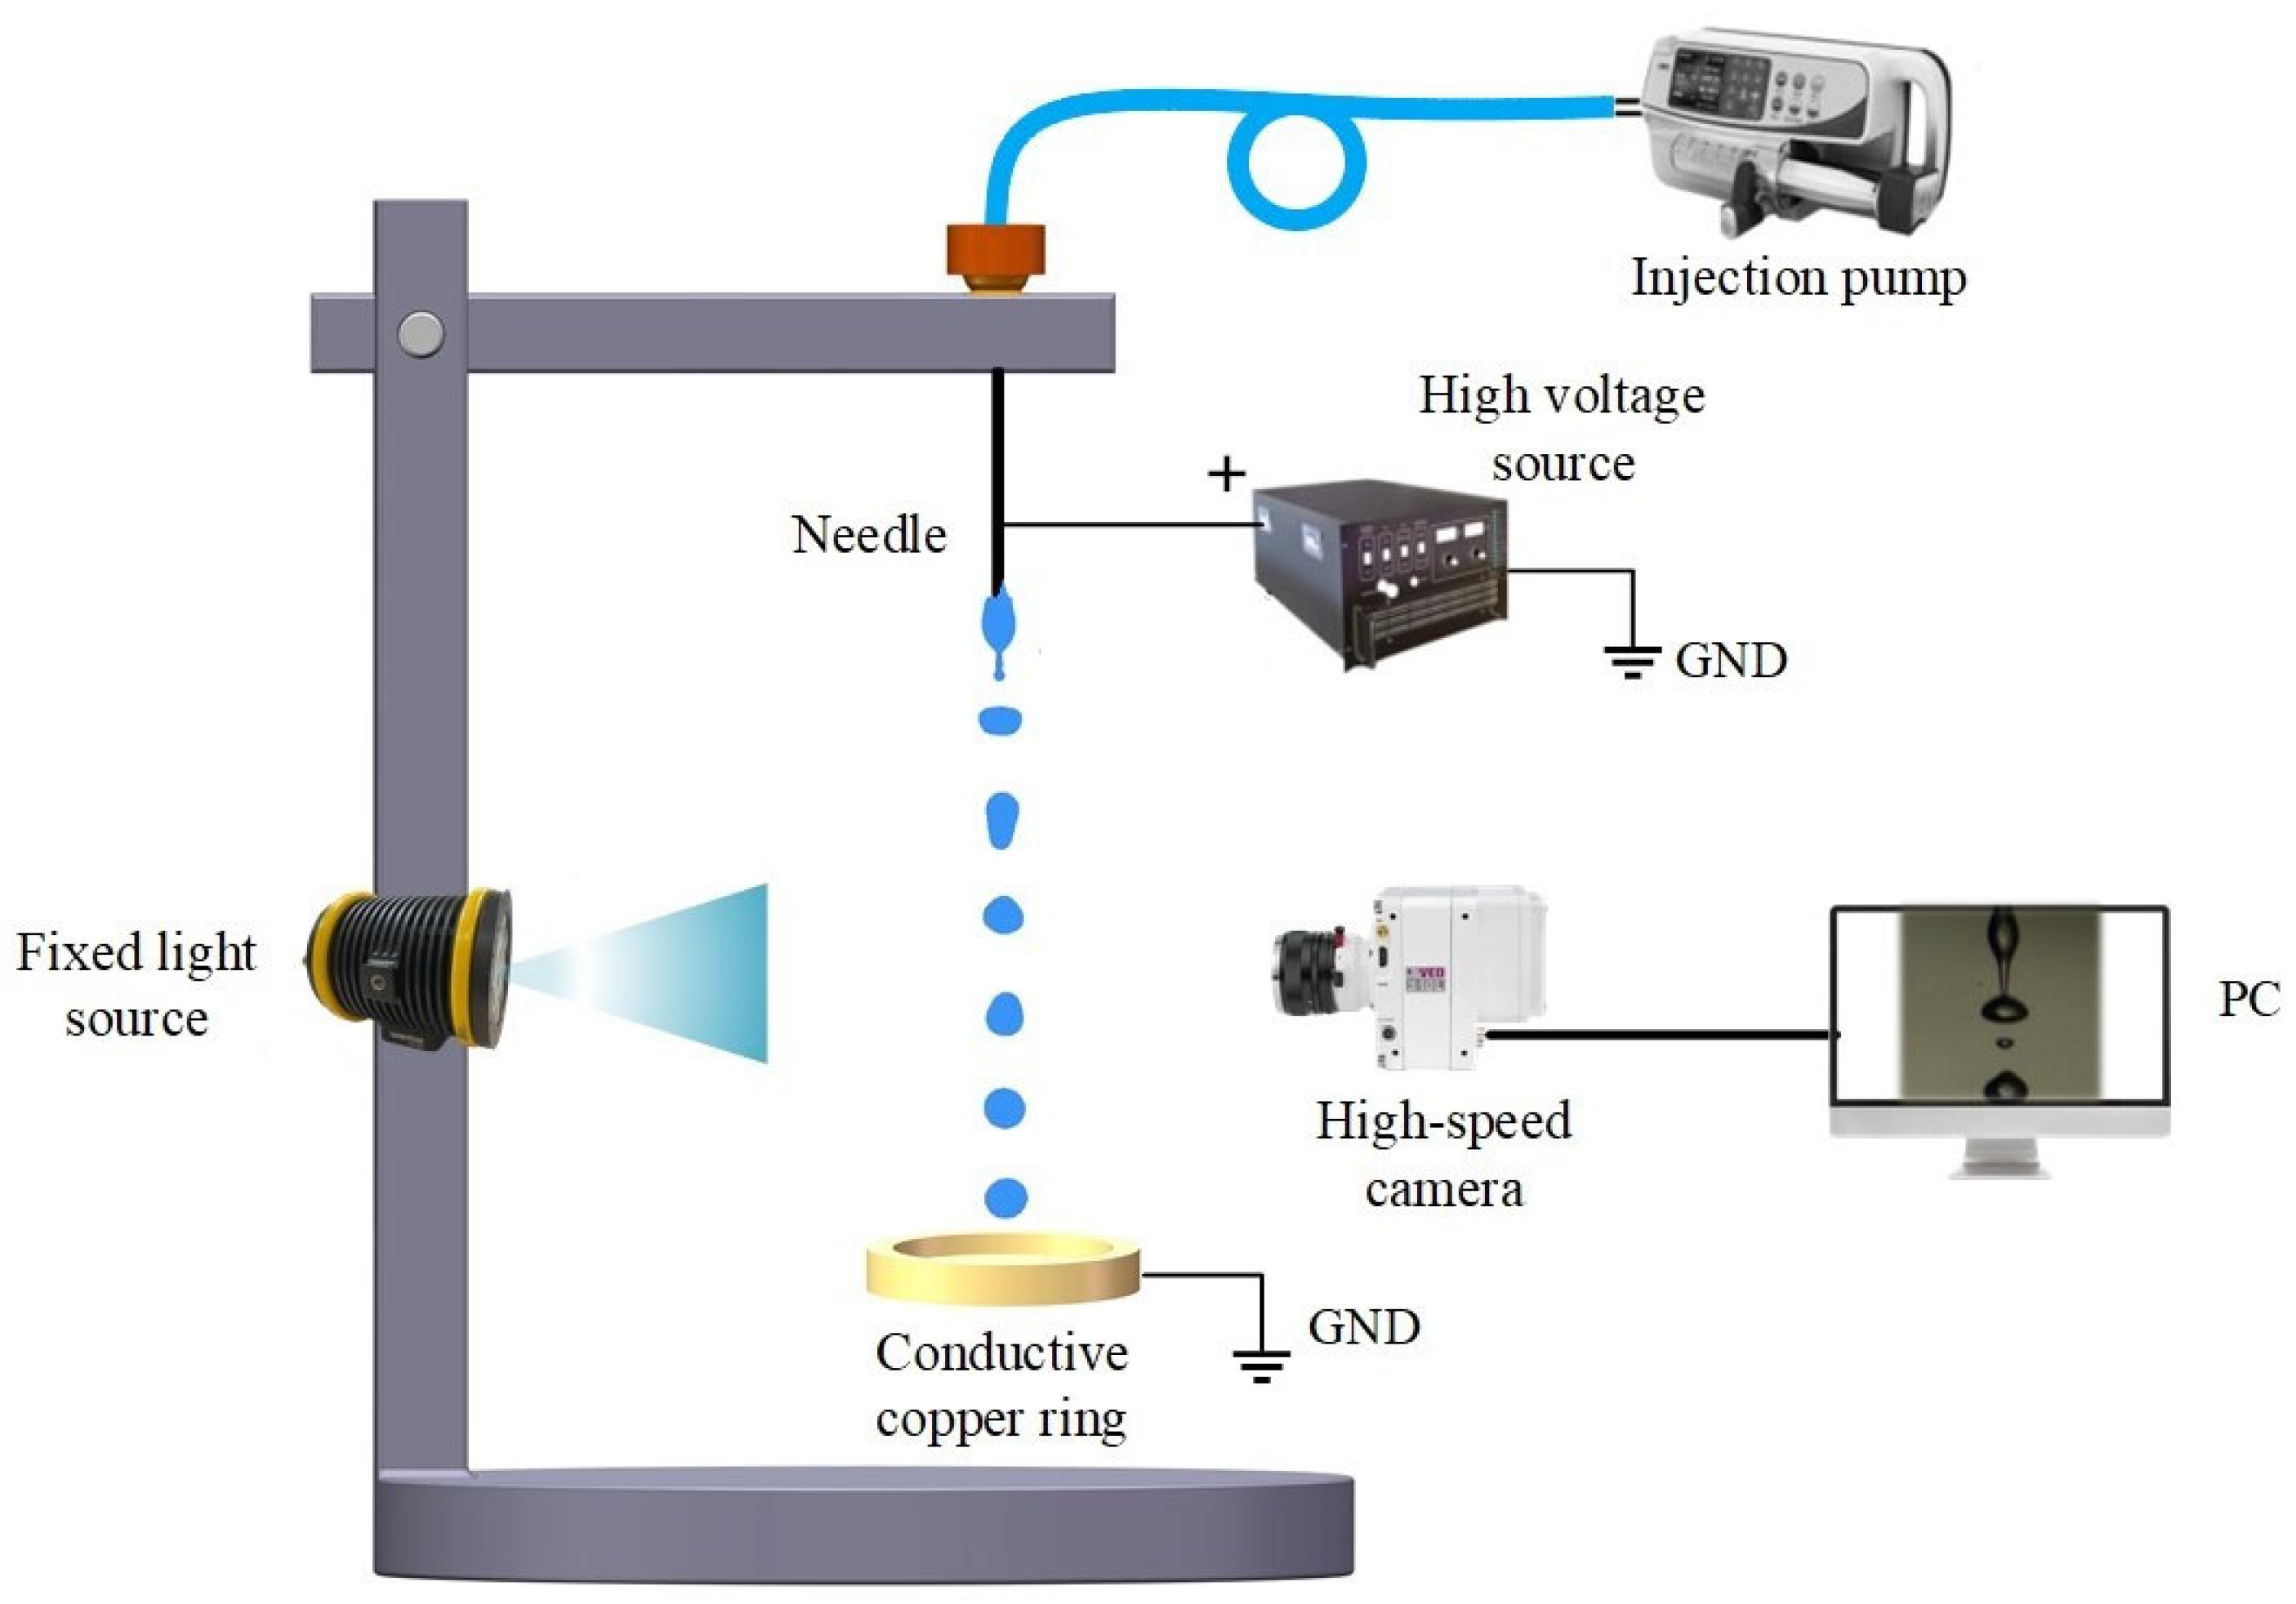
2.2. Experimental Setup

Figure 2 shows the schematic diagram of experimental setup for electrostatic atomization, including liquids and feeding system, electrospray high-voltage system, and illumination and visual imaging system. All electrostatic atomization experiments were conducted under atmospheric pressure and room temperature.

2.2.1. Liquids and Feeding System

The H2O2 solutions were firstly stored in a 50 mL syringe, and then pumped into atomization nozzles to produce a ligament (jet) through a Teflon-coated pipe. Twenty atomization nozzles composed of silica glass (Table 2) were alternatively used in this work. The inner diameters of these nozzles range from 0.16 mm to 3.0 mm. The thickness of the nozzles along with radial direction and the length along with axial direction are 0.075~0.30 mm and 25 mm, respectively. The nozzles were vertically held on a fixed stage. To prevent the formation of bubbles, H2O2 solutions were sonicated for a few minutes before loading into the syringes. A syringe micropump (TYD02, Lead Fluid Technology Co., Ltd., Baoding, China) was used to control the volume flow of H2O2 solutions with an accuracy of ±2%.

2.2.2. Electrospray High-Voltage System

The needle ring electrodes composed of copper material were used to charge the H2O2 solutions based on the contact-charging pattern. The needle electrode was connected to the positive pole of a high-voltage power supply (73030P, General High Voltage Ind. Ltd., Bridgnorth, UK), the ring electrode was grounded, and the ring center was concentric with the needle. The distance between the end of the needle and the ring electrodes was fixed at 3.5 cm to keep the same electrostatic field condition. The high-voltage source was exerted on the needle ring electrodes to produce a high electric-field intensity. The liquid flowed out through the nozzles, formed a group of droplets after electrostatic atomization, and fell through the lower ring electrode.

2.2.3. Illumination and Visual Imaging System

The electrostatic atomization process was visualized by using a high-speed camera (M310, Phantom Inc., San Francisco, CA, USA) with a high-resolution lens (Nikon, Tokyo, Japan). A LED light source with uniform backlight, placed on the opposite position of the high-speed camera, was used to provide view field illumination with obvious contrast under the condition of large aperture and short-time exposure. The recording frame rate of high-speed camera was set to 15,000 fps with the image resolution of 512 × 384.
The characteristic parameters of atomized droplets of H2O2 solutions, such as the number of droplets and particle-size distribution, were analyzed by digital imaging treatment described in our previous work [26,27].

3. Results and Discussion

In an electrostatic field, when a liquid ligament is exerted by the electrical stress that exceeds surface tension, the ligament breaks up into droplets due to instability [28]. The electric field intensity, nozzle size, volume flow rate, and H2O2 concentration influence electrostatic breakup characteristics of H2O2 ligaments. Therefore, the effects on the atomization characteristics were experimentally evaluated to deeply recognize electrostatic breakup and droplet formation.

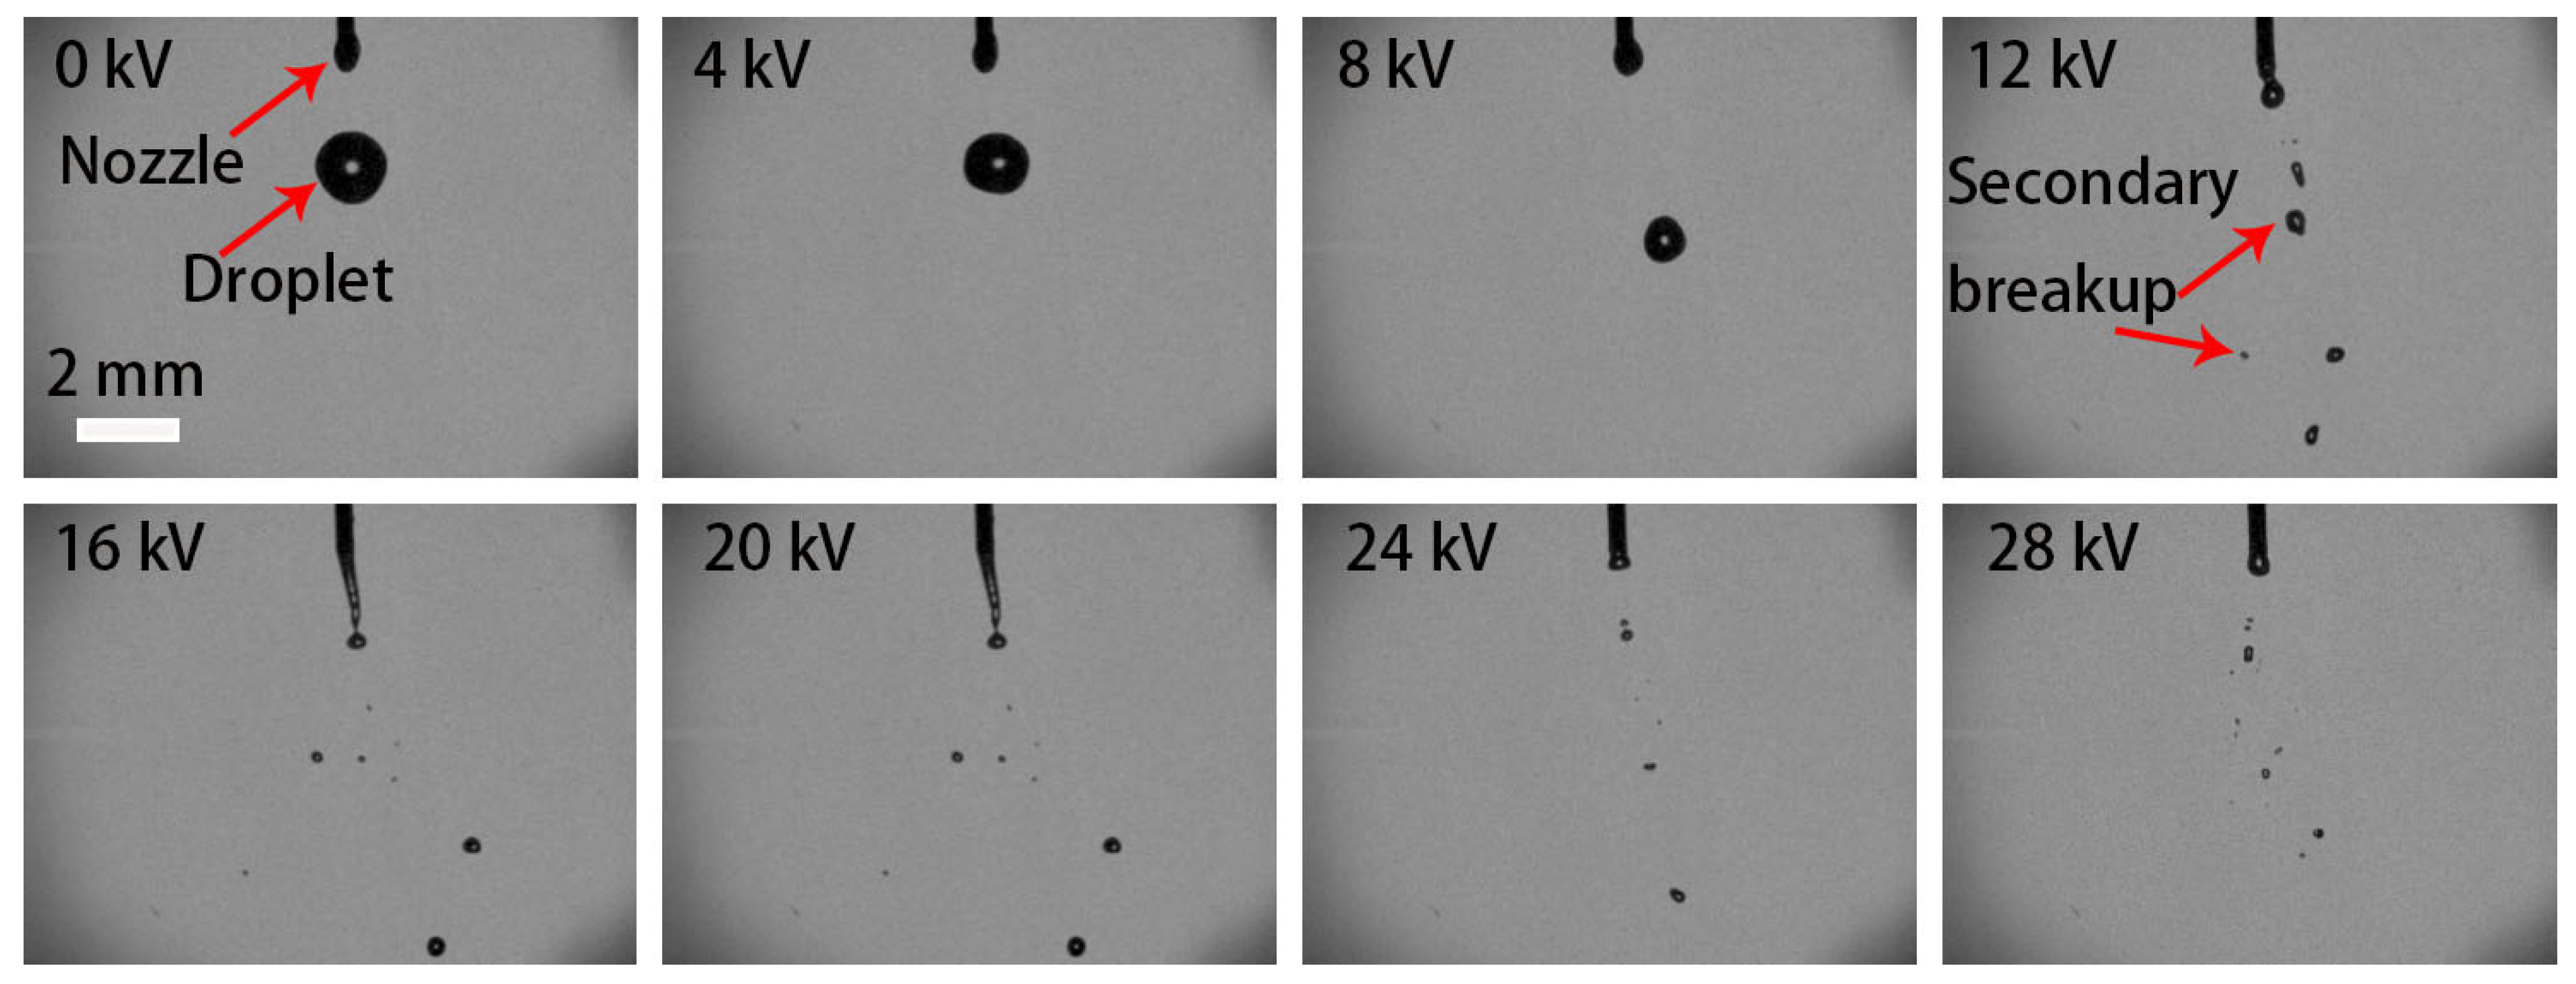
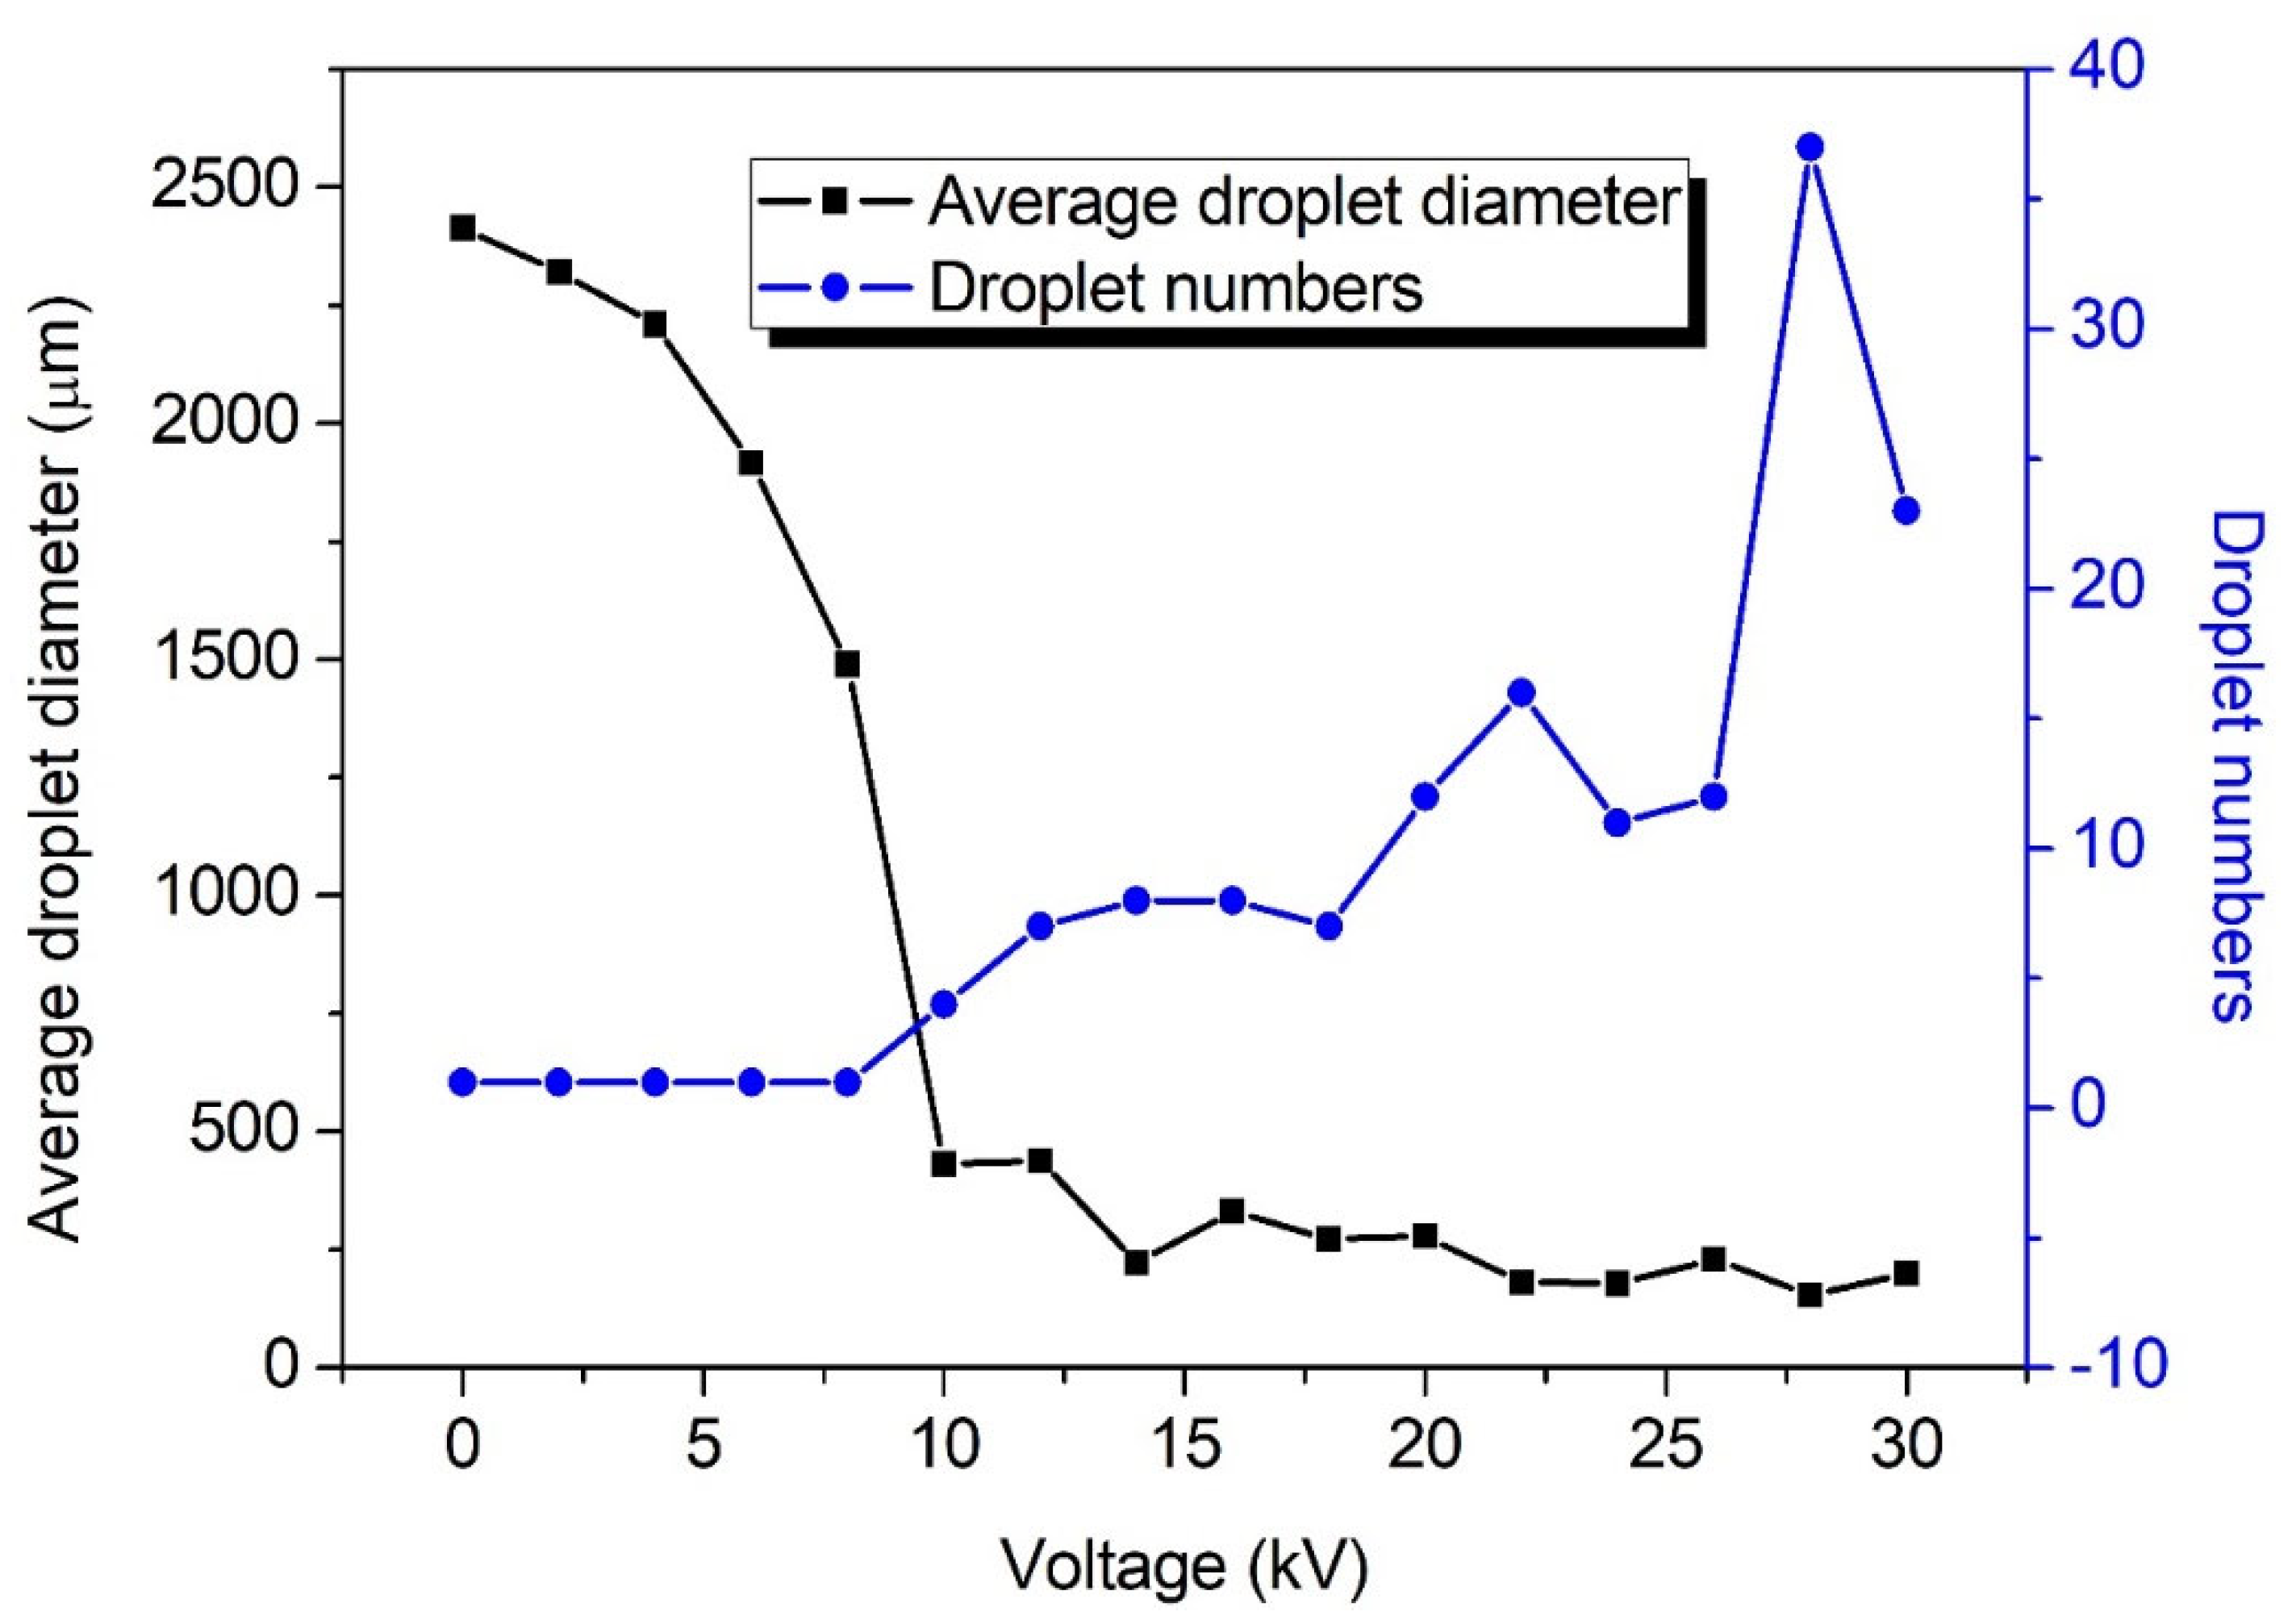
3.1. Effect of Electric-Field Voltage on the Breakup Performance

The nozzle 21G was installed, and the flow rate was set to 400 mL/h. The variation of H2O2 ligaments with electric-field voltage is shown in Figure 3. As the voltage was below 10 kV, only an individual mother droplet dropped from the nozzle outlet; the charge accumulated on the droplet surface was less, and the electrostatic force could not balance the surface tension to break up the mother droplet. When the voltage was adjusted to 10–28 kV, the H2O2 ligaments underwent catastrophic fragmentation. It suggests that the electrostatic force of charged droplets exceeds the surface tension, resulting in secondary breakup.
The number of breakup droplets and the average droplet diameters were statistically analyzed and illustrated in Figure 4. It was found that the number of droplets rose sharply for the first time at 10 kV. This is because smaller satellite droplets were produced during the pinch-off of the main droplets from the ligaments. With increasing the voltage, about 14 small droplets could be split out after a periodic fall off. At 28 kV, the number of droplets rose rapidly for the second time to 37. At 30 kV, the number of droplets was quite unstable due to significant air ionization. Although the number of droplets decreased, it still exceeded the average level, with a gap of about 10 droplets.
The average sizes of breakup droplets varied with the voltages (Figure 4). At relatively low voltage (below 10 kV), the sizes of most of droplets were greater than 1000 μm, twice or more than the nozzle inner diameter. The ligament fell off in the form of a main droplet and did not form effective fragmentation. Under the condition of medium voltage, i.e., 10–20 kV, with the emergence of small satellite droplets, the average size began to decline, especially at 10 kV. At high voltage of over 22 kV, the sizes of breakup droplets below 100 μm gradually began to appear. The proportion of smaller droplets below 100 μm enhanced with increasing the voltage. At 28 kV, the proportion was the highest and the average droplet size reached the minimum value of 154.8 μm. The sizes of broken droplets mainly distributed in 51.2–194.5 μm.
It can be found that the sizes of the main droplets (mother droplets) can be changed by changing the voltage, and their size distribution is the key factor to evaluate the atomization performance. The main droplet size trend, shown in Figure 5, demonstrated that the sizes varied from the initial 2413.5 μm and gradually decreased to 369.7 μm, and then remained flat. It was also observed that the main droplets generated periodically in the droplet group and gradually decreased and became stable as the voltage was enhanced.
At 28 kV, the atomization performance kept the best (Figure 4). Therefore, the voltage of 28 kV was selected for performing subsequent experiments to maintain good breakup performance.

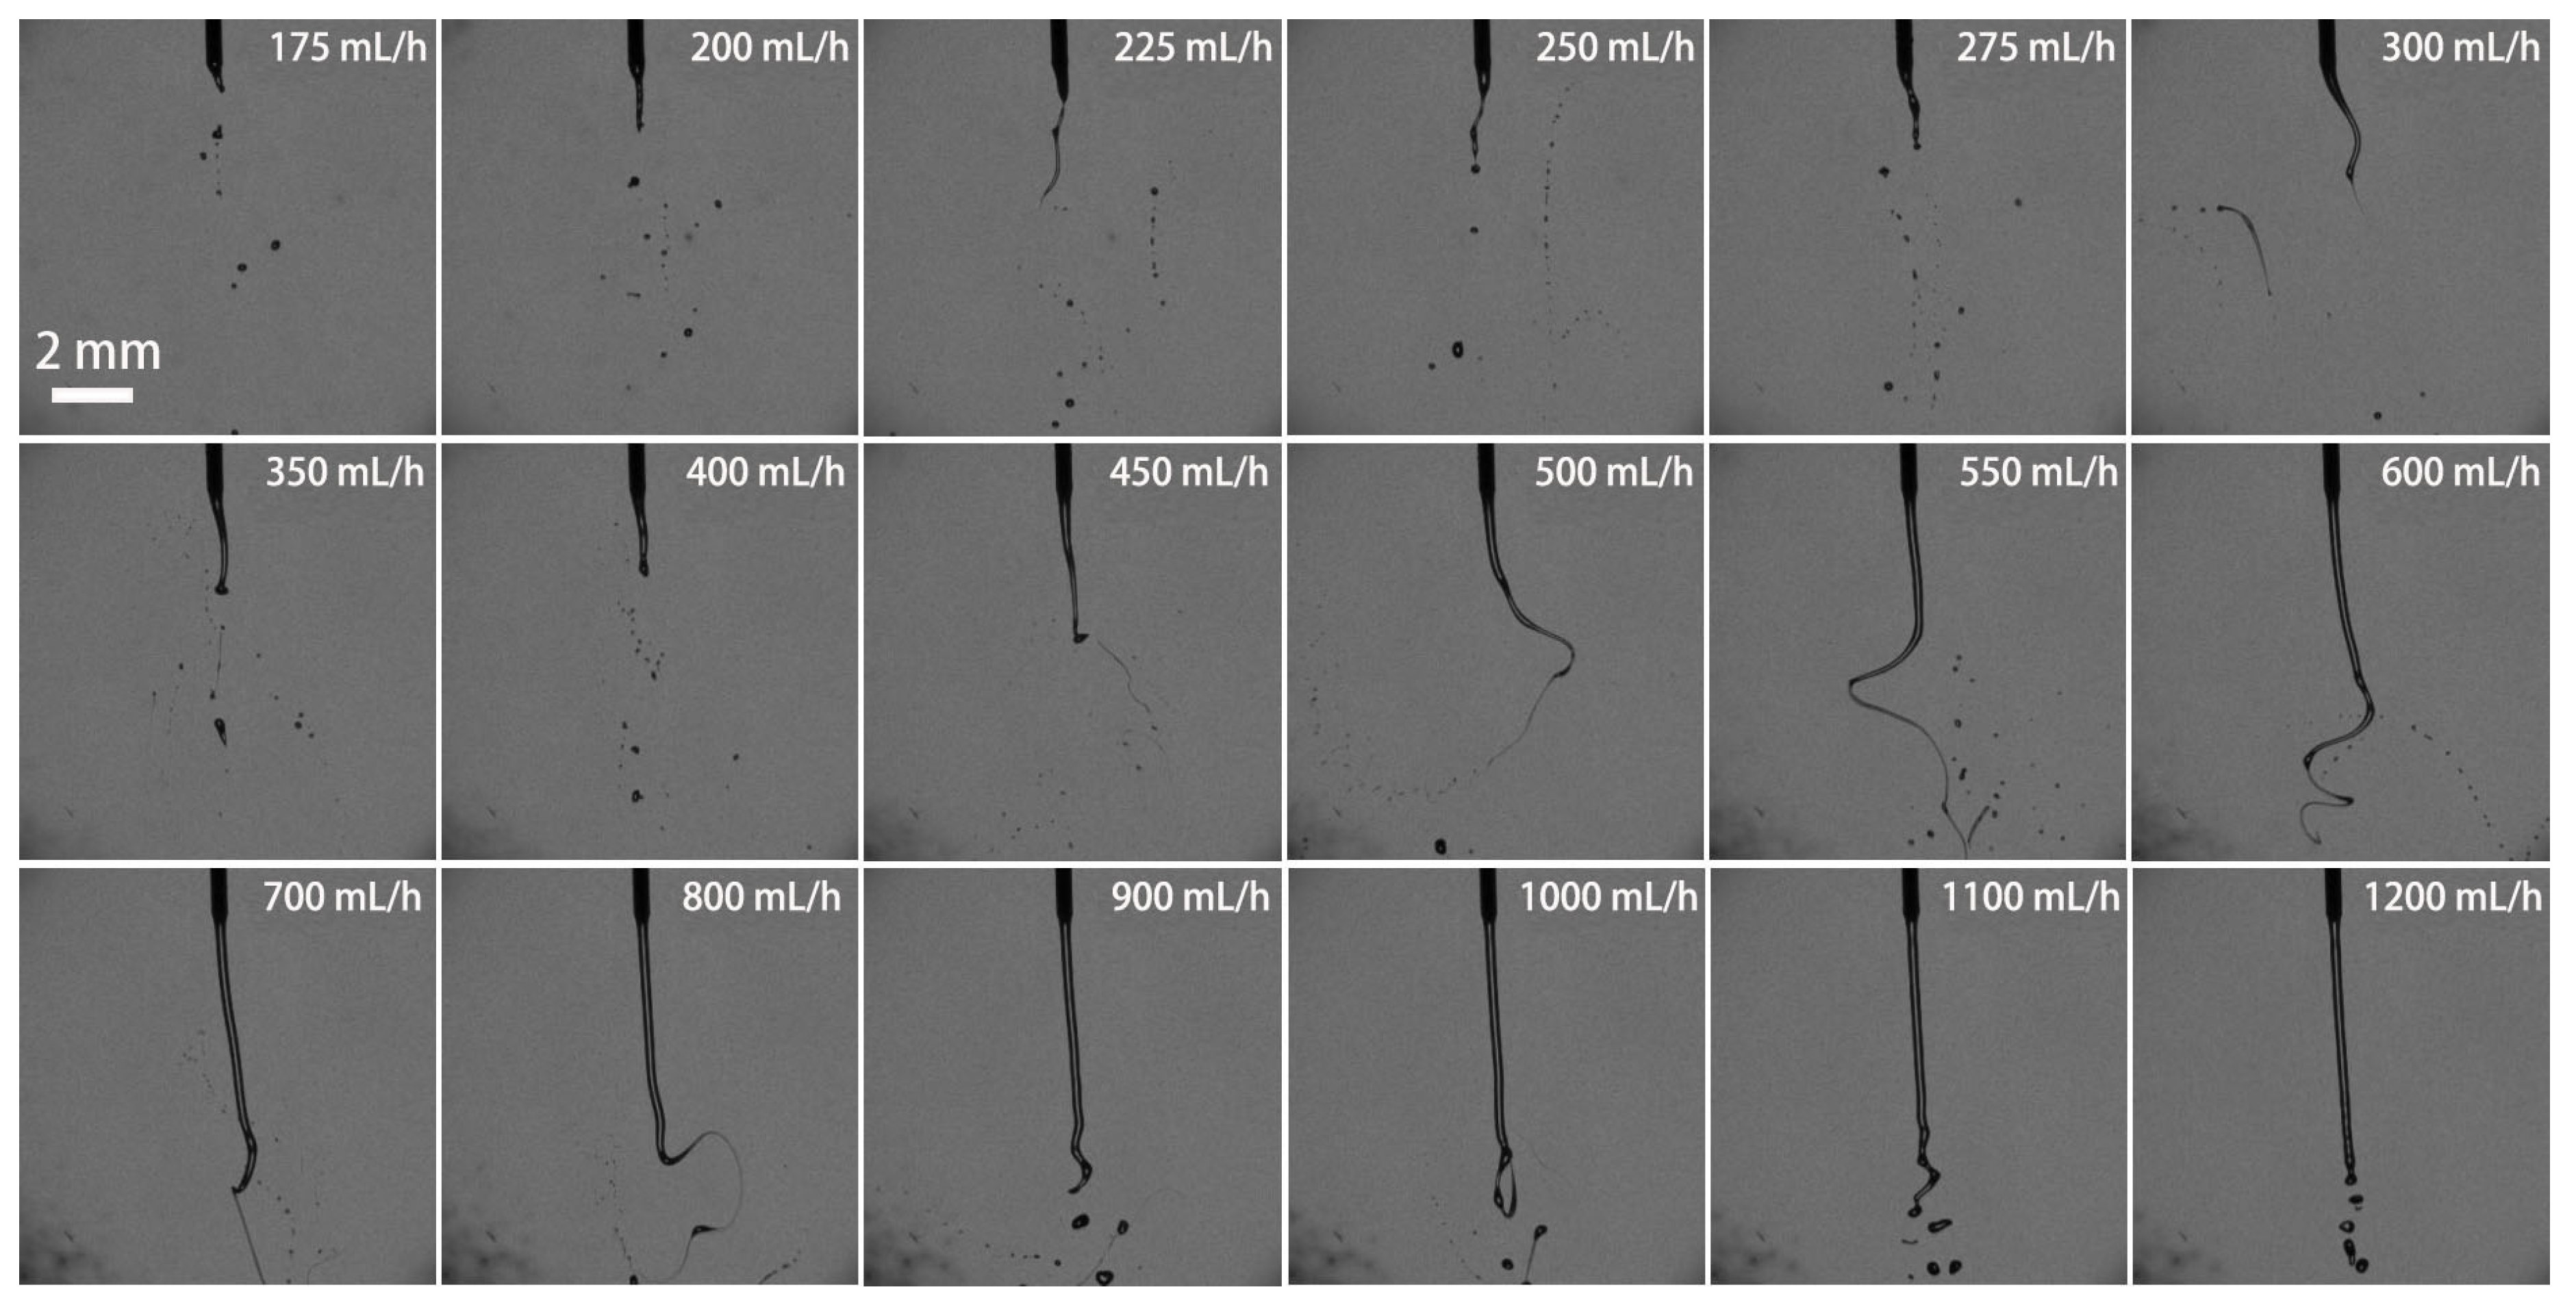
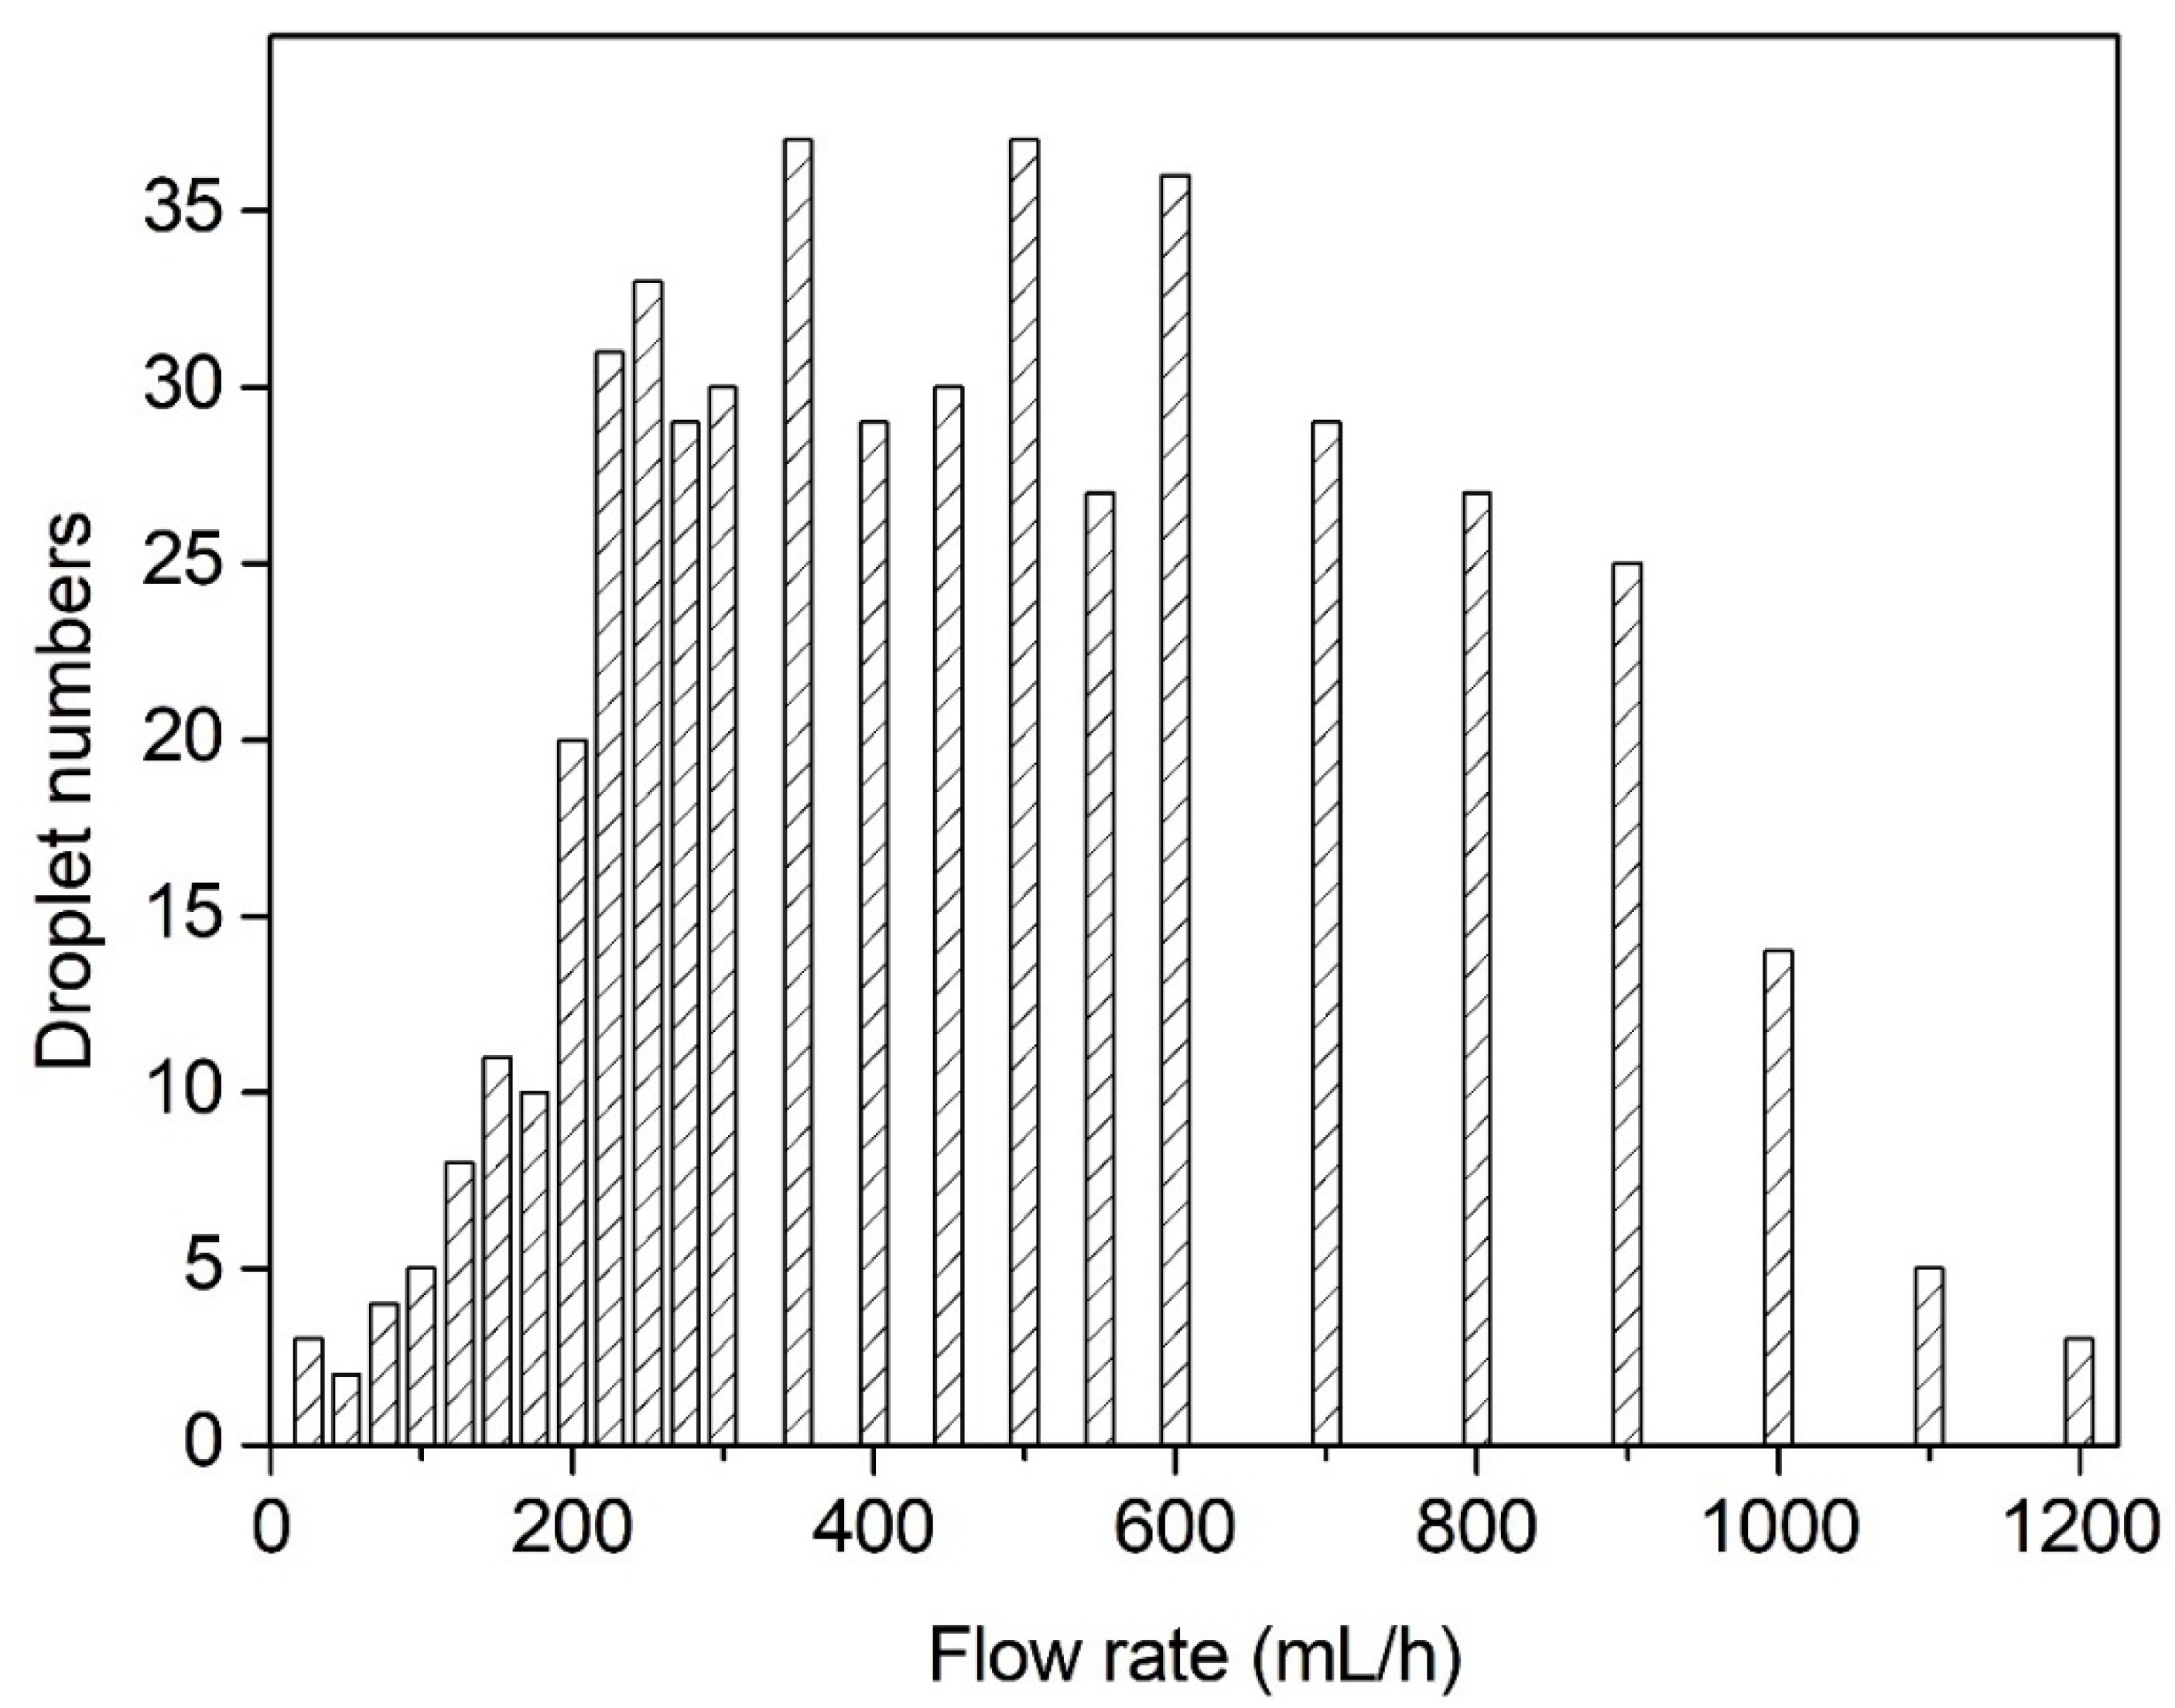
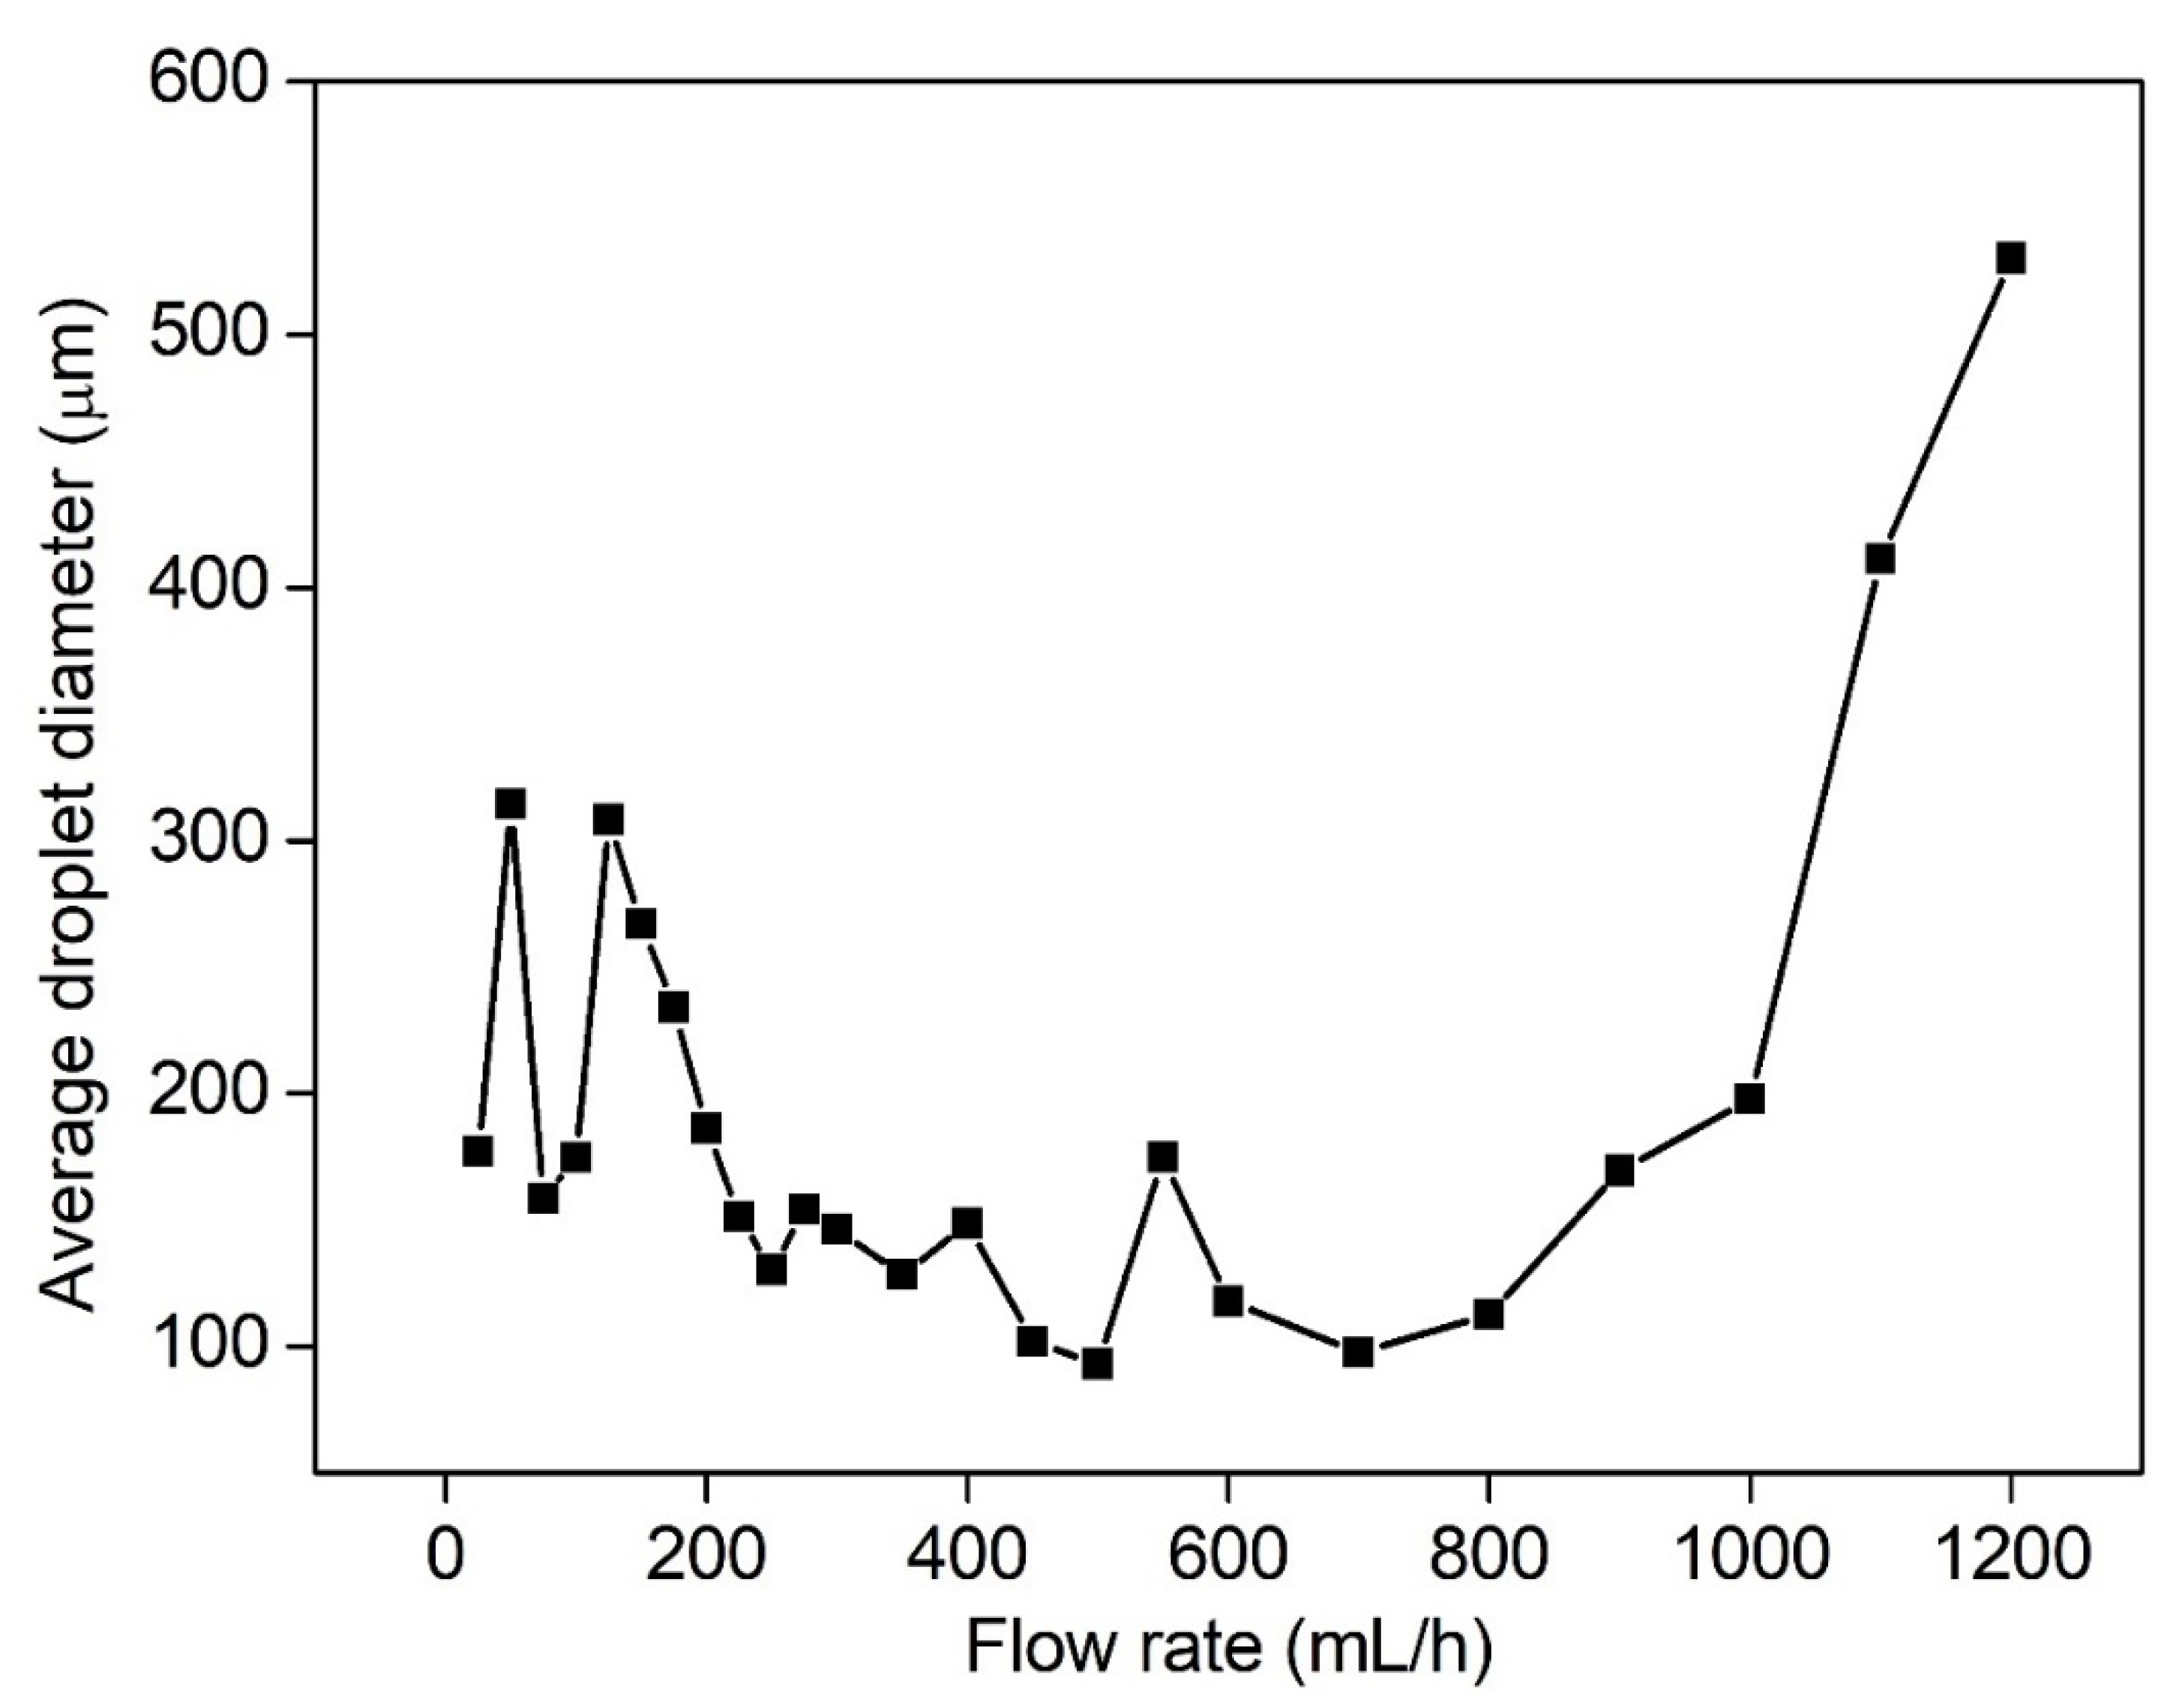
3.2. Effect of Volume Flow Rate on the Breakup Performance

Figure 6 demonstrates the variation of H2O2 ligaments with the volume flow rate. When the flow rate was set to below 100 mL/h, main droplets and occasional satellite droplets formed at the nozzle outlet. The number of droplets was extremely tiny. With increasing the flow rate, at 100–550 mL/h, it can be found that the jet formed at the nozzle outlet and began to swing under the action of electrostatic force, forming a slender liquid braid with a cone angle at the end. The swing amplitude and length of the braid became larger as the flow rate was enhanced further. As a result, the electric-field force made the long braid break up and split, producing quantities of droplets. When the flow rate was increased to 600 mL/h, the jets became longer. The electrostatic force produced at 28 kV difficultly made the jets break up. The swing amplitude of the long braid gradually attenuated and remained stable. Finally, under an ultrahigh flow rate of over 1000 mL/h, the filaments only break up into some large droplets. It is worthy to note that the formation of the liquid braid possibly resulted from the influence of extensional viscosity. When the liquid braid suffered from both the electrostatic stress and the viscous stress, the phenomena of the spinning of the ligament and the droplets on a string were observed.
The number of breakup droplets varied with the volume flow rate ranging from 25–1200 mL/h, as shown in Figure 7. If the flow rate was in the range of 25–500 mL/h, the number of droplets increased due to the increase in the flow rate. The first obvious sharp rise was located at 175 mL/h. When at 500 mL/h, the number of droplets reached a peak of 37. When the flow rate ranged from 500 mL/h to 1200 mL/h, the number of droplets began to decline continuously. The first obvious drop was at 1000 mL/h. At the ultrahigh flow rate of 1200 mL/h, the breakup became more difficult.
At the flow rate of 25–175 mL/h, the average diameters of breakup droplets ranged 158–308 μm (Figure 8). The fluctuation possibly resulted from the unstable flow of the micropump at low flow rates. At the flow rate of 175–700 mL/h, the average diameters began to decrease and tended to be flat. The smallest average diameter was 92.8 μm at 500 mL/h. At the flow rate of 700–1200 mL/h, the average diameters of breakup droplets gradually increased. It does not mean that the higher the number of breakup droplets, the lower the average diameter of droplets. In the case of relatively low flow rate (0–200 mL/h), the size distribution of most breakup droplets was 200–400 μm. The proportion of droplets below 100 μm was relatively low, and the size-distribution spectrum gradually widened with the increase in the flow rate. At medium and high flow rates of 200–500 mL/h, the size of breakup droplets was mainly distributed in 50–200 μm, and the size-distribution spectrum was narrowed. For the high flow rate of 500–1000 mL/h, the proportion of droplets in 50–100 μm showed a downward trend, resulting in the size distribution beginning to widen. At the ultra-high flow rate of 1000–1200 mL/h, large droplets could not be broken up effectively and the size distribution became wider.
To sum up, when the nozzle size and the applied voltage were fixed, there was a critical value of volume flow to make the droplet diameter smallest. In the case of the 21G nozzle and 28 kV, the critical volume flow rate was 500 mL/h.

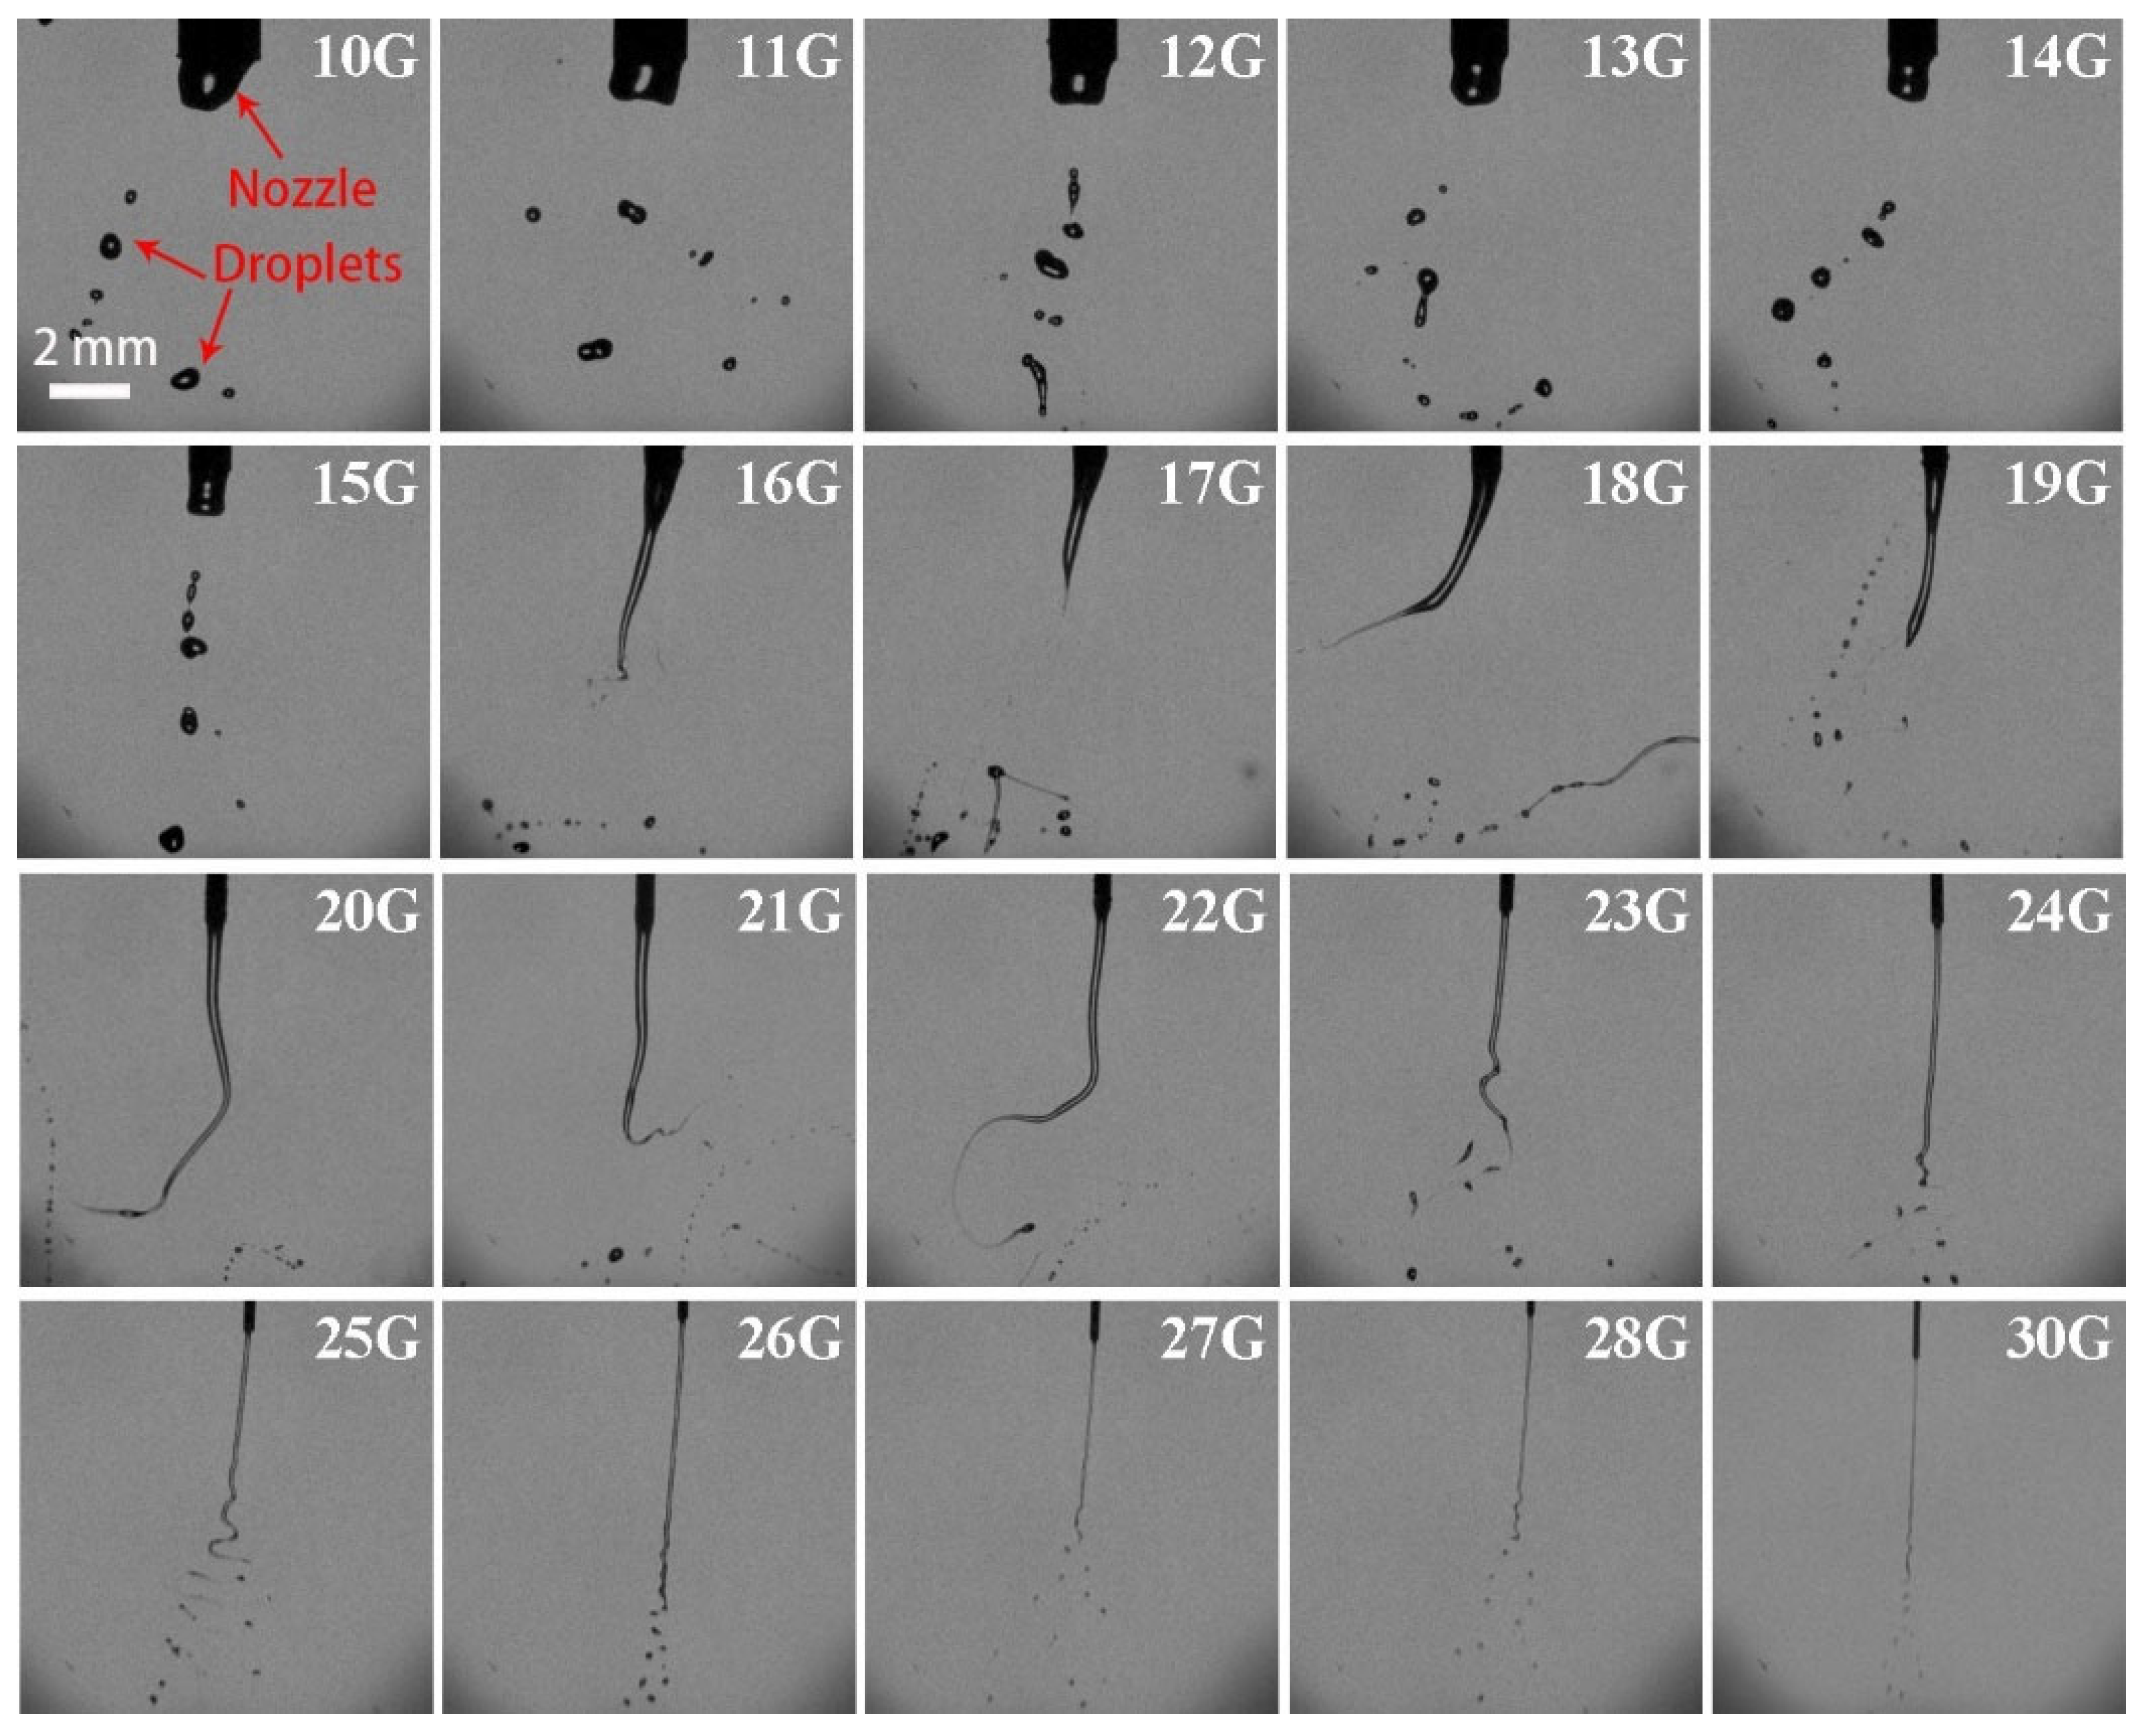
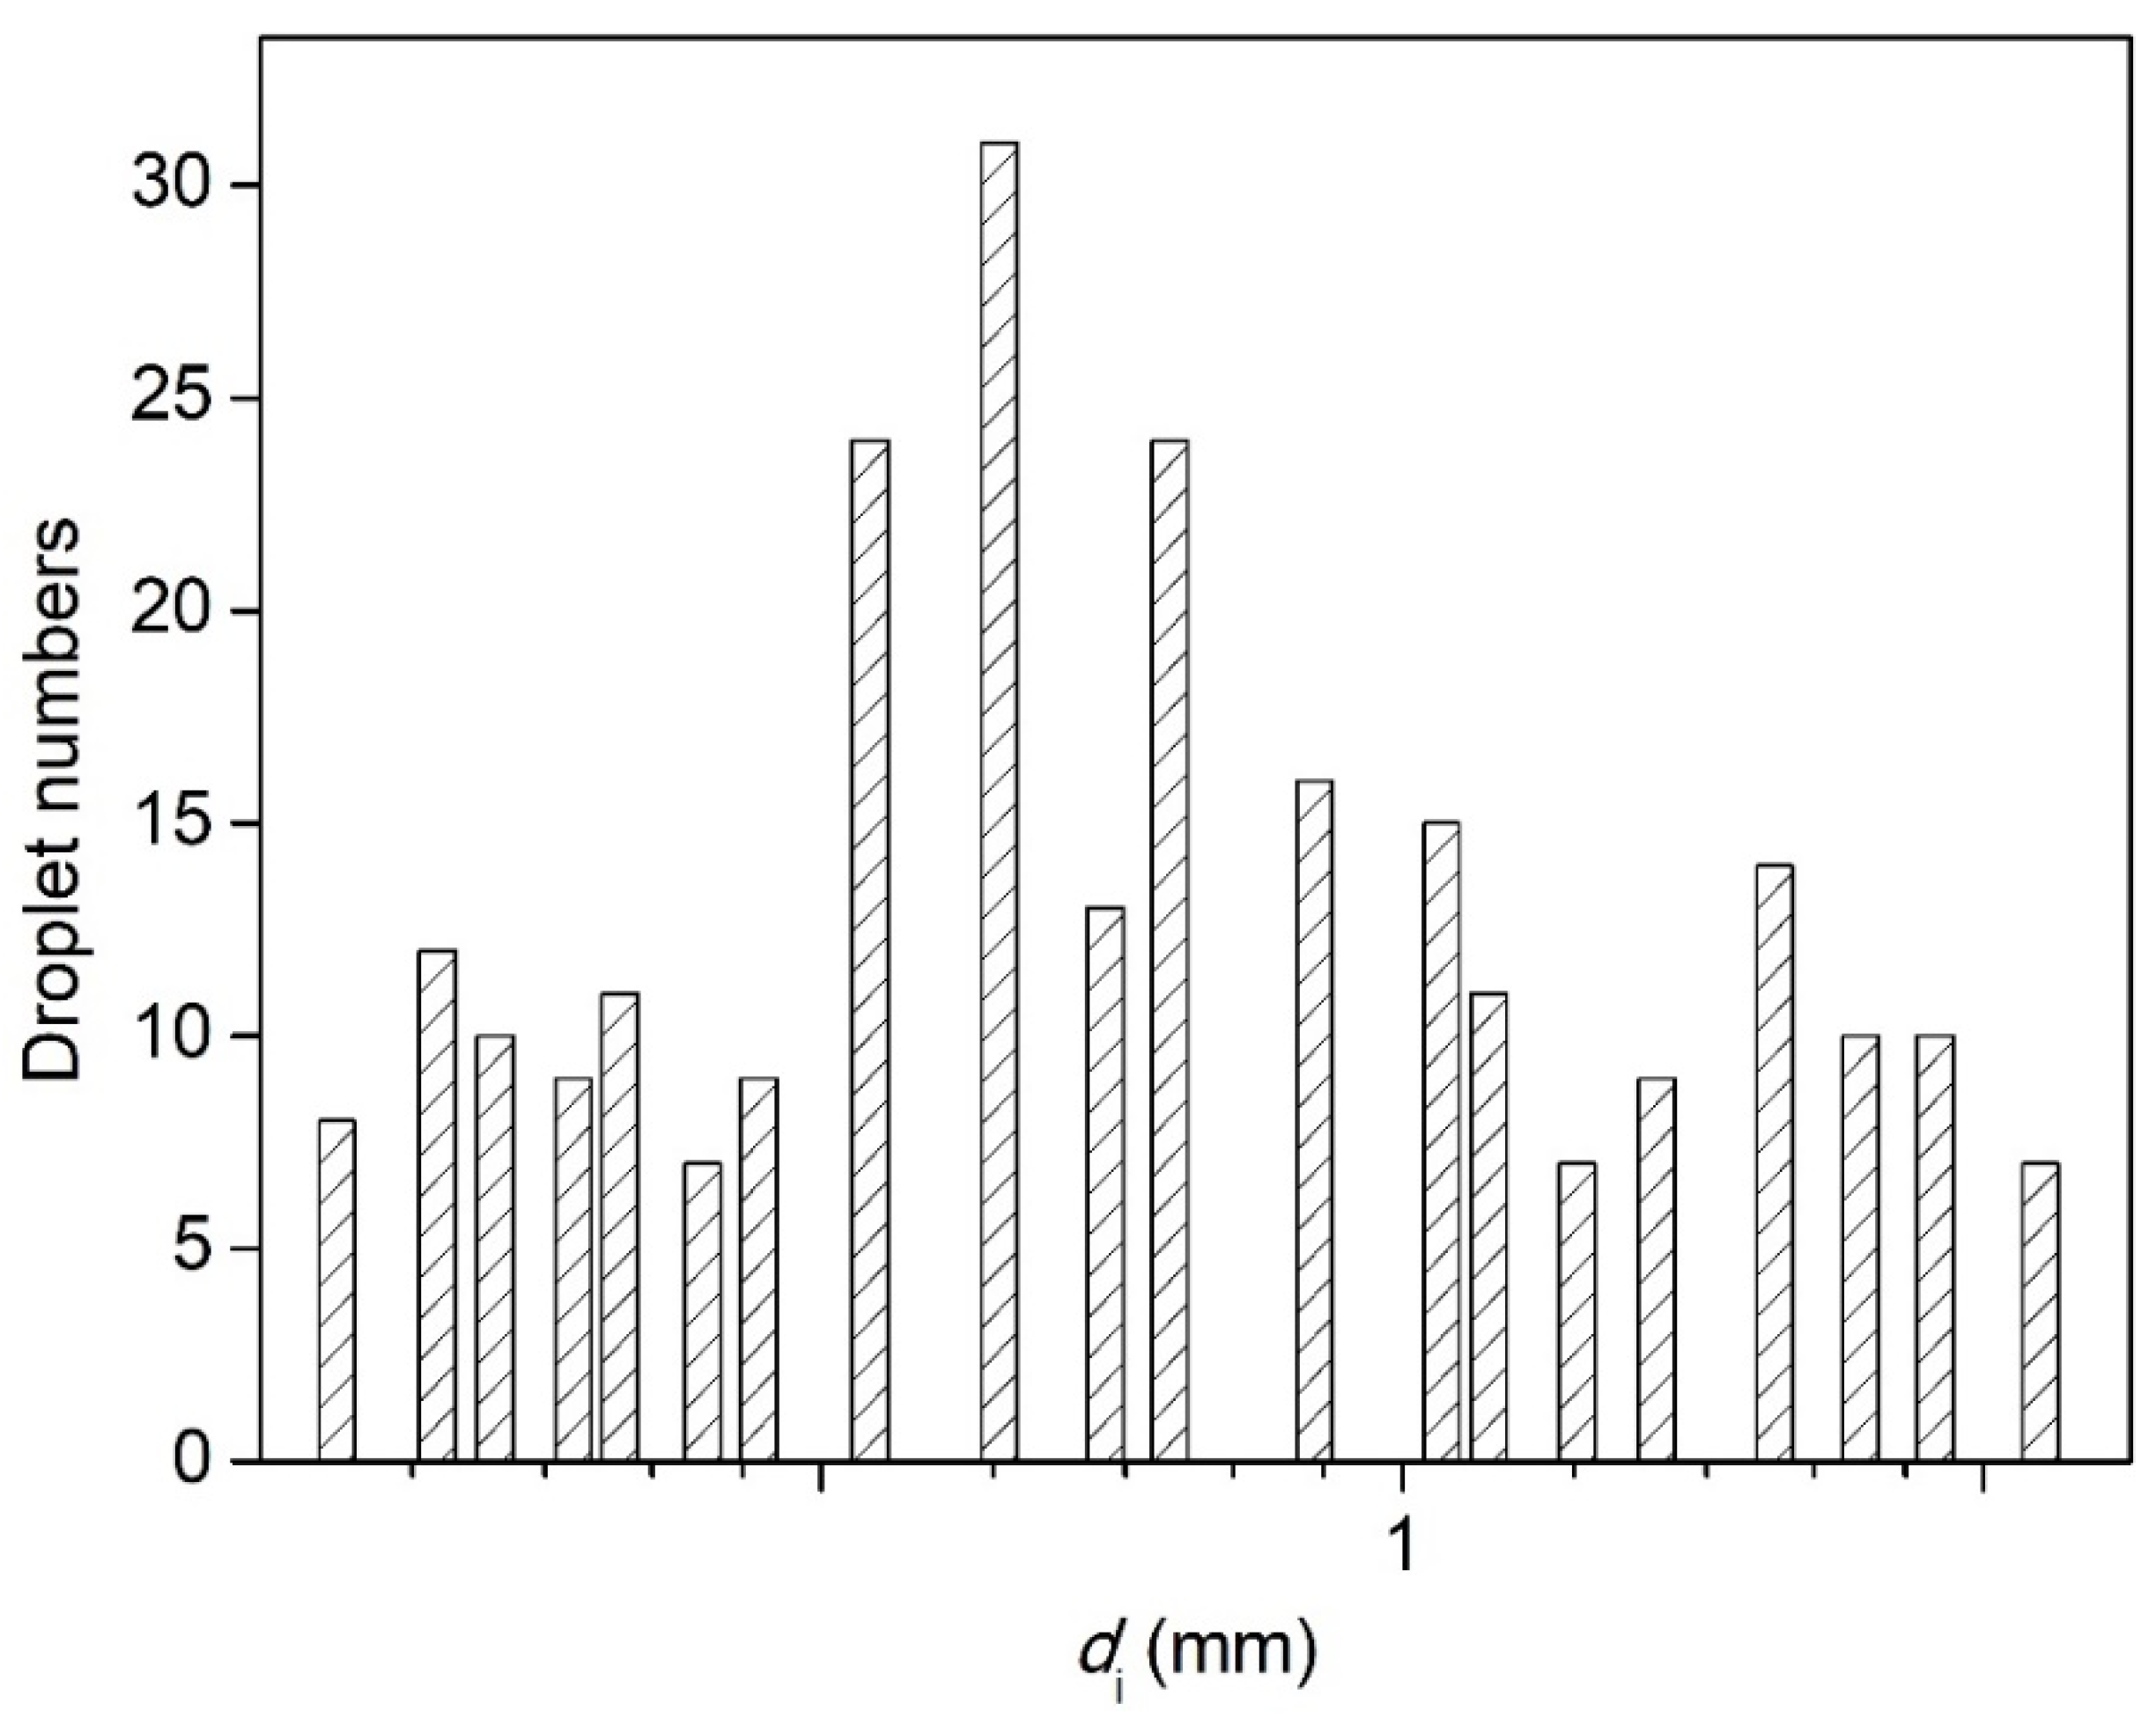
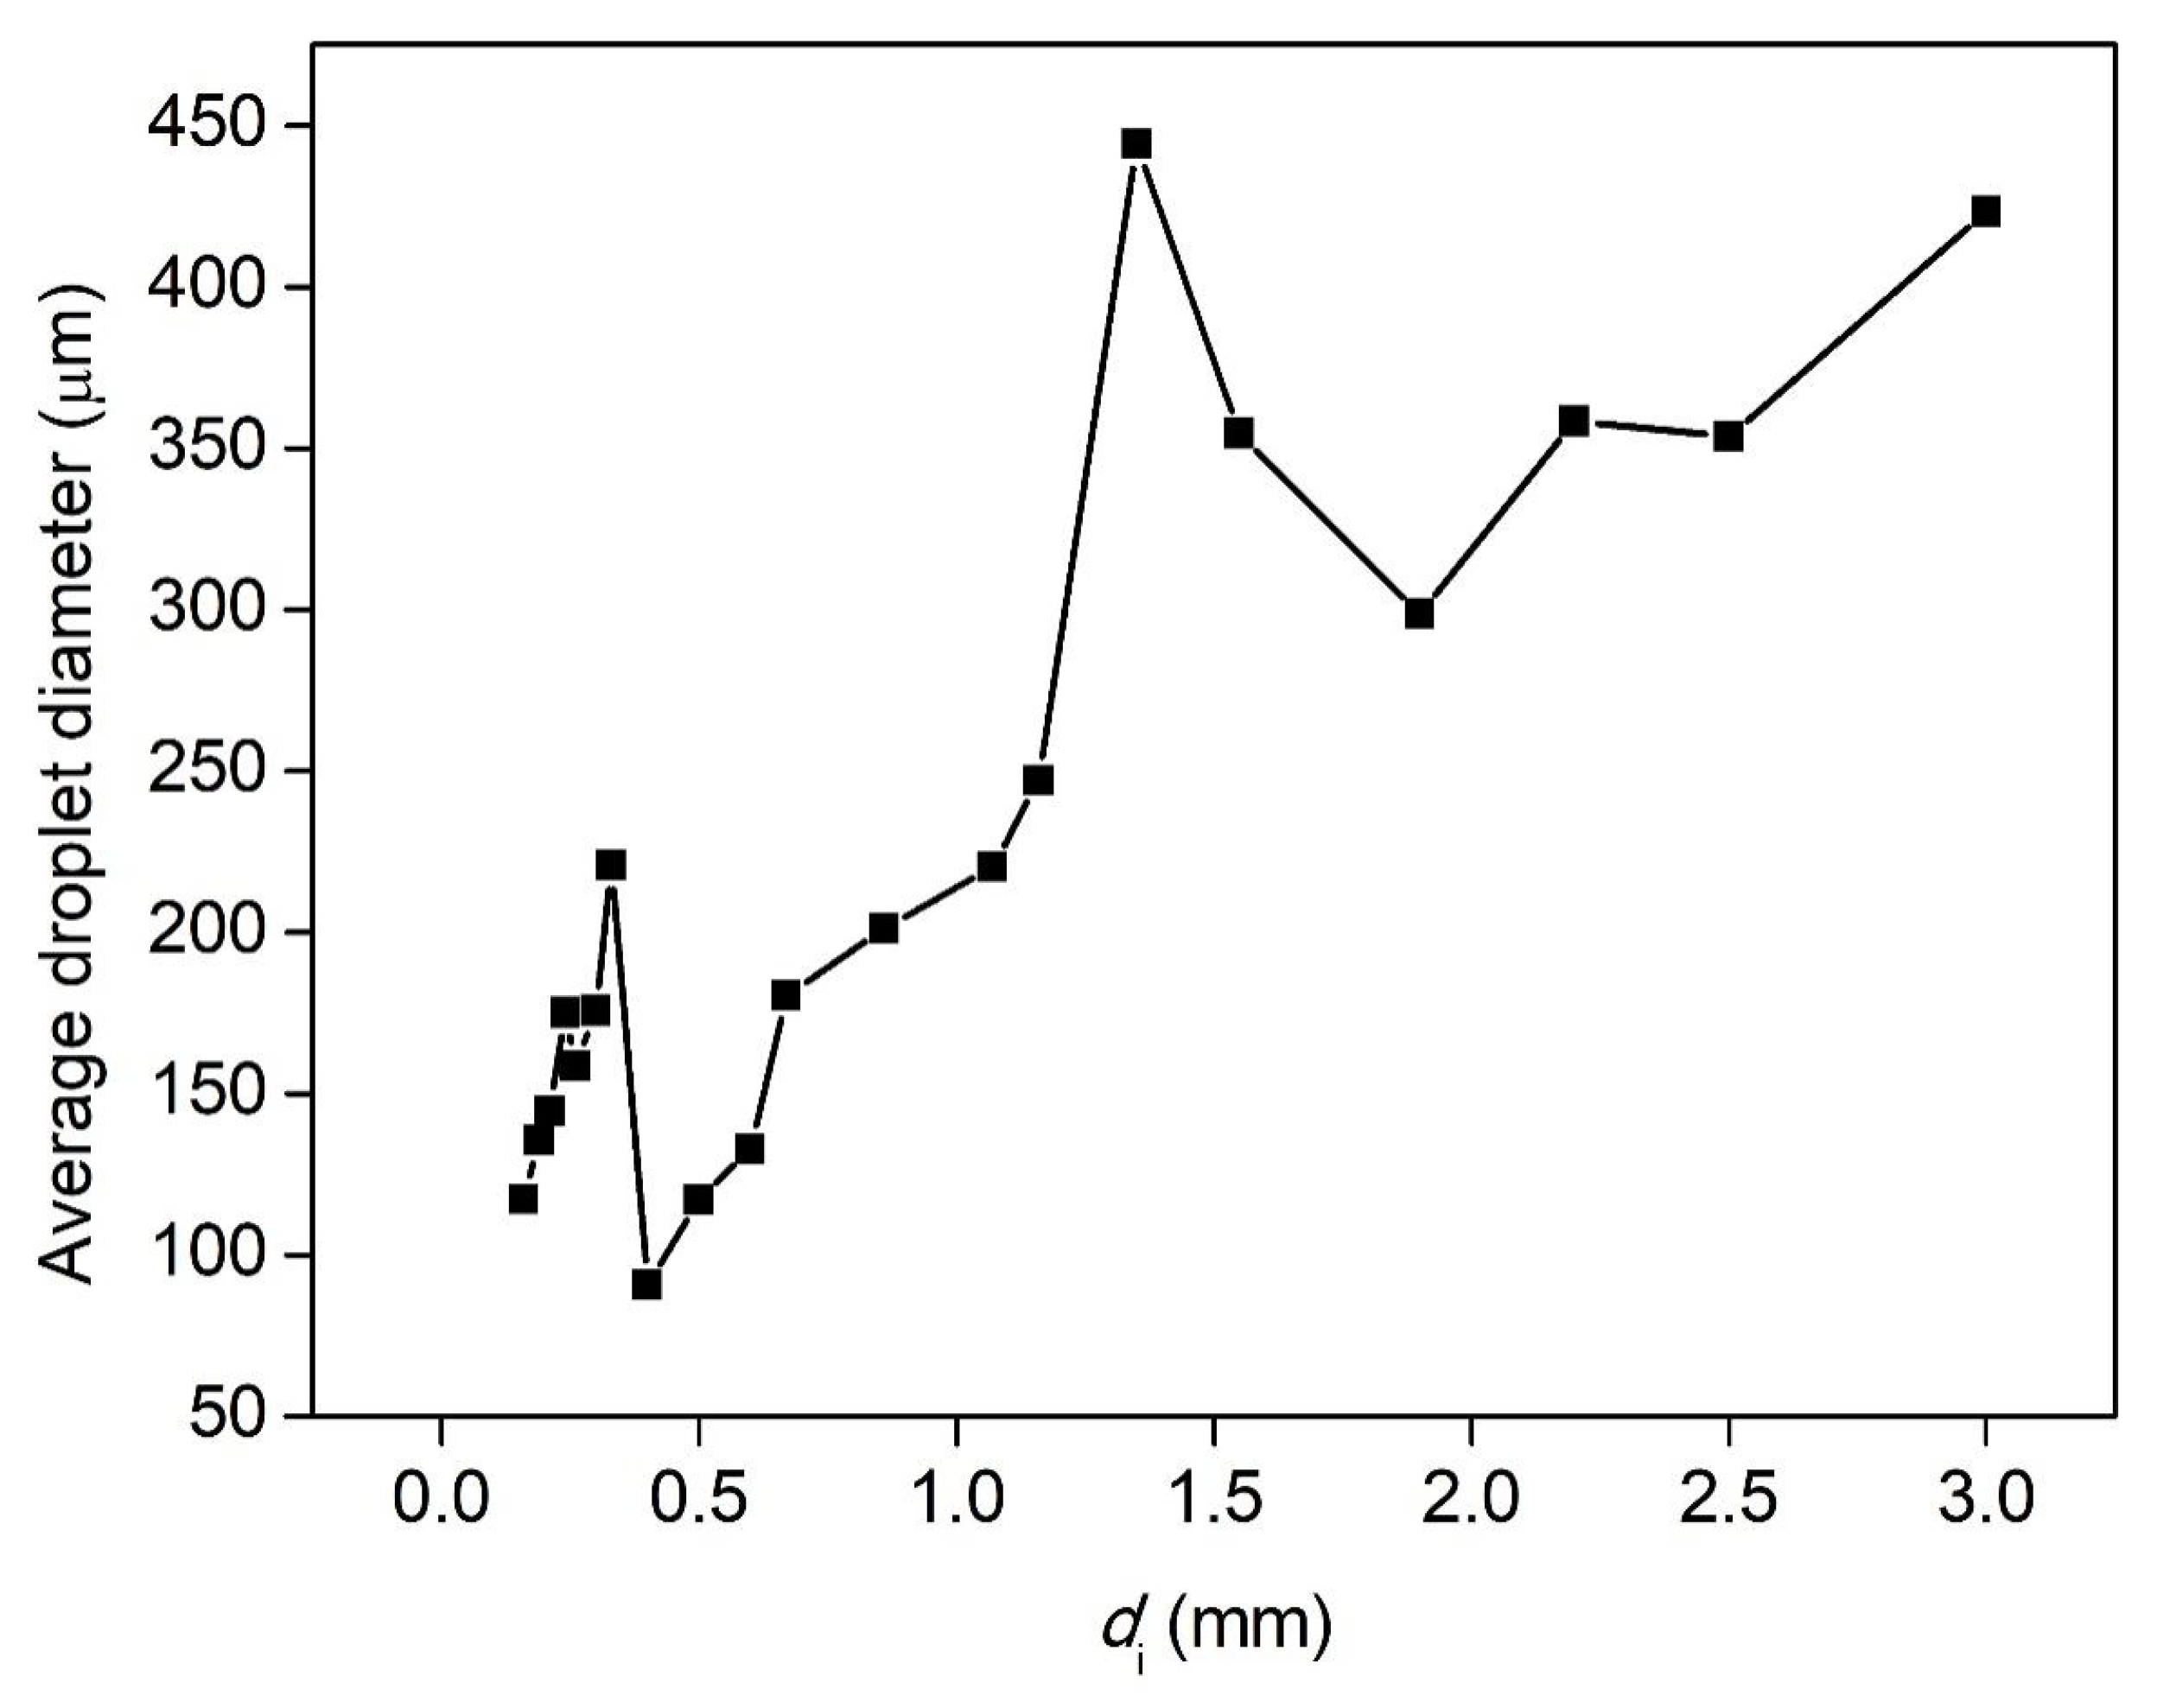
3.3. Effect of Nozzle Size on the Breakup Performance

The breakup of ligaments through the nozzles with different sizes, at the volume flow rate of 500 mL/h and the applied voltage of 28 kV, is shown in Figure 9. The droplet numbers and the average diameters are illustrated in Figure 10 and Figure 11. The histogram of the droplet numbers shows that the first lifting occurred at 22G and 23G nozzles (inner diameter of 0.33 mm and 0.40 mm, respectively). The number of droplets reached the maximum for the 21G nozzle. With the decrease in the nozzle size, the droplet number showed a downward trend. The smaller the nozzle sizes were, the longer the length of ligaments became. It resulted in weak and ineffective charging, and the fragmentation became difficult. Therefore, at the volume flow rate of 500 mL/h, many more droplets could be produced by selecting the 19G–22G nozzles (inner diameter of 0.40–0.67 mm).
The average diameters of breakup droplets totally showed a nonmonotonic downward trend with decreasing the nozzle size, but there were two significant leaps at 13G–15G and at 22G–23G, respectively. For 23G–30G (inner diameter 160–330 μm), the atomization cone angle increased. The droplet-size distribution of 23G was wider than 22G. To obtain optimum breakup performance, in this case, 20G–22G nozzles (inner diameter of 0.4–0.6 mm) need to be installed. The average diameters of droplets reached the minimum value of 90.7 μm with good uniformity and dispersion at 22G.

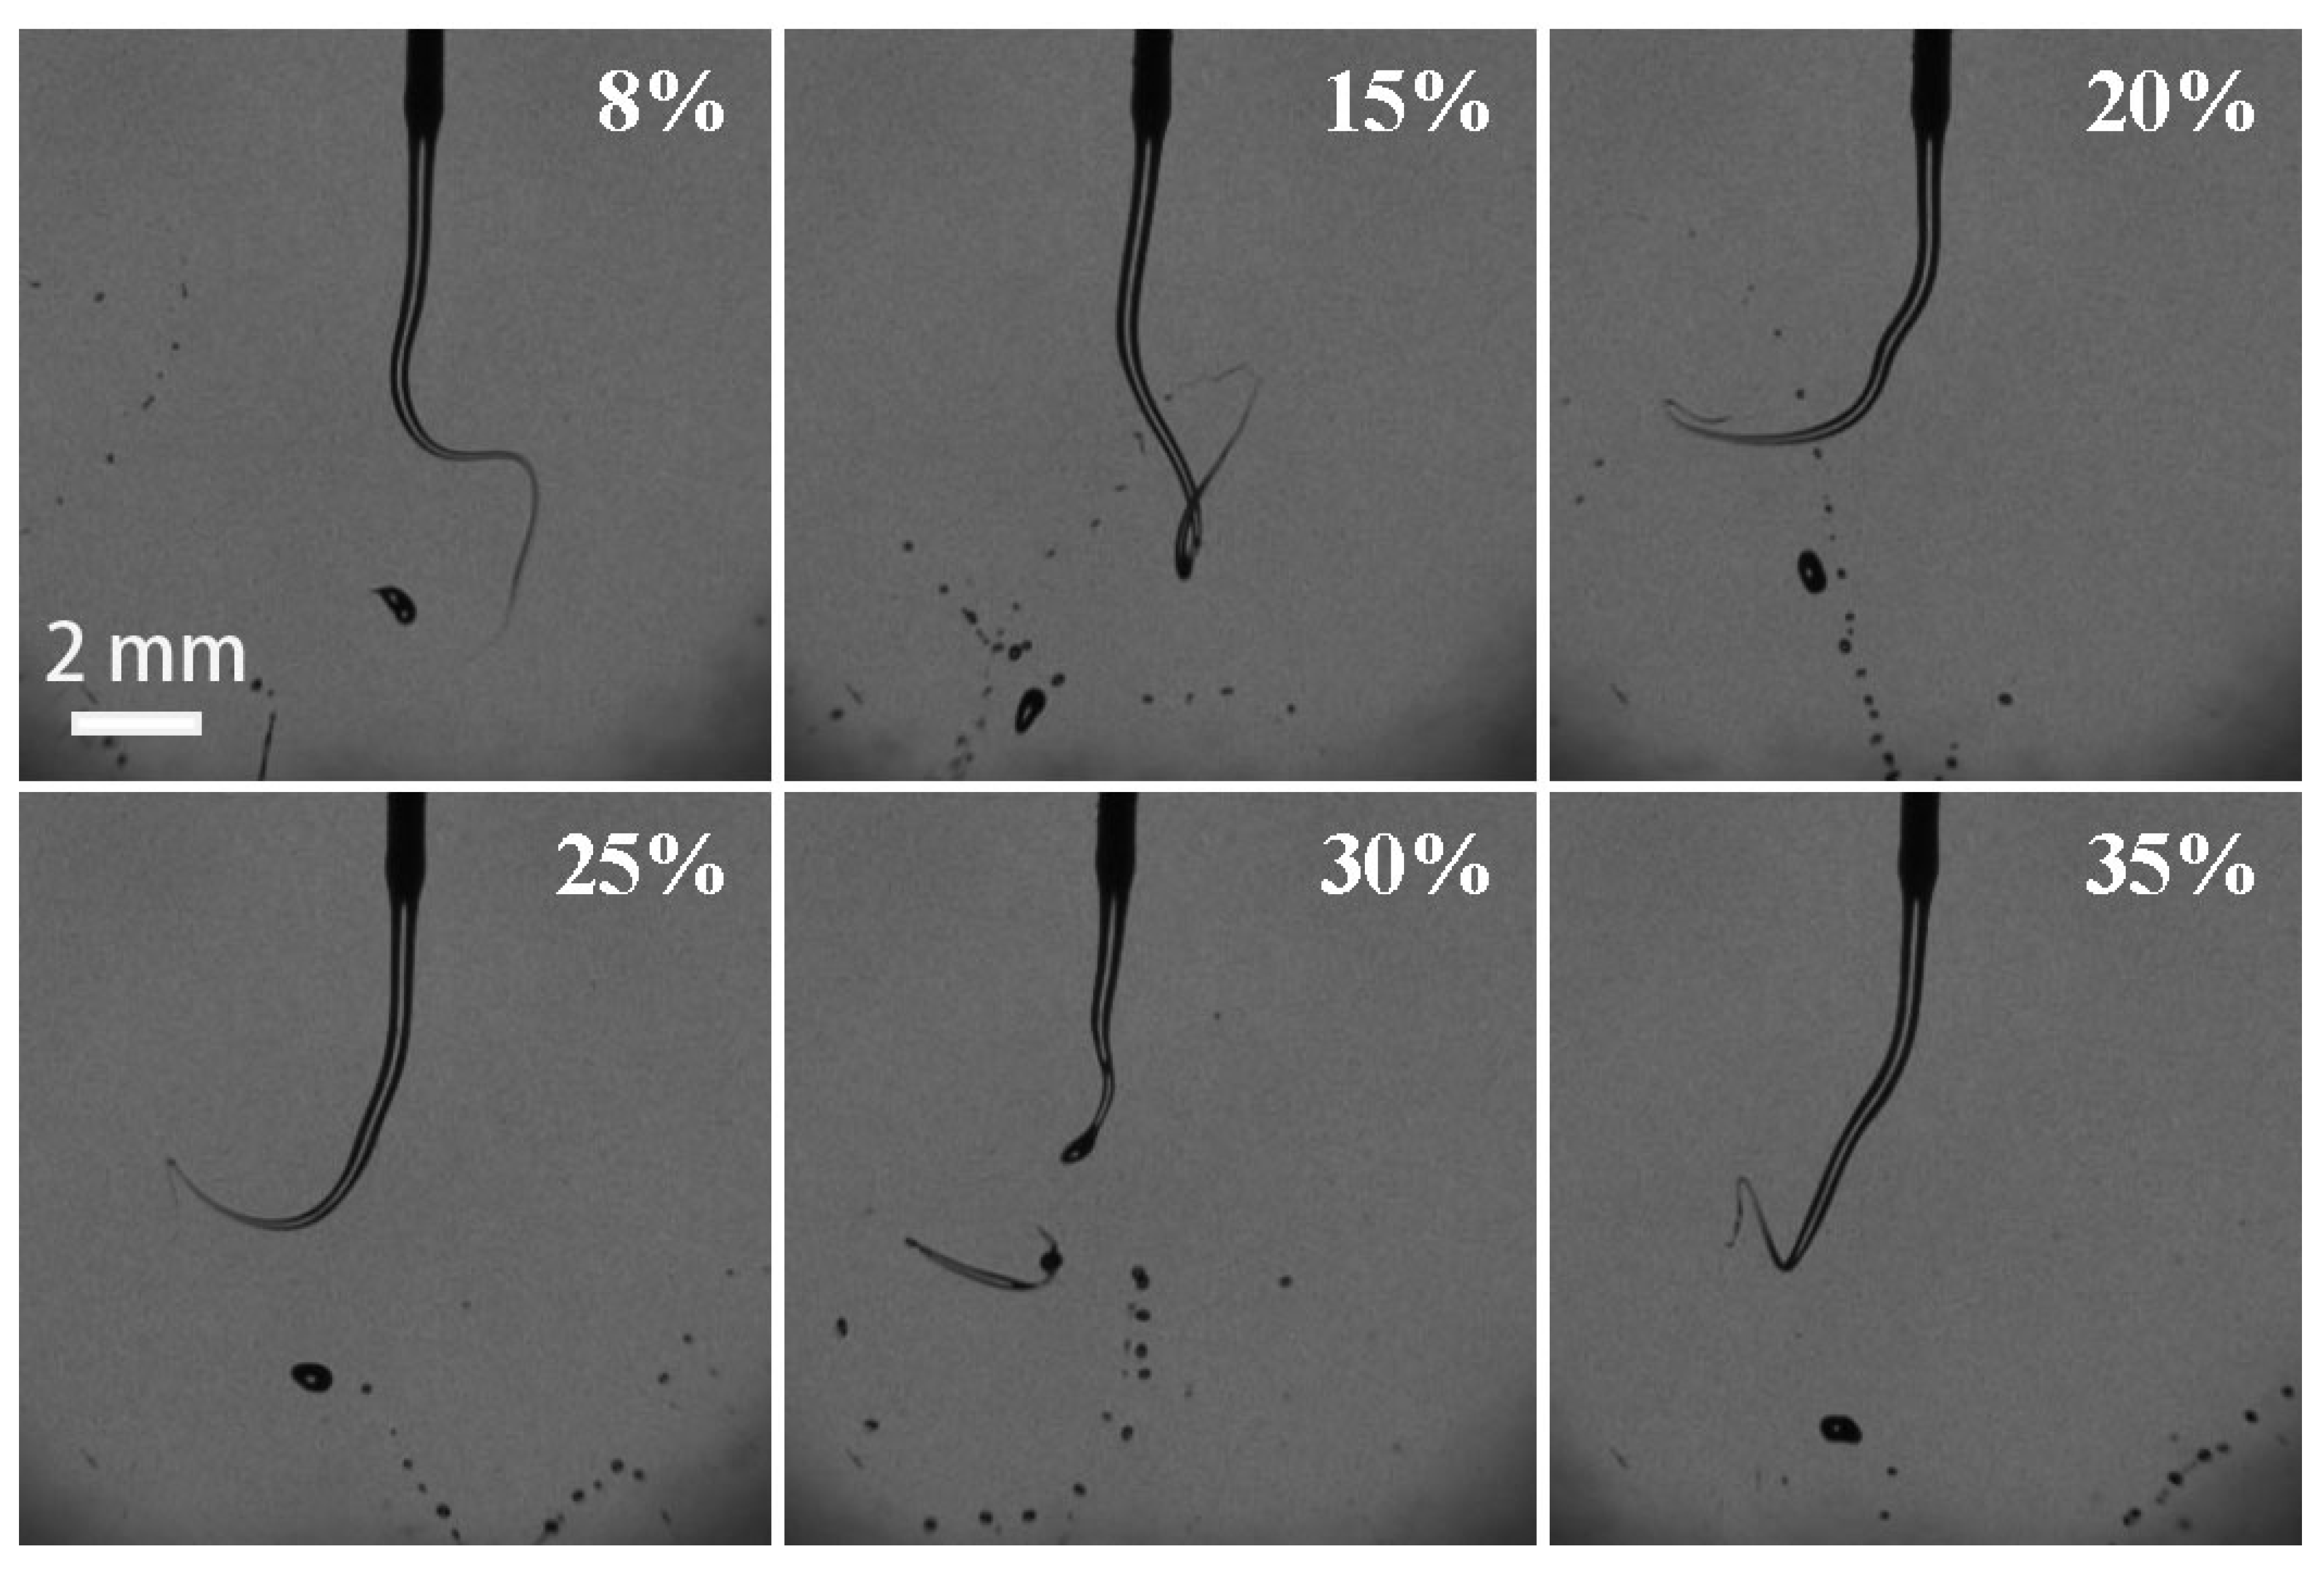
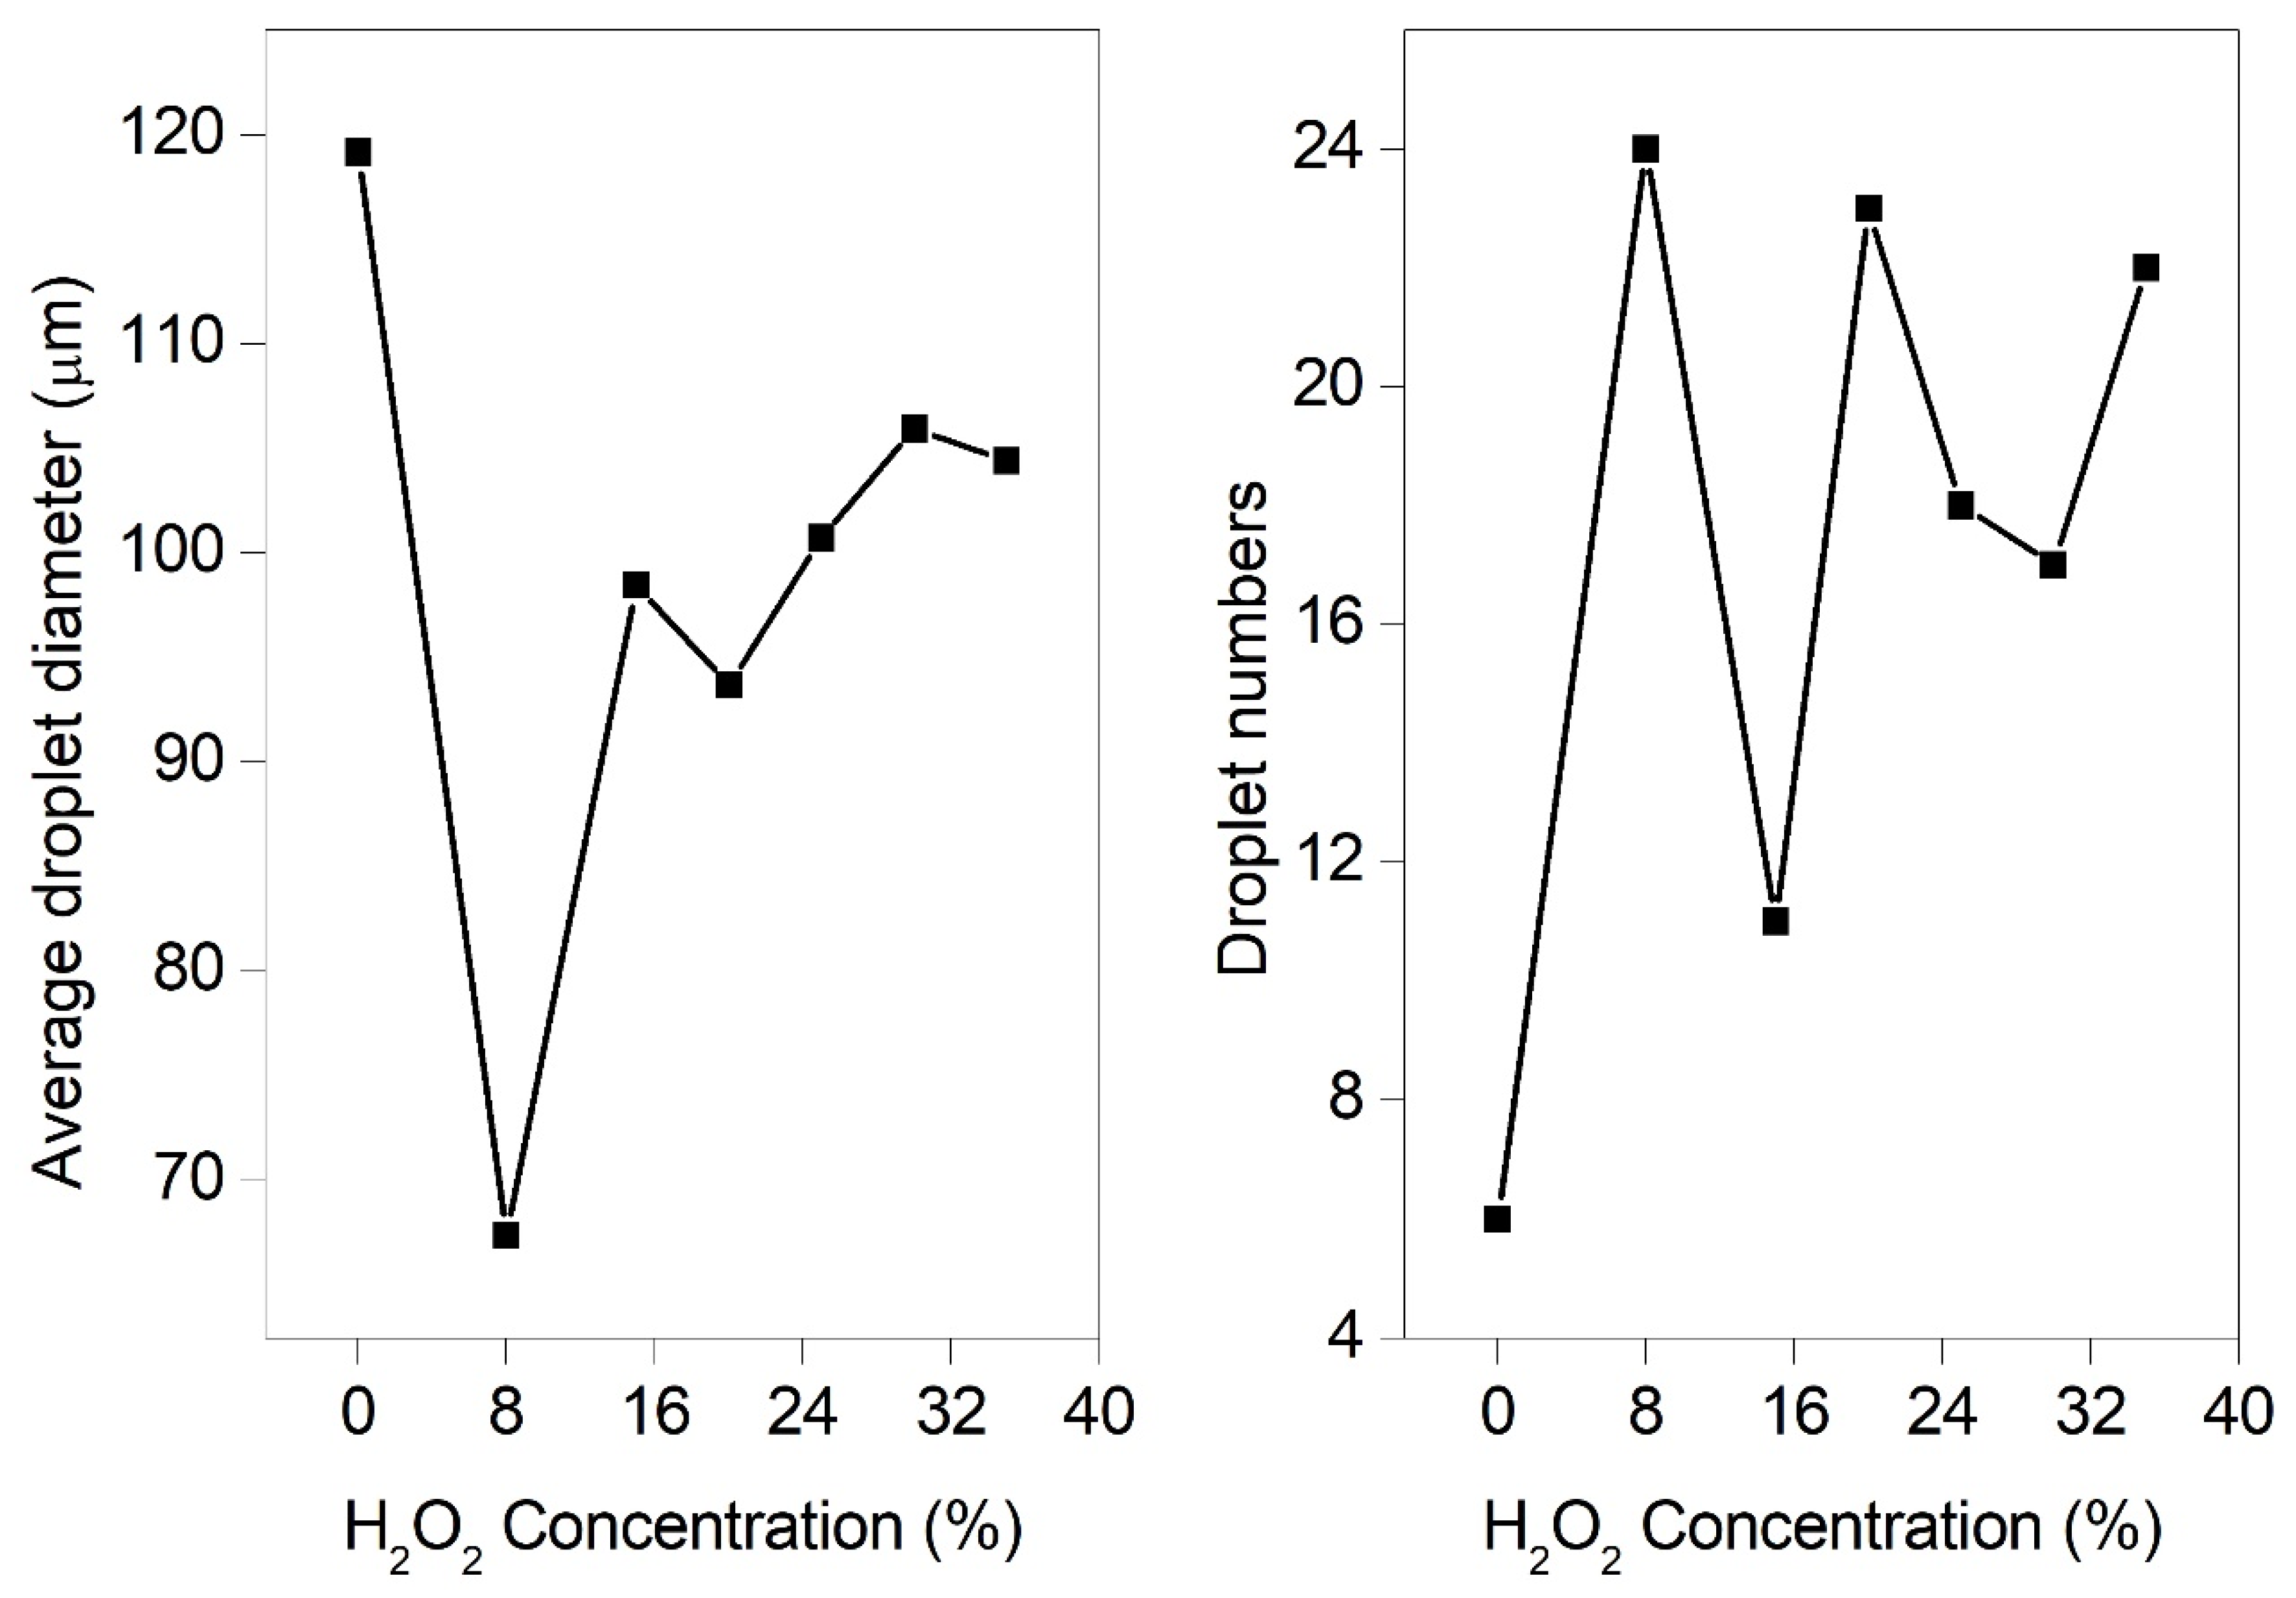
3.4. Effect of H2O2 Concentration on the Breakup Performance

By comparing the breakup performance of H2O2 solutions at different operation conditions, it was found that one of the optimum parameters were 500 mL/h for the volume flow rate, 28 kV for the electrostatic voltage, and 0.5mm (21G) for the nozzle size, respectively. Therefore, the effect of H2O2 concentration on the breakup performance was experimentally performed at the optimum operation conditions. Figure 12 demonstrated the representative breakup snapshots of H2O2 solutions with different concentrations. Their average diameters and the numbers of breakup droplets were statistically illustrated in Figure 13. The H2O2 solution of zero concentration (0 wt. %) means that it is pure deionized water. The results show that the breakup fine droplets of deionized water were mainly in the size range of 104.1–135.7 μm. The droplet-size distribution was uniform, and the average particle size was 119.2 μm. Compared with deionized water, for H2O2 solution of 8 wt. % concentration, the average diameter was 67.4 μm. The increase in H2O2 concentration led to the increase in the average droplet diameter. At the concentration in the range of 8–20 wt. %, the growth rate of the average droplet diameters was significantly faster than that in the range of 20–35 wt. %. At high concentration of 30–35 wt. %, the maximum average diameters of breakup droplets were over 100 μm; however, this was lower than that of pure deionized water. The slight oscillation of diameters of breakup droplets and droplet numbers possibly resulted from the instability of the volume flow rate.

3.5. Mechanism Analysis on Electrostatic Atomization of H2O2 Solution

As the liquid is extruded from a nozzle by pressure, a Taylor cone is formed and a ligament (jet) with unstable surface wave perturbation is produced [28]. If the external force exceeds the surface tension, the ligament will break up into fine droplets. In this work, to produce ultrafine uniformly distributed droplets, the needle ring electrodes were applied to ligaments, and the electrostatic force resulted from the strong electric-field intensity exerted on the ligaments and made them catastrophically break up into fine droplets.
As mentioned above, the size of breakup droplets relates to the physical properties (density, viscosity, surface tension, permittivity, and concentration etc.) of H2O2 solutions and operation conditions (applied voltage, nozzle size, and volume flow rate). To analyze the breakup behavior of H2O2 solutions, the dimensionless parameters that define the ligaments breakup are the Reynolds number (Re), the Weber number (We), and the Ohnesorge number (Oh) without electric field force [29]:
R e = ρ u d i μ , W e = ρ u 2 d i γ , O h = μ ρ γ d i
where u is the velocity of flow, relating with the volume flow rate (Q) and the nozzle size (di). They follow the function of u = 4 Q / ( π d i 2 ) .
For the cases in Section 3.2, as the volume flow rate was enhanced from 25 mL/h to 2000 mL/h, the Re number increased linearly, from 14.2 to 1135.5. This suggests that the breakup of the H2O2 ligaments generally exhibited a laminar regime. The We number increased binomially with the volume flow rate from 0.008 to 47.9. The Oh number kept constant, which was independent of the volume flow rate. For the cases in Section 3.3, as the nozzle size was reduced from 3.0 mm to 0.16 mm, the Re number was inversely proportional to the nozzle size, ranging from 47.3 to 887.1. The We number was a function of the negative cubic of the nozzle size and increased from 0.014 to 91.3. The Oh number increased from 0.002 to 0.01. For the cases in Section 3.4, the Re and We numbers slightly decreased by 16.3 wt. % and 10.3 wt. %, while the Oh number increased by 13.1 wt. %, with the enhancement of H2O2 concentration from 8 wt. % to 35 wt. %, respectively. It resulted from the changes of comprehensive physical properties, including density, viscosity, and surface tension. Obviously, it was found that the increases in volume flow rate, nozzle size, and concentration resulted in the breakup becoming more difficult (Figure 6, Figure 9 and Figure 12) and producing larger droplet diameters (Figure 8, Figure 11, and Figure 13). Therefore, to improve the breakup performance, the effective surface tension needs to be minimized by applying a strong electric field.
When the H2O2 solutions suffer from an electric field, the electrification of H2O2 solutions is crucial to result in an effective reduction of the surface tension, contributing the fragmentation of the ligaments. The effective surface tension ( γ * ) can be written as [30]:
γ * = γ Q C 2 d i 3 48 ε 0
where ε0 is the vacuum permittivity (8.85 × 10⁻¹² C2/(N·m2)), Q c = 8 π 2 ε 0 γ D 3 is the maximum volumetric charge density of the H2O2 solutions, in C/m3, and D is the droplet diameter.
Considering the effect of H2O2 concentration on the breakup behavior, the dimensionless parameters such as effective electrical Reynolds number (ReE(φ)), Weber number (WeE(φ)), and Ohnesorge number (OhE(φ)) can be expressed as [31]:
R e E ( φ ) = ρ ( φ ) b i U μ ( φ ) , W e E ( φ ) = ρ ( φ ) u 2 d i γ * ( φ ) , O h E ( φ ) = μ ( φ ) ρ ( φ ) γ * ( φ ) d i
where bi is the ion mobility, U is the electric-field voltage. Owing to the Rayleigh limit, the H2O2 solution is partly electrified. It means that the charges of q(φ) are fractional to those of QC(φ) [32]. Thus, the electrical dimensionless numbers can be calculated as:
{ R e E ( φ ) = ρ ( φ ) b i U μ ( φ ) W e E ( φ ) = ρ ( φ ) u 2 d i γ ( φ ) q 2 ( φ ) / ( 8 π 2 ε 0 D 3 ) O h E ( φ ) = μ ( φ ) ρ ( φ ) d i ( γ ( φ ) q 2 ( φ ) / ( 8 π 2 ε 0 D 3 ) )
Equation (4) suggests that the applied voltage and the electrification of the solution are crucial to influence the breakup performance of H2O2 ligaments. The nozzle size and the volume flow rate (related to the velocity) are another two operation conditions. Through applying a strong electric field, the effective surface tension obviously decreases since the term Q C 2 ( φ ) d i 3 / 48 ε 0 in Equation (2) is much larger than zero, leading to an increase in WeE(φ).
In the electric field, the ligament suffers from the gravity force, viscous force, electric-field force, atmospheric force, and surface tension. In the case of 28 kV, 21G, 500 mL/h, and 35 wt.%, the approximate calculations show that the order of the force magnitude (10−5~10−4 N) is the electric-field force, surface-tension force, gravity force, viscous force, and atmospheric force, respectively. It suggests that the electric-field force and surface-tension force play primary roles in influencing the breakup of the ligaments. The higher the applied electric-field voltage is, the more charges the ligaments obtain until saturation. If the electrostatic force is larger than the surface-tension force, the ligaments become unstable and undergo catastrophic fragmentation.
The H2O2 concentration has a significant effect on the physical properties that comprehensively influence the breakup performance of H2O2 ligaments. For the case of 8~35 wt. % concentration, although the difference of viscosity of 10% is greater than the difference of surface tension of 1.4%, the magnitude of the electric-field force and surface tension force is larger than the viscous force. It indicates that the electric field and the surface tension forces mainly contribute to the breakup of the ligaments.
With increasing H2O2 concentration, the volumetric charge density QC(φ) and the surface-tension coefficient γ ( φ ) simultaneously change. In our previous work [27], the critical concentration and minimum effective surface tension can be determined using the following equation:
γ * ( φ c ) = M i n [ γ ( φ ) Q C 2 ( φ ) d i 3 48 ε 0 ] , i f d γ * ( φ ) d φ = 0   a n d d 2 γ * ( φ ) d φ 2 > 0 .
According to Equation (5), for this case of 8~35 wt. % concentration, the effective surface tension gradually increases with the increase in the concentration. Thus, as the H2O2 concentration is 8 wt. %, the effective surface tension is minimum, resulting in the smallest breakup droplet diameter. The calculation is consistent with the experimental one shown in Figure 13. For the H2O2 solution with the concentration of 8 wt. %, if the nozzle size of 0.5 mm is installed, the optimum operation conditions keep the supply of the volume flow rate of 500 mL/h at the voltage of 28 kV.

4. Conclusions

Experiments on the atomization characteristics of H2O2 solutions in an electrostatic field were performed. The effects of applied electric-field voltage, nozzle size, volume flow rate, and H2O2 concentration on electrostatic breakup performance were evaluated in detail. The breakup mechanism was deeply discussed by the analysis of dimensionless parameters.
The increase in applied electric-field voltage, reduction in the nozzle size, and modulation of the volume flow rate significantly improve the breakup performance, producing finer and more uniformly distributed droplets. For H2O2 solution of 35 wt. % concentration, the smallest average diameter of breakup droplets reached 92.8 μm at the operation conditions of 28 kV, 0.5 mm, and 500 mL/h, respectively. With decreasing H2O2 concentration (8~35 wt. %), at optimum operation conditions, the average diameters of breakup droplets decreased. For H2O2 solution of 8 wt. % concentration, the average diameter was 67.4 μm. The calculation on the concentration effect on breakup performance shows that the average diameter of breakup droplets reaches its minimum at 8 wt. % concentration, which is consistent with the experimental results. To obtain the best atomization performance, the operation conditions and physical properties need to be modulated for practical industrial application.
The electrostatic atomization of H2O2 was carried out at room temperature and atmospheric pressure, no water vapor was produced, and then the water-condensation disadvantage could be eliminated during the sterilization process as well as in the propulsion system. Moreover, the electrostatic atomization of H2O2 makes it easy to be ready to use, which fits for the miniaturization of the propulsion system to meet with the continuing demand to develop the capabilities of micro-/nanosatellites.

Author Contributions

Conceptualization, X.H. and S.L.; methodology, X.H. and S.L.; investigation, L.S., Y.L., S.L. and X.H.; data curation, L.S. and Y.L.; Writing—original draft, Y.L. and L.S.; Writing—review & editing, S.L. and X.H. All authors have read and agreed to the published version of the manuscript.

Funding

This work was financially supported by National Natural Science Foundation of China (52027809 & 51976050).

Conflicts of Interest

The authors declare no conflict of interest.

References

  1. Gatineau, M.; El-Warrak, A.O.; Bolliger, C.; Mourez, M.; Berthiaume, F. Effects of sterilization with hydrogen peroxide gas plasma, ethylene oxide, and steam on bioadhesive properties of nylon and polyethylene lines used for stabilization of canine stifle joints. Am. J. Vet. Res. 2012, 73, 1665–1669. [Google Scholar] [CrossRef] [PubMed]
  2. McEvoy, B.; Rowan, N.J. Terminal sterilization of medical devices using vaporized hydrogen peroxide: A review of current methods and emerging opportunities. J. Appl. Microbiol. 2019, 127, 1403–1420. [Google Scholar] [CrossRef] [PubMed] [Green Version]
  3. Ansari, I.A.; Datta, A.K. An overview of sterilization methods for packaging materials used in aseptic packaging systems. Food Bioprod. Process. 2003, 81, 57–65. [Google Scholar] [CrossRef] [Green Version]
  4. Rohatgi, N.; Schubert, W.; Koukol, R.; Foster, T.L.; Stabekis, P.D. Certification of vapor phase hydrogen peroxide sterilization process for spacecraft application. In Proceedings of the 32nd ICES Conference, San Antonio, TX, USA, 15 July 2002. [Google Scholar]
  5. Ciriminna, R.; Albanese, L.; Meneguzzo, F.; Pagliaro, M. Hydrogen peroxide: A key chemical for today’s sustainable development. ChemSusChem 2016, 9, 3374–3381. [Google Scholar] [CrossRef] [PubMed]
  6. Ventura, M.; Mullens, P. The use of hydrogen peroxide for propulsion and power. In Proceedings of the 35th AIAA/ASME/SAE/ASEE Joint Propulsion Conference and Exhibit, Los Angeles, CA, USA, 20–24 June 1999. [Google Scholar]
  7. Pasini, A.; Torre, L.; Romeo, L.; Cervone, A.; d’Agostino, L. Testing and Characterization of a Hydrogen Peroxide Monopropellant Thruster. J. Propuls. Power 2008, 24, 507–515. [Google Scholar] [CrossRef]
  8. Zaseck, C.R.; Son, S.F.; Pourpoint, T.L. Combustion of micron-aluminum and hydrogen peroxide propellants. Combust. Flame 2013, 160, 184–190. [Google Scholar] [CrossRef]
  9. Woschnak, A.; Krejci, D.; Schiebl, M.; Scharlemann, C. Development of a green bipropellant hydrogen peroxide thruster for attitude control on satellites. Prog. Propuls. Phys. 2013, 4, 689–706. [Google Scholar]
  10. Nagiev, T.M. The coupled reactions of oxidation by hydrogen peroxide. Russ. Chem. Rev. 1985, 54, 974–985. [Google Scholar] [CrossRef]
  11. Quinn, J. Oxidizer selection for the ISTAR program (liquid oxygen versus hydrogen peroxide). In Proceedings of the 38th AIAA/ASME/SAE/ASEE Joint Propulsion Conference & Exhibit, Indianapolis, IN, USA, 7–10 July 2002. [Google Scholar]
  12. Low, A.; Lay, M.; Verbeek, J.; Swan, J. Decoloring hemoglobin as a feedstock for second-generation bioplastics. Prep. Biochem. Biotechnol. 2012, 42, 29–43. [Google Scholar] [CrossRef]
  13. Cramer, J.; Greene, M.; Pal, S.; Santoro, R. RBCC ejector mode operating characteristics for single and twin thruster configurations. In Proceedings of the 37th Joint Propulsion Conference and Exhibit, Salt Lake City, UT, USA, 8–11 July 2001. [Google Scholar]
  14. Scharlemann, C. Development of Miniaturized Green Propellant Based Mono-and Bipropellant Thrusters. In Proceedings of the 43rd AIAA/ASME/SAE/ASEE Joint Propulsion Conference & Exhibit, Cincinnati, OH, USA, 8–11 July 2007. [Google Scholar]
  15. Resendel, M.G.; Ribeiro, C.C. GRASP with path-relinking: Recent advances and applications. In Metaheuristics: Progress as Real Problem Solvers; Springer: Boston, MA, USA, 2005; pp. 29–63. [Google Scholar]
  16. Lehmann, A.; Overton, J.M.C.; Leathwick, J.R. GRASP: Generalized regression analysis and spatial prediction. Ecol. Model. 2002, 157, 189–207. [Google Scholar] [CrossRef]
  17. Krejci, D.; Woschnak, A.; Scharlemann, C.; Ponweiser, K. Hydrogen peroxide decomposition for micro propulsion: Simulation and experimental verification. In Proceedings of the 47th AIAA/ASME/SAE/ASEE Joint Propulsion Conference & Exhibit, San Diego, CA, USA, 31 July–3 August 2011. [Google Scholar]
  18. Ahmed, T.; Kourmatzis, A.; Masri, A.R. Atomization behaviour of a hybrid air-blast-electrostatic atomizer for spray combustion. Fuel 2021, 288, 119716. [Google Scholar] [CrossRef]
  19. Zeng, W.; Guo, P.; Jiang, P.; Liu, W.; Hong, T.; Chen, C. Combination of microfluidic chip and electrostatic atomization for the preparation of drug-loaded core–shell nanoparticles. Nanotechnology 2020, 31, 145301. [Google Scholar] [CrossRef] [PubMed]
  20. Teng, C.; Li, J. Experimental Study on Particle Removal of a Wet Electrostatic Precipitator with Atomization of Charged Water Drops. Energy Fuels 2020, 34, 7257–7268. [Google Scholar] [CrossRef]
  21. Hara, M.; Ishibe, S.; Sumiyoshitani, S.; Akazaki, M. Electrical corona and specific charge on water drops from a cylindrical conductor with high d.c. voltage. J. Electrost. 1980, 8, 239–270. [Google Scholar] [CrossRef]
  22. Maski, D.; Durairaj, D. Effects of electrode voltage, liquid flow rate, and liquid properties on spray chargeability of an air-assisted electrostatic-induction spray-charging system. J. Electrost. 2010, 68, 152–158. [Google Scholar] [CrossRef]
  23. Chen, G.; Gomez, A. Counterflow diffusion flames of quasi-monodisperse electrostatic sprays. Symp. Combust. 1992, 24, 1531–1539. [Google Scholar] [CrossRef]
  24. Kreitzer, P.; Kuhlman, J.; Mehra, D.; Gray, D.; Yerkes, K. Effects of contact charging on spray impingement heat transfer performance and spray behavior. In Proceedings of the 39th AIAA Thermophysics Conference, Miami, FL, USA, 25–28 June 2007. [Google Scholar]
  25. William, B.M. Hydrogen peroxide-ACS Monograph Series: By Walter C. Schumb, Charles N. Satterfield and Ralph L. Wentworh. J. Frankl. Inst. 1956, 261, 380. [Google Scholar]
  26. Li, S.; Zhuo, Z.; He, L.; Huang, X. Atomization characteristics of nano-Al/ethanol nanofluid fuel in electrostatic field. Fuel 2019, 236, 811–819. [Google Scholar] [CrossRef]
  27. Zhuo, Z.; Li, S.; Lu, Y.; Huang, X. Synergetic effects of nanoparticle concentration and electrification on the breakup performance of nanofluid fuel. Int. J. Heat Mass Transf. 2019, 137, 940–950. [Google Scholar] [CrossRef]
  28. Cloupeau, M.; Prunet-Foch, B. Electrostatic spraying of liquids in cone-jet mode. J. Electrostat 1989, 22, 135–159. [Google Scholar] [CrossRef]
  29. Yoon, S.S.; Heister, S.D. Categorizing linear theories for atomizing round jets. At. Sprays 2003, 13, 499–516. [Google Scholar] [CrossRef]
  30. Kourmatzis, A.; Ergene, E.L.; Shrimpton, J.S.; Kyritsis, D.C.; Mashayek, F.; Huo, M. Combined aerodynamic and electrostatic atomization of dielectric liquid jets. Exp. Fluids 2012, 53, 221–235. [Google Scholar] [CrossRef]
  31. Rigit, A.R.H.; Shrimpton, J.S. Electrical performance of charge injection electrostatic atomizers. At. Sprays 2006, 16, 401–419. [Google Scholar] [CrossRef]
  32. Rigit, A.R.H.; Shrimpton, J.S. Spray characteristics of charge injection electrostatic atomizers with small orifice diameter. At. Sprays 2006, 16, 421–442. [Google Scholar]
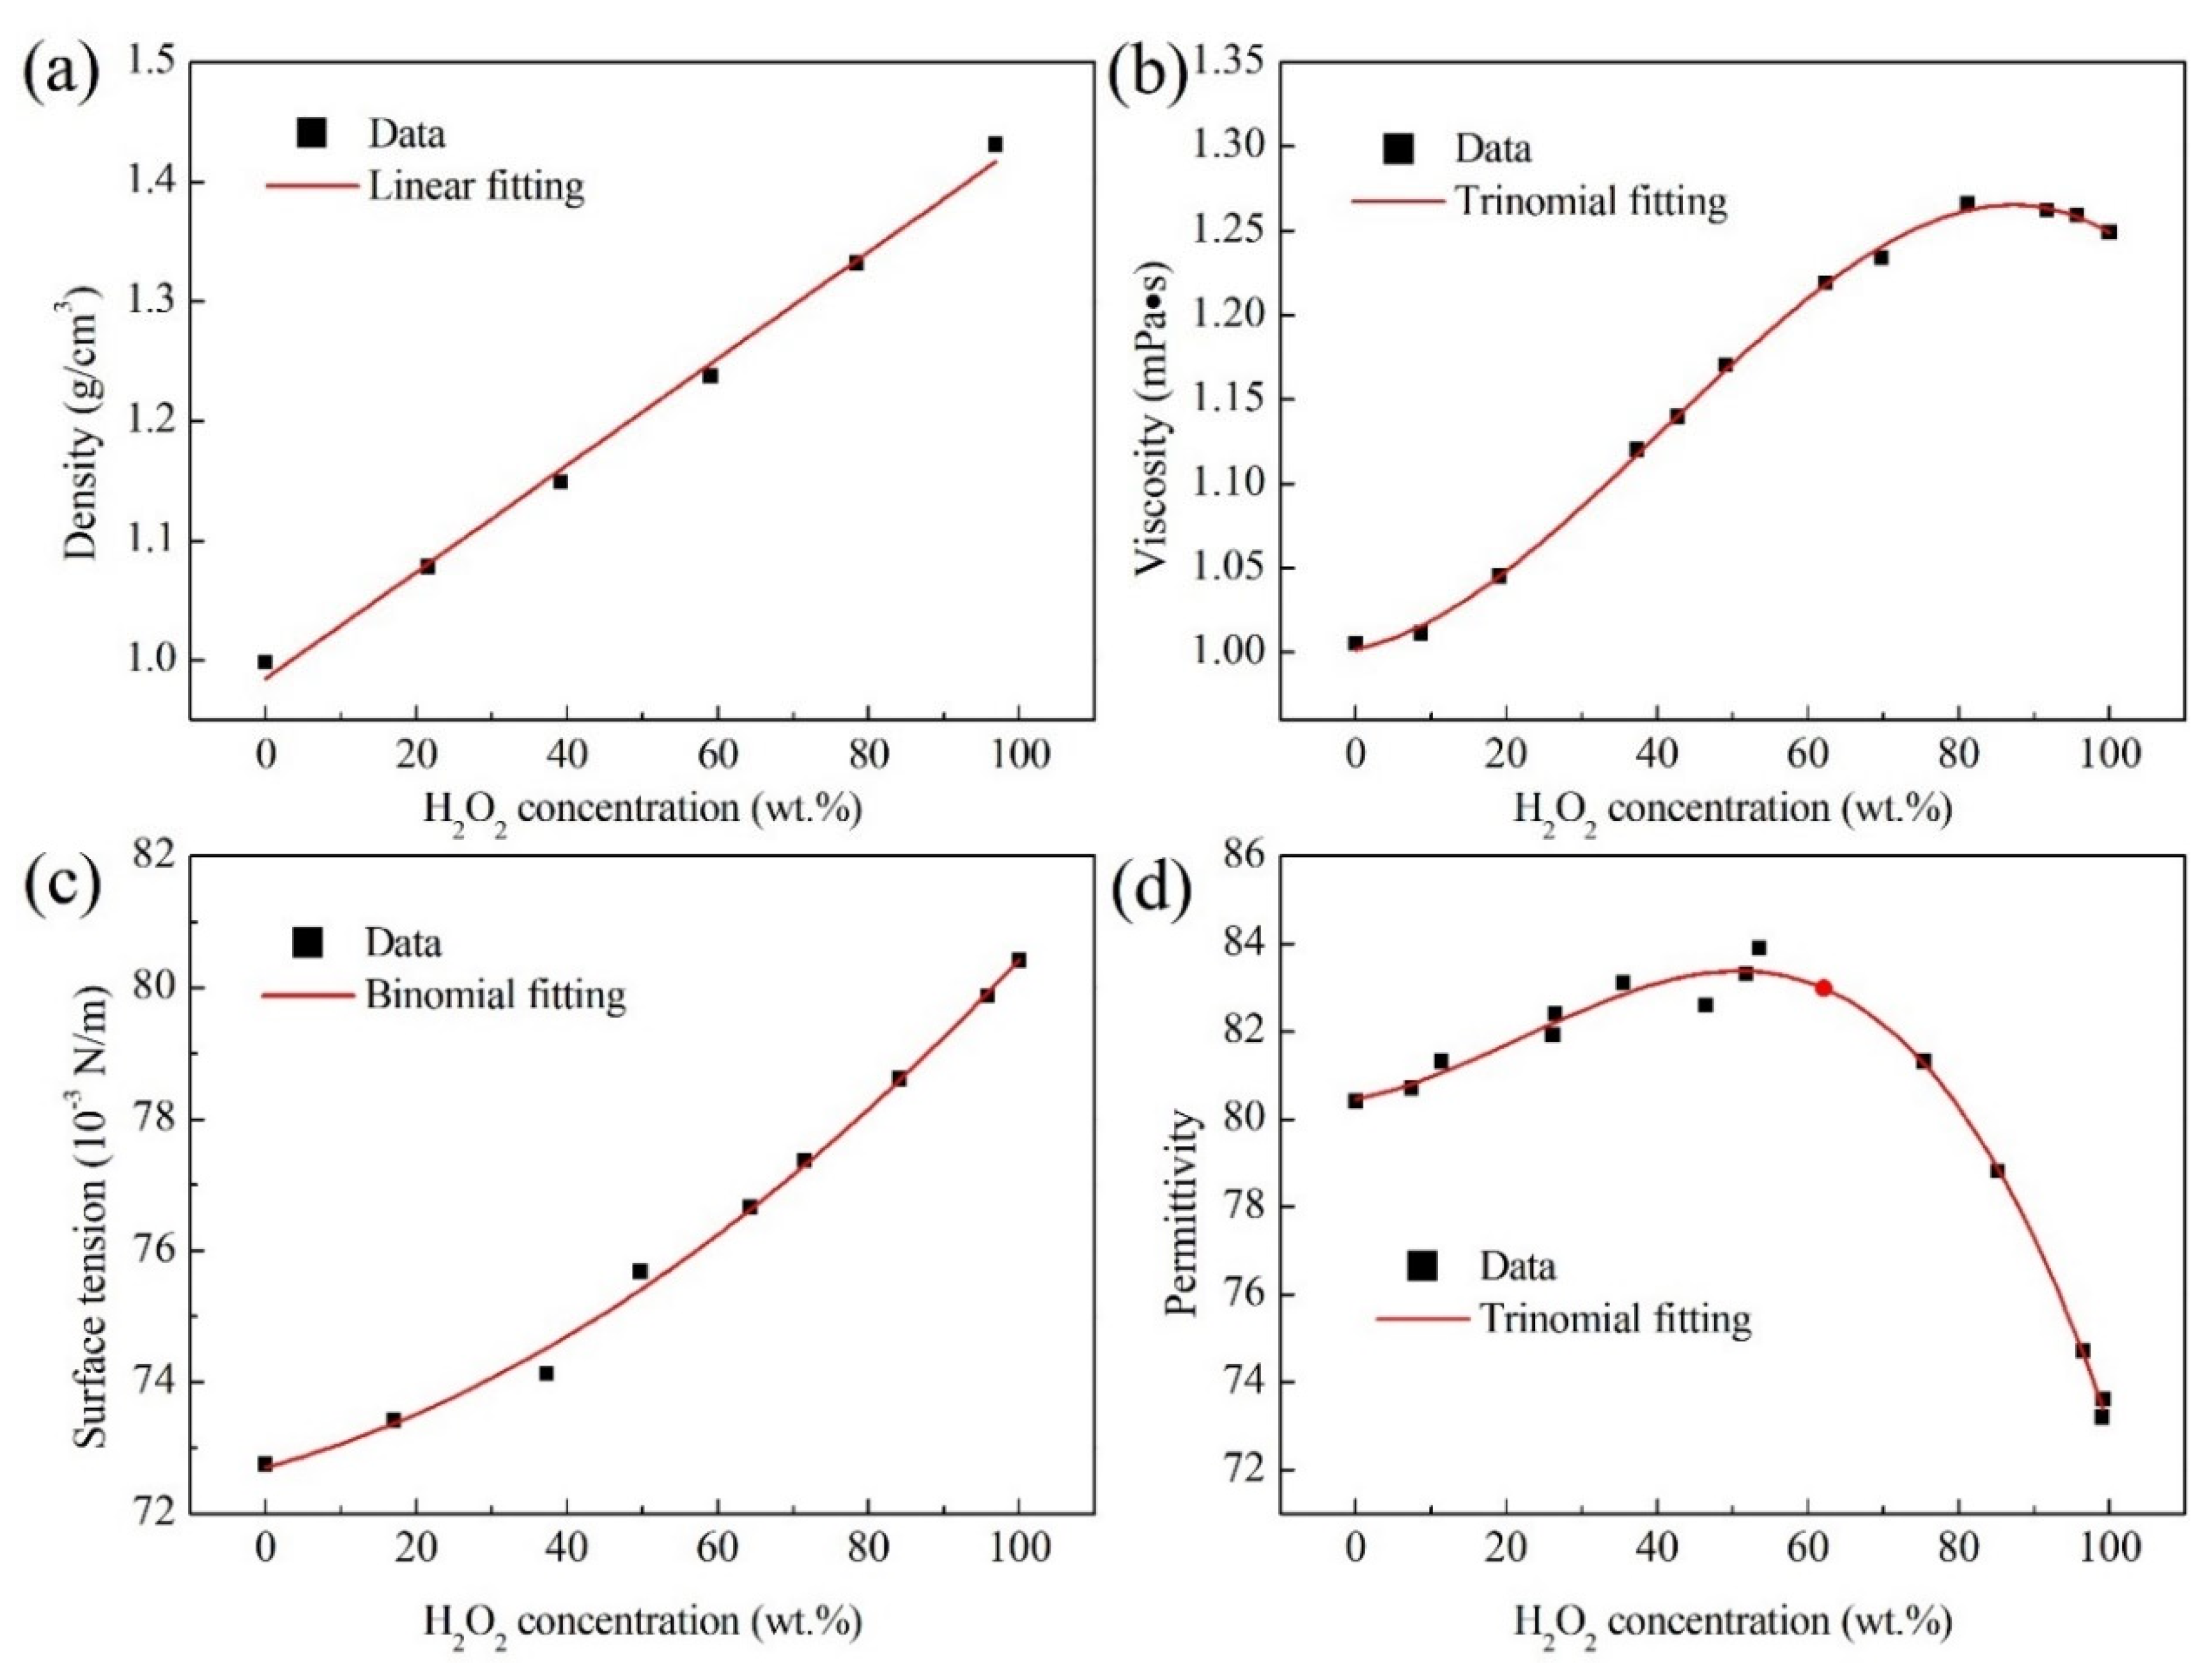
Figure 1. The physical properties of H2O2 solutions at the room temperature of ~20 °C. (a) Density; (b) Viscosity; (c) Surface tension; (d) Relative permittivity.
Micromachines 13 00771 g001
Figure 2. Schematic diagram of experimental setup.
Micromachines 13 00771 g002
Figure 3. Pictures of electrostatic breakup of H2O2 ligaments and droplet formation at different electric field voltages (21G nozzle, flow rate of 400 mL/h, 35 wt. % concentration).
Micromachines 13 00771 g003
Figure 4. The numbers of breakup droplets and the average droplet diameters at different voltages (21G nozzle, flow rate of 400 mL/h, 35 wt. % concentration).
Micromachines 13 00771 g004
Figure 5. The average diameters of main droplets at different voltages (21G nozzle, flow rate of 400 mL/h, 35 wt. % concentration).
Micromachines 13 00771 g005
Figure 6. Pictures of electrostatic breakup of H2O2 ligaments and droplet formation at different volume flow rates (21G nozzle, voltage of 28 kV, 35 wt. % concentration).
Micromachines 13 00771 g006
Figure 7. The numbers of breakup droplets at different volume flow rates (21G nozzle, voltage of 28 kV, 35 wt. % concentration).
Micromachines 13 00771 g007
Figure 8. The average diameters of breakup droplets at different volume flow rates (21G nozzle, voltage of 28 kV, 35 wt. % concentration).
Micromachines 13 00771 g008
Figure 9. Pictures of electrostatic breakup of H2O2 ligaments and droplet formation at different nozzle sizes (flow rate of 500 mL/h, voltage of 28 kV, 35 wt. % concentration).
Micromachines 13 00771 g009
Figure 10. The droplet numbers of H2O2 ligaments electrostatic breakup at different nozzle sizes (flow rate of 500 mL/h, voltage of 28 kV, 35 wt. % concentration).
Micromachines 13 00771 g010
Figure 11. The average diameters of H2O2 ligaments electrostatic breakup at different nozzle sizes (flow rate of 500 mL/h, voltage of 28 kV, 35 wt. % concentration).
Micromachines 13 00771 g011
Figure 12. Pictures of electrostatic breakup of H2O2 ligaments and droplet formation at different H2O2 concentrations (21G nozzle, flow rate of 500 mL/h, voltage of 28 kV).
Micromachines 13 00771 g012
Figure 13. The average droplet diameters and the numbers of breakup droplets at different H2O2 concentrations (21G nozzle, flow rate of 500 mL/h, voltage of 28 kV).
Micromachines 13 00771 g013
Table 1. The correlations of density, surface tension, viscosity, and permittivity of H2O2 solutions with the concentration.
Physical PropertiesModel Formula
Density (ρ) ρ = 0.0044 φ + 0.9846 ; R2 = 0.994
Viscosity (μ) μ = 6.64891 × 10 7 φ 3 + 8.13872 × 10 5 φ 2 + 9.81670 × 10 4 φ + 1.00178 ; R2 = 0.998
Surface tension (γ) γ = 4.55974 × 10 4 φ 2 + 0.03170 φ + 72.69847 ; R2 = 0.994
Permittivity (ε) ε = 3.17113 × 10 5 φ 3 + 0.0021 φ 2 + 0.03261 φ + 80.45818 ; R2 = 0.990
Table 2. Dimensions of atomization nozzles.
Nozzle TypesInner Diameter (di, mm)Outer Diameter (do, mm)
10G3.003.50
11G2.503.00
12G2.202.80
13G1.902.40
14G1.552.10
15G1.351.80
16G1.161.60
17G1.071.47
18G0.861.26
19G0.671.07
20G0.600.90
21G0.500.80
22G0.400.70
23G0.330.63
24G0.300.55
25G0.260.50
26G0.240.45
27G0.210.40
28G0.190.35
30G0.160.31
Publisher’s Note: MDPI stays neutral with regard to jurisdictional claims in published maps and institutional affiliations.

