
An Automated Centrifugal Microfluidic Platform for Efficient Multistep Blood Sample Preparation and Clean-Up towards Small Ion-Molecule Analysis


Abstract
1. Introduction
2. Materials and Methods
2.1. GLAD Film Preparation for MALDI-MS
2.2. Design and Fabrication of the Centrifugal Disc
2.3. Analysis of Processed Sample by Offline LC-MS
2.4. Analysis of Processed Sample by MALDI-MS
3. Results
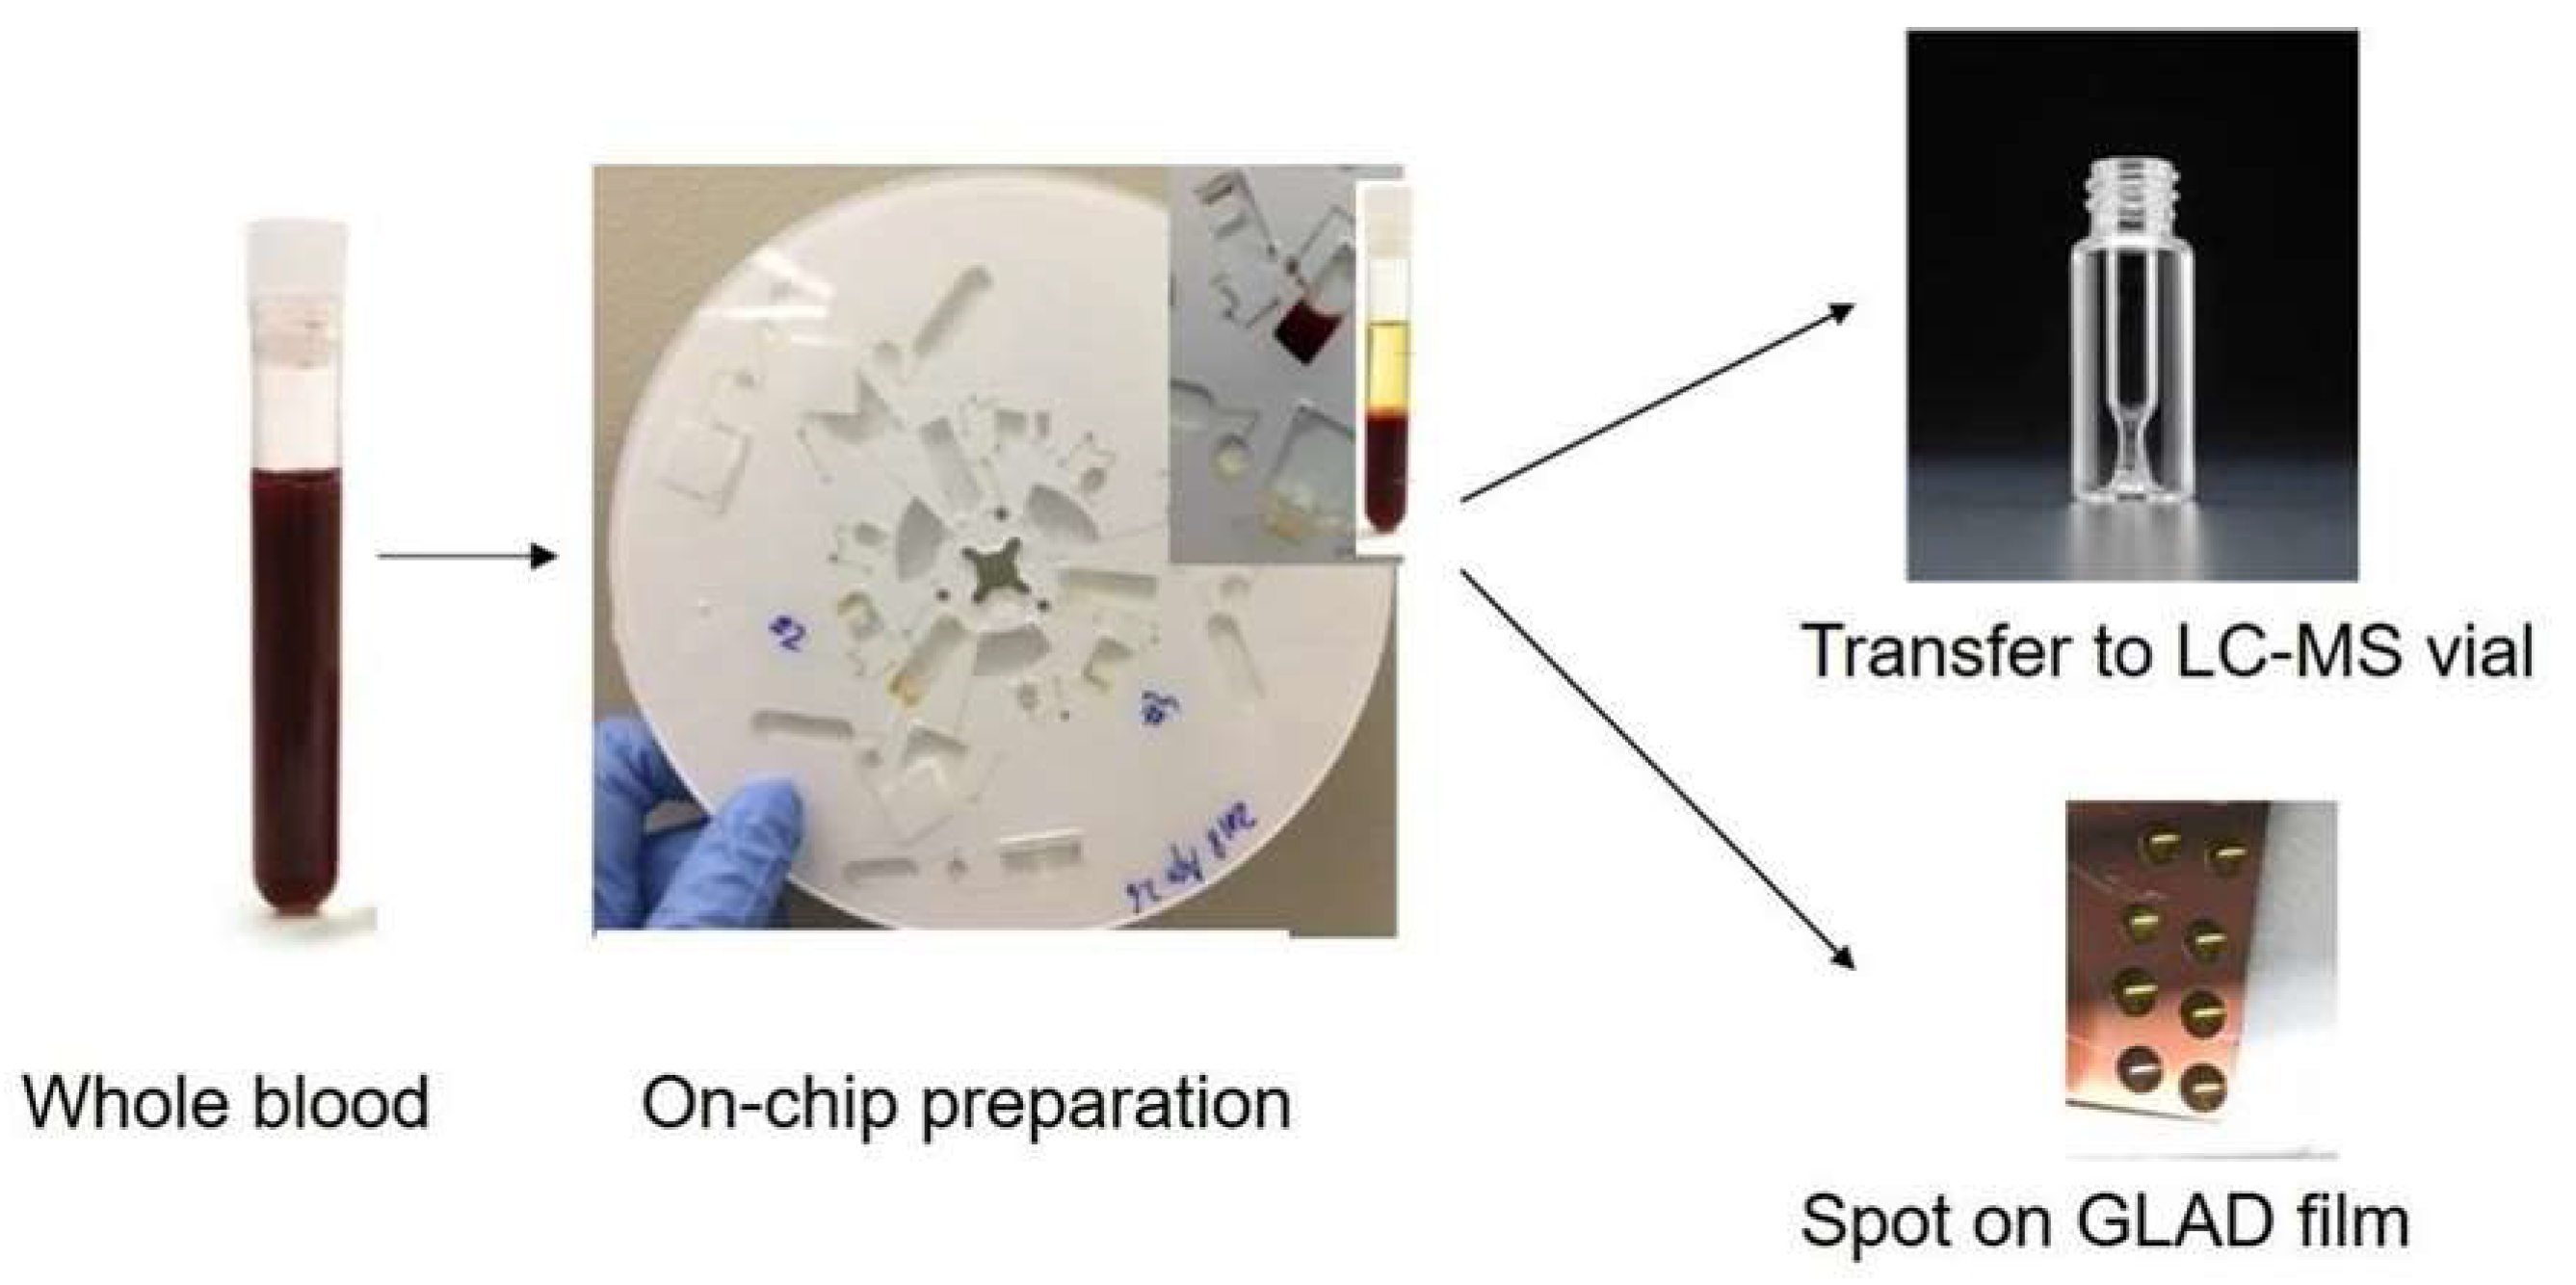
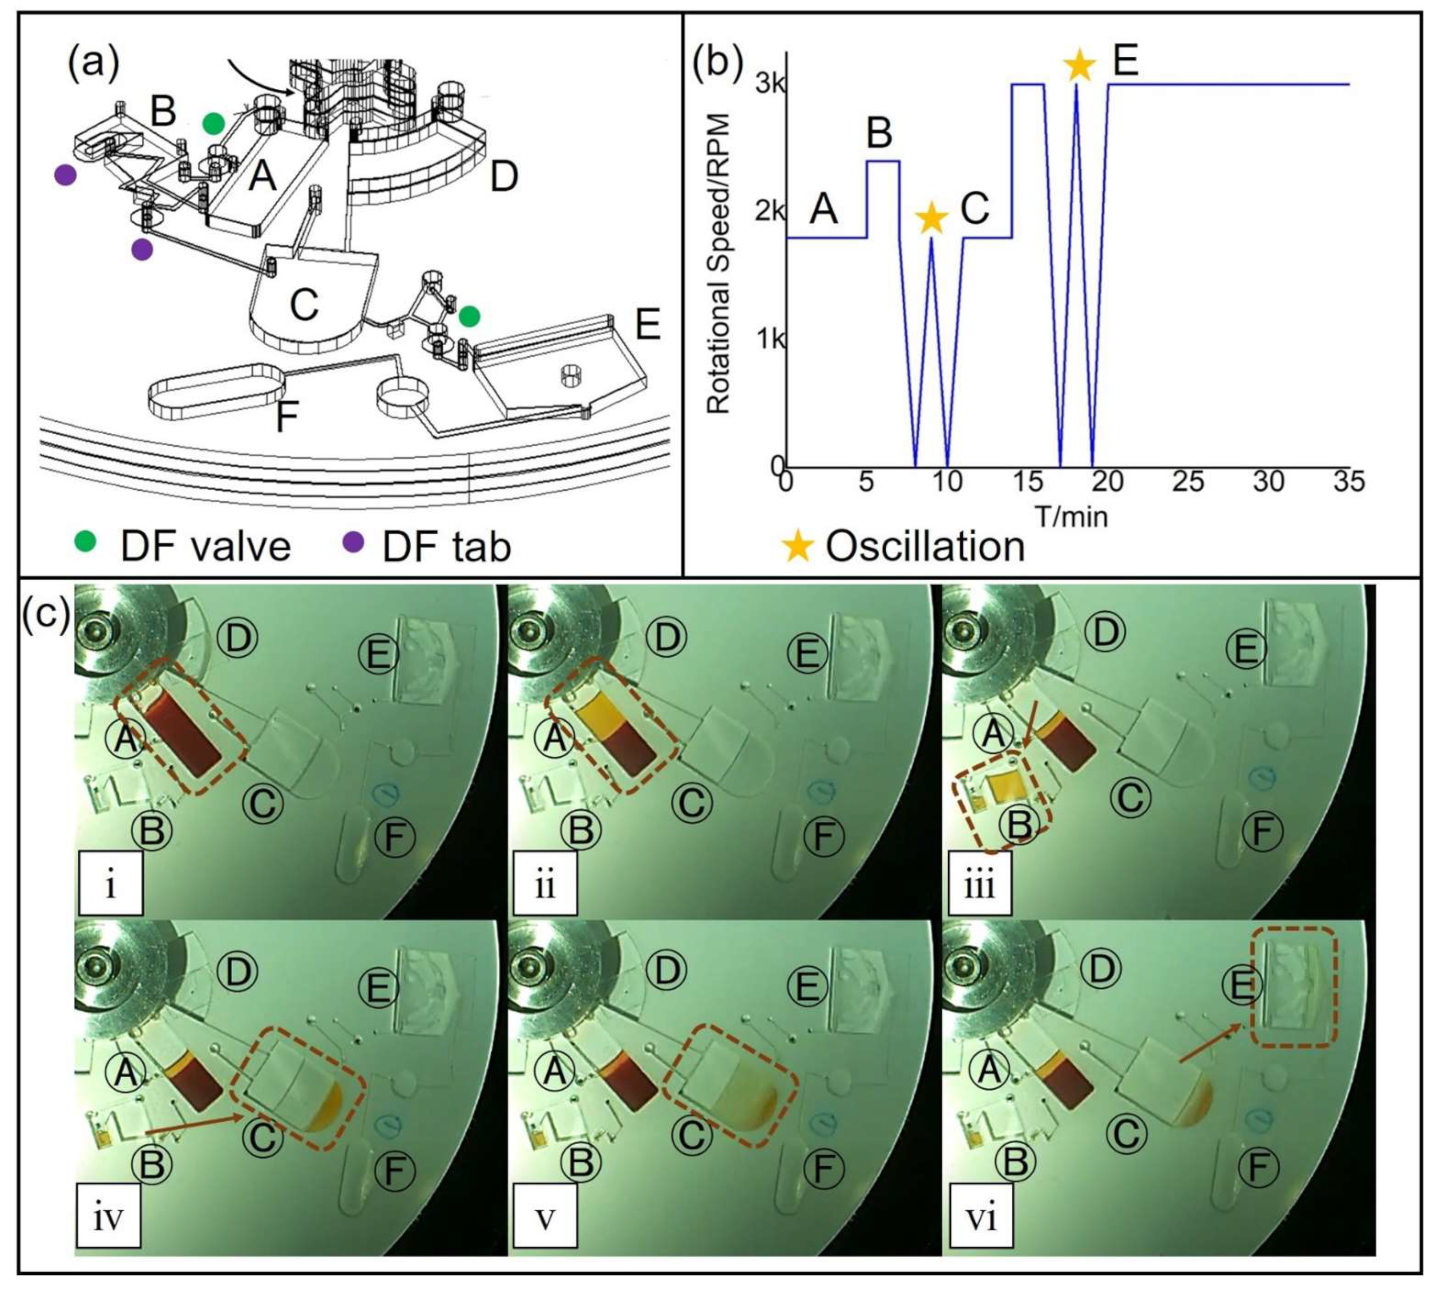
3.1. Workflow of On-Disc Blood Sample Preparation and Optimization
3.2. Sample Preparation Assay Optimization for Blood Sample Preparation
3.3. Centrifugal Disc Preparation Coupled with LC-MS
3.4. Fast Estimation of Target Molecules by MALDI-MS
4. Discussion
Supplementary Materials
Author Contributions
Funding
Data Availability Statement
Acknowledgments
Conflicts of Interest
References
- Weatherby, D.; Ferguson, S. Blood Chemistry and CBC Analysis: Clinical Laboratory Testing from a Functional Perspective; Weatherby & Associates, LLC.: Bloomfield, CT, USA, 2003. [Google Scholar]
- Zhang, A.; Sun, H.; Wang, X. Serum metabolomics as a novel diagnostic approach for disease: A systematic review. Anal. Bioanal. Chem. 2012, 404, 1239–1245. [Google Scholar] [CrossRef]
- Erpicum, P.; Hanssen, O.; Weekers, L.; Lovinfosse, P.; Meunier, P.; Tshibanda, L.; Krzesinski, J.-M.; Hustinx, R.; Jouret, F. Non-invasive approaches in the diagnosis of acute rejection in kidney transplant recipients, part II: Omics analyses of urine and blood samples. Clin. Kidney J. 2017, 10, 106–115. [Google Scholar] [CrossRef][Green Version]
- Guijas, C.; Montenegro-Burke, J.R.; Warth, B.; Spilker, M.E.; Siuzdak, G.J. Metabolomics activity screening for identifying metabolites that modulate phenotype. Nat. Biotechnol. 2018, 36, 316–320. [Google Scholar] [CrossRef]
- Rinschen, M.M.; Ivanisevic, J.; Giera, M.; Siuzdak, G.J. Identification of bioactive metabolites using activity metabolomics. Nat. Rev. Mol. Cell Biol. 2019, 20, 353–367. [Google Scholar] [CrossRef]
- Wishart, D.S.J. Metabolomics for investigating physiological and pathophysiological processes. Physiol. Rev. 2019, 99, 1819–1875. [Google Scholar] [CrossRef]
- Jia, L.; Yang, J.; Zhu, M.; Pang, Y.; Wang, Q.; Wei, Q.; Li, Y.; Li, T.; Li, F.; Wang, Q.J.; et al. A metabolite panel that differentiates Alzheimer’s disease from other dementia types. Alzheimer’s Dement. 2022, 18, 1345–1356. [Google Scholar] [CrossRef]
- Bassi, R.; Niewczas, M.A.; Biancone, L.; Bussolino, S.; Merugumala, S.; Tezza, S.; D’Addio, F.; Ben Nasr, M.; Valderrama-Vasquez, A.; Usuelli, V.J. Metabolomic profiling in individuals with a failing kidney allograft. PLoS ONE 2017, 12, e0169077. [Google Scholar] [CrossRef] [PubMed]
- Aota, A.; Takahashi, S.; Mawatari, K.; Tanaka, Y.; Sugii, Y.; Kitamori, T. Microchip-based plasma separation from whole blood via axial migration of blood cells. Anal. Sci. 2011, 27, 1173. [Google Scholar] [CrossRef] [PubMed][Green Version]
- Dixon, C.; Lamanna, J.; Wheeler, A.R. Direct loading of blood for plasma separation and diagnostic assays on a digital microfluidic device. Lab Chip 2020, 20, 1845–1855. [Google Scholar] [CrossRef] [PubMed]
- Kuo, J.-N.; Chen, X.-F. Plasma separation and preparation on centrifugal microfluidic disk for blood assays. Microsyst. Technol. 2015, 21, 2485–2494. [Google Scholar] [CrossRef]
- Smith, S.; Mager, D.; Perebikovsky, A.; Shamloo, E.; Kinahan, D.; Mishra, R.; Torres Delgado, S.M.; Kido, H.; Saha, S.; Ducrée, J. CD-based microfluidics for primary care in extreme point-of-care settings. Micromachines 2016, 7, 22. [Google Scholar] [CrossRef] [PubMed]
- Tang, M.; Wang, G.; Kong, S.-K.; Ho, H.-P. A review of biomedical centrifugal microfluidic platforms. Micromachines 2016, 7, 26. [Google Scholar] [CrossRef] [PubMed]
- Berger, M.; Müller, T.; Voebel, T.; Baum, C.; Glennon, T.; Mishra, R.; Kinahan, D.; King, D.; Ducrée, J.; Brecher, C. Automated assembly of microfluidic “lab-on-a-disc”. In Proceedings of the Microfluidics, BioMEMS, and Medical Microsystems XVI, San Francisco, CA, USA, 27–29 January 2018; pp. 36–41. [Google Scholar]
- Gorkin, R.; Park, J.; Siegrist, J.; Amasia, M.; Lee, B.S.; Park, J.-M.; Kim, J.; Kim, H.; Madou, M.; Cho, Y.-K. Centrifugal microfluidics for biomedical applications. Lab Chip 2010, 10, 1758–1773. [Google Scholar] [CrossRef] [PubMed]
- Strohmeier, O.; Marquart, N.; Mark, D.; Roth, G.; Zengerle, R.; von Stetten, F. Real-time PCR based detection of a panel of food-borne pathogens on a centrifugal microfluidic “LabDisk” with on-disk quality controls and standards for quantification. Anal. Methods 2014, 6, 2038–2046. [Google Scholar] [CrossRef]
- Mishra, R.; Alam, R.; McAuley, D.; Bharaj, T.; Chung, D.; Kinahan, D.J.; Nwankire, C.; Anderson, K.S.; Ducrée, J. Solvent selective membrane routing and microfluidic architecture towards centrifugal automation of customisable bead based immunoassays. Sens. Actuators B Chem. 2022, 356, 131305. [Google Scholar] [CrossRef]
- Burger, R.; Kirby, D.; Glynn, M.; Nwankire, C.; O’Sullivan, M.; Siegrist, J.; Kinahan, D.; Aguirre, G.; Kijanka, G.; Gorkin, R.A., III. Centrifugal microfluidics for cell analysis. Curr. Opin. Chem. Biol. 2012, 16, 409–414. [Google Scholar] [CrossRef]
- Zhao, Y.; Hou, Y.; Ji, J.; Khan, F.; Thundat, T.; Harrison, D.J. Sample Preparation in Centrifugal Microfluidic Discs for Human Serum Metabolite Analysis by Surface Assisted Laser Desorption/Ionization Mass Spectrometry. Anal. Chem. 2019, 91, 7570–7577. [Google Scholar] [CrossRef]
- González-Gross, M.; Breidenassel, C.; Gómez-Martínez, S.; Ferrari, M.; Beghin, L.; Spinneker, A.; Diaz, L.; Maiani, G.; Demailly, A.; Al-Tahan, J. Sampling and processing of fresh blood samples within a European multicenter nutritional study: Evaluation of biomarker stability during transport and storage. Int. J. Obes. 2008, 32, S66–S75. [Google Scholar] [CrossRef]
- Alinovi, C.A.; Ward, M.P.; Lin, T.L.; Wu, C.C. Sample handling substantially affects Johne’s ELISA. Prev. Vet. Med. 2009, 90, 278–283. [Google Scholar] [CrossRef]
- Drouin, N.; Kloots, T.; Schappler, J.; Rudaz, S.; Kohler, I.; Harms, A.; Wilhelmus Lindenburg, P.; Hankemeier, T. Electromembrane extraction of highly polar compounds: Analysis of cardiovascular biomarkers in plasma. Metabolites 2019, 10, 4. [Google Scholar] [CrossRef]
- Psychogios, N.; Hau, D.D.; Peng, J.; Guo, A.C.; Mandal, R.; Bouatra, S.; Sinelnikov, I.; Krishnamurthy, R.; Eisner, R.; Gautam, B.; et al. The human serum metabolome. PLoS ONE 2011, 6, e16957. [Google Scholar] [CrossRef]
- Emwas, A.-H.M. The strengths and weaknesses of NMR spectroscopy and mass spectrometry with particular focus on metabolomics research. In Metabonomics; Springer: Berlin/Heidelberg, Germany, 2015; pp. 161–193. [Google Scholar]
- Emwas, A.H.; Roy, R.; McKay, R.T.; Tenori, L.; Saccenti, E.; Gowda, G.N.; Raftery, D.; Alahmari, F.; Jaremko, L.; Jaremko, M.; et al. NMR spectroscopy for metabolomics research. Metabolites 2019, 9, 123. [Google Scholar] [CrossRef] [PubMed]
- Evans, A.M.; DeHaven, C.D.; Barrett, T.; Mitchell, M.; Milgram, E. Integrated, nontargeted ultrahigh performance liquid chromatography/electrospray ionization tandem mass spectrometry platform for the identification and relative quantification of the small-molecule complement of biological systems. Anal. Chem. 2009, 81, 6656–6667. [Google Scholar] [CrossRef] [PubMed]
- Armitage, E.G.; Barbas, C. Metabolomics in cancer biomarker discovery: Current trends and future perspectives. J. Pharm. Biomed. Anal. 2014, 87, 1–11. [Google Scholar] [CrossRef] [PubMed]
- Blennow, K.; Hampel, H.; Weiner, M.; Zetterberg, H. Cerebrospinal fluid and plasma biomarkers in Alzheimer disease. Nat. Rev. Neurol. 2010, 6, 131–144. [Google Scholar] [CrossRef] [PubMed]
- Song, Y.; Xu, C.; Kuroki, H.; Liao, Y.; Tsunoda, M. Recent trends in analytical methods for the determination of amino acids in biological samples. J. Pharm. Biomed. Anal. 2018, 147, 35–49. [Google Scholar] [CrossRef]
- Li, J.; Che, N.; Xu, L.; Zhang, Q.; Wang, Q.; Tan, W.; Zhang, M. LC-MS-based serum metabolomics reveals a distinctive signature in patients with rheumatoid arthritis. Clin. Rheumatol. 2018, 37, 1493–1502. [Google Scholar] [CrossRef]
- Yonezawa, T.; Asano, T.; Nguyen, M.T. Desorption and Ionization of Amino Acid Compounds Observed by Negative Ion Mode Surface-Assisted Laser Desorption/Ionization Mass Spectrometry (SALDI-MS) using Titanium Oxide Nanoparticles. Nano Biomed. 2020, 12, 101–109. [Google Scholar]
- Zhou, Y.; Peng, C.; Harris, K.D.; Mandal, R.; Harrison, D.J. Salt segregation and sample cleanup on perfluoro-coated nanostructured surfaces for laser desorption ionization mass spectrometry of biofluid samples. Anal. Chem. 2017, 89, 3362–3369. [Google Scholar] [CrossRef]
- Scott, S.M.; Ali, Z. Fabrication methods for microfluidic devices: An overview. Micromachines 2021, 12, 319. [Google Scholar] [CrossRef]
- Gorkin, R., III; Nwankire, C.E.; Gaughran, J.; Zhang, X.; Donohoe, G.G.; Rook, M.; O’Kennedy, R.; Ducrée, J. Centrifugo-pneumatic valving utilizing dissolvable films. Lab Chip 2012, 12, 2894–2902. [Google Scholar] [CrossRef] [PubMed]
- Kennedy, A.; Bivens, A. Methods for the Analysis of Underivatized Amino Acids by LC/MS; Application Note; Agilent Technologies, Inc.: Santa Clara, CA, USA, 2017; pp. 1–4. [Google Scholar]
- Medina, J.; van der Velpen, V.; Teav, T.; Guitton, Y.; Gallart-Ayala, H.; Ivanisevic, J. Single-Step Extraction Coupled with Targeted HILIC-MS/MS Approach for Comprehensive Analysis of Human Plasma Lipidome and Polar Metabolome. Metabolites 2020, 10, 495. [Google Scholar] [CrossRef] [PubMed]
- Grumann, M.; Brenner, T.; Beer, C.; Zengerle, R.; Ducrée, J. Visualization of flow patterning in high-speed centrifugal microfluidics. Rev. Sci. Instrum. 2005, 76, 025101. [Google Scholar] [CrossRef]
- Delgado, S.M.T.; Kinahan, D.J.; Julius, L.A.N.; Mallette, A.; Ardila, D.S.; Mishra, R.; Miyazaki, C.M.; Korvink, J.G.; Ducrée, J.; Mager, D. Wirelessly powered and remotely controlled valve-array for highly multiplexed analytical assay automation on a centrifugal microfluidic platform. Biosens. Bioelectron. 2018, 109, 214–223. [Google Scholar] [CrossRef]
- Gowda, G.N.; Raftery, D. Quantitating metabolites in protein precipitated serum using NMR spectroscopy. Anal. Chem. 2014, 86, 5433–5440. [Google Scholar] [CrossRef]
- Wei, T.C.; Van de Bittner, G.C.; Kennedy, A.P.; Hsiao, J. The Use of HILIC Zwitterionic Phase Superficially Porous Particles for Metabolomics Analysis. LCGC Suppl. 2018, 36, 30–35. [Google Scholar]
- Koike, S.; Bundo, M.; Iwamoto, K.; Suga, M.; Kuwabara, H.; Ohashi, Y.; Shinoda, K.; Takano, Y.; Iwashiro, N.; Satomura, Y. A snapshot of plasma metabolites in first-episode schizophrenia: A capillary electrophoresis time-of-flight mass spectrometry study. Transl. Psychiatry 2014, 4, e379. [Google Scholar] [CrossRef] [PubMed]


| Chamber | Function | Release Rotational Speed/rpm |
|---|---|---|
| A | Blood cell separation | 2400 |
| B | Serum metering | Once the DF tab is dampened |
| C | Protein precipitation by MeOH | 3000 |
| D | Preload MeOH | NA |
| E | C18/Silica particle clean up and the sample drying | NA |
| F | Facilitate pneumatic mixing | NA |
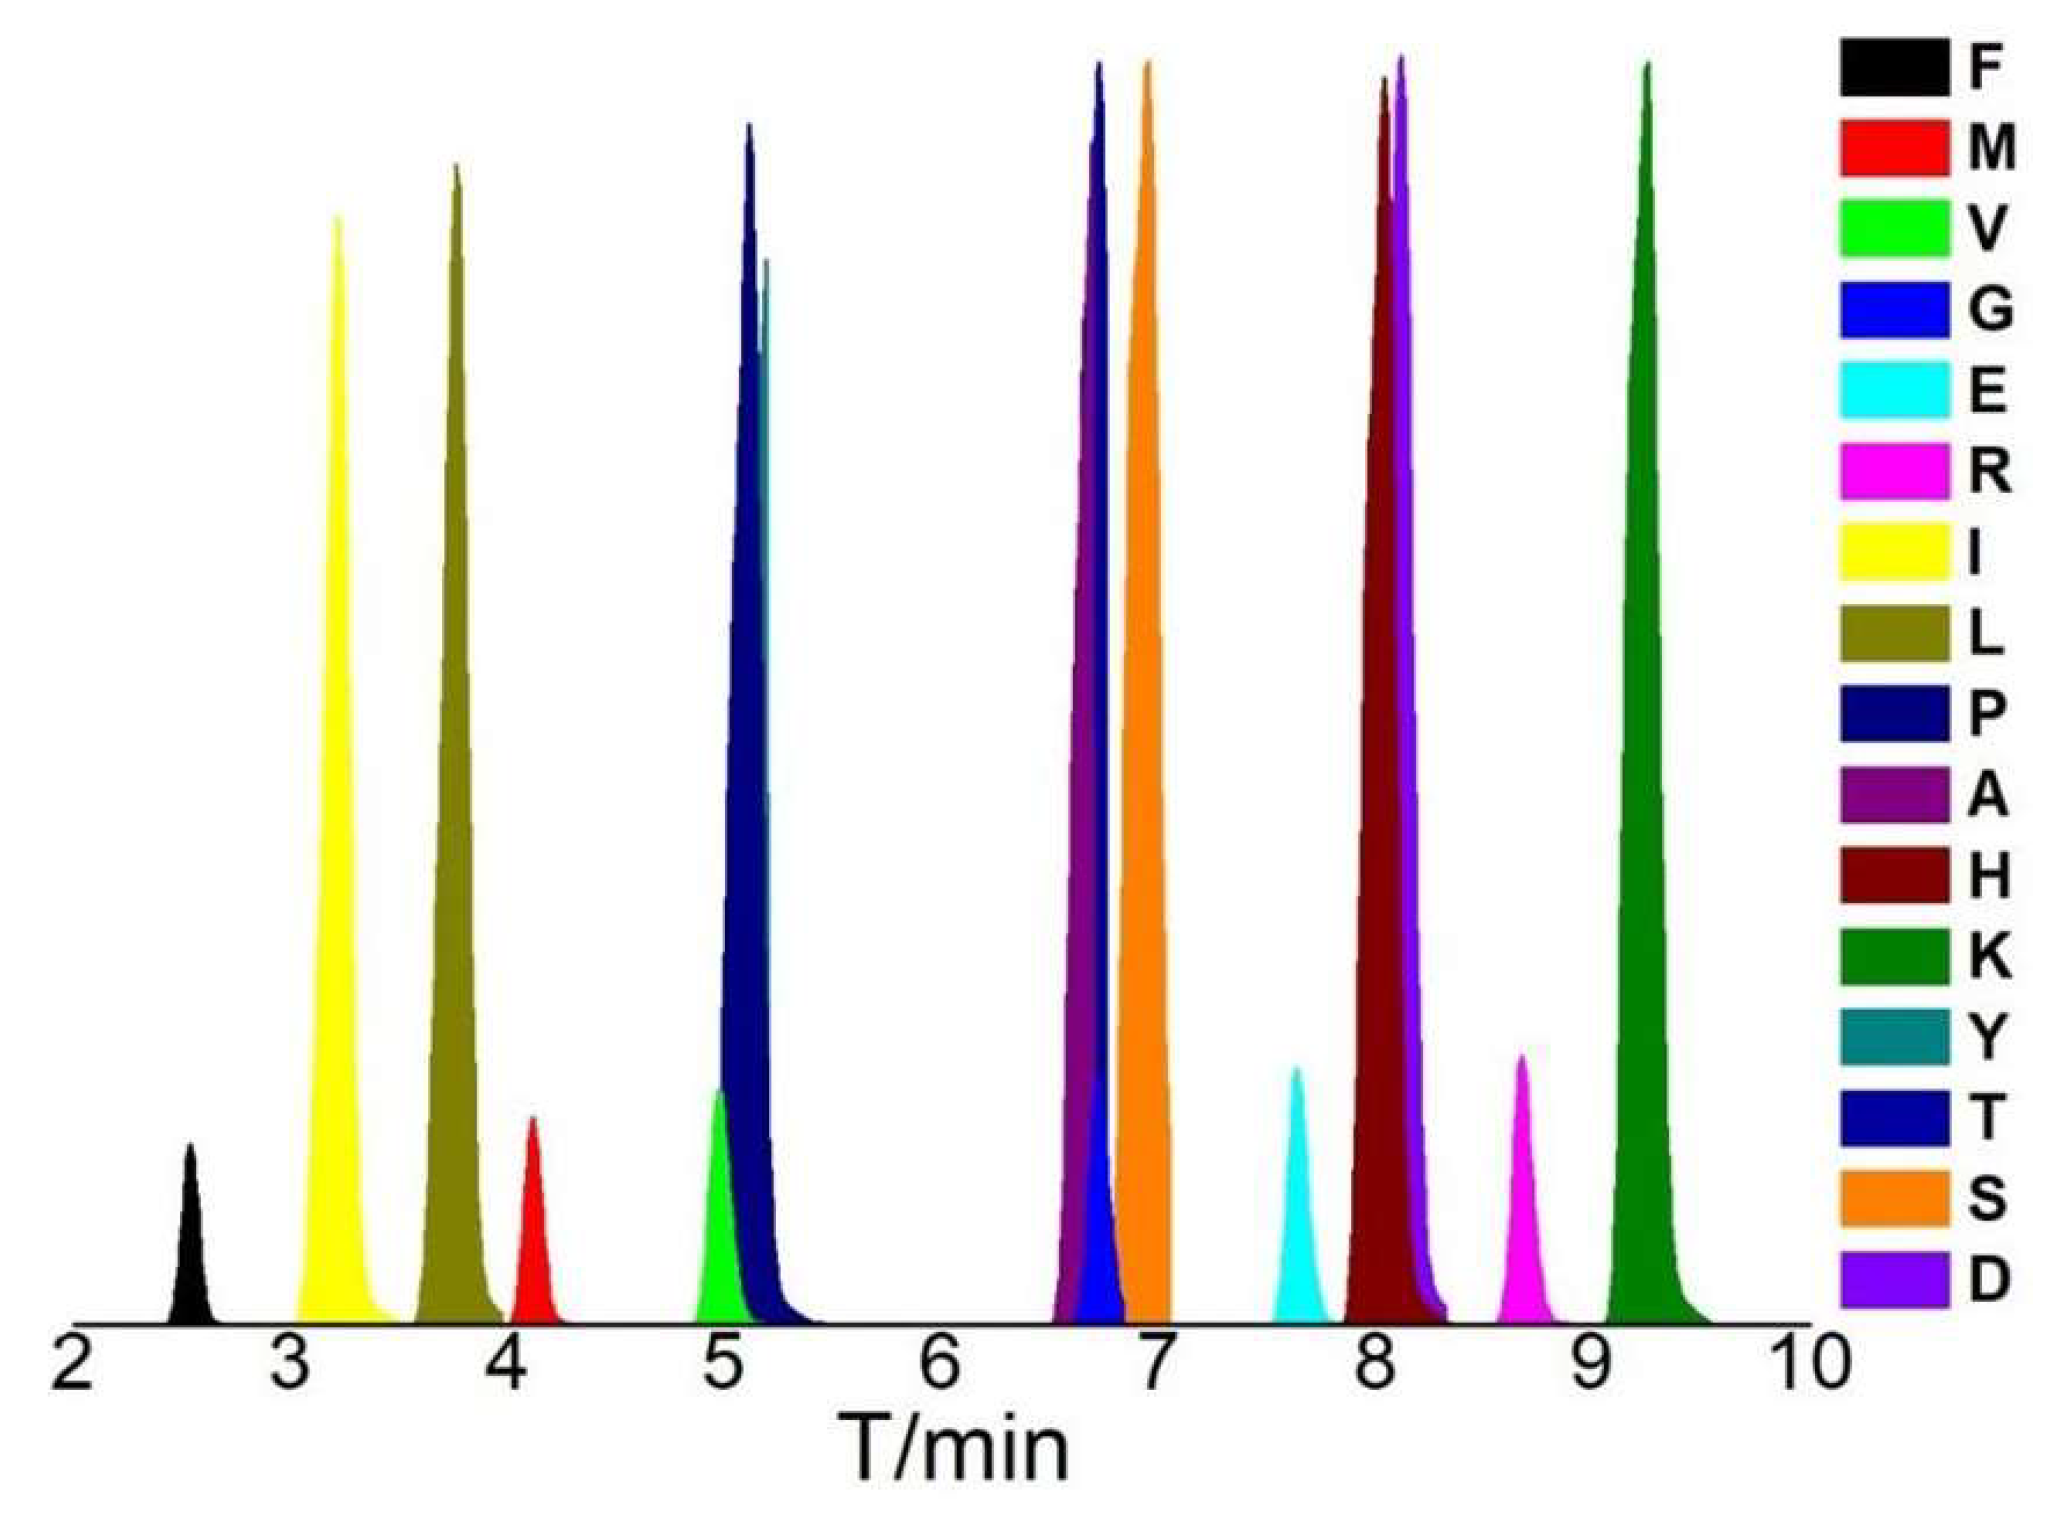
| AAs | tR/min | m/z | AAs | tR/min | m/z |
|---|---|---|---|---|---|
| F | 2.62 | 166.1 | T | 6.61 | 120.0 |
| L | 3.70 | 132.1 | G | 6.68 | 76.0 |
| I | 3.21 | 132.1 | S | 6.87 | 106.1 |
| M | 4.28 | 150.0 | E | 7.62 | 148.1 |
| Y | 5.14 | 182.1 | D | 8.08 | 134.0 |
| V | 5.08 | 118.1 | H | 7.99 | 156.1 |
| P | 5.10 | 116.1 | R | 8.70 | 175.1 |
| A | 6.54 | 90.1 | K | 9.15 | 147.1 |
Disclaimer/Publisher’s Note: The statements, opinions and data contained in all publications are solely those of the individual author(s) and contributor(s) and not of MDPI and/or the editor(s). MDPI and/or the editor(s) disclaim responsibility for any injury to people or property resulting from any ideas, methods, instructions or products referred to in the content. |
© 2023 by the authors. Licensee MDPI, Basel, Switzerland. This article is an open access article distributed under the terms and conditions of the Creative Commons Attribution (CC BY) license (https://creativecommons.org/licenses/by/4.0/).
Share and Cite
Hou, Y.; Mishra, R.; Zhao, Y.; Ducrée, J.; Harrison, J.D. An Automated Centrifugal Microfluidic Platform for Efficient Multistep Blood Sample Preparation and Clean-Up towards Small Ion-Molecule Analysis. Micromachines 2023, 14, 2257. https://doi.org/10.3390/mi14122257
Hou Y, Mishra R, Zhao Y, Ducrée J, Harrison JD. An Automated Centrifugal Microfluidic Platform for Efficient Multistep Blood Sample Preparation and Clean-Up towards Small Ion-Molecule Analysis. Micromachines. 2023; 14(12):2257. https://doi.org/10.3390/mi14122257
Chicago/Turabian StyleHou, Yuting, Rohit Mishra, Yufeng Zhao, Jens Ducrée, and Jed D. Harrison. 2023. "An Automated Centrifugal Microfluidic Platform for Efficient Multistep Blood Sample Preparation and Clean-Up towards Small Ion-Molecule Analysis" Micromachines 14, no. 12: 2257. https://doi.org/10.3390/mi14122257
APA StyleHou, Y., Mishra, R., Zhao, Y., Ducrée, J., & Harrison, J. D. (2023). An Automated Centrifugal Microfluidic Platform for Efficient Multistep Blood Sample Preparation and Clean-Up towards Small Ion-Molecule Analysis. Micromachines, 14(12), 2257. https://doi.org/10.3390/mi14122257