Abstract
Background: Inherited primary open-angle glaucoma (POAG) in Beagle dogs is a well-established large animal model of glaucoma and is caused by a G661R missense mutation in the ADAMTS10 gene. Using this model, the study describes early clinical disease markers for canine glaucoma. Methods: Spectral-domain optical coherence tomography (SD-OCT) was used to assess nine adult, ADAMTS10-mutant (median age 45.6 months, range 28.8–52.8 months; mean diurnal intraocular pressure (IOP): 29.9 +/− SEM 0.44 mmHg) and three related age-matched control Beagles (mean diurnal IOP: 18.0 +/− SEM 0.53 mmHg). Results: Of all the optic nerve head (ONH) parameters evaluated, the loss of myelin peak height in the horizontal plane was most significant (from 154 +/− SEM 38.4 μm to 9.3 +/− SEM 22.1 μm; p < 0.01). There was a strong significant negative correlation between myelin peak height and IOP (Spearman correlation: −0.78; p < 0.003). There were no significant differences in the thickness of any retinal layers evaluated. Conclusions: SD-OCT is a useful tool to detect early glaucomatous damage to the ONH in dogs before vision loss. Loss in myelin peak height without inner retinal thinning was identified as an early clinical disease marker. This suggests that initial degenerative changes are mostly due to the loss of myelin.
1. Introduction
Primary glaucoma is a leading cause of non-curable vision loss in dogs with an estimated prevalence of 0.89% [,]. The disease affects both eyes and is characterized by abnormal elevation of intraocular pressure (IOP), depression of the optic nerve head (ONH), and progressive death of retinal ganglion cells (RGCs) []. Primary closed-angle glaucoma (PCAG) is the most common form of the disease, where acute, severe increases in IOP are difficult to predict, and dogs are often diagnosed too late to rescue sight despite medical and surgical treatment options to lower IOP. It is suspected that intermittent IOP spikes occur before the diagnosis of the disease, leading to undetected early glaucomatous damage []. Therefore, early diagnosis of glaucoma is most important for effective therapy before more severe irreversible damage has occurred []. This includes a detailed quantitative assessment of the ONH, with the standard method being direct and indirect ophthalmoscopy. While advanced changes, such as ONH atrophy and cupping, are readily detectable, these methods are unreliable in detecting early and mild morphologic changes. Thus, more sensitive and powerful in vivo imaging techniques, including optical coherence tomography (OCT), have recently been developed for high-resolution imaging of the ocular fundus.
OCT utilizes low-coherence interferometry to indirectly measure optical reflections to produce in vivo ocular images [,]. Spectral-domain optical coherence tomography (SD-OCT) is an advanced OCT system that is clinically available. It measures the echo time delay of light with an interferometer broad bandwidth light source and simultaneously captures all backscattered light frequencies using a spectrometer. Compared to the reference arm of time-domain (TD) OCT, simultaneous acquisition of light frequencies by SD-OCT permits rapid scanning (24,000–55,000 A-scans/s), higher axial resolution (3–6 μm), and fewer artifacts [,,]. SD-OCT also permits further increases in sensitivity and deeper tissue penetration with the enhanced depth imaging (EDI) OCT function [,], which is particularly useful when analyzing posterior ocular structures.
OCT is the cutting-edge imaging technology for diagnosing, monitoring progression, and quantifying structural damage for glaucoma. In human patients, the retinal nerve fiber layer (RNFL) around the ONH is the most frequently used structural parameter. The addition of ONH parameters improves diagnostic accuracy for glaucoma detection [,]. Detailed studies about OCT for glaucoma diagnosis exist for dogs [,,,]. Interestingly, despite the high glaucoma prevalence in dogs, only one peer-reviewed publication utilized OCT to assess early glaucomatous retinal changes in several dog breeds with PCAG []. To date, there is no comprehensive OCT study about the early glaucomatous changes of the canine ONH. Because the canine ONH is unique, with myelinated RGC axons being present in the prelaminar ONH, parameters developed in other species, including human glaucoma patients, cannot be directly translated to the dog.
The purpose of this study was to provide a detailed SD-OCT examination of the canine glaucomatous ONH with a special focus on developing the parameters of early markers for glaucomatous damage. To achieve our goal, we performed our study on a well-established form of the disease, primary open-angle glaucoma (POAG) in the Beagle dog. This disease has been thoroughly characterized in >90 publications published since 1972 [,]. Beagle POAG is an autosomal recessive trait caused by a G661R missense mutation in the ADAMTS10 gene []. This condition is well suited for this study not only because the disease progresses more slowly and is more predictable than PCAG, with a gradual IOP increase, but also because the pathologic changes within the ONH have been very well defined at the structural and ultrastructural levels [,,].
2. Materials and Methods
2.1. Animals
ADAMTS10-mutant dogs (n = 9; 6 males and 3 females; median age 45.6 months, range 28.8–52.8 months; mean diurnal IOP: 29.9 +/− SEM 0.44 mmHg) and control, related dogs of comparable age (n = 3; 2 males and 1 female; median age: 35.4 months; range 31.2–67.2 months; mean IOP: 18.0 +/− SEM 0.53 mmHg) were part of a canine POAG colony of Beagle-derived mongrel dogs carrying the G661R missense mutation (Table 1). Genotypes were confirmed by PCR, gel electrophoresis, and Sanger sequencing []. The dogs were housed under a 12-hour light:dark cycle, and a simple maze test confirmed the presence of vision. The study was conducted in compliance with the Association for Research in Vision and Ophthalmology statement for Use of Animals in Ophthalmic and Vision Research and approved by the Michigan State University (MSU) Institutional Animal Care and Use Committee (IACUC ID: PROTO202200005).

Table 1.
Profiles of Study Subjects.
2.2. Ophthalmic Examination
Regular ophthalmic examinations were performed pre- and post-imaging with SD-OCT. Anterior segments were examined for clarity and cells with diffuse and focal illumination using portable hand-held slit-lamp biomicroscopes (Kowa SL14; Kowa Company, Tokyo, Japan). Fundic examinations were performed with portable binocular indirect ophthalmoscopes (Keeler All Pupil II; Keeler Instruments, Broomall, PA, USA) and condensing lenses (Pan Retinal 2.2D; Volk Optical, Mentor, OH, USA).
Normal iridocorneal angle morphology was confirmed by gonioscopy with a RetCam II (Clarity Medical Systems, Pleasanton, CA, USA) following ocular surface anesthesia (proparacaine HCl 0.5% ophthalmic solution; Alcon Laboratories, Inc., Fort Worth, TX, USA), and the use of a viscoelastic gel (OptixCare® Plus Eye Lube; Aventix, Burlington, ON, Canada) and a gonioscopy lens. Axial globe length was manually measured from ocular images produced by A- and B-scan ultrasonography (Humphrey A/B scan system model 837, Humphrey Instruments, San Leandro, California). Diurnal IOPs (8 AM, 11 AM, 3 PM) were collected once monthly for 5 months by one examiner (CH) with a rebound tonometer (Icare® TonoVet; Icare Finland Oy, Vantaa, Finland) [].
2.3. Spectral-Domain Optical Coherence Tomography (SD-OCT) Image Acquisition
The pupils were dilated with topical tropicamide 1% ophthalmic solution USP (Akorn, Lake Forest, IL, USA). The dogs were placed under general anesthesia for optical image quality: premedicated with intramuscular acepromazine maleate (Butler Schein Animal Health, Dublin, OH, USA; 0.2 mg/kg), induced with intravenous propofol (PropoFloTM28, Abbott Laboratories, North Chicago, IL, USA; 4 mg/kg), intubated, and maintained on isoflurane/O2 gas mixture. They were placed in sternal recumbency. The position of the globes was maintained via 4-0 silk conjunctival stay sutures (Perma-hand, Ethicon, Somerville, NJ) placed at the superior and inferior limbus. SD-OCT with a 30° lens was used to image the canine fundus (Spectralis®, Heidelberg Engineering, Heidelberg, Germany) (Figure 1). Four different types of scans were used per eye: retinal nerve fiber layer (RNFL) 12° circle, line, radial, and volume (Table 2). A confocal scanning laser ophthalmoscope (cSLO) image was also acquired with each scan. Several parameter options could be chosen for each scan; this was dependent on the quality of the image produced by the SD-OCT. However, EDI-OCT was specifically utilized in the line and radial scans to enhance sensitivity and penetration of deeper tissues []. Each scan was centered on the ONH, and a real-time eye-tracking system of the SD-OCT stabilized the retinal position. At the end of the SD-OCT sessions, the stay sutures were removed, and the animals were allowed to awaken under close supervision. Drug-induced mydriasis was reversed in ADAMTS10-mutants with topical 0.005% latanoprost ophthalmic solution (Greenstone LLC., Peapack, NJ, USA) [].
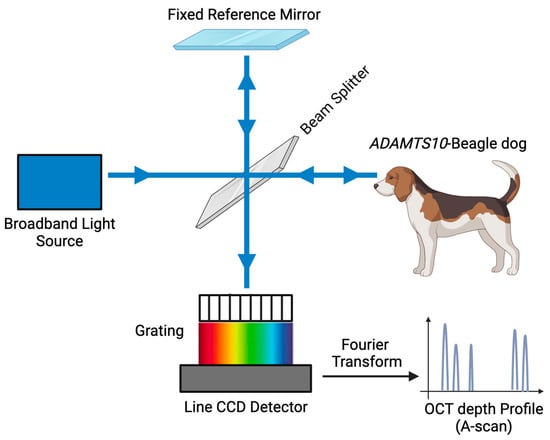
Figure 1.
Schematic diagram of spectral-domain optical coherence tomography (SD-OCT). Line charge-coupled device (CCD) detector. (Referenced from Zheng S et al. []).
Table 2.
SD-OCT Scan Parameters.
One masked investigator (AO) analyzed the cSLO image and SD-OCT scans through the HRA/Spectralis® Viewing Module (version 5.4.6.0) and ImageJ (NIH ImageJ; NIH, Bethesda, MD, USA). The units were in µm or pixels2.
2.3.1. Optic Nerve Head (ONH) Measurements
On the cSLO image of an RNFL scan, the ONH area was determined (Figure 2a; yellow shade). Because the canine ONH protrudes more noticeably into the vitreous compared to humans [], two distinct methods of measurement were used to measure canine ONH structures (Table 3).
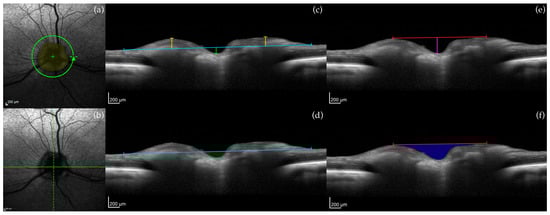
Figure 2.
Example of optic nerve head (ONH) measurements in a control dog. (a) cSLO image showing the location of the circular 12° OCT RNFL scan: ONH area (yellow shade); (b) cSLO image of a line scan: 0° (solid green line) and 90° (dashed green line) line scans; (c) Vitreoretinal reference plane (blue line): myelin peak height (yellow line) and ONH cup depth (green line). (d) Vitreoretinal reference plane (blue line): cross-sectional area of the ONH cup (green shade). (e) Neuroretinal rim reference plane (red line): myelin peak distance (length of red line) and ONH cup depth (purple line). (f) Neuroretinal rim reference plane (red line): cross-sectional area of the ONH cup (blue shade). Calibration bars = 200 μm.
Table 3.
ONH and Retinal Layer Measurements.
In the first approach, vitreoretinal and neuroretinal reference planes were used. On a line scan, 0° (horizontal) and 90° (vertical) line scans were selected (Figure 2b; 0° = solid green line, 90° = dashed green line), and the vitreoretinal reference plane was created by drawing a horizontal line along the vitreoretinal surface (Figure 2c; blue line) with the center of the line matched with the deepest point of the ONH cup. Following, ONH cup depth (Figure 2c; green line), myelin peak height (Figure 2c; yellow line), and cross-sectional area of the ONH cup (Figure 2d; green shade) were measured. Similarly, on 0° and 90° line scans, the neuroretinal reference plane was established by drawing a horizontal line between the two highest points of the ONH (Figure 2e; red line). From here, ONH cup depth (Figure 2e; purple line), myelin peak distance (Figure 2e; red line), and cross-sectional area of the ONH cup (Figure 2f; blue shade) were measured.
The second approach was adapted from Schuman et al. []; ONH parameters determined from the 150 µm reference plane on SD-OCT detected early glaucomatous changes in humans []. Four line scans were selected from the standard 12 radial scans imaged (Figure 3a; white arrows). The ends of the retinal pigment epithelium/choriocapillaris layer were identified and connected with a straight line (Figure 3b; blue line). Anteriorly by 150 µm, a second line was drawn to create the 150 µm reference plane (Figure 3b; white line). From this plane, optic cup diameter (Figure 3b; green line) and cross-sectional neuroretinal rim area (Figure 3b; red shade) were measured.
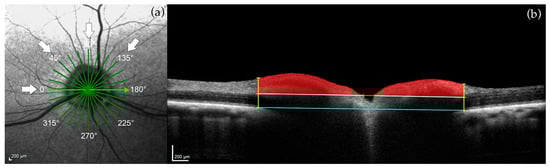
Figure 3.
Example of optic nerve head (ONH) measurements in a control dog. (a) cSLO image showing the location of the 12 standard radial scans: four of these line scans were selected for measurements (white arrows; 0°, 45°, 90°, 135°). (b) Connected ends of the retinal pigment epithelium/choriocapillaris layer (blue line). One-hundred fifty micrometer reference plane (white line). Optic cup diameter (green line). Perpendicular lines from the ends of the retinal pigment epithelium/choriocapillaris layer to the inner limiting membrane (yellow lines). Cross-sectional neuroretinal rim area (red shade). Calibration bars = 200 μm.
2.3.2. Retinal Layer Measurements
On an RNFL scan, peripapillary full retinal thickness (FRT), inner retinal thickness (IRT), and outer nuclear layer (ONL) were measured (Table 3). In detail, the RNFL scan was divided into four quadrants, and two distinct points per quadrant void of retinal blood vessels were used (Figure 4a). Areas containing retinal blood vessels were avoided, as vessels contribute to artificial thickening of the retinal layers []. FRT was automatically calculated, while IRT and ONL were manually determined by correcting the delineation of the individual layers (Figure 4b).
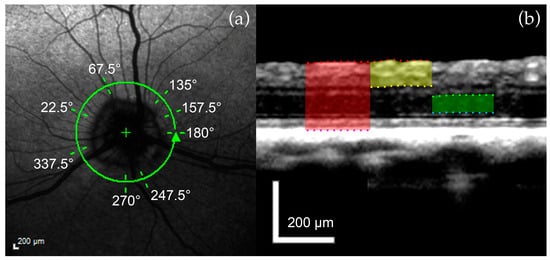
Figure 4.
Example of retinal layer measurements in a control dog. (a) cSLO image of the 12° circular RNFL OCT scan: two distinct points per quadrant void of retinal blood vessels were identified. (b) FRT (red shade) extends from the ILM (red dots) to the RPE (purple dots). IRT (yellow shade) extends from the ILM (red dots) to the posterior surface of the IPL (yellow dots). ONL (green shade) is measured from its anterior (green dots) to the posterior surface (blue dots). Calibration bars = 200 μm.
2.4. Statistical Analysis
A total of 61 measurements were obtained from cSLO and SD-OCT images of the ONH and retina from each eye. ANOVA was used to compare the dimensions of the ocular structures between POAG-affected and control dogs. Spearman correlation coefficient was applied to determine the association of the SD-OCT values with age, IOP, and axial globe length since these three parameters are positively associated with POAG progression []. For all tests, p ≤ 0.05 was significant.
2.5. Tissue Collection and Histology
Age-matched dogs (n = 4) were selected from the wider canine POAG colony to compare histology with SD-OCT images. The dogs were euthanized with an overdose of sodium pentobarbital for reasons unrelated to this study. Following enucleation, the globes were fixed in Karnovsky’s paraformaldehyde-glutaraldehyde solution for routine processing, paraffin embedding, and histologic evaluation of H&E stained sections.
3. Results
3.1. Optic Nerve Head
SD-OCT data sets were obtained from both eyes of 12 Beagle dogs. There was a significant difference in myelin peak height between the ADAMTS10 mutants (n = 9) and controls (n = 3). The loss of myelin in the mutant dogs was present in both 0° (horizontal) and 90° (vertical) line scans, but it was most significant in the 0° line scans (from 154 +/− 38.4 μm to 9.3 +/− 22.1 μm; p < 0.01; Table 4). Moreover, there was a strong, significant negative correlation between myelin peak height and IOP (Figure 5) that was also pronounced in the 0° line scans (Spearman correlation coefficient: −0.78; p < 0.003; Table 4).
Table 4.
Statistically Significant Results of ONH Parameters.
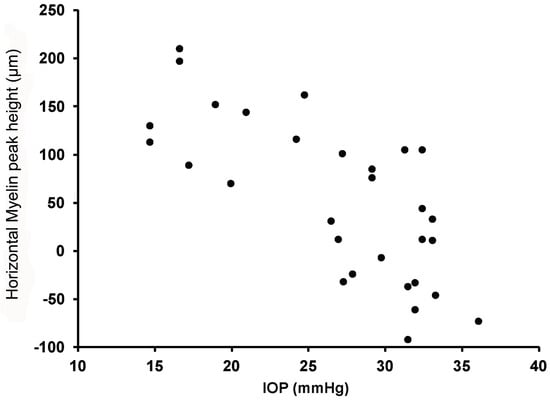
Figure 5.
Scatterplot showing a significant negative correlation between intraocular pressure (IOP) and myelin peak height.
There was no significant correlation between myelin peak height and age in both 0° (Spearman correlation coefficient: −0.04; p = 0.90) and 90° (Spearman correlation coefficient: −0.14; p = 0.66) line scans. There was no significant correlation between myelin peak height and axial globe length in both 0° (Spearman correlation coefficient: −0.53; p = 0.08) and 90° (Spearman correlation coefficient: −0.41; p = 0.18) line scans. Furthermore, there was no significant difference in axial globe length between ADAMTS10-mutant (21.7 +/− SEM 0.25 μm) and control dogs (20.8 +/− SEM 0.23 μm).
On volume scans, three-dimensional views between ADAMTS10 mutants and controls reveal that ONH cupping was rather severe in a few animals (Figure 6c,e), but the cup dimensions measured in this study did not significantly differ between groups. When comparing three mutant and two control ONHs at various ages, there was variability in the disease stage and glaucomatous damage, particularly in young ADAMTS10 mutants (Figure 6b,c).
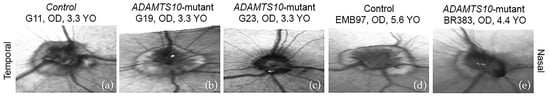
Figure 6.
Volume scans of three-dimensional SD-OCT images of the ONH. Two normal (a,d) and three affected ONHs (b,c,e) at various ages and stages of disease are shown. Right eye (OD); years old (YO).
SD-OCT cross-sectional images of a 3.3-year-old mutant dog also appear rather unremarkable, with mild flattening of myelin (Figure 7f), while histologic cross sections show thinning of the pre-laminar ONH (Figure 7b). At an older age (4.4-year-old), SD-OCT images demonstrate cupping of the ONH (Figure 7h; white arrow), and myelin loss. Similar changes are observed on histologic evaluation (Figure 7d; black arrow) with the addition of posterior dislocation of the lamina cribrosa (dashed line). In vivo SD-OCT images of control dogs at various ages also illustrate the characteristic “volcano-like” bulge of the ONH into the vitreous; this is not apparent on histologic cross sections of either mutants or controls.
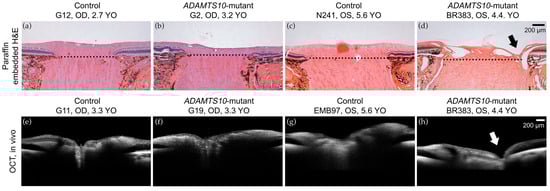
Figure 7.
Histologic and SD-OCT comparison of the ONH. Normal (a,c,e,g) and age-matched mutant Beagle dogs (b,d,f,h). The 3.2-year-old and 3.3-year-old mutant dogs exhibit mild flattening of myelin on histology (b) and SD-OCT (f), respectively, in contrast to the 4.5-year-old mutant dog, which has marked myelin loss and cupping (arrows) of the ONH on both histology (d) and SD-OCT (h). Calibration bars = 200 μm. Right eye (OD); Left eye (OS); years old (YO).
3.2. Retinal Layers
There were no significant differences in the thickness of the peripapillary retinal layers evaluated between the ADAMTS10 mutant and control groups (Table 5), as mean FRTs (+/− SEM) were 239 μm (+/− 6.0 μm) and 243 μm (+/− 3.2 μm), respectively.
Table 5.
Statistical Results of Retinal Parameters.
Histologic cross sections of the superior retina depict thinning of the inner retina in the affected tissues compared to the age-matched controls in both early and later periods of the disease (Figure 8). This was not apparent in the SD-OCT images at the disease stages evaluated.
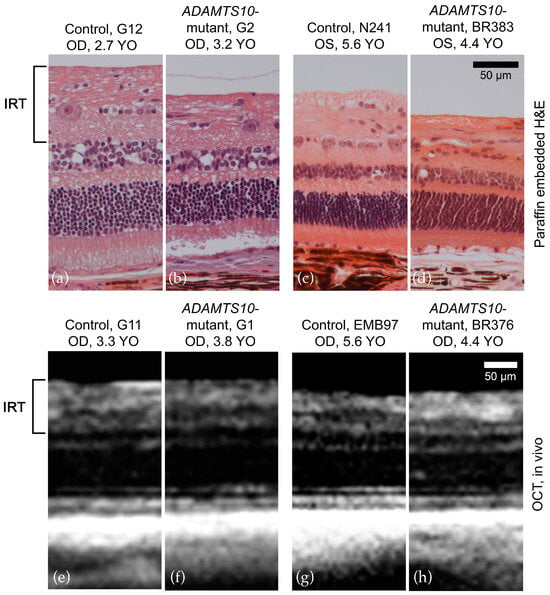
Figure 8.
Histologic (superior retina) and SD-OCT (peripapillary) comparison of the retina. Normal (a,c,e,g) and age-matched mutant Beagle dogs (b,d,f,h). On histologic sections, there was thinning of the inner retina in the affected tissues (b,d) compared to age-matched controls (a,c) in both the early and later stages of the disease. This was not observed on SD-OCT when comparing the affected tissues (f,h) with age-matched controls (e,f) at the ages assessed. Calibration bars = 50 μm. Right eye (OD); Left eye (OS); years old (YO).
4. Discussion
The purpose of this study was to describe early glaucomatous optic neuropathy in POAG-affected dogs with an in vivo imaging modality. This is a well-established and clinically relevant animal model of human POAG []. Our data support that SD-OCT can detect early ONH changes in ADAMTS10-mutant Beagles, the key result being significant myelin loss in the horizontal plane because of elevated IOP. Severe ONH cupping was observed in a few older animals, but neither the average dimensions of the optic cup nor the thickness of the retina (FRT, IRT, and ONL) varied significantly between the mutant and control groups.
Significant loss of myelin is a sensitive quantitative measurement of ONH degeneration. The ONH is an intrapapillary equivalent to the RNFL [] and composed of RGC axons []. The viscoelastic myelin of the RGC axons forms the raised and irregularly shaped ONH in the dog [], and primary demyelination results in progressive loss of ONH architecture [,,]. In our study, we identified this region as myelin peak height, but it can also be known as neuroretinal rim height. The horizontal loss of neuroretinal rim height observed in our colony (Table 4) was previously described in POAG-affected Beagles []. A consistent pattern of rim loss in glaucomatous dogs, however, has not been observed.
The loss of myelin peak height (from 154 ± 38.4 μm to 9.3 ± 22.1 μm; p < 0.01) is a consequence of elevated IOP (Figure 5; Spearman correlation: −0.78; p < 0.003). The canine ONH is prominent after birth [], and its morphology is comparable between 5.6-month-old control and age-matched pre-glaucomatous dogs. As IOP progressively increases from the normal range of 10–20 mmHg [,] in 8- to 16-month-old POAG-affected Beagles, ultrastructural modifications of the optic nerve axons [,], and slight compression and distortion of the lamina cribrosa [] lead to early architectural ONH lesions. These insults cannot be identified clinically with direct or indirect ophthalmoscopic examination [,]. However, with SD-OCT, significant myelin peak loss was observed both quantitatively (Table 4) and qualitatively (Figure 6).
ONH cupping was rather severe in a few older animals, but the average cup dimensions did not significantly differ between the control and mutant Beagles. The raised canine ONH may have contributed to the lack of difference in optic cup measurements between the two groups. In several radial scans of normal and mildly affected ADAMTS10-mutant Beagles, the optic cup was located above the 150 μm reference plane, and the optic cup diameter could not be identified. ONH cupping was only present in severely affected ADAMTS10-mutant dogs, and thus a further study comparing control and moderately to severely affected ADAMTS10-mutant Beagles is required. In particular, individuals should be selected according to their average IOP, rather than to factors such as age or axial globe length. Our data revealed that neither age nor axial globe length significantly contributed to changes in ONH architecture in ADAMTS10-mutant Beagles.
SD-OCT revealed no significant difference in peripapillary thickness of FRT and IRT between the control and ADAMTS10-mutant dogs. ONL thickness was also consistent between normal and glaucomatous eyes, as neither cone loss nor increased photoreceptor thickness was seen in the parafoveal region, as seen in previous studies [,]. Peripapillary FRT and IRT thinning occurs as a consequence of ocular hypertension reducing axoplasmic flow of neurotrophins and perfusion to optic nerve axons, ultimately leading to RGC death [,,]. Thinning of the RNFL with SD-OCT was identified as an early glaucomatous change in several dog breeds with PCAG [] and corresponds to areas of structure and visual field loss in human patients [,]. The discrepancy in early clinical disease markers between POAG in Beagles and PCAG in other dog breeds may be linked to how IOP increases in each disease: slow and progressive in POAG, and acute and severe in PCAG. But also, Beagles with ADAMTS10 mutation have a mechanically weak posterior sclera associated with reduced collagen density and a lower proportion of insoluble collagen [], thus potentially resulting in changes to the ONH before the retina.
One limitation of this study is the small sample size, rendering our results preliminary. Even though the ADAMTS10-mutant Beagles were visual and had comparable IOP measurements, there was variability in the disease stage and glaucomatous damage in the ADAMTS10-mutant Beagles. A larger sample size would have decreased the influence of variability on the results. This will be achieved by collecting more data in the future. Additionally, the optic cup diameter was not measured in several normal and mildly affected ADAMTS10-mutant Beagles because the optic cup was located above the 150 μm reference plane. Furthermore, the repeatability of the scanning technique and the reliability of observer measurements were not explored. Granted reliability of observer measurements, specifically intra-rater reliability, could not have been assessed, as POAG progresses over time.
5. Conclusions
SD-OCT successfully detects the ultrastructural change in ADAMTS10-mutant Beagles. Myelin peak height is the most sensitive quantitative measurement of early glaucomatous optic neuropathy and should be observed in future longitudinal SD-OCT studies. Average optic cup measurements did not significantly change, but SD-OCT scans of a cohort of moderately to severely affected dogs may prove otherwise. Peripapillary retinal thickness is not a core parameter for the assessment of POAG-affected dogs.
Author Contributions
Conceptualization, A.M.K.; methodology, A.O.; software, A.O. and L.M.O.; validation, A.O.; formal analysis, J.H., G.-S.Y., L.B.C.T. and E.S.S.; investigation, A.O., L.M.O., C.D.H., K.L.K. and A.M.K.; resources, A.M.K.; data curation, A.O.; writing—original draft preparation, A.O. and A.M.K.; writing—review and editing, A.M.K.; visualization, A.O.; supervision, A.M.K.; project administration, A.O., C.D.H., K.L.K. and A.M.K.; funding acquisition, A.M.K. All authors have read and agreed to the published version of the manuscript.
Funding
Funding was provided by the NIH grants P30EY001583 (G.-S.Y.), R01-EY025752 (A.M.K.), and R01-EY032478 (A.M.K.). The University of Pennsylvania Research Foundation (A.M.K.), and Michigan State University Start-up Funds (A.M.K.).
Institutional Review Board Statement
The animal study protocol was approved by Michigan State University (MSU) Institutional Animal Care and Use Committee (IACUC), PROTO202200005, on 22 February 2022.
Data Availability Statement
The raw data supporting the conclusions of this article will be made available by the authors on request.
Acknowledgments
The authors thank the staff of Michigan State University Campus Animal Resources for their technical assistance.
Conflicts of Interest
The authors have no competing interests or other interests that might be perceived to influence the results and/or discussion reported in this paper.
References
- Gelatt, K.N.; MacKay, E.O. Prevalence of the breed-related glaucomas in pure-bred dogs in North America. Vet. Ophthalmol. 2004, 7, 97–111. [Google Scholar] [CrossRef] [PubMed]
- Komáromy, A.M.; Petersen-Jones, S.M. Genetics of Canine Primary Glaucomas. Vet. Clin. N. Am. Small Anim. Pract. 2015, 45, 1159–1182. [Google Scholar] [CrossRef] [PubMed]
- Plummer, C.E.; Komáromy, A.M.; Gelatt, K.N. The Canine Glaucomas. In Veterinary Ophthalmology, 6th ed.; Gelatt, K.N., Ben-Shlomo, G., Gilger, B.C., Hendrix, D.V.H., Kern, T.J., Plummer, C.E., Eds.; Wiley-Blackwell: Hoboken, NJ, USA, 2021; pp. 1173–1256. [Google Scholar]
- Graham, K.L.; McCowan, C.I.; Caruso, K.; Billson, F.M.; Whittaker, C.J.G.; White, A. Optical coherence tomography of the retina, nerve fiber layer, and optic nerve head in dogs with glaucoma. Vet. Ophthalmol. 2020, 23, 97–112. [Google Scholar] [CrossRef] [PubMed]
- Komáromy, A.M.; Bras, D.; Esson, D.W.; Fellman, R.L.; Grozdanic, S.D.; Kagemann, L.; Miller, P.E.; Moroi, S.E.; Plummer, C.E.; Sapienza, J.S.; et al. The future of canine glaucoma therapy. Vet. Ophthalmol. 2019, 22, 726–740. [Google Scholar] [CrossRef] [PubMed]
- Huang, D.; Swanson, E.A.; Lin, C.P.; Schuman, J.S.; Stinson, W.G.; Chang, W.; Hee, M.R.; Flotte, T.; Gregory, K.; Puliafito, C.A.; et al. Optical Coherence Tomography. Science 1991, 254, 1178–1181. [Google Scholar] [CrossRef] [PubMed]
- Hee, M.R.; Izatt, J.A.; Swanson, E.A.; Huang, D.; Schuman, J.S.; Lin, C.P.; Puliafito, C.A.; Fujimoto, J.G. Optical Coherence Tomography of the Human Retina. Arch. Ophthalmol. 1995, 113, 325–332. [Google Scholar] [CrossRef] [PubMed]
- A Townsend, K.; Wollstein, G.; Schuman, J.S. Imaging of the retinal nerve fibre layer for glaucoma. Br. J. Ophthalmol. 2009, 93, 139–143. [Google Scholar] [CrossRef] [PubMed]
- Drexler, W.; Fujimoto, J.G. State-of-the-art retinal optical coherence tomography. Prog. Retin. Eye Res. 2008, 27, 45–88. [Google Scholar] [CrossRef] [PubMed]
- Wojtkowski, M.; Bajraszewski, T.; Targowski, P.; Kowalczyk, A. Real-time in vivo imaging by high-speed spectral optical coherence tomography. Opt. Lett. 2003, 28, 1745–1747. [Google Scholar] [CrossRef] [PubMed]
- Mrejen, S.; Spaide, R.F. Optical coherence tomography: Imaging of the choroid and beyond. Surv. Ophthalmol. 2013, 58, 387–429. [Google Scholar] [CrossRef] [PubMed]
- Spaide, R.F.; Koizumi, H.; Pozonni, M.C. Enhanced Depth Imaging Spectral-Domain Optical Coherence Tomography. Am. J. Ophthalmol. 2008, 146, 496–500. [Google Scholar] [CrossRef] [PubMed]
- Elgin, C.Y.; Chen, D.; Al-Aswad, L.A. Ophthalmic imaging for the diagnosis and monitoring of glaucoma: A review. Clin. Exp. Ophthalmol. 2022, 50, 183–197. [Google Scholar] [CrossRef] [PubMed]
- Medeiros, F.A.; Zangwill, L.M.; Bowd, C.; Vessani, R.M.; Susanna, R.; Weinreb, R.N. Evaluation of retinal nerve fiber layer, optic nerve head, and macular thickness measurements for glaucoma detection using optical coherence tomography. Arch. Ophthalmol. 2005, 139, 44–55. [Google Scholar] [CrossRef] [PubMed]
- Telle, M.R.; Snyder, K.C.; Oikawa, K.; Nilles, J.P.; Gehrke, S.; Teixeira, L.B.C.; Kiland, J.A.; Huang, A.; McLellan, G.J. Development and validation of methods to visualize conventional aqueous outflow pathways in canine primary angle closure glaucoma. Vet. Ophthalmol. 2022, 25, 84–95. [Google Scholar] [CrossRef] [PubMed]
- Park, S.A.; Sledge, D.; Monahan, C.F.; Teixeira, L.; Boyd, R.; Freeman, K.; Koehl, K.; Harman, C.; Munoz, K.; Occelli, L.M.; et al. Atypical chorioretinal lesions in Siberian Husky dogs with primary angle-closure glaucoma: A case series. BMC Vet. Res. 2022, 18, 182. [Google Scholar] [CrossRef] [PubMed]
- Grozdanic, S.D.; Matic, M.; Betts, D.M.; Sakaguchi, D.S.; Kardon, R.H. Recovery of canine retina and optic nerve function after acute elevation of intraocular pressure: Implications for canine glaucoma treatment. Vet. Ophthalmol. 2007, 10, 101–107. [Google Scholar] [CrossRef] [PubMed]
- Gelatt, K.N. Familial glaucoma in the Beagle dog. J. Am. Anim. Hosp. Assoc. 1972, 8, 23–28. [Google Scholar]
- Kuchtey, J.; Olson, L.M.; Rinkoski, T.; MacKay, E.O.; Iverson, T.M.; Gelatt, K.N.; Haines, J.L.; Kuchtey, R.W. Mapping of the disease locus and identification of ADAMTS10 as a candidate gene in a canine model of primary open angle Glaucoma. PLoS Genet. 2011, 7, e1001306. [Google Scholar] [CrossRef] [PubMed]
- Brooks, D.E.; Strubbe, D.T.; Kubilis, P.S.; MacKay, E.O.; Samuelson, D.A.; Gelatt, K.N. Histomorphometry of the optic nerves of normal dogs and dogs with hereditary glaucoma. Exp. Eye Res. 1995, 60, 71–89. [Google Scholar] [CrossRef] [PubMed]
- Brooks, D.E.; A Samuelson, D.; Gelatt, K.N.; Smith, P.J. Morphologic changes in the lamina cribrosa of beagles with primary open-angle glaucoma. Am. J. Vet. Res. 1989, 50, 936–941. [Google Scholar]
- Brooks, D.E.; A Samuelson, D.; Gelatt, K.N. Ultrastructural changes in laminar optic nerve capillaries of beagles with primary open-angle glaucoma. Am. J. Vet. Res. 1989, 50, 929–935. [Google Scholar] [PubMed]
- Gelatt, K.N.; Gum, G.G.; Barrie, K.P.; Williams, L.W. Diurnal variation in intraocular pressure in normotensive and glaucomatous Beagles. Glaucoma 1981, 3, 21–24. [Google Scholar]
- Yang, H.; Qi, J.; Hardin, C.; Gardiner, S.K.; Strouthidis, N.G.; Fortune, B.; Burgoyne, C.F. Spectral-domain optical coherence tomography enhanced depth imaging of the normal and glaucomatous nonhuman primate optic nerve head. Investig. Opthalmol. Vis. Sci. 2012, 53, 394–405. [Google Scholar] [CrossRef] [PubMed]
- Leary, K.A.; Steibel, J.P.; Harman, C.D.; Anderson, A.L.; Komáromy, A.M. Safety and efficacy of topically administered netarsudil-latanoprost fixed dose combination (FDC; RocklatanTM) in normal and glaucomatous dogs with ADAMTS10-open-angle glaucoma (ADAMTS10-OAG). Vet. Ophthalmol. 2021, 24, 610–619. [Google Scholar] [CrossRef] [PubMed]
- Zheng, S.; Bai, Y.; Xu, Z.; Liu, P.; Ni, G. Optical Coherence Tomography for Three-Dimensional Imaging in the Biomedical Field: A Review. Front. Phys. 2021, 9, 744346. [Google Scholar] [CrossRef]
- Brooks, D.; Komàromy, A.; Källberg, M. Comparative retinal ganglion cell and optic nerve morphology. Vet. Ophthalmol. 1999, 2, 3–11. [Google Scholar] [CrossRef] [PubMed]
- Leung, C.K.-S.; Chan, W.-M.; Hui, Y.-L.; Yung, W.-H.; Woo, J.; Tsang, M.-K.; Tse, K.-K. Analysis of retinal nerve fiber layer and optic nerve head in glaucoma with different reference plane offsets, using optical coherence tomography. Investig. Ophthalmol. Vis. Sci. 2005, 46, 891–899. [Google Scholar] [CrossRef] [PubMed]
- Schuman, J.S.; Wollstein, G.; Farra, T.; Hertzmark, E.; Aydin, A.; Fujimoto, J.G.; Paunescu, L.A. Comparison of optic nerve head measurements obtained by optical coherence tomography and confocal scanning laser ophthalmoscopy. Arch. Ophthalmol. 2003, 135, 504–512. [Google Scholar] [CrossRef] [PubMed]
- Hood, D.C.; Fortune, B.O.; Arthur, S.N.; Xing, D.B.; Salant, J.A.; Ritch, R.; Liebmann, J.M. Blood vessel contributions to retinal nerve fiber layer thickness profiles measured with optical coherence tomography. Eur. J. Gastroenterol. Hepatol. 2008, 17, 519–528. [Google Scholar] [CrossRef] [PubMed]
- Jonas, J.B.; Naumann, G.O.H. The optic disc nerve: Its embryology, histology, and morphology. Opt. Nerve Glaucoma 1993, 3–26. [Google Scholar]
- Gelatt, K.N.; Gum, G.G.; Gwin, R.M.; Bromberg, N.M.; E Merideth, R.; Samuelson, D.A. Primary open angle glaucoma: Inherited primary open angle glaucoma in the beagle. Am. J. Pathol. 1981, 102, 292–295. [Google Scholar] [PubMed]
- Gelatt, K.; Peiffer, R.; Gwin, R.; Gum, G.; Williams, L. Clinical manifestations of inherited glaucoma in the beagle. Investig. Ophthalmol. Vis. Sci. 1977, 16, 1135–1142. [Google Scholar]
- DSamuelson, D.A.; Williams, L.W.; Gelatt, K.N.; Gum, G.; Meredith, R. Orthograde rapid axoplasmic transport and ultrastructural changes of the optic nerve. Part II. Beagles with primary open-angle glaucoma. Glaucoma 1983, 5, 174–184. [Google Scholar]
- Williams, L.W.; Gelatt, K.N.; Gum, G.G.; Samuelson, D.A.; Merideth, R.E. Orthograde rapid axoplasmic transport and ultrastructural changes of the optic nerve. Part I. Normotensive and acute ocular hypertensive beagles. Glaucoma 1983, 5, 117–128. [Google Scholar]
- Fan, N.; Huang, N.; Lam, D.S.C.; Leung, C.K.-S. Measurement of photoreceptor layer in glaucoma: A spectral-domain optical coherence tomography study. J. Ophthalmol. 2011, 2011, 264803. [Google Scholar] [CrossRef]
- Wygnanski, T.; Desatnik, H.; Quigley, H.A.; Glovinsky, Y. Comparison of ganglion cell loss and cone loss in experimental glaucoma. Arch. Ophthalmol. 1995, 120, 184–189. [Google Scholar] [CrossRef] [PubMed]
- Schuman, J.S.; Hee, M.R.; Puliafito, C.A.; Wong, C.; Pedut-Kloizman, T.; Lin, C.P.; Hertzmark, E.; Izatt, J.A.; Swanson, E.A.; Fujimoto, J.G. Quantification of nerve fiber layer thickness in normal and glaucomatous eyes using optical coherence tomography. Arch. Ophthalmol. 1995, 113, 586–596. [Google Scholar] [CrossRef] [PubMed]
- Quigley, H.A.; Addicks, E.M.; Green, W.R. Optic nerve damage in human glaucoma. III. Quantitative correlation of nerve fiber loss and visual field defect in glaucoma, ischemic neuropathy, papilledema, and toxic neuropathy. Arch. Ophthalmol. 1982, 100, 135–146. [Google Scholar] [CrossRef]
- Park, S.A.; Komáromy, A.M. Biomechanics of the optic nerve head and sclera in canine glaucoma: A brief review. Vet. Ophthalmol. 2021, 24, 316–325. [Google Scholar] [CrossRef] [PubMed]
Disclaimer/Publisher’s Note: The statements, opinions and data contained in all publications are solely those of the individual author(s) and contributor(s) and not of MDPI and/or the editor(s). MDPI and/or the editor(s) disclaim responsibility for any injury to people or property resulting from any ideas, methods, instructions or products referred to in the content. |
© 2024 by the authors. Licensee MDPI, Basel, Switzerland. This article is an open access article distributed under the terms and conditions of the Creative Commons Attribution (CC BY) license (https://creativecommons.org/licenses/by/4.0/).