

A Cutting Force and Hole Geometry Study for Precision Deep-Hole Microdrilling of Magnesium

 ,
,  , , , and
Abstract
1. Introduction
2. Materials and Methods
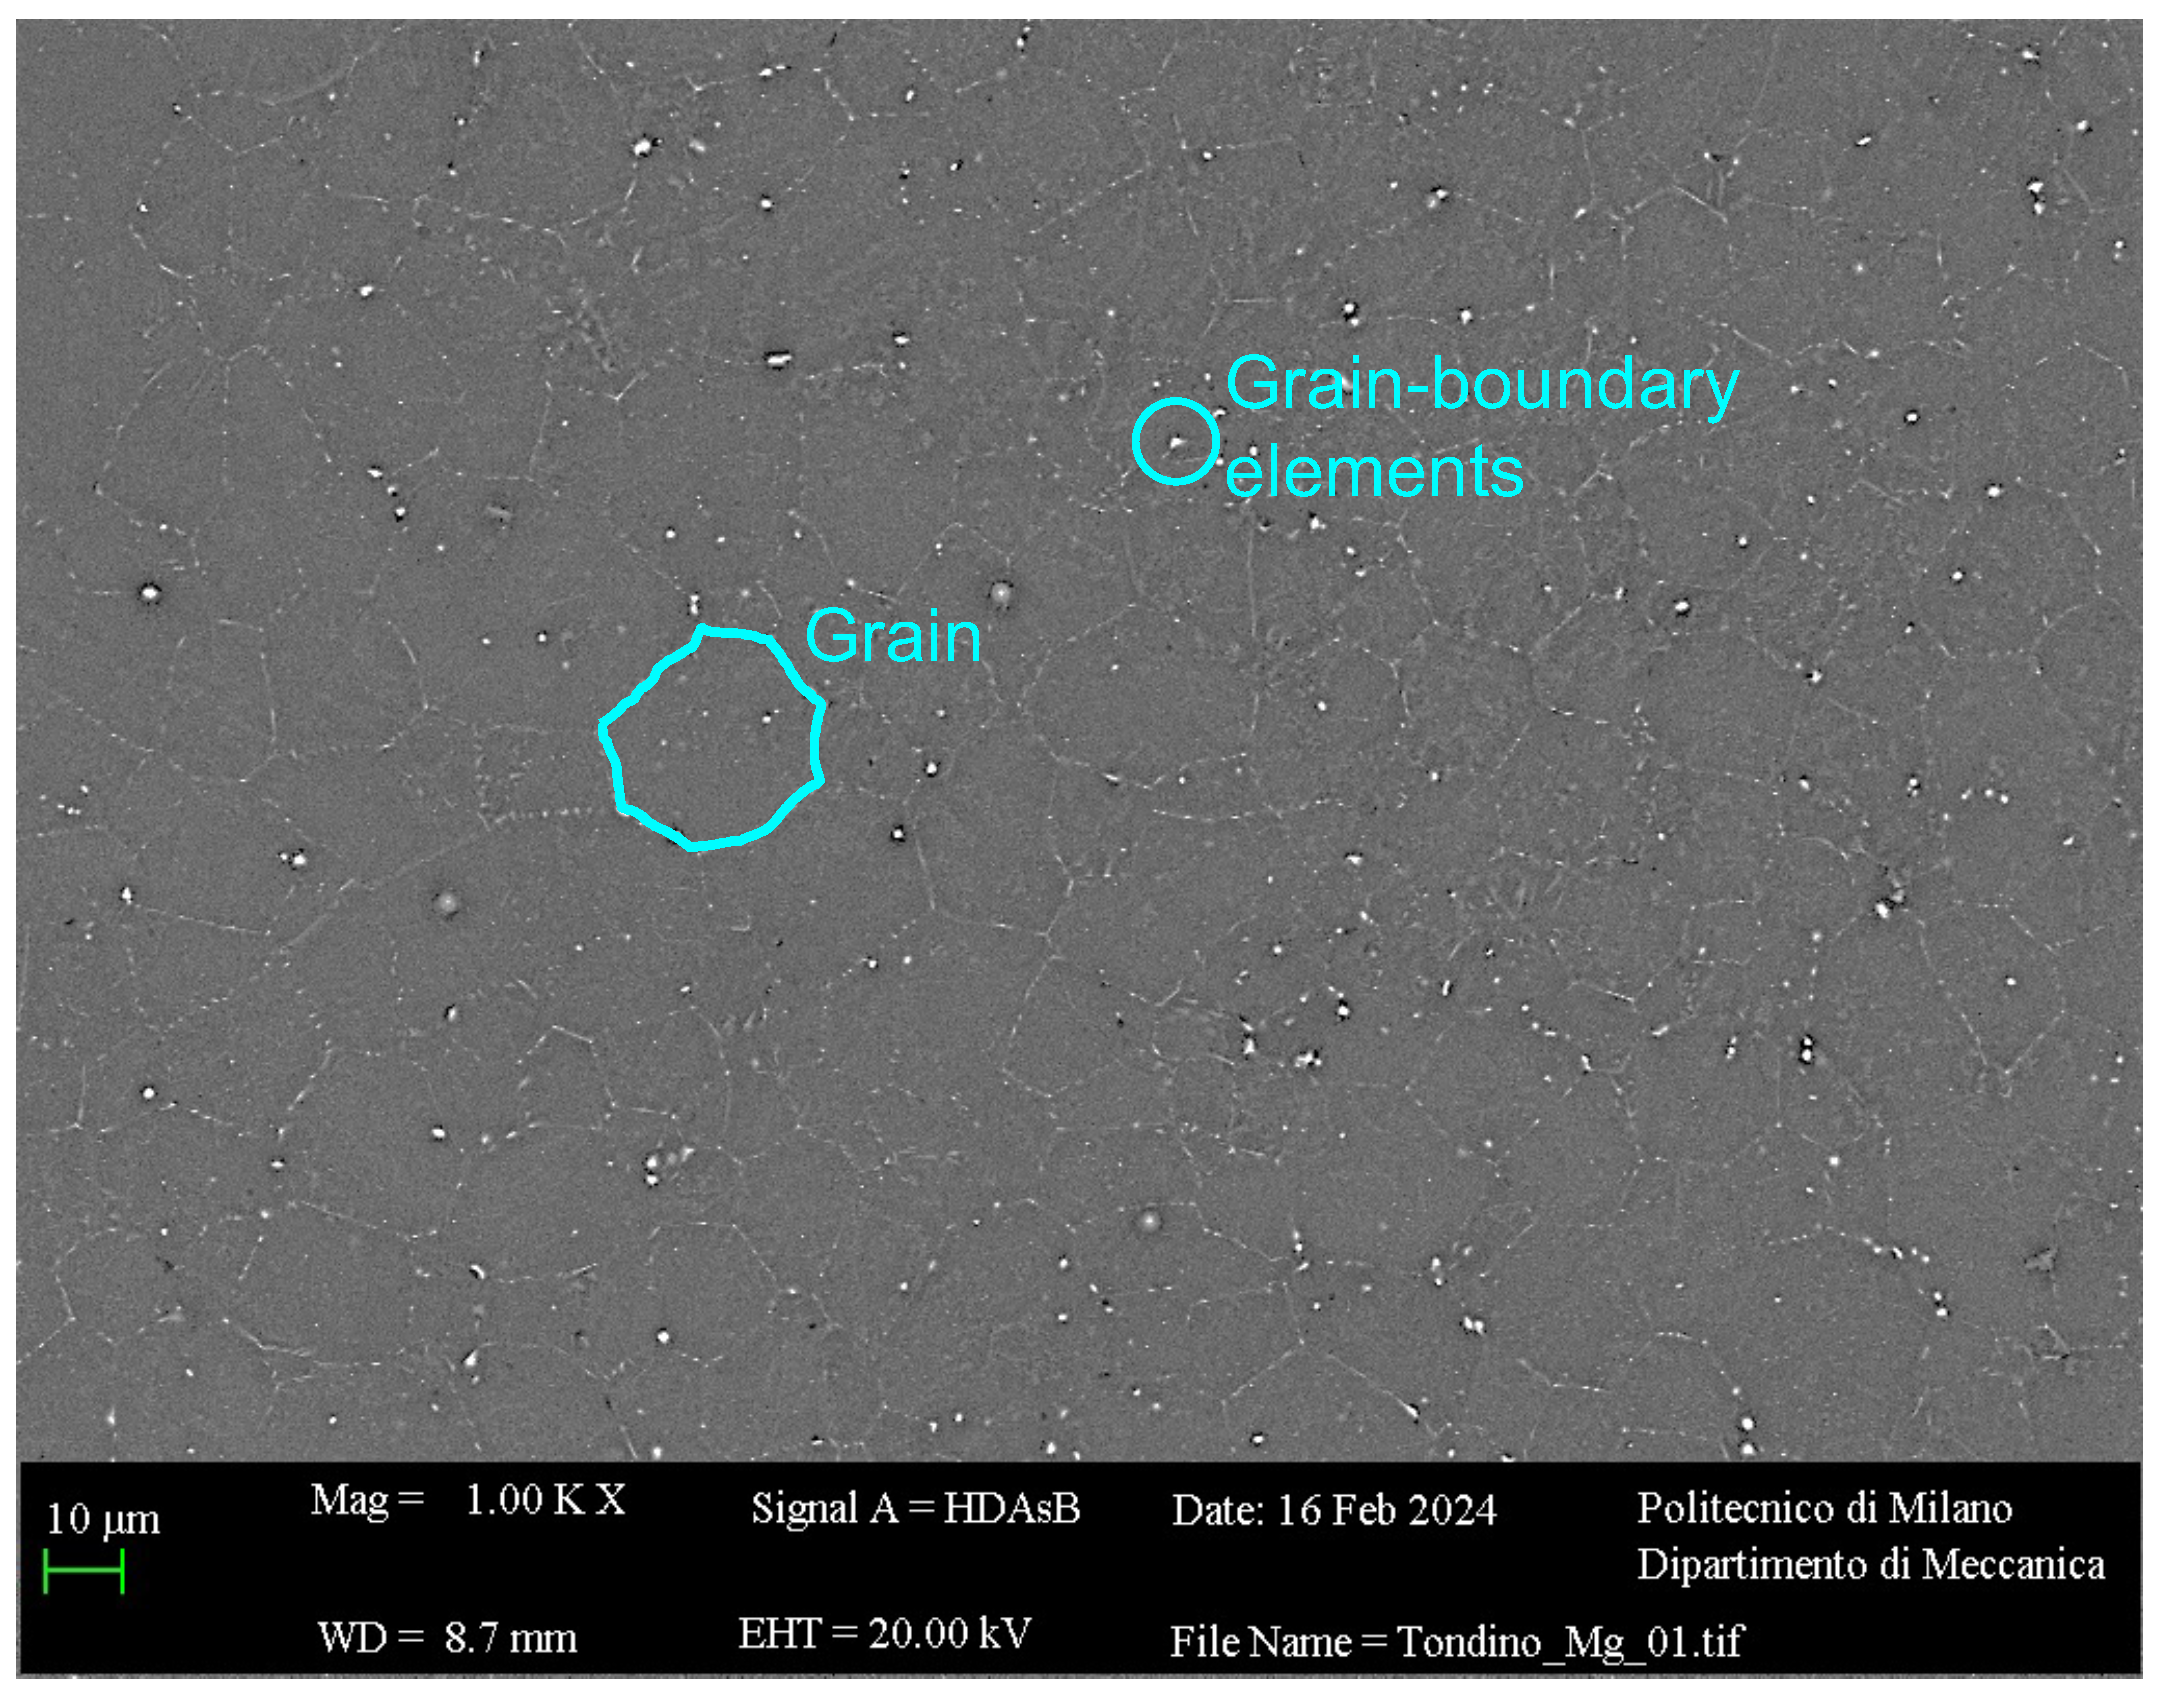
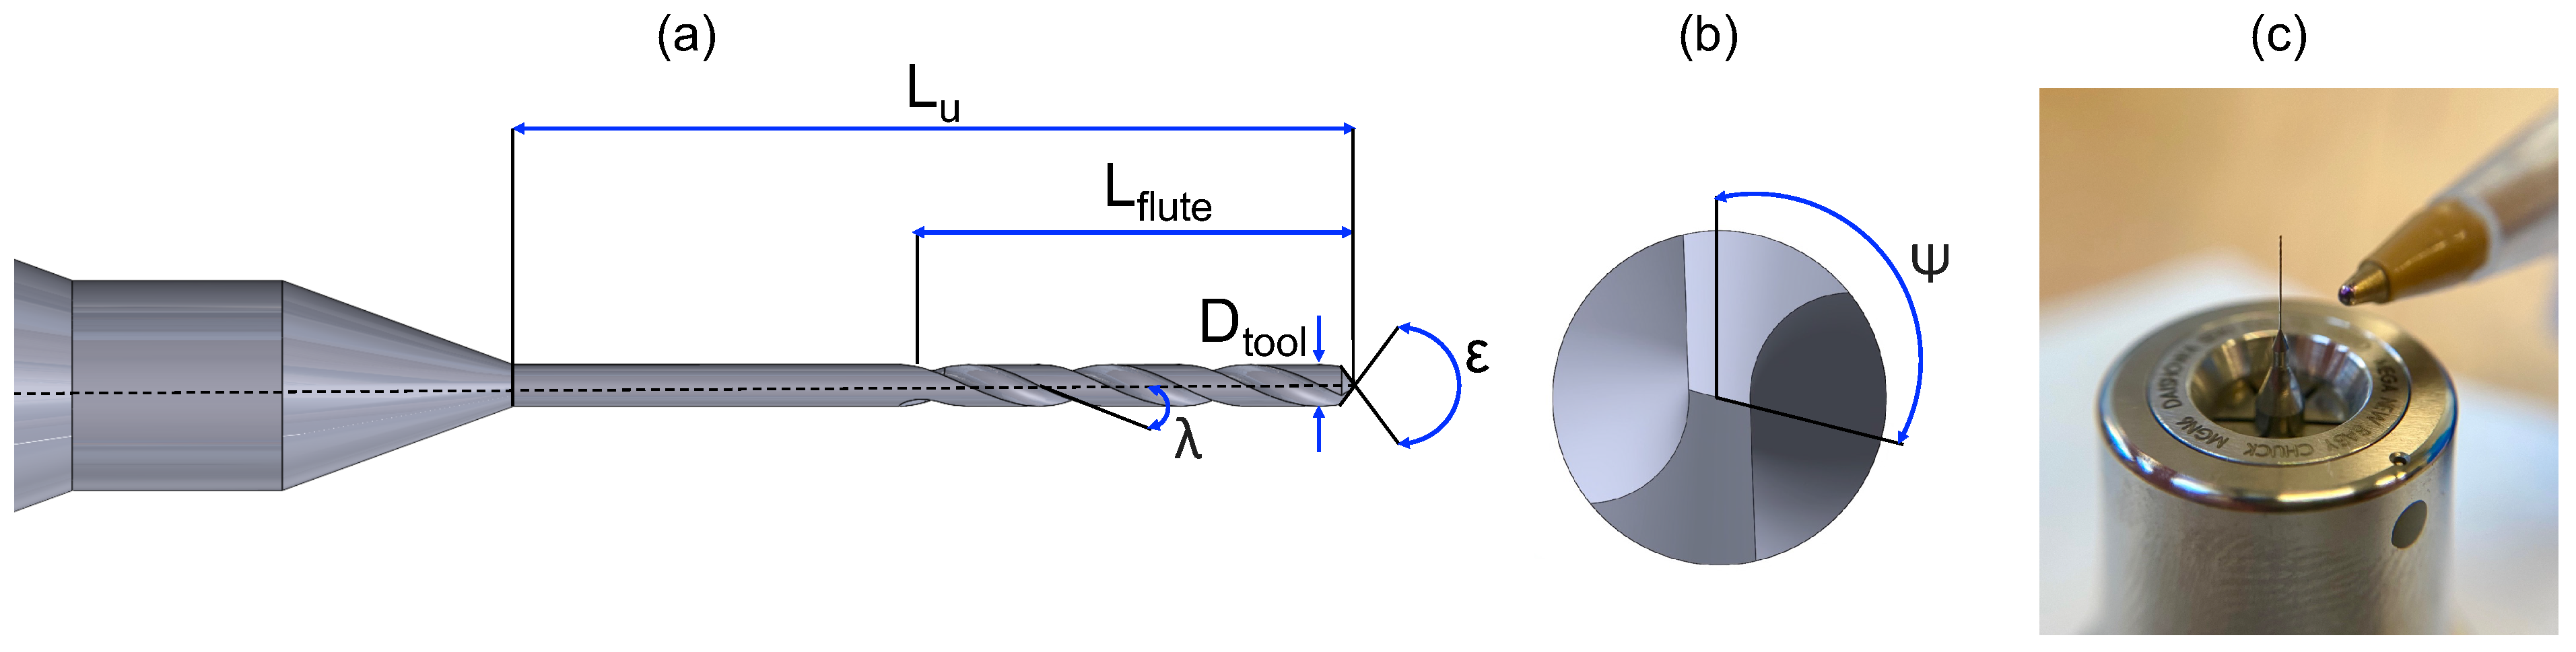
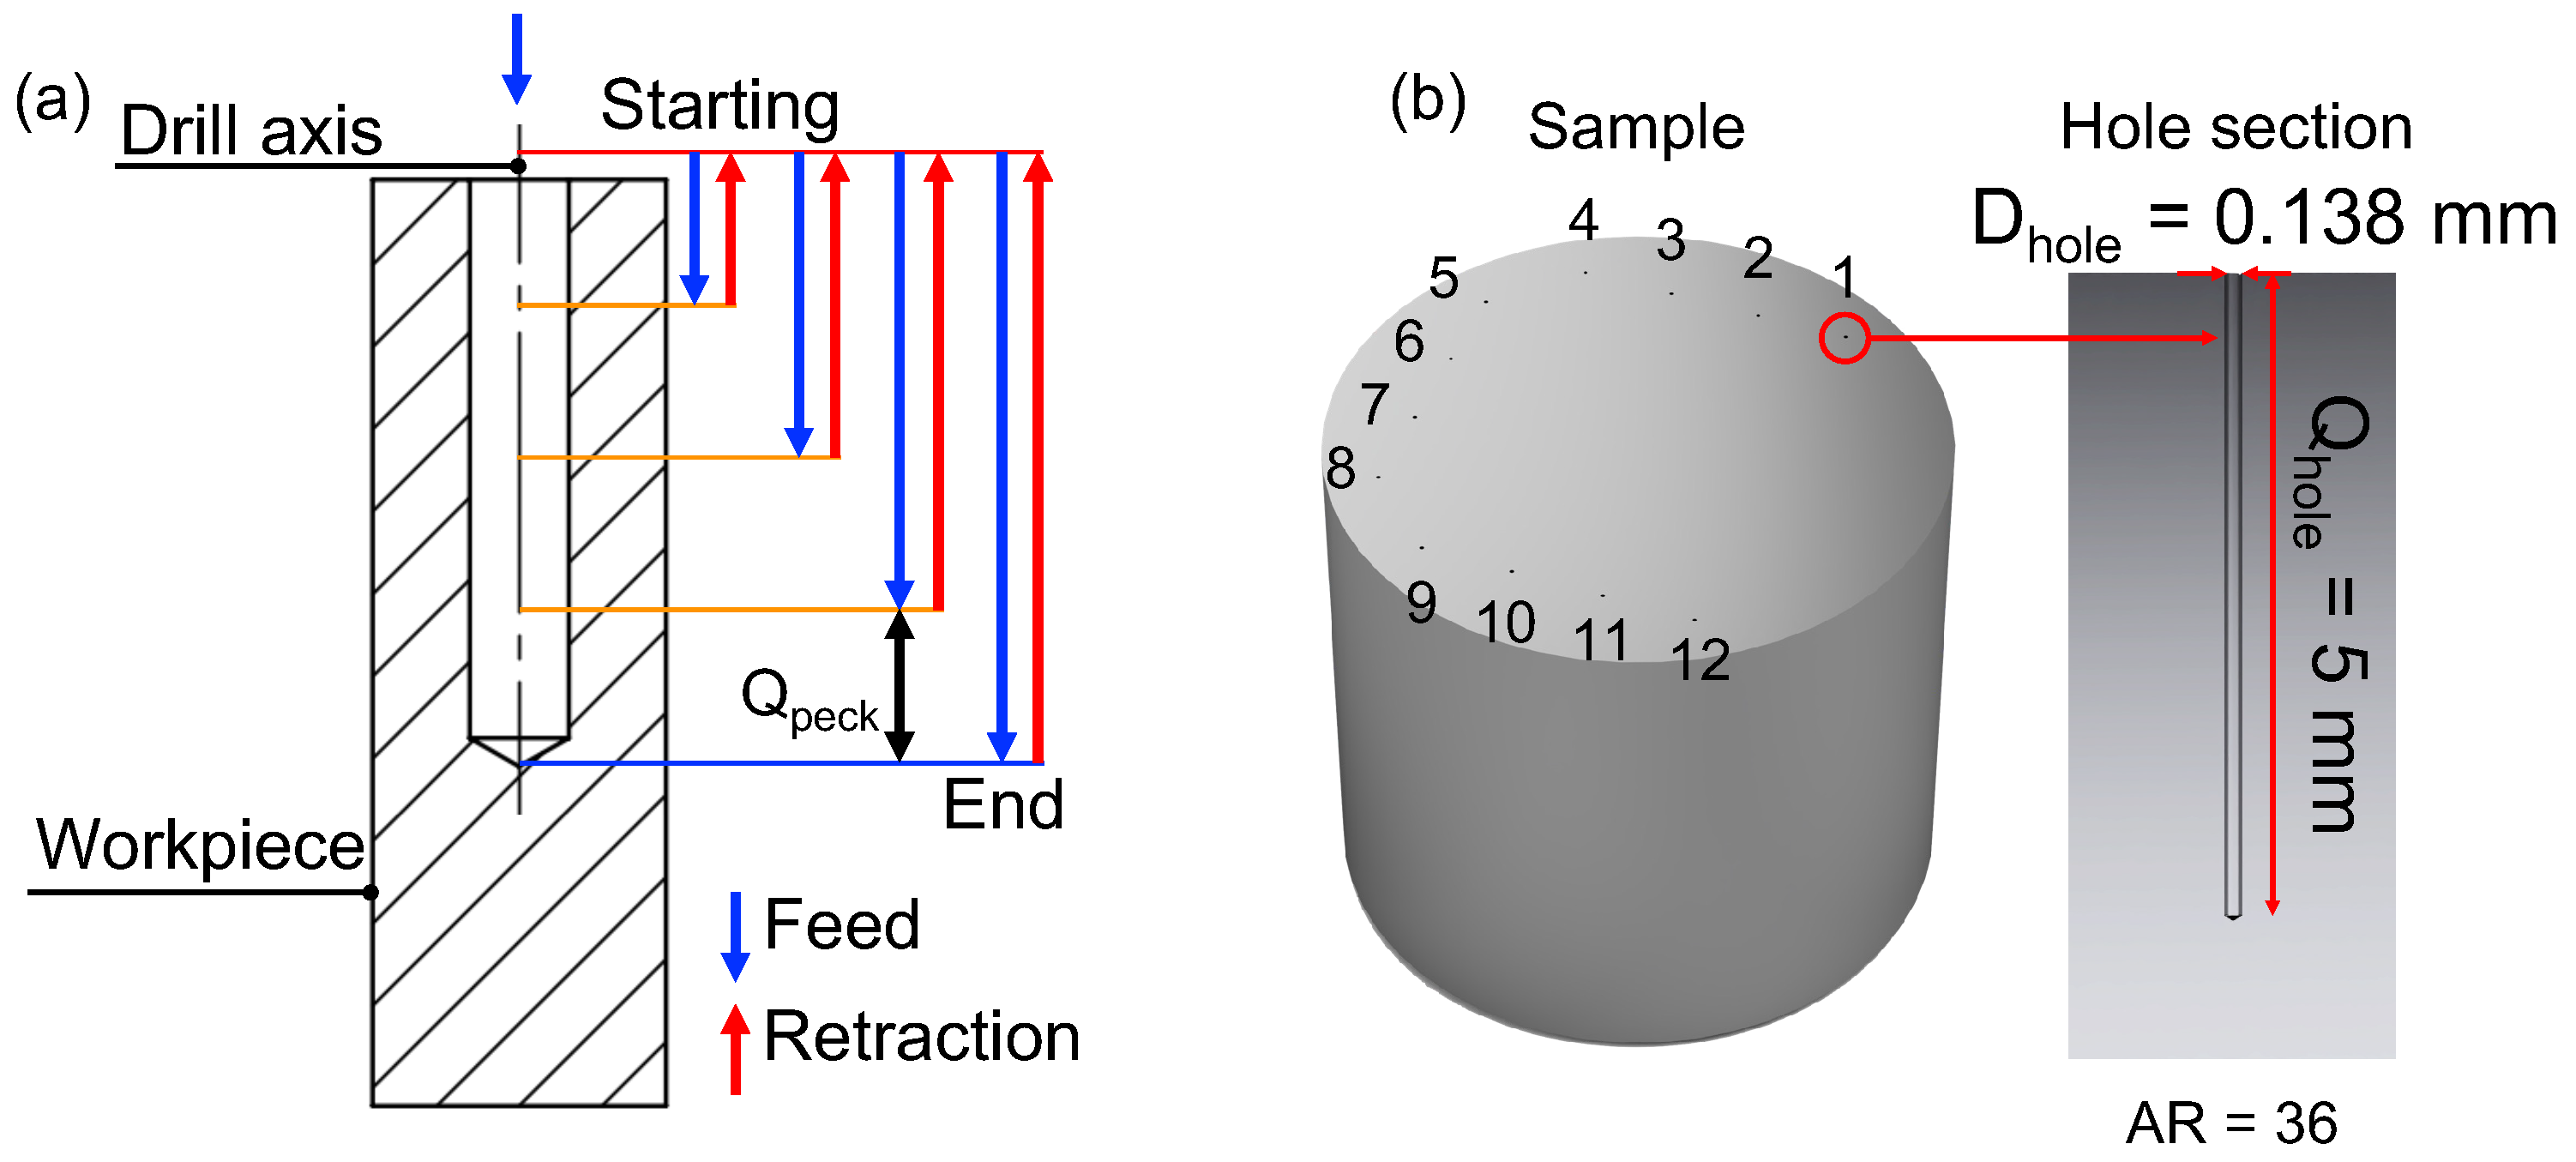
2.1. Workpiece, Tools and Strategy
2.2. Acquisition and Eleboration of Force Signals
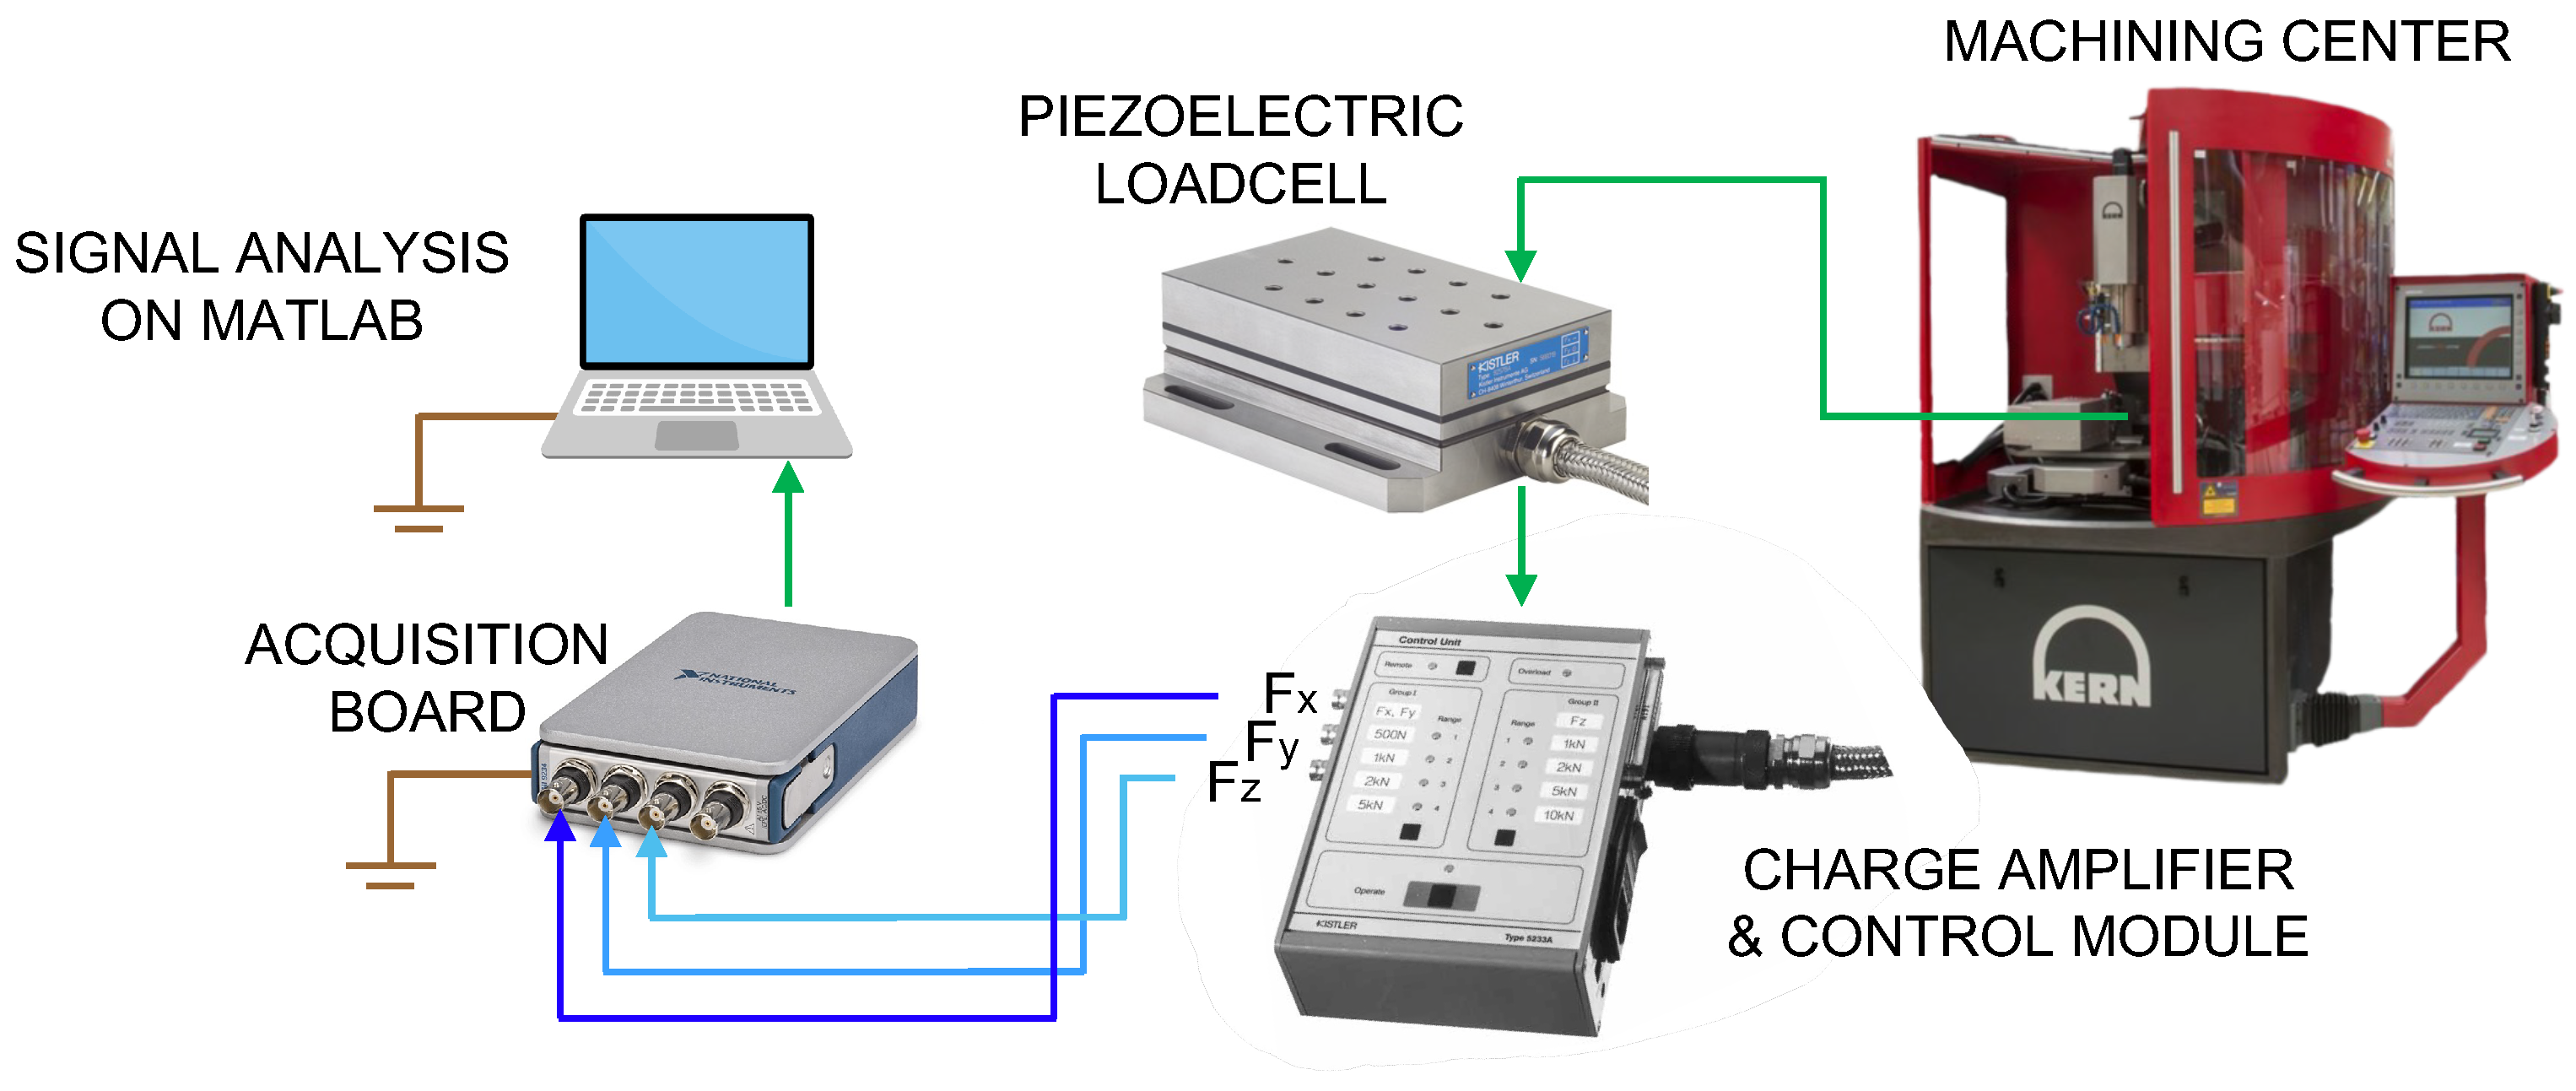
2.2.1. Data Collection Hardware
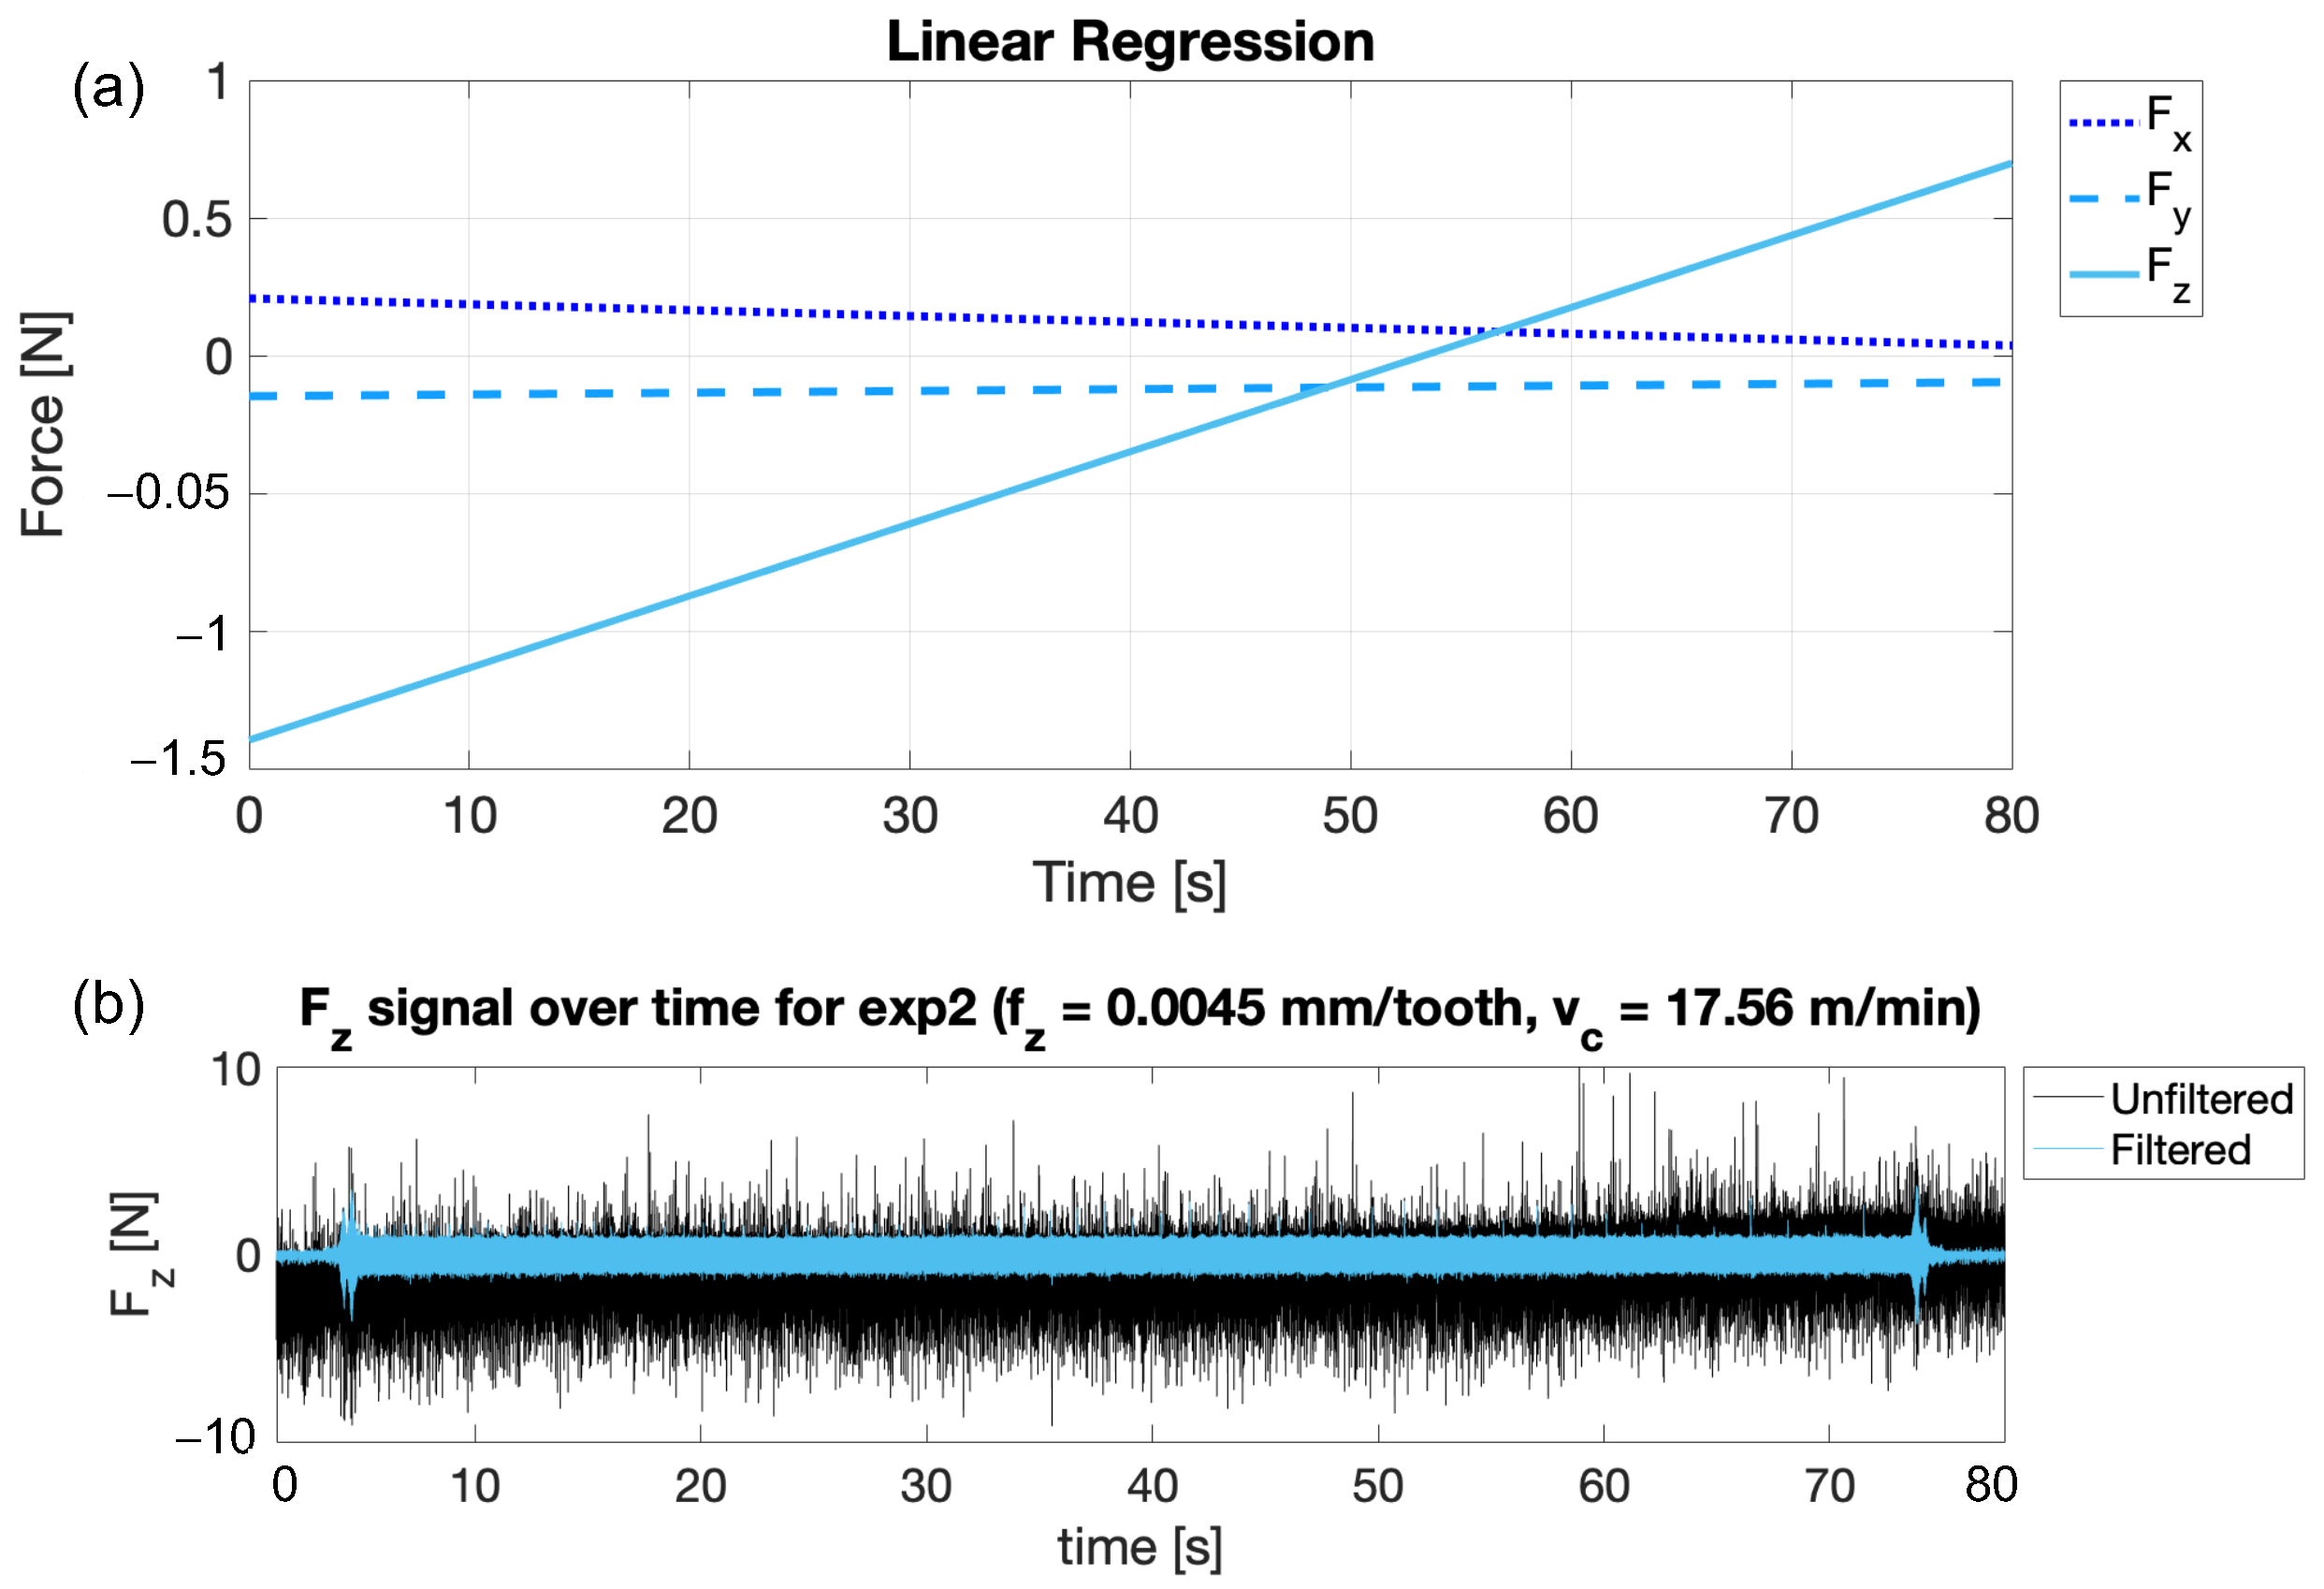
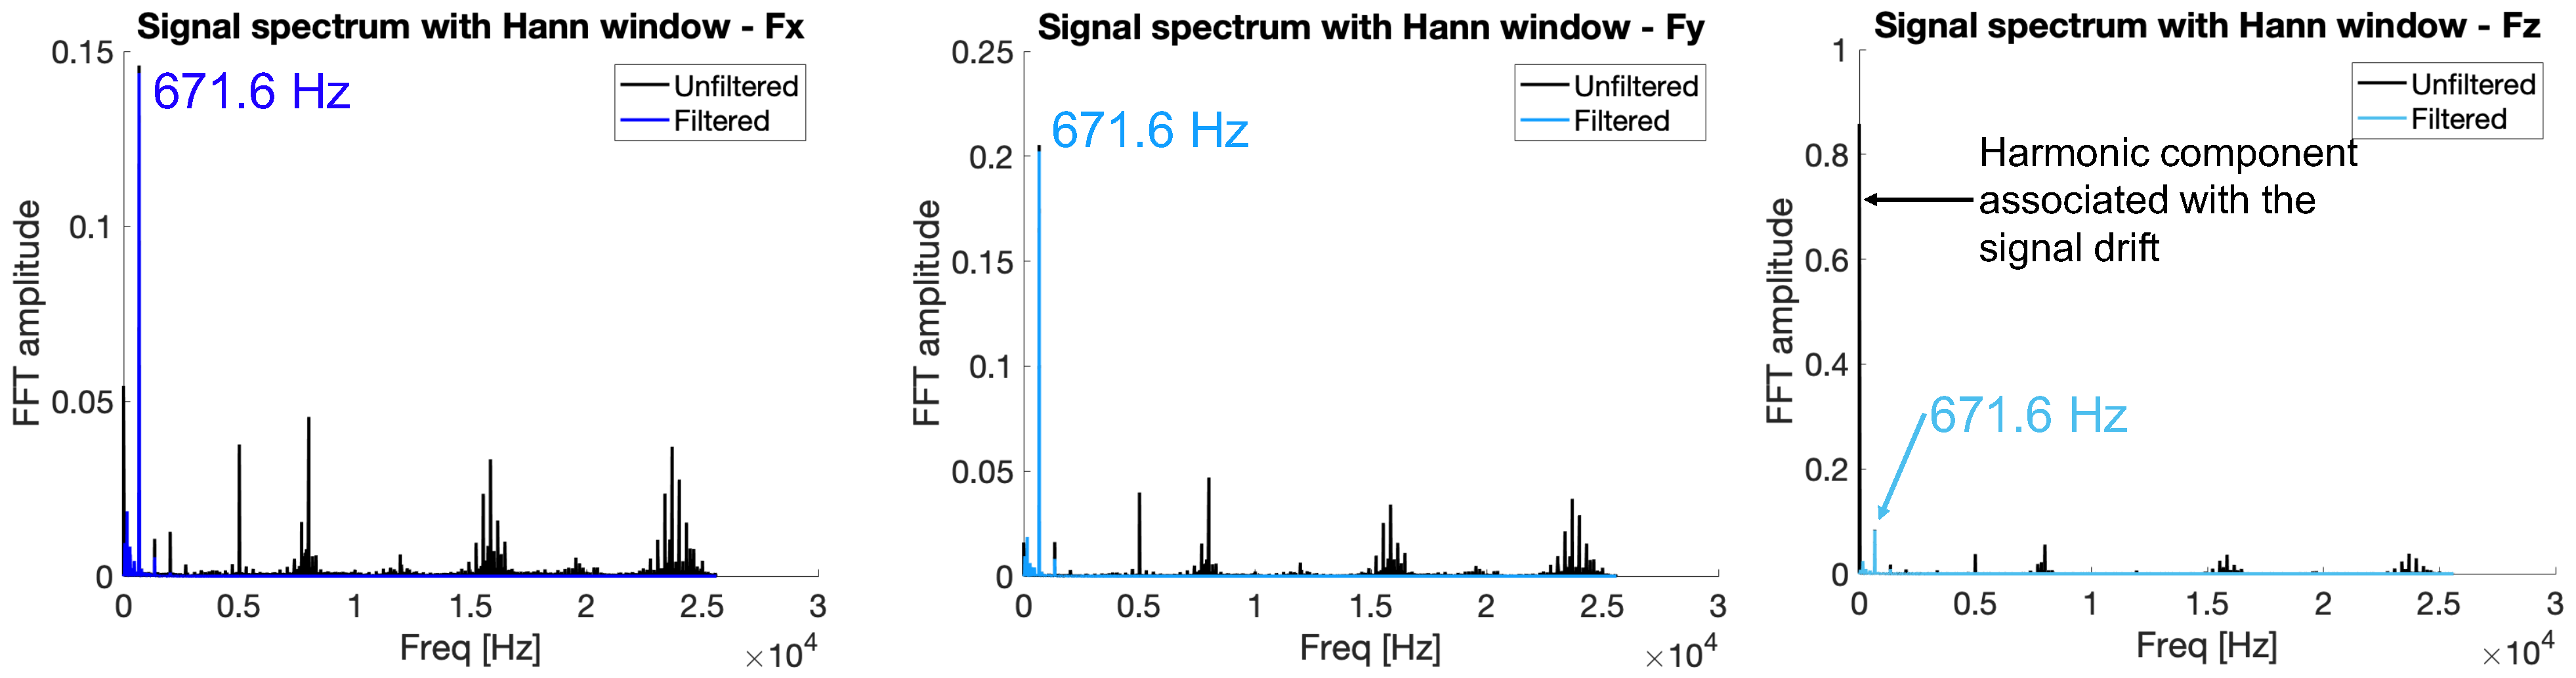
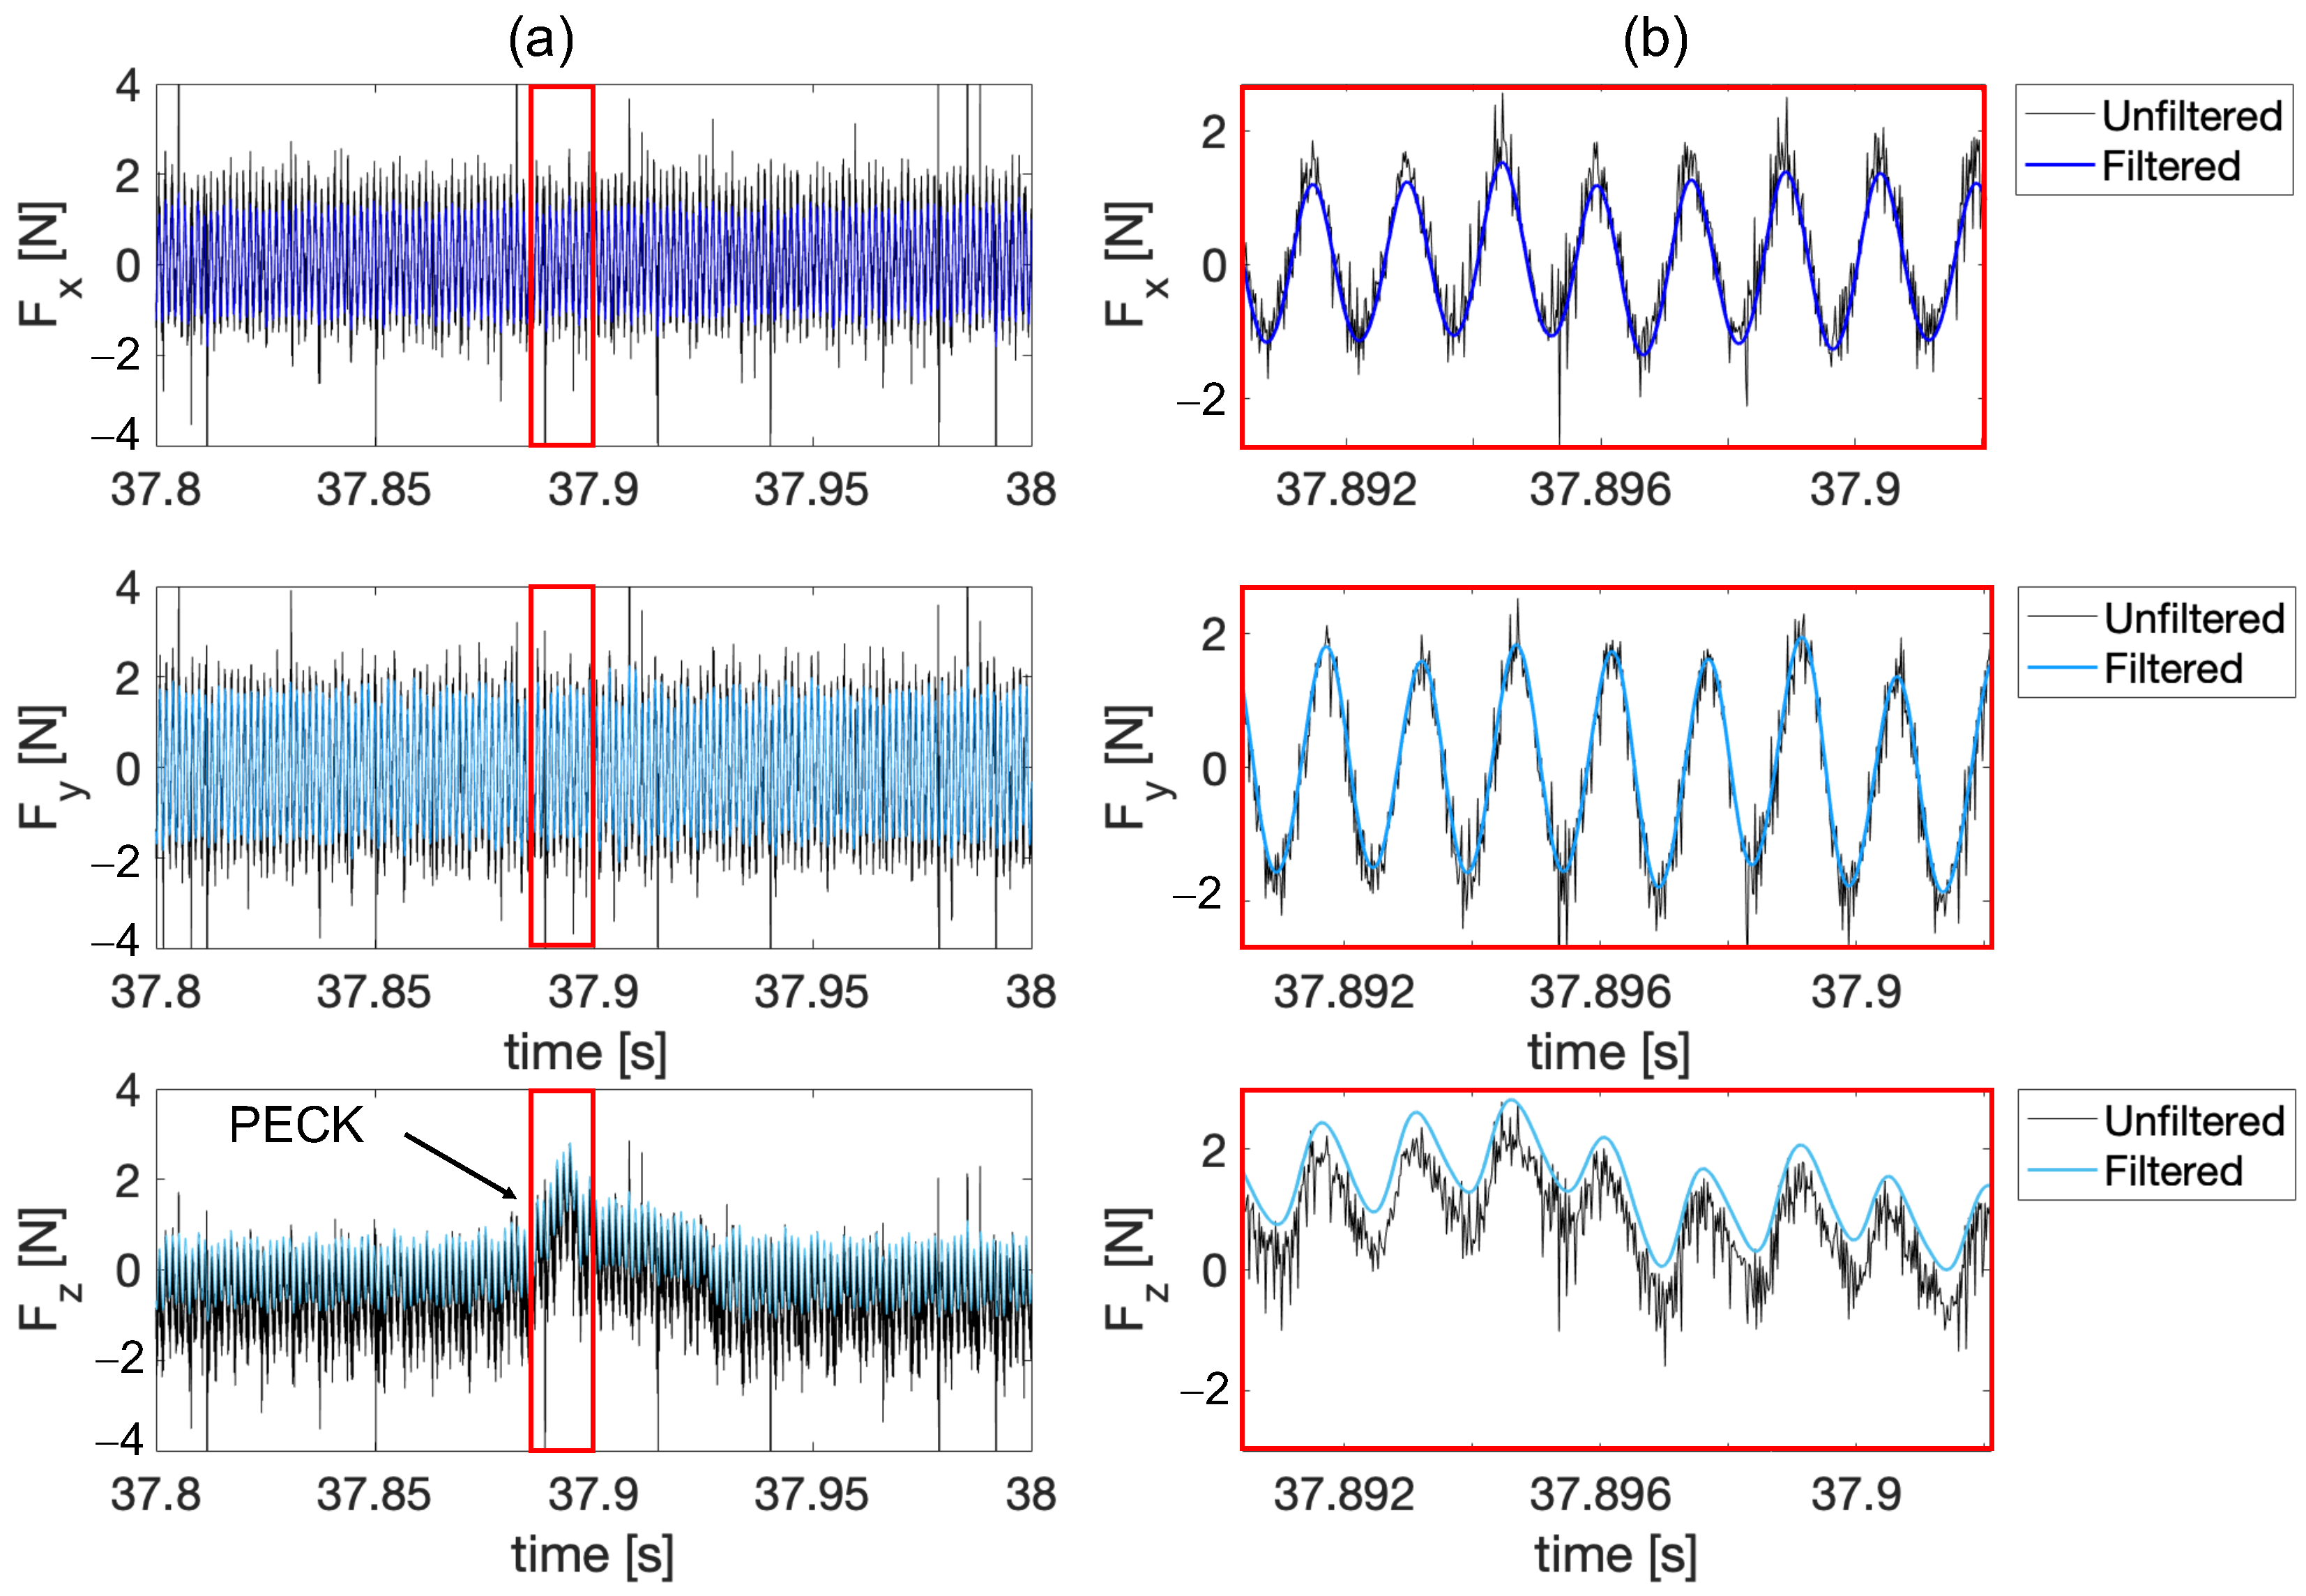
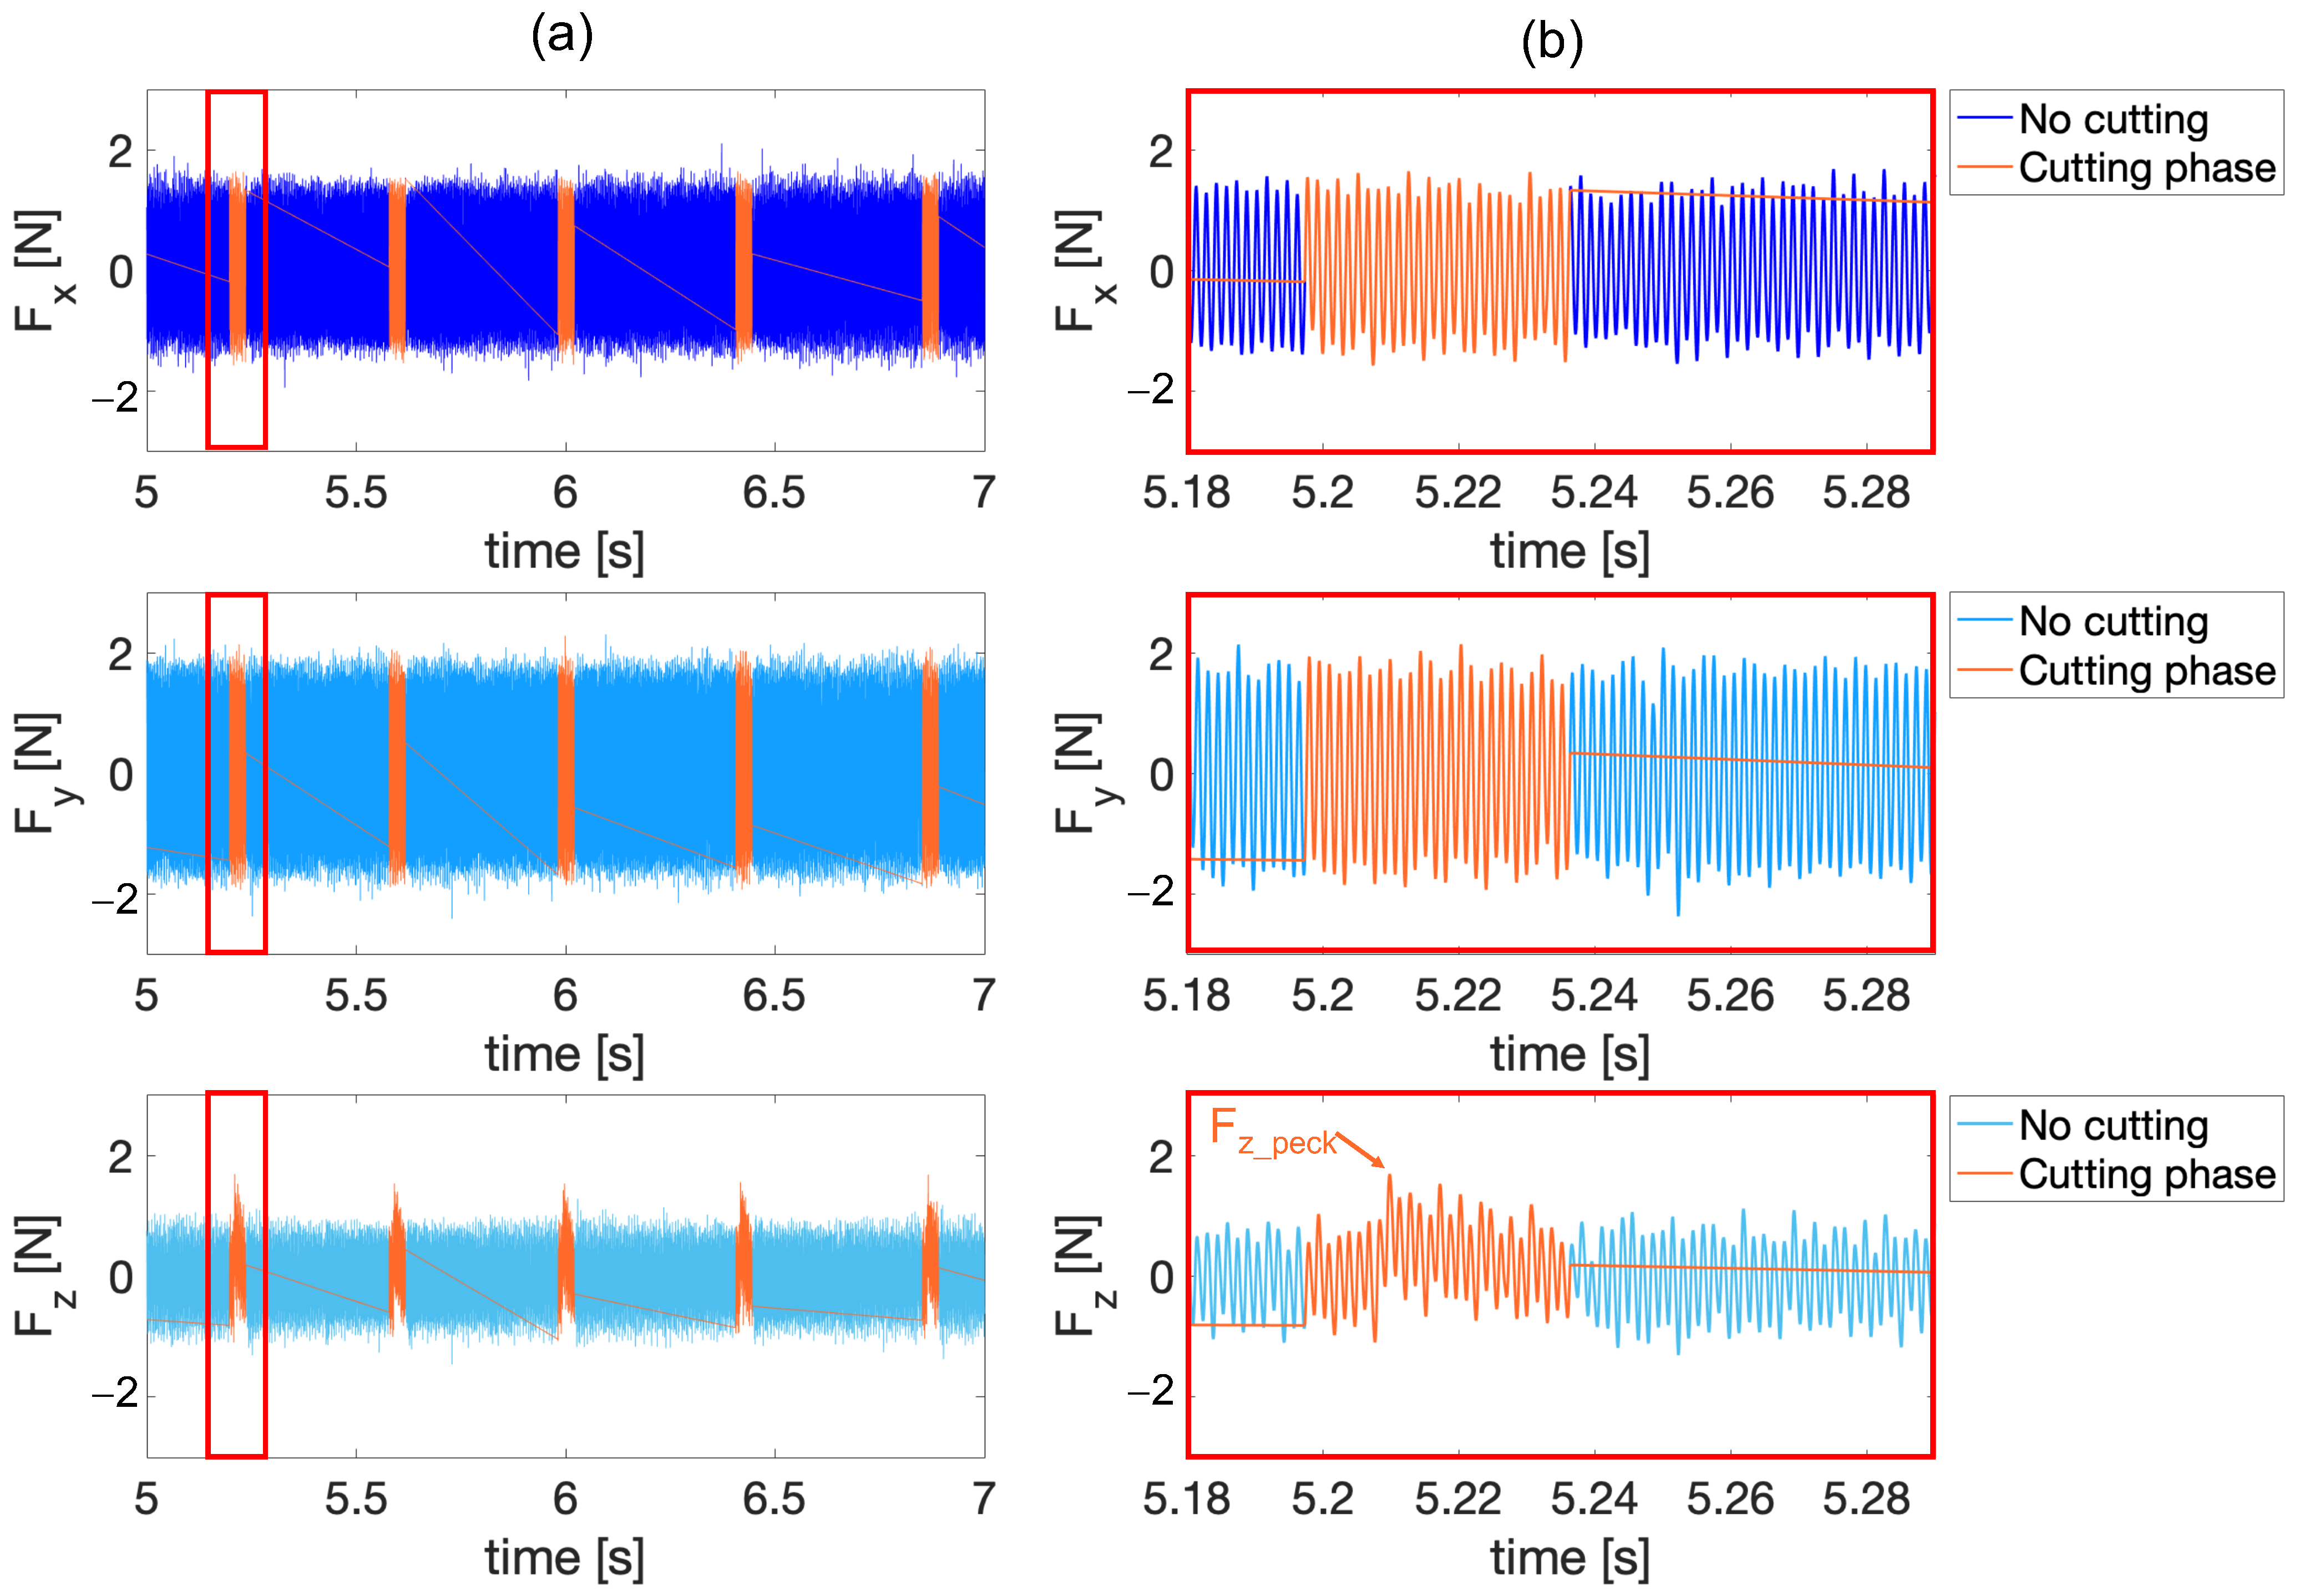
2.2.2. Signal Processing
2.2.3. Signal Analysis
2.3. Holes Quality Analysis
2.3.1. Burr Height and Entrance Diameter
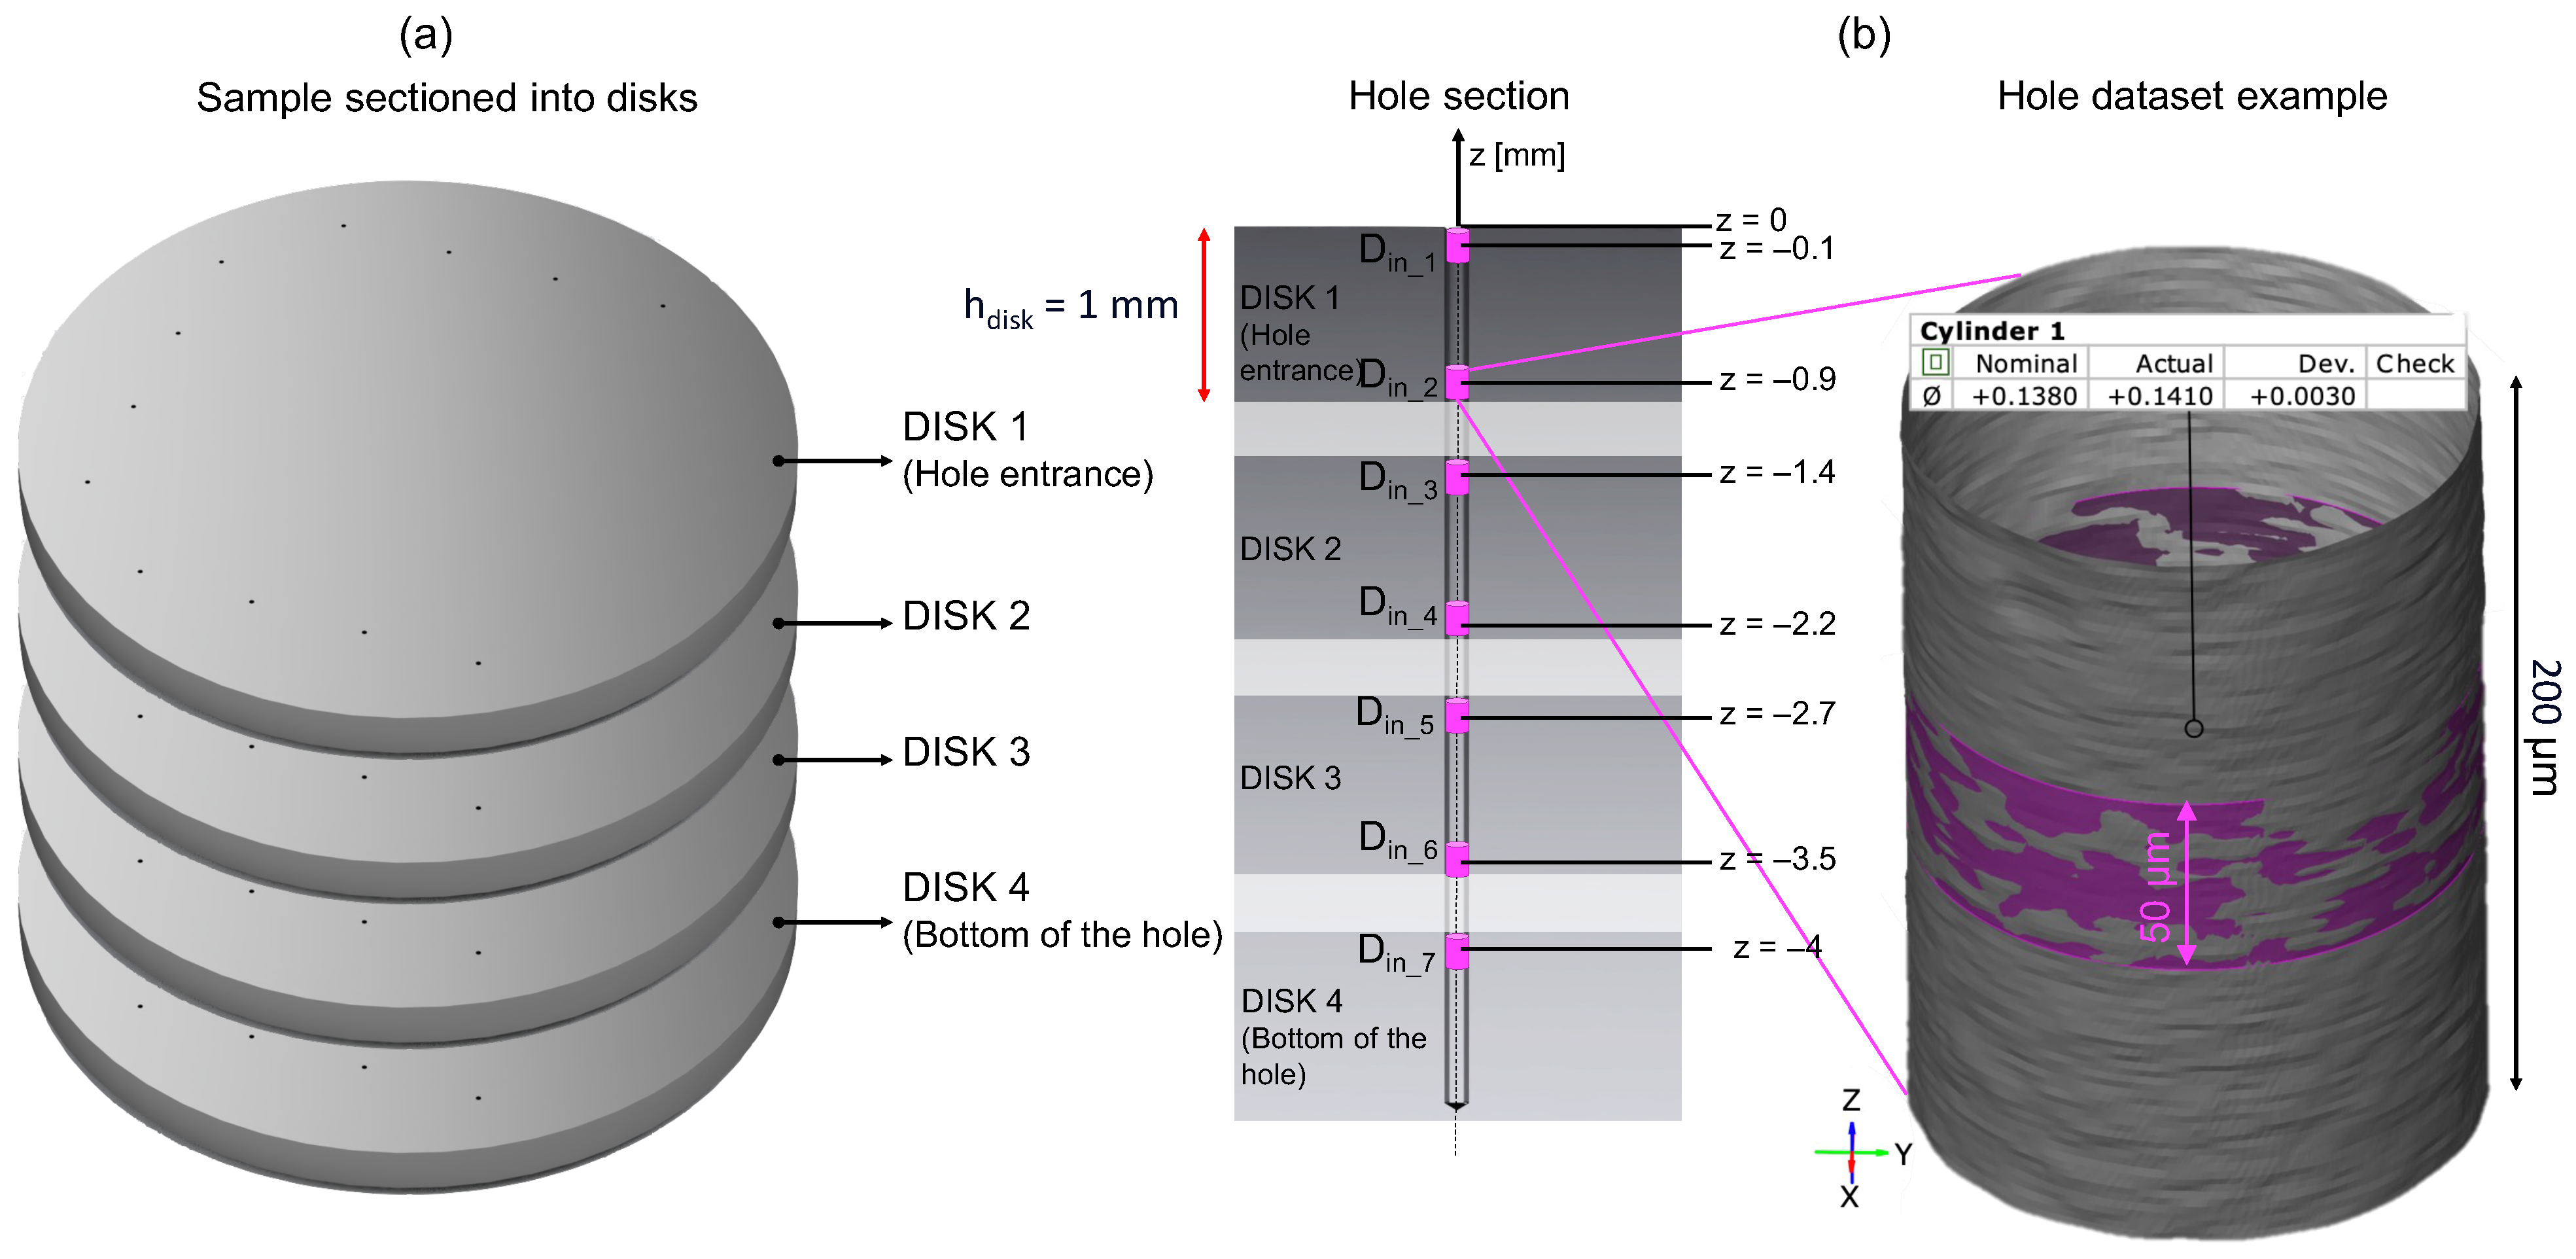
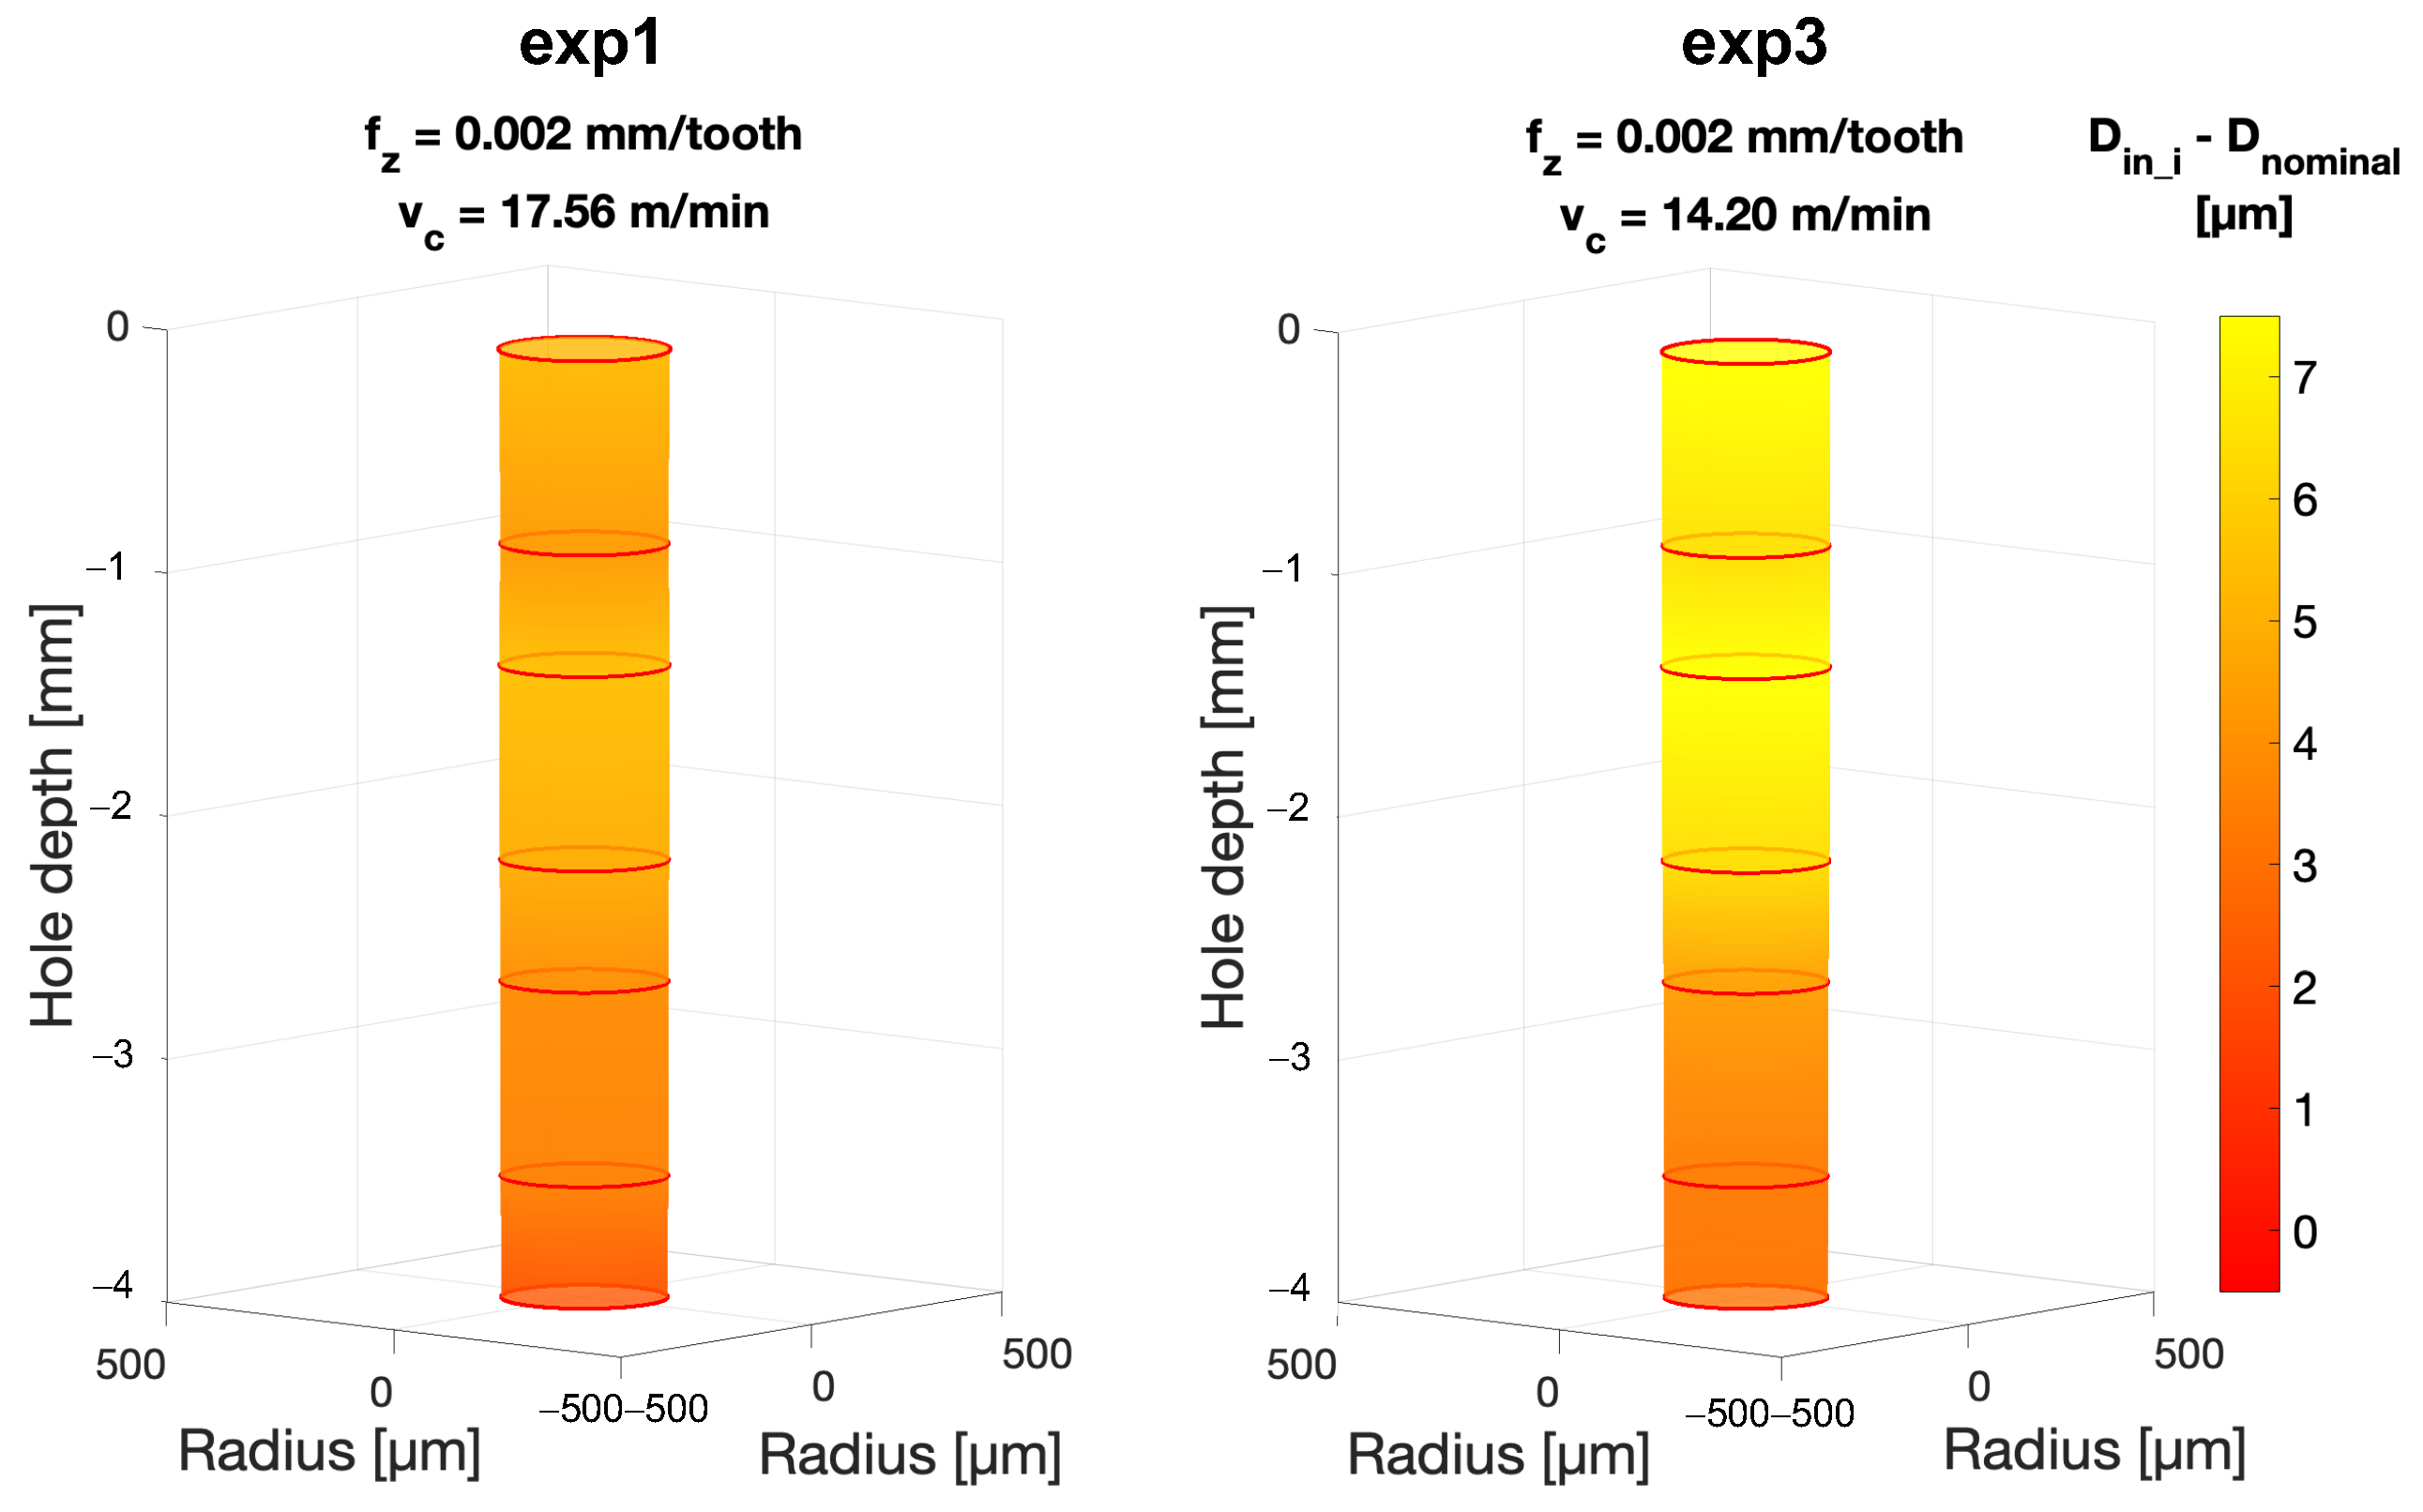
2.3.2. Diameter along Hole Depth
3. Results
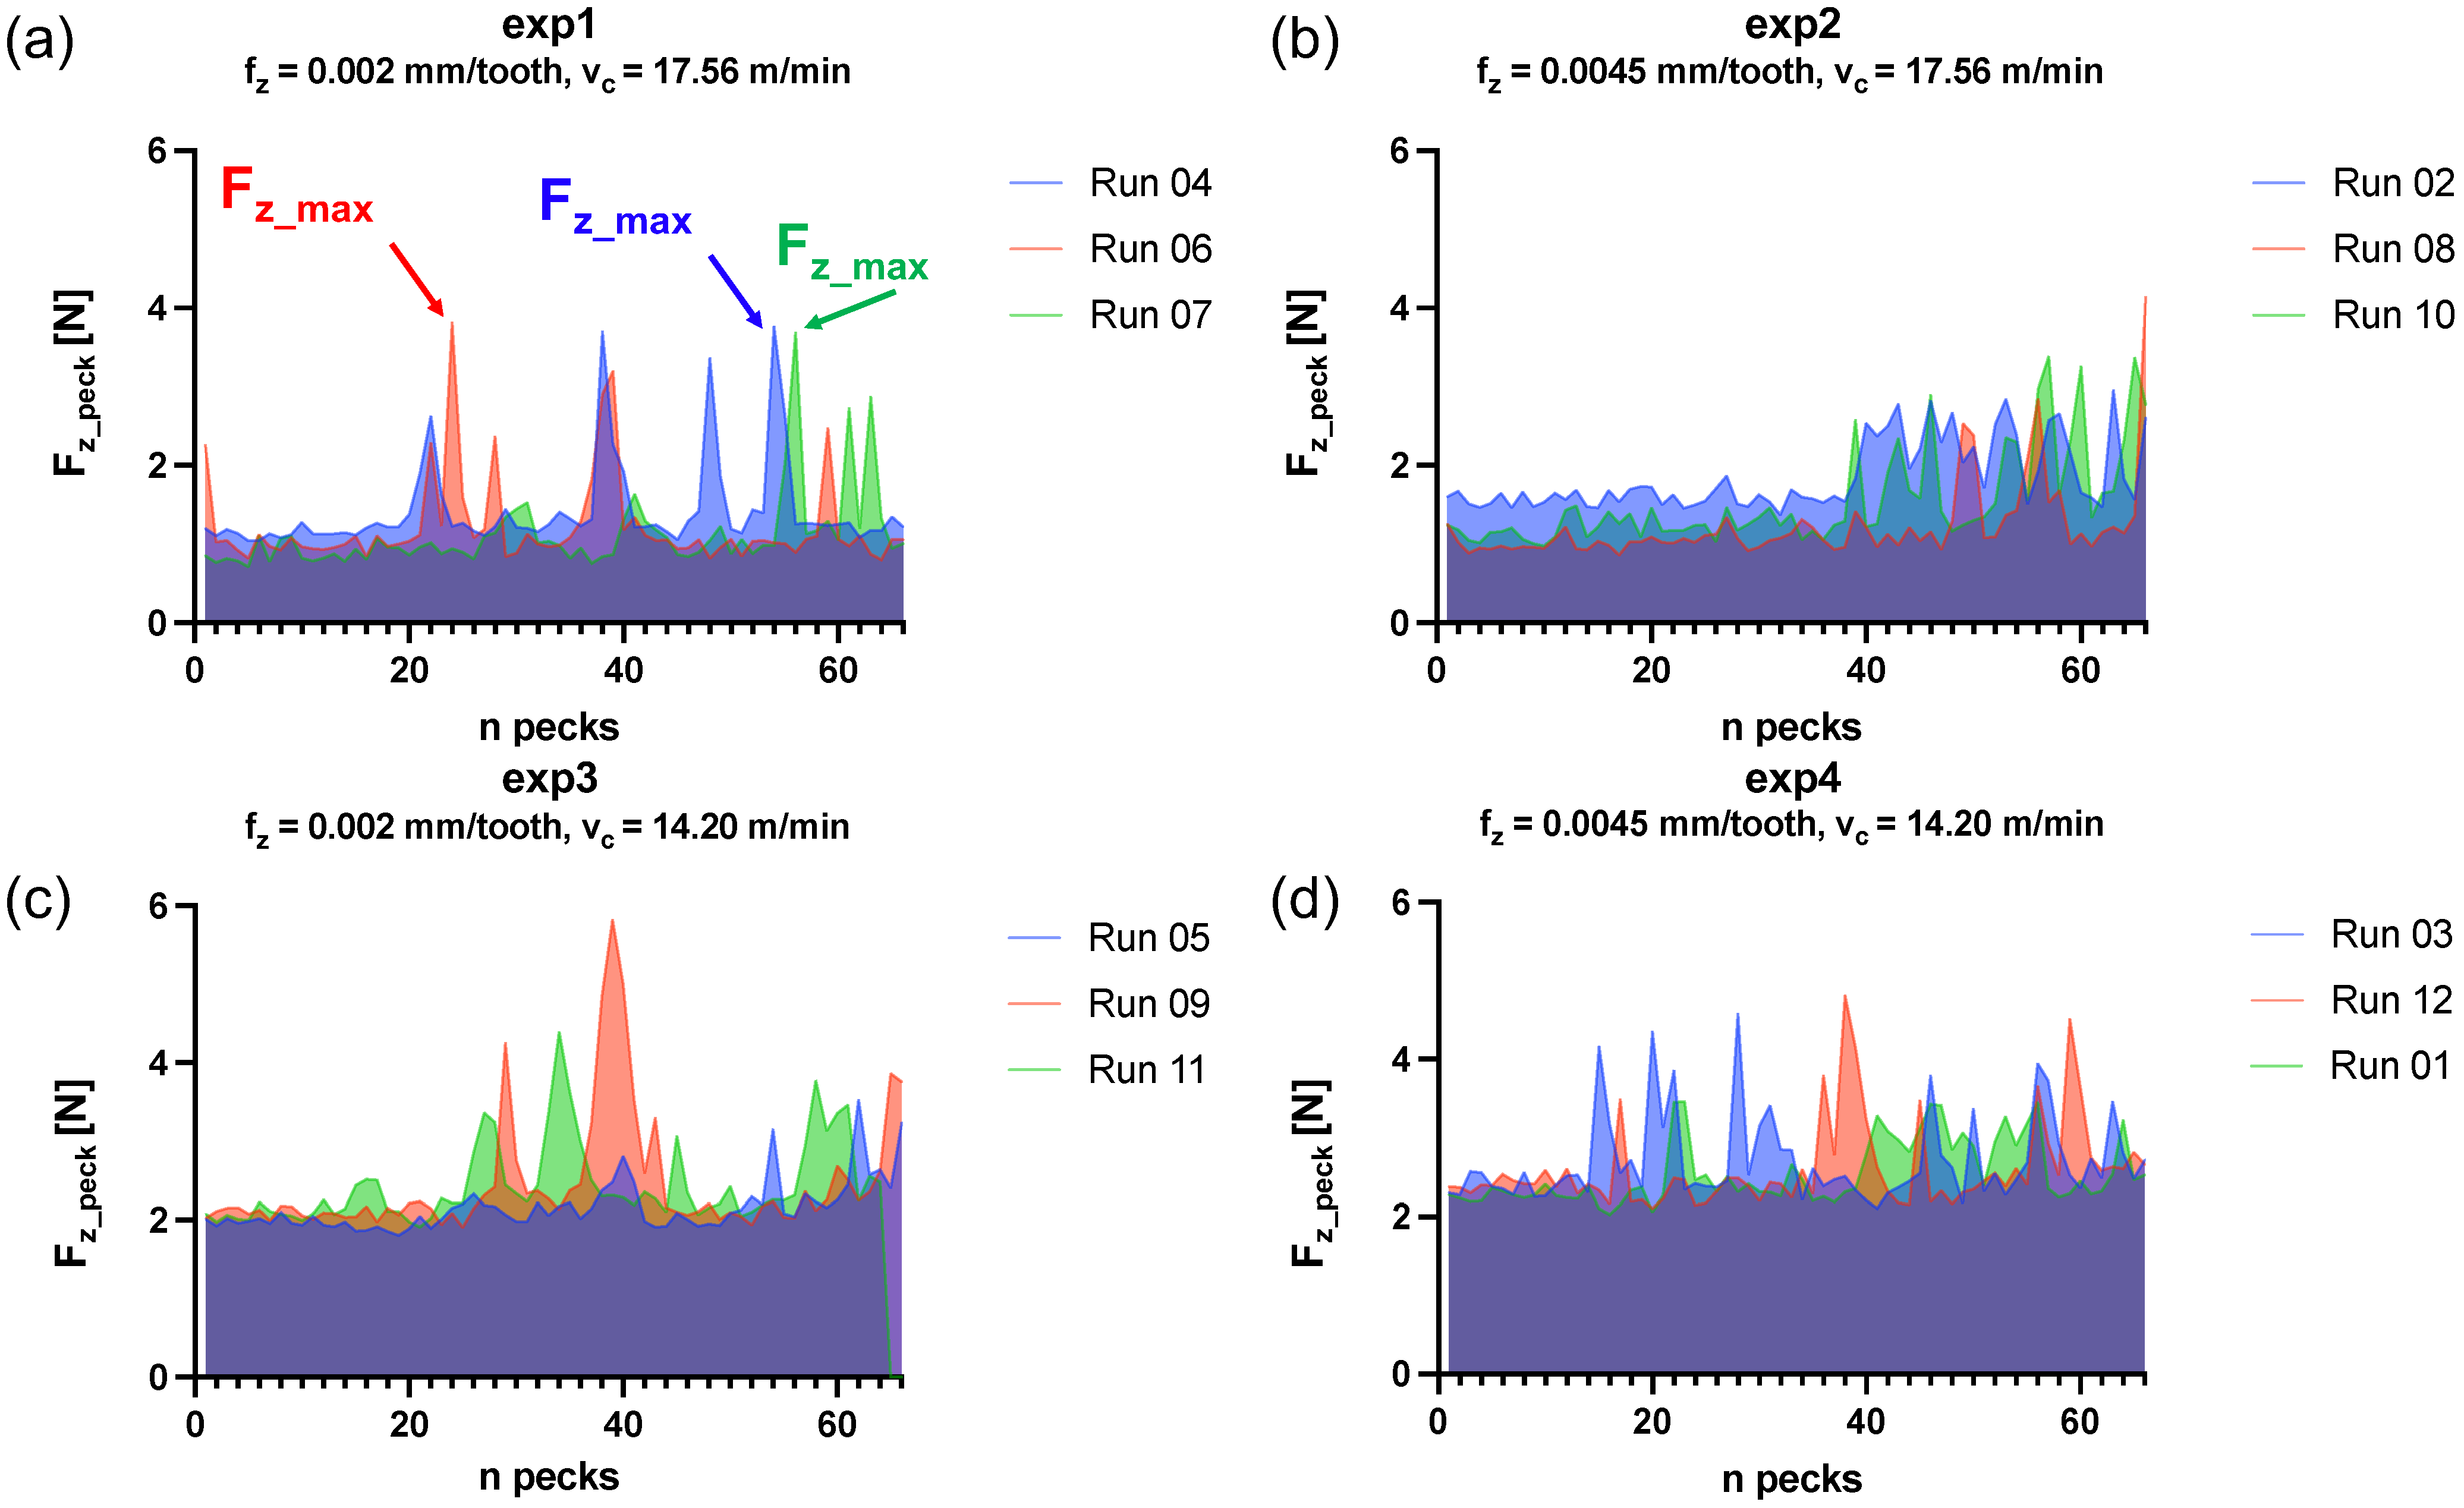
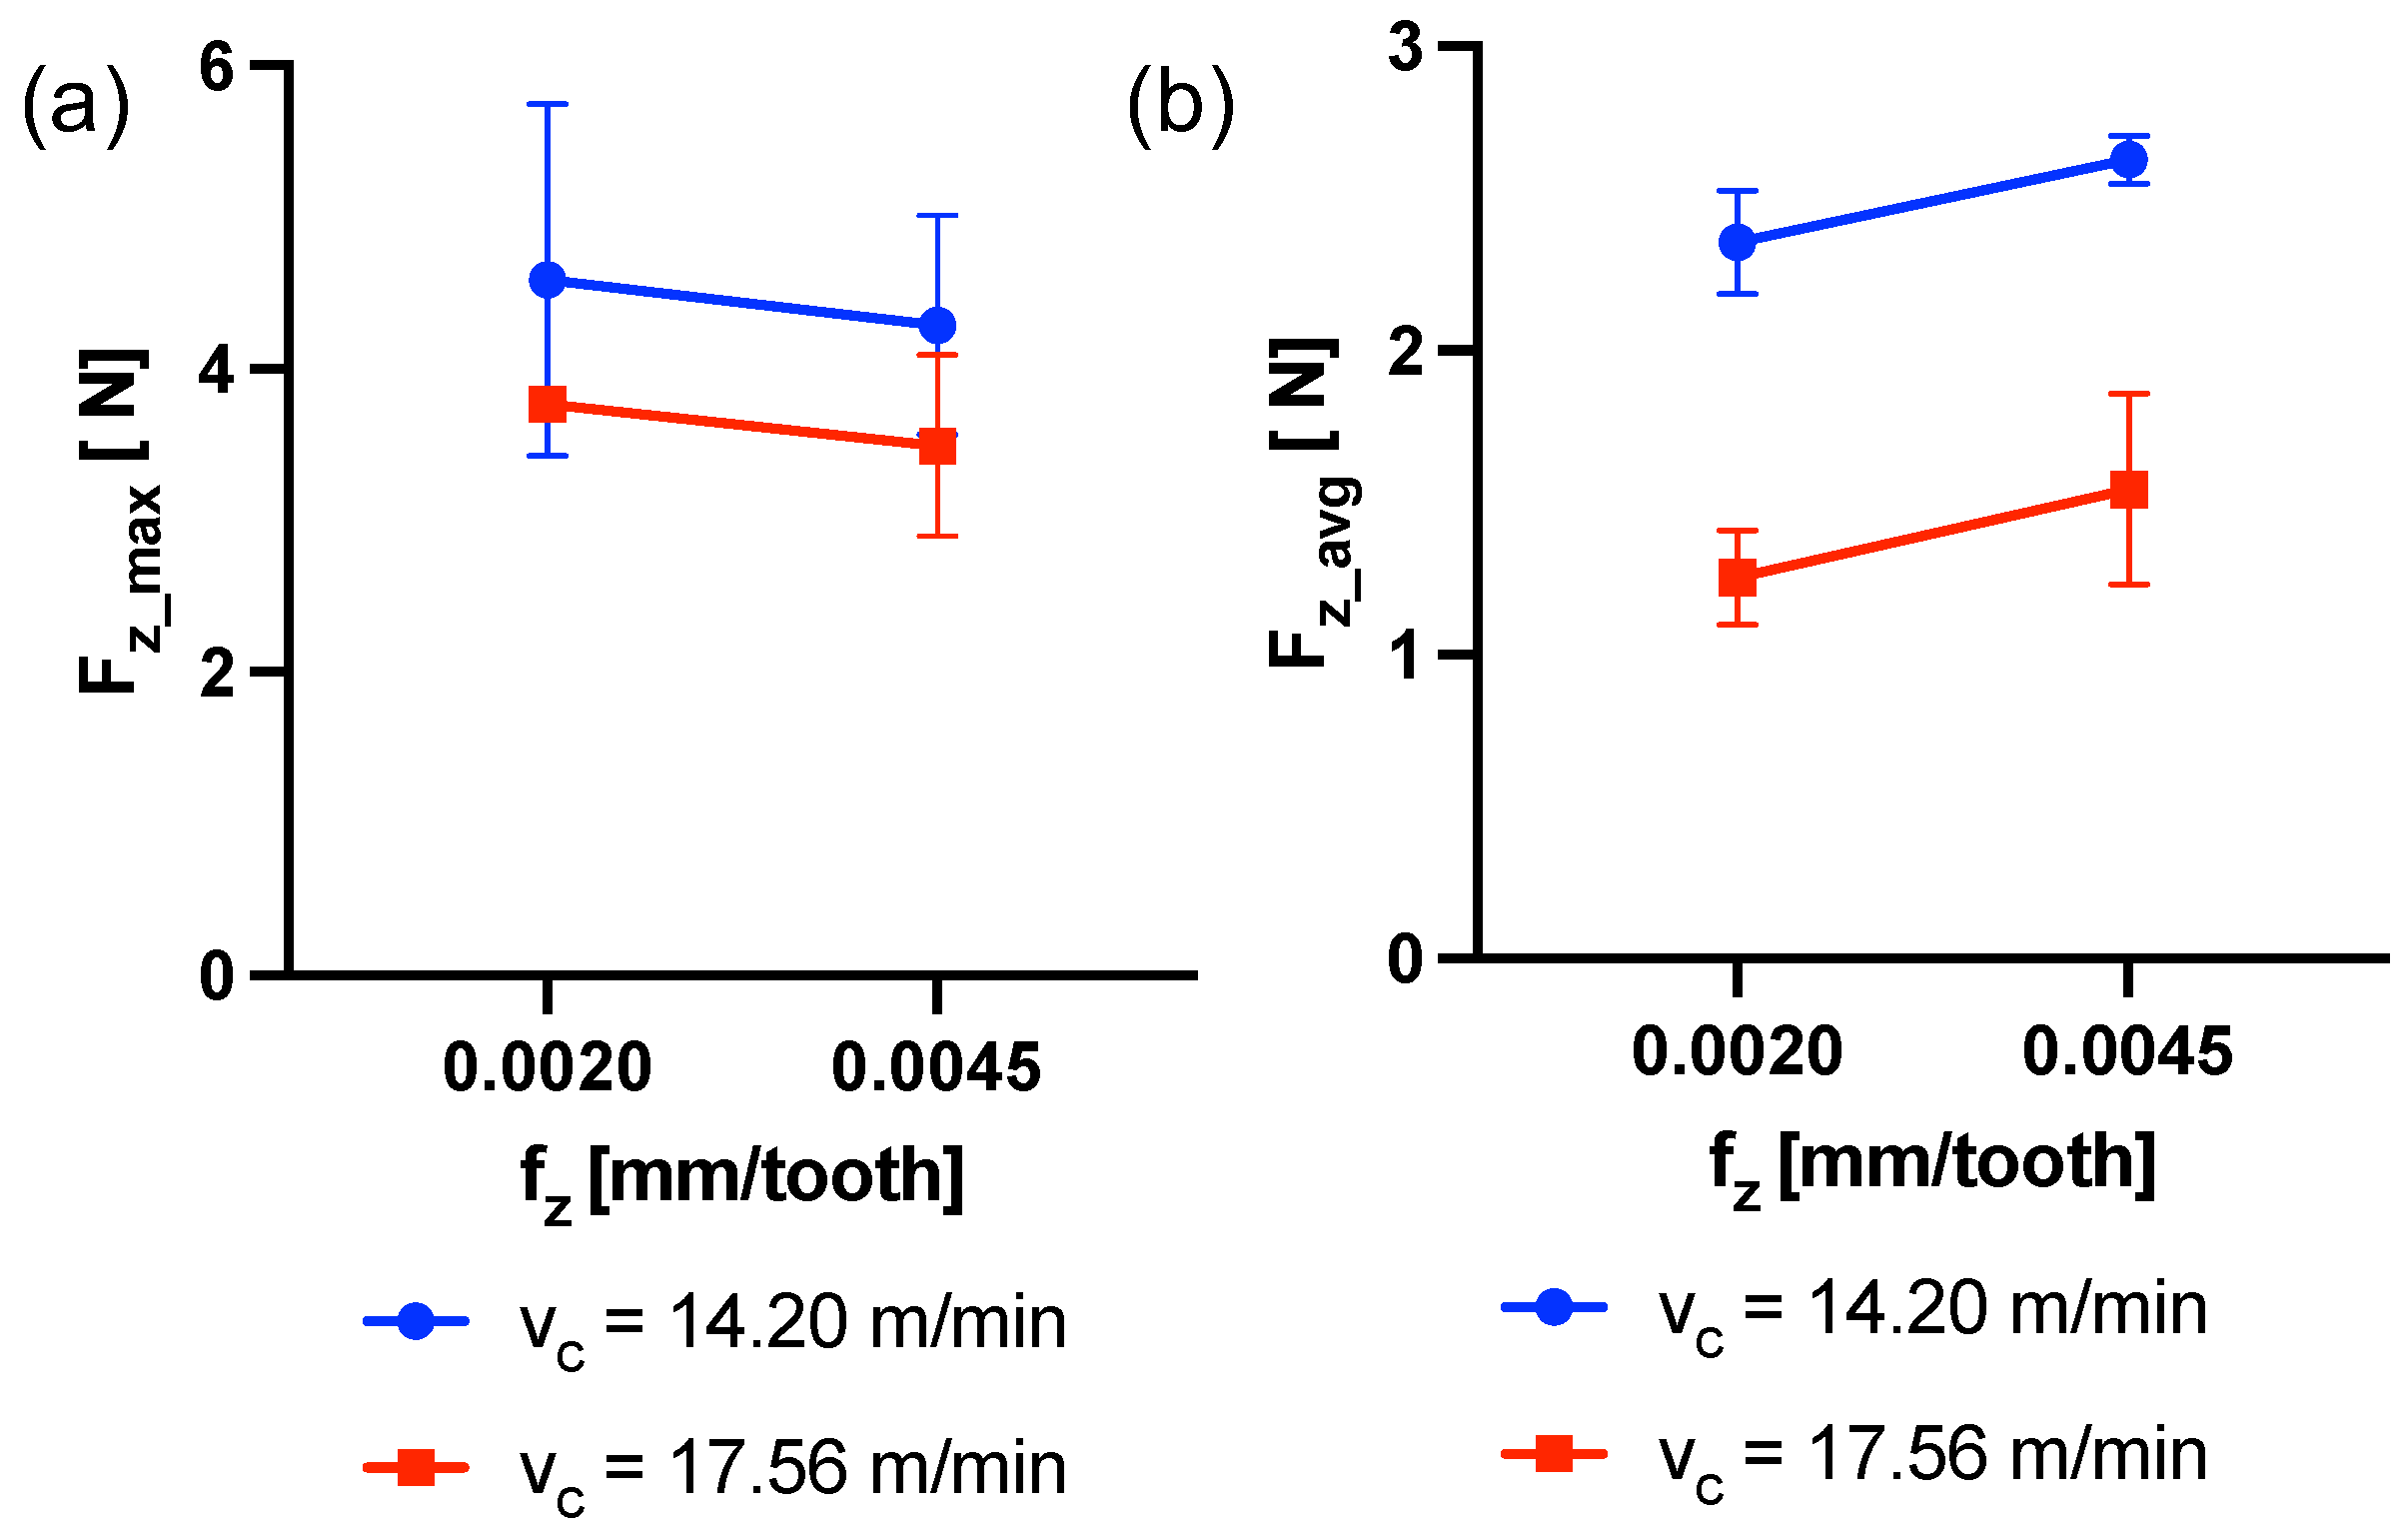
3.1. Cutting Forces
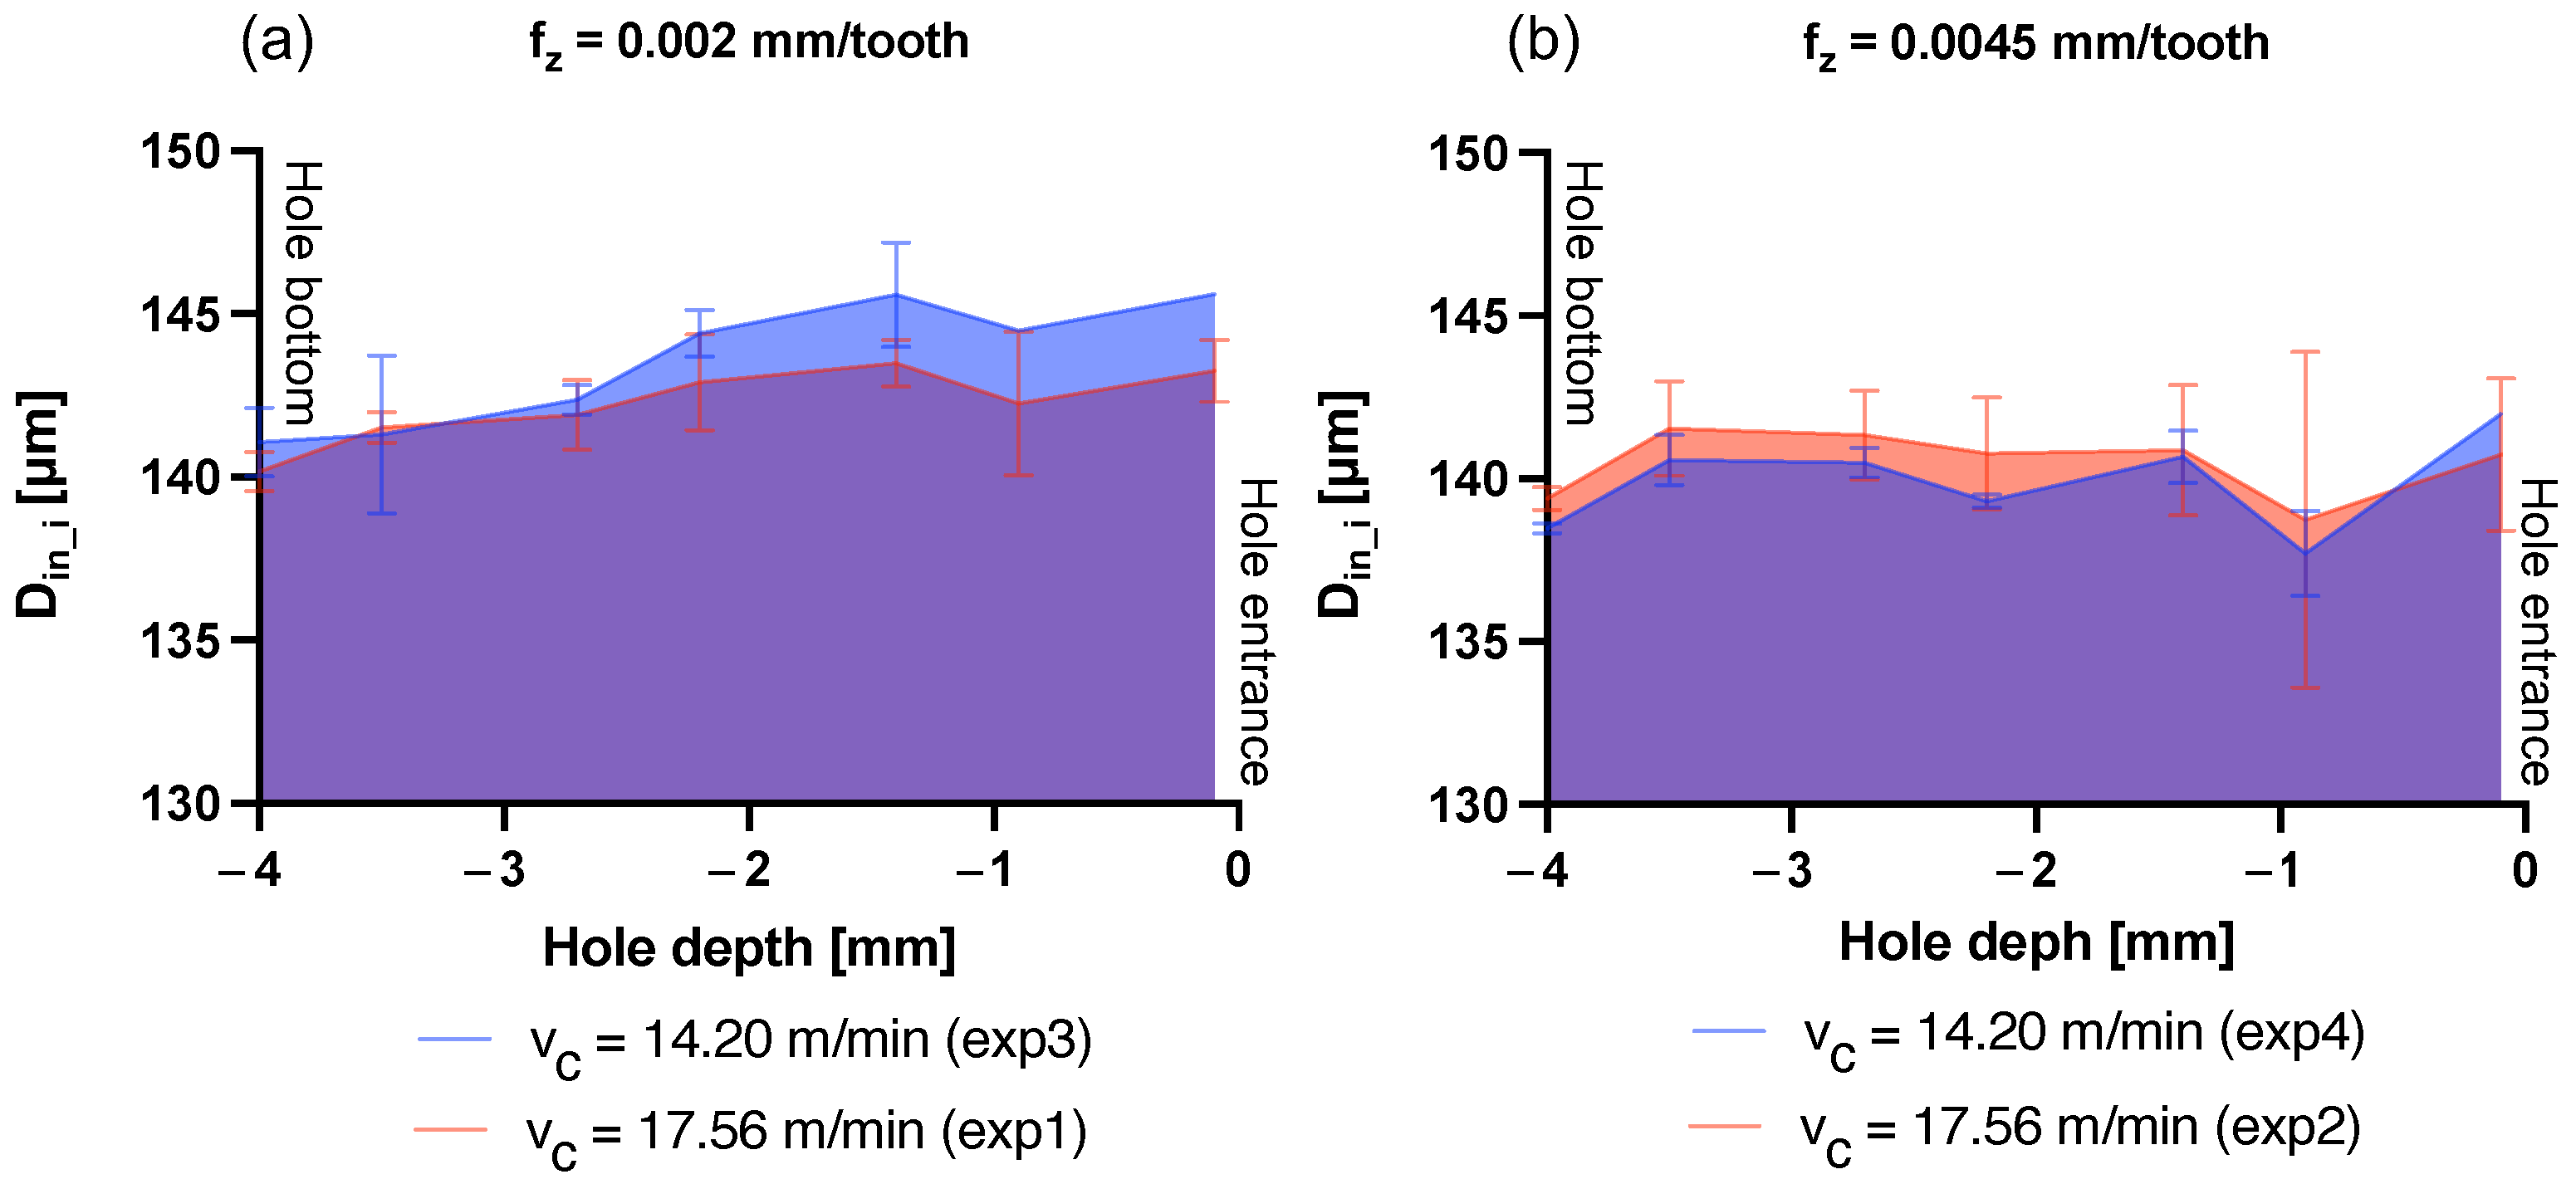
3.2. Holes Quality Results
4. Discussion
5. Conclusions
- The effect of cutting parameters on thrust force were analyzed. The lowest values of thrust force were obtained for the highest level of cutting speed and the lowest level of feed per tooth.
- The hole with the best quality features is machined with the highest level of feed per tooth. Indeed, for this value, the lowest burr height and the most cylindrical shape of the hole were obtained. On the other hand, the interaction between and could affect the outputs in terms of hole quality.
- The hole entrance is the most affected region by the peck drilling strategy: the final effect on burr height and hole diameter comes from the sum of each tool pass between feed and retraction repeated several times. Moreover, a longer tool dwell time inside the hole results in increased defects.
- Hole maximum geometrical performance ensured by highest values of feed per tooth are however associated with the highest thrust forces and this is detrimental for the tool life. To balance this effect, cutting speed can be increased to induce material thermal softening and reduce the thrust force. Specifically, the best hole quality can be obtained with = 0.0045 mm/tooth, since this value results in short burrs and better cylindricity of the hole. Under this condition, it is advisable to use a high cutting speed of 17.56 m/min. Indeed, this condition lowers the thrust force values, providing lower drill bit loading, and thus more longevity.
Author Contributions
Funding
Data Availability Statement
Acknowledgments
Conflicts of Interest
Nomenclature
| Tool point angle | [deg] | |
| Helix angle | [deg] | |
| Chisel edge angle | [deg] | |
| Hole entrance diameter | [µm] | |
| Inner hole diameter | [µm] | |
| Nominal hole diameter | [µm] | |
| Sample diameter | [mm] | |
| Tool diameter | [mm] | |
| Average grain size | [µm] | |
| Cutoff frequency for high-pass filter | [Hz] | |
| Cutoff frequency for low-pass filter | [Hz] | |
| Cutting force in x direction | [N] | |
| Cutting force in y direction | [N] | |
| Cutting force in z direction | [N] | |
| Average cutting force in z direction | [N] | |
| Maximum cutting force in z direction | [N] | |
| Maximum cutting force for each peck in z direction | [N] | |
| Feed per tooth | [mm/tooth] | |
| Average burr height | [µm] | |
| Burr height on the left of the burr profile | [µm] | |
| Burr height on the right of the burr profile | [µm] | |
| Flute length | [mm] | |
| Tool usable length | [mm] | |
| n | Rotational speed | [rpm] |
| Blind hole depth | [mm] | |
| Peck depth | [mm] | |
| Radius of the tool cutting edge | [µm] | |
| th | Sample thickness | [mm] |
| Cutting speed | [m/min] | |
| Feed rate | [mm/min] | |
| Z | Number of tool teeth | [-] |
References
- Biermann, D.; Bleicher, F.; Heisel, U.; Klocke, F.; Möhring, H.C.; Shih, A. Deep hole drilling. CIRP Ann. 2018, 67, 673–694. [Google Scholar] [CrossRef]
- Bharani Chandar, J.; Nagarajan, L.; Siva Kumar, M. Recent research progress in deep hole drilling process: A review. Surf. Rev. Lett. 2021, 28, 33. [Google Scholar] [CrossRef]
- Niketh, S.; Samuel, G.L. Surface textured drill tools-an effective approach for minimizing chip evacuation force and burr formation during high aspect ratio machining of titanium alloy. J. Manuf. Sci. Eng. Trans. ASME 2021, 143, 1–20. [Google Scholar] [CrossRef]
- Biermann, D.; Kirschner, M.; Eberhardt, D. A novel method for chip formation analyses in deep hole drilling with small diameters. Prod. Eng. 2014, 8, 491–497. [Google Scholar] [CrossRef]
- Lee, Y.J.; Wang, H. Current understanding of surface effects in microcutting. Mater. Des. 2020, 192, 108688. [Google Scholar] [CrossRef]
- Ravisubramanian, S.; Shunmugam, M.S. Investigations into peck drilling process for large aspect ratio microholes in aluminum 6061-T6. Mater. Manuf. Process. 2018, 33, 935–942. [Google Scholar] [CrossRef]
- Sambhav, K.; Tandon, P.; Kapoor, S.G.; Dhande, S.G. Mathematical modeling of cutting forces in microdrilling. J. Manuf. Sci. Eng. 2013, 135, 1–8. [Google Scholar] [CrossRef]
- Wosniak, F.A.; Polli, M.L.; de Camargo Beltrão, P.A. Study on tool wear and chip shapes in deep drilling OF AISI 4150 steel. J. Braz. Soc. Mech. Sci. Eng. 2016, 38, 473–480. [Google Scholar] [CrossRef]
- Baruffi, F.; Parenti, P.; Cacciatore, F.; Annoni, M.; Tosello, G. On the application of replica molding technology for the indirect measurement of surface and geometry of micromilled components. Micromachines 2017, 8, 195. [Google Scholar] [CrossRef]
- Masuzawa, T.; Hamasaki, Y.; Fujino, M. Vibroscanning Method for Nondestructive Measurement of Small Holes. CIRP Ann. Manuf. Technol. 1993, 42, 589–592. [Google Scholar] [CrossRef]
- Yamamoto, M.; Kanno, I.; Aoki, S. Profile measurement of high aspect ratio micro structures using a tungsten carbide micro cantilever coated with PZT thin films. In Proceedings of the IEEE Thirteenth Annual International Conference on Micro Electro Mechanical Systems (Cat. No.00CH36308), Miyazaki, Japan, 23–27 January 2000; pp. 217–222. [Google Scholar] [CrossRef]
- Diver, C.; Atkinson, J.; Helml, H.J.; Li, L. Micro-EDM drilling of tapered holes for industrial applications. J. Mater. Process. Technol. 2004, 149, 296–303. [Google Scholar] [CrossRef]
- Fu, L.; Ling, S.F.; Tseng, C.H. On-line breakage monitoring of small drills with input impedance of driving motor. Mech. Syst. Signal Process. 2007, 21, 457–465. [Google Scholar] [CrossRef]
- Yuan, Y.; Jing, X.; Ehmann, K.F.; Cao, J.; Li, H.; Zhang, D. Modeling of cutting forces in micro end-milling. J. Manuf. Process. 2018, 31, 844–858. [Google Scholar] [CrossRef]
- Geier, N.; Davim, J.P.; Szalay, T. Advanced cutting tools and technologies for drilling carbon fibre reinforced polymer (CFRP) composites: A review. Compos. Part A Appl. Sci. Manuf. 2019, 125, 105552. [Google Scholar] [CrossRef]
- Balázs, B.Z.; Geier, N.; Takács, M.; Davim, J.P. A review on micro-milling: Recent advances and future trends. Int. J. Adv. Manuf. Technol. 2021, 112, 655–684. [Google Scholar] [CrossRef]
- Dornfeld, D.; Min, S.; Takeuchi, Y. Recent advances in mechanical micromachining. CIRP Ann. Manuf. Technol. 2006, 55, 745–768. [Google Scholar] [CrossRef]
- Ravisubramanian, S.; Shunmugam, M.S. On reliable measurement of micro drilling forces and identification of different phases. Meas. J. Int. Meas. Confed. 2015, 73, 335–340. [Google Scholar] [CrossRef]
- Azim, S.; Gangopadhyay, S.; Mahapatra, S.S.; Mittal, R.K.; Singh, A.; Singh, R.K. Study of cutting forces and surface integrity in micro drilling of a Ni-based superalloy. J. Manuf. Process. 2019, 45, 368–378. [Google Scholar] [CrossRef]
- Kim, D.W.; Lee, Y.S.; Park, M.S.; Chu, C.N. Tool life improvement by peck drilling and thrust force monitoring during deep-micro-hole drilling of steel. Int. J. Mach. Tools Manuf. 2009, 49, 246–255. [Google Scholar] [CrossRef]
- Anand, R.S.; Patra, K. Cutting force and hole quality analysis in micro-drilling of CFRP. Mater. Manuf. Process. 2018, 33, 1369–1377. [Google Scholar] [CrossRef]
- Li, N.; Zheng, Y. Novel Magnesium Alloys Developed for Biomedical Application: A Review. J. Mater. Sci. Technol. 2013, 29, 489–502. [Google Scholar] [CrossRef]
- Li, X.J.; Xie, L.; Pan, F.S.; Wang, Y.; Liu, H.; Tang, Y.R.; Hutnik, C.M. A feasibility study of using biodegradable magnesium alloy in glaucoma drainage device. Int. J. Ophthalmol. 2018, 11, 135–142. [Google Scholar] [CrossRef] [PubMed]
- Ramalingam, V.V.; Ramasamy, P.; Kovukkal, M.D.; Myilsamy, G. Research and Development in Magnesium Alloys for Industrial and Biomedical Applications: A Review. Met. Mater. Int. 2020, 26, 409–430. [Google Scholar] [CrossRef]
- Sezer, N.; Evis, Z.; Kayhan, S.M.; Tahmasebifar, A.; Koç, M. Review of magnesium-based biomaterials and their applications. J. Magnes. Alloy. 2018, 6, 23–43. [Google Scholar] [CrossRef]
- Sun, F.; Huo, D.; Fu, G.; Teng, X.; Kannan, S.; Zhang, H. Micro-drilling of Mg-based MMCs reinforced with SiO2 nanoparticles: An experimental approach. Proc. Inst. Mech. Eng. Part B J. Eng. Manuf. 2020, 234, 1473–1485. [Google Scholar] [CrossRef]
- Pizzi, M.; De Gaetano, F.; Ferroni, M.; Boschetti, F.; Annoni, M. A Deep-Hole Microdrilling Study of Pure Magnesium for Biomedical Applications. Micromachines 2023, 14, 132. [Google Scholar] [CrossRef] [PubMed]
- De Oliveira, F.B.; Rodrigues, A.R.; Coelho, R.T.; De Souza, A.F. Size effect and minimum chip thickness in micromilling. Int. J. Mach. Tools Manuf. 2015, 89, 39–54. [Google Scholar] [CrossRef]
- Kishawy, H.A.; Kannan, S.; Parker, G. Traditional Machining Processes of MMC; Springer: Berlin/Heidelberg, Germany, 2012; pp. 79–98. [Google Scholar] [CrossRef]
- Bhowmick, S.; Alpas, A.T. The role of diamond-like carbon coated drills on minimum quantity lubrication drilling of magnesium alloys. Surf. Coatings Technol. 2011, 205, 5302–5311. [Google Scholar] [CrossRef]
- Zabel, A.; Heilmann, M. Deep hole drilling using tools with small diameters—Process analysis and process design. CIRP Ann. Manuf. Technol. 2012, 61, 111–114. [Google Scholar] [CrossRef]
- Liang, Z.; Ma, Y.; Zhang, S.; Wang, X.; Chen, J.; Jiang, L.; Sun, X.; Li, Y. Novel micro-deep-hole drill with variable web thickness and flute width. Precis. Eng. 2021, 72, 340–355. [Google Scholar] [CrossRef]
- Lee, C.T.; Mujumdar, S.S.; Kapoor, S.G. Experimental investigation of bubble-mixed cutting fluid delivery for micro deep-hole drilling. J. Micro Nano-Manuf. 2019, 7, 4–8. [Google Scholar] [CrossRef]
- Voss, D.; Dean, A.; Draguljic, D. Design and Analysis of Experiments Springer Texts in Statistics; Springer: Berlin/Heidelberg, Germany, 2017; p. 852. [Google Scholar] [CrossRef]
- Braun, S. WINDOWS. In Encyclopedia of Vibration; Braun, S., Ed.; Elsevier: Oxford, UK, 2001; pp. 1587–1595. [Google Scholar] [CrossRef]
- BS EN ISO 8785:1999; Geometrical Product Specification (GPS)—Surface imperfections—Terms, Definitions and Parameters. ISO: Geneva, Switzerland, 1999.
- Heinemann, R.; Hinduja, S.; Barrow, G.; Petuelli, G. The performance of small diameter twist drills in deep-hole drilling. J. Manuf. Sci. Eng. 2006, 128, 884–892. [Google Scholar] [CrossRef]
- Khan, S.A.; Nazir, A.; Mughal, M.P.; Saleem, M.Q.; Hussain, A.; Ghulam, Z. Deep hole drilling of AISI 1045 via high-speed steel twist drills: Evaluation of tool wear and hole quality. Int. J. Adv. Manuf. Technol. 2017, 93, 1115–1125. [Google Scholar] [CrossRef]
- Lee, K.; Dornfeld, D.A. Micro-burr formation and minimization through process control. Precis. Eng. 2005, 29, 246–252. [Google Scholar] [CrossRef]
- Tsao, C.C.; Hocheng, H. Parametric study on thrust force of core drill. J. Mater. Process. Technol. 2007, 192–193, 37–40. [Google Scholar] [CrossRef]
- Kaynak, Y.; Perc, M. Micro-drilling of Ti-6Al-4V alloy: The effects of cooling/lubricating. Precis. Eng. 2016, 45, 450–462. [Google Scholar] [CrossRef]
- Kim, J.; Min, S.; Dornfeld, D.A. Optimization and control of drilling burr formation of AISI 304L and AISI 4118 based on drilling burr control charts. Int. J. Mach. Tools Manuf. 2001, 41, 923–936. [Google Scholar] [CrossRef]
- Aurich, J.C.; Dornfeld, D.; Arrazola, P.J.; Franke, V.; Leitz, L.; Min, S. Burrs-Analysis, control and removal. CIRP Ann. Manuf. Technol. 2009, 58, 519–542. [Google Scholar] [CrossRef]
- Jin, S.Y.; Pramanik, A.; Basak, A.K.; Prakash, C.; Shankar, S.; Debnath, S. Burr formation and its treatments—A review. Int. J. Adv. Manuf. Technol. 2020, 107, 2189–2210. [Google Scholar] [CrossRef]
- Hashimura, M.; Chang, Y.P.; Dornfeld, D. Analysis of burr formation mechanism in orthogonal cutting. J. Manuf. Sci. Eng. Trans. ASME 1999, 121, 1–7. [Google Scholar] [CrossRef]
- Gong, Y.; Ehmann, K.F.; Lin, C. Analysis of dynamic characteristics of micro-drills. J. Mater. Process. Technol. 2003, 141, 16–28. [Google Scholar] [CrossRef]
- Ferraris, E.; Castiglioni, V.; Ceyssens, F.; Annoni, M.; Lauwers, B.; Reynaerts, D. EDM drilling of ultra-high aspect ratio micro holes with insulated tools. CIRP Ann. Manuf. Technol. 2013, 62, 191–194. [Google Scholar] [CrossRef]


| Composition | Hardness | Density |
|---|---|---|
| Mg-2.1Nd-0.2Zn-0.2Zr | 52.6 HV (Load 300 g) | 1.73 g/cm3 |
| Tool ID | Function | [mm] | [mm] | [mm] | [] | [] | [] | re [m] | Coating |
|---|---|---|---|---|---|---|---|---|---|
| 342d0.14 | PILOT | 0.140 | 0.5 | 0.5 | 118 | 34 | 120 | - | None |
| Custom | DRILL | 0.138 | 1.1 | 5.5 | 120 | 24 | 130 | 2.599 | None |
| Tool | [mm] | [mm] | [mm] | [mm/tooth] | [m/min] | n [rpm] |
|---|---|---|---|---|---|---|
| PILOT | 0.140 | 0.10 | 0.4 | 0.0017 | 13 | 29,672 |
| DRILL | 0.138 | 0.07 | 5 | 0.002–0.0045 | 14.20–17.56 | 32,750–40,500 |
| Run Order | Experiment | [mm/tooth] | [m/min] |
|---|---|---|---|
| 4 | exp 1 | 0.0020 | 17.56 |
| 6 | exp 1 | 0.0020 | 17.56 |
| 7 | exp 1 | 0.0020 | 17.56 |
| 2 | exp 2 | 0.0045 | 17.56 |
| 8 | exp 2 | 0.0045 | 17.56 |
| 10 | exp 2 | 0.0045 | 17.56 |
| 5 | exp 3 | 0.0020 | 14.20 |
| 9 | exp 3 | 0.0020 | 14.20 |
| 11 | exp 3 | 0.0020 | 14.20 |
| 1 | exp 4 | 0.0045 | 14.20 |
| 3 | exp 4 | 0.0045 | 14.20 |
| 12 | exp 4 | 0.0045 | 14.20 |
| Parameter | Value | Outputs |
|---|---|---|
| [m/min] | 17.56 | Lower |
| [mm/tooth] | 0.0045 | Lower Hburr |
| Lower taper |
Disclaimer/Publisher’s Note: The statements, opinions and data contained in all publications are solely those of the individual author(s) and contributor(s) and not of MDPI and/or the editor(s). MDPI and/or the editor(s) disclaim responsibility for any injury to people or property resulting from any ideas, methods, instructions or products referred to in the content. |
© 2024 by the authors. Licensee MDPI, Basel, Switzerland. This article is an open access article distributed under the terms and conditions of the Creative Commons Attribution (CC BY) license (https://creativecommons.org/licenses/by/4.0/).
Share and Cite
Pizzi, M.; Costetti, A.; De Gaetano, F.; Ferroni, M.; Arleo, F.; Boschetti, F.; Annoni, M. A Cutting Force and Hole Geometry Study for Precision Deep-Hole Microdrilling of Magnesium. Micromachines 2024, 15, 814. https://doi.org/10.3390/mi15070814
Pizzi M, Costetti A, De Gaetano F, Ferroni M, Arleo F, Boschetti F, Annoni M. A Cutting Force and Hole Geometry Study for Precision Deep-Hole Microdrilling of Magnesium. Micromachines. 2024; 15(7):814. https://doi.org/10.3390/mi15070814
Chicago/Turabian StylePizzi, Margherita, Antonio Costetti, Francesco De Gaetano, Marco Ferroni, Francesco Arleo, Federica Boschetti, and Massimiliano Annoni. 2024. "A Cutting Force and Hole Geometry Study for Precision Deep-Hole Microdrilling of Magnesium" Micromachines 15, no. 7: 814. https://doi.org/10.3390/mi15070814
APA StylePizzi, M., Costetti, A., De Gaetano, F., Ferroni, M., Arleo, F., Boschetti, F., & Annoni, M. (2024). A Cutting Force and Hole Geometry Study for Precision Deep-Hole Microdrilling of Magnesium. Micromachines, 15(7), 814. https://doi.org/10.3390/mi15070814