
The Influence of Laser Remelting Parameters on the Surface Quality of Copper


Abstract
:1. Introduction
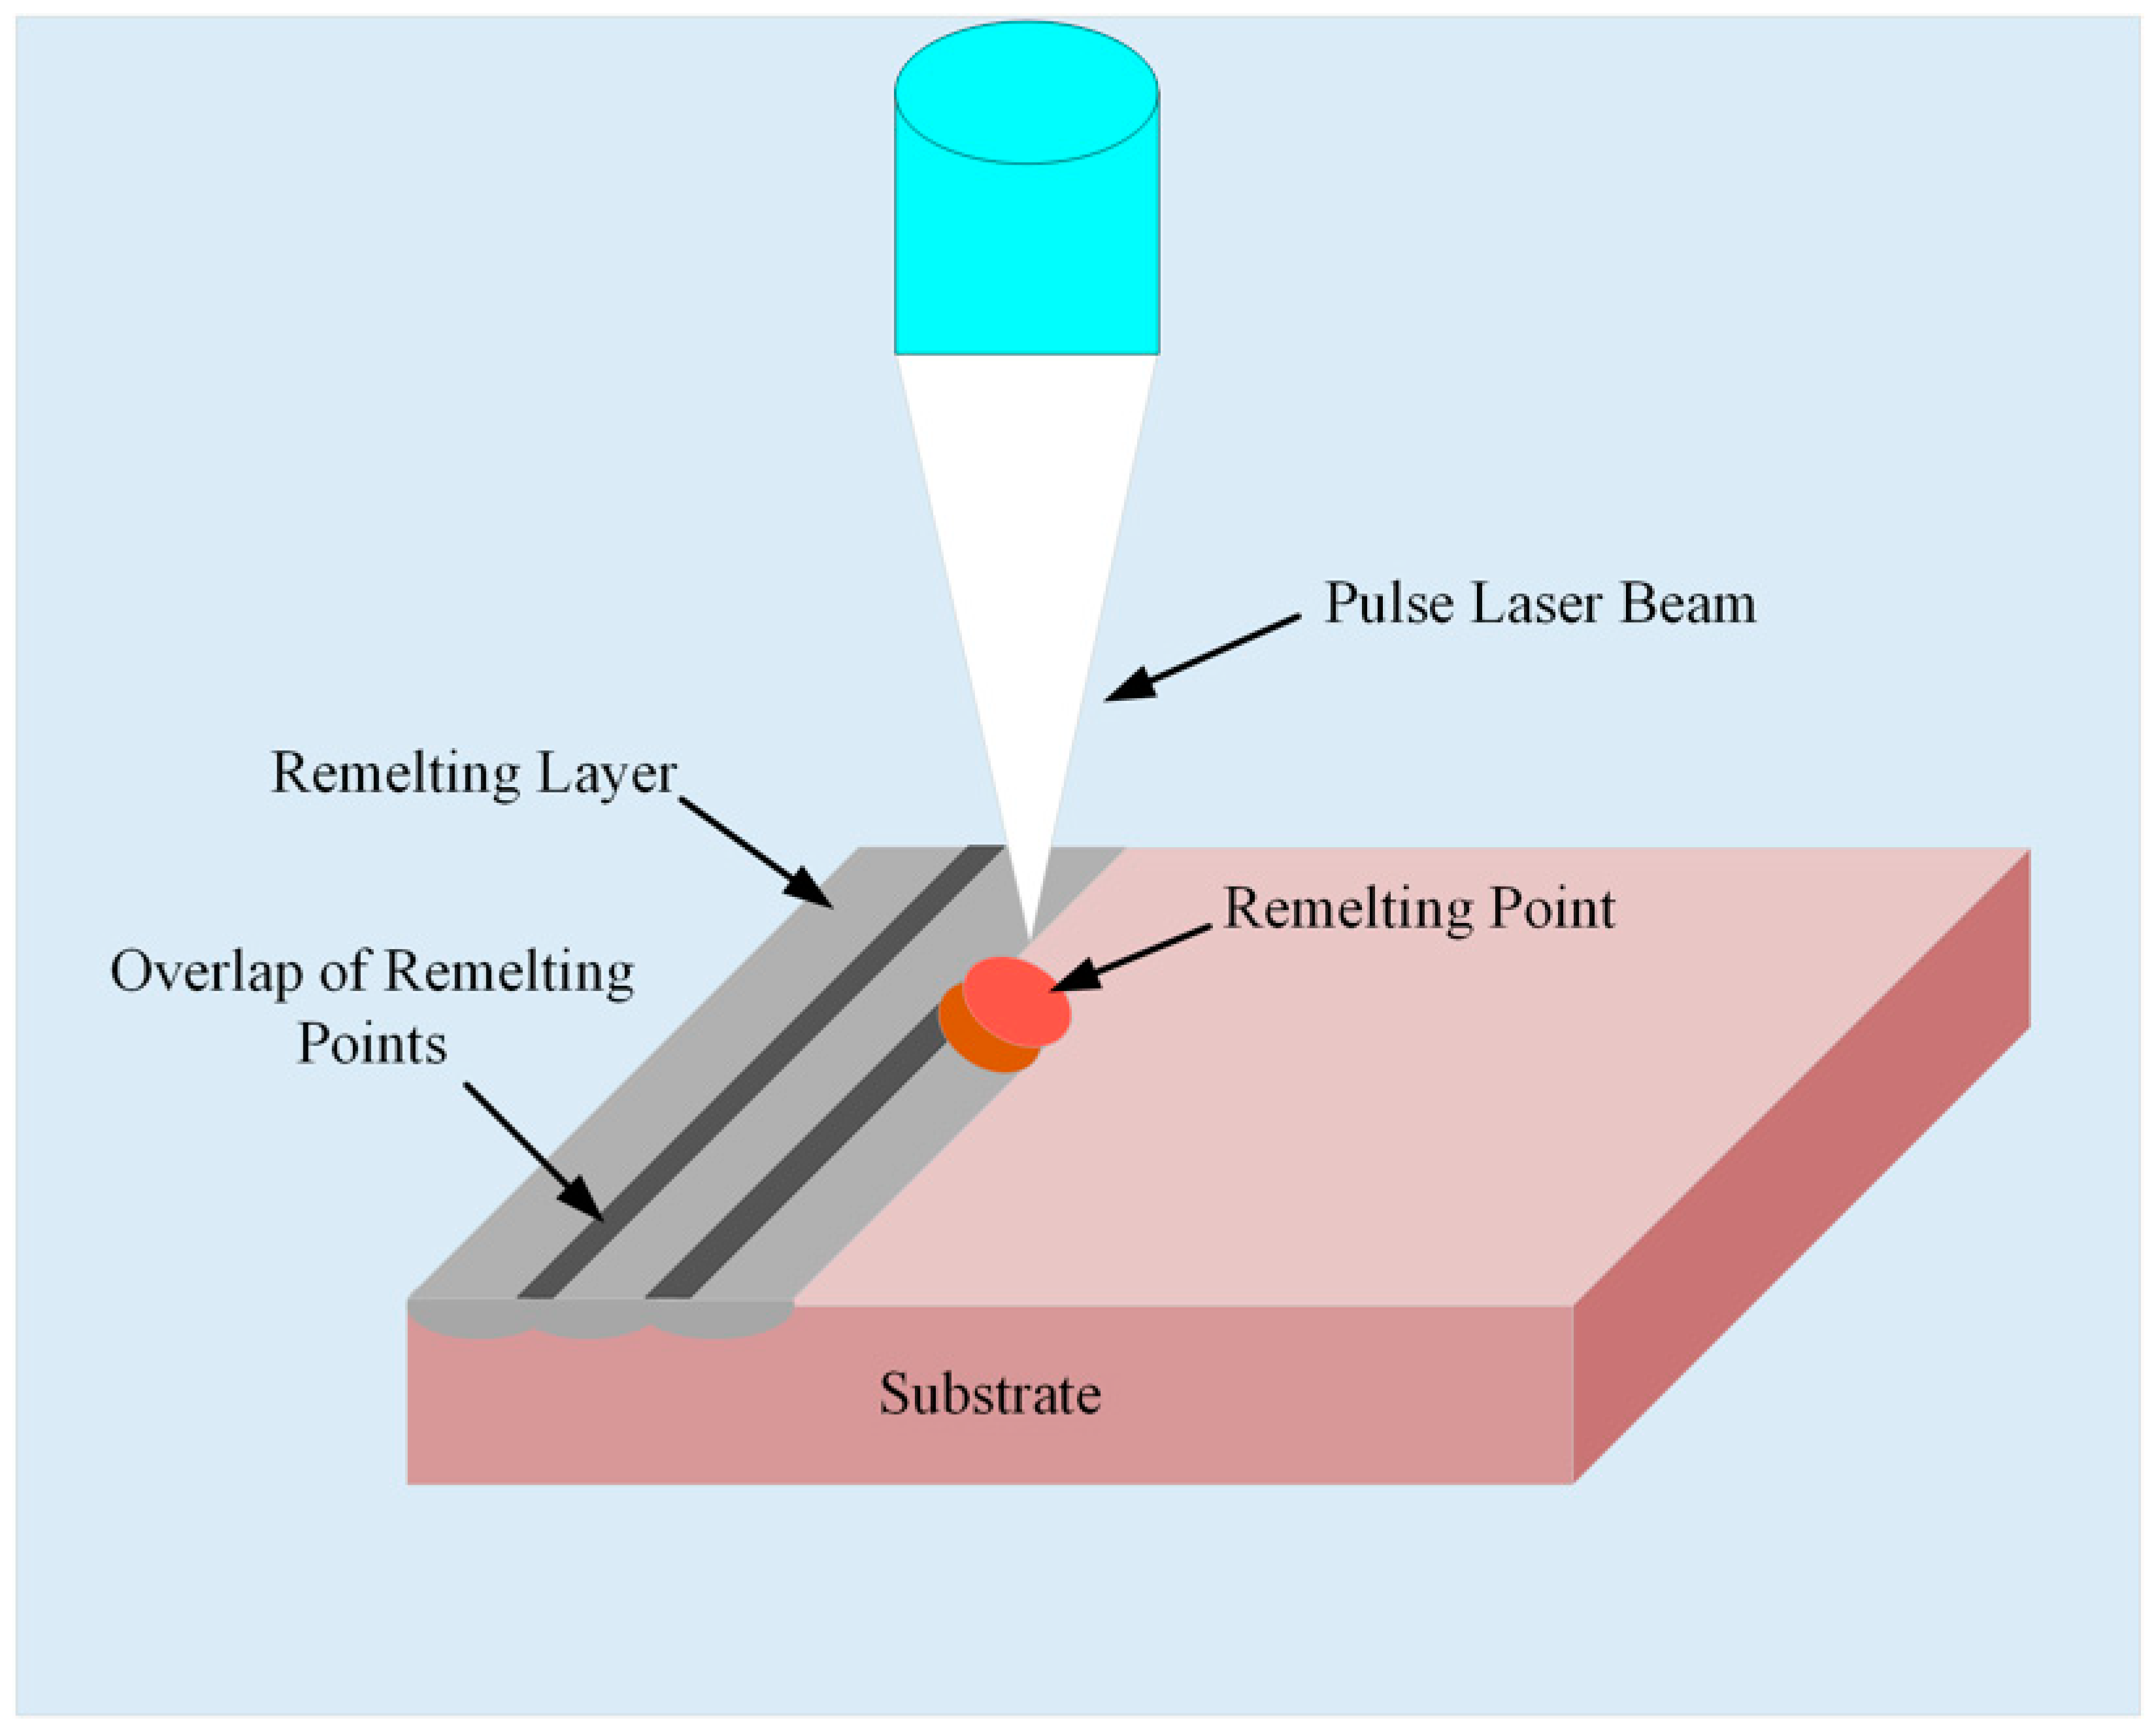
2. Experimental
2.1. Experimental Materials
2.2. Laser Equipment and Sample Characterization
3. Results and Discussion
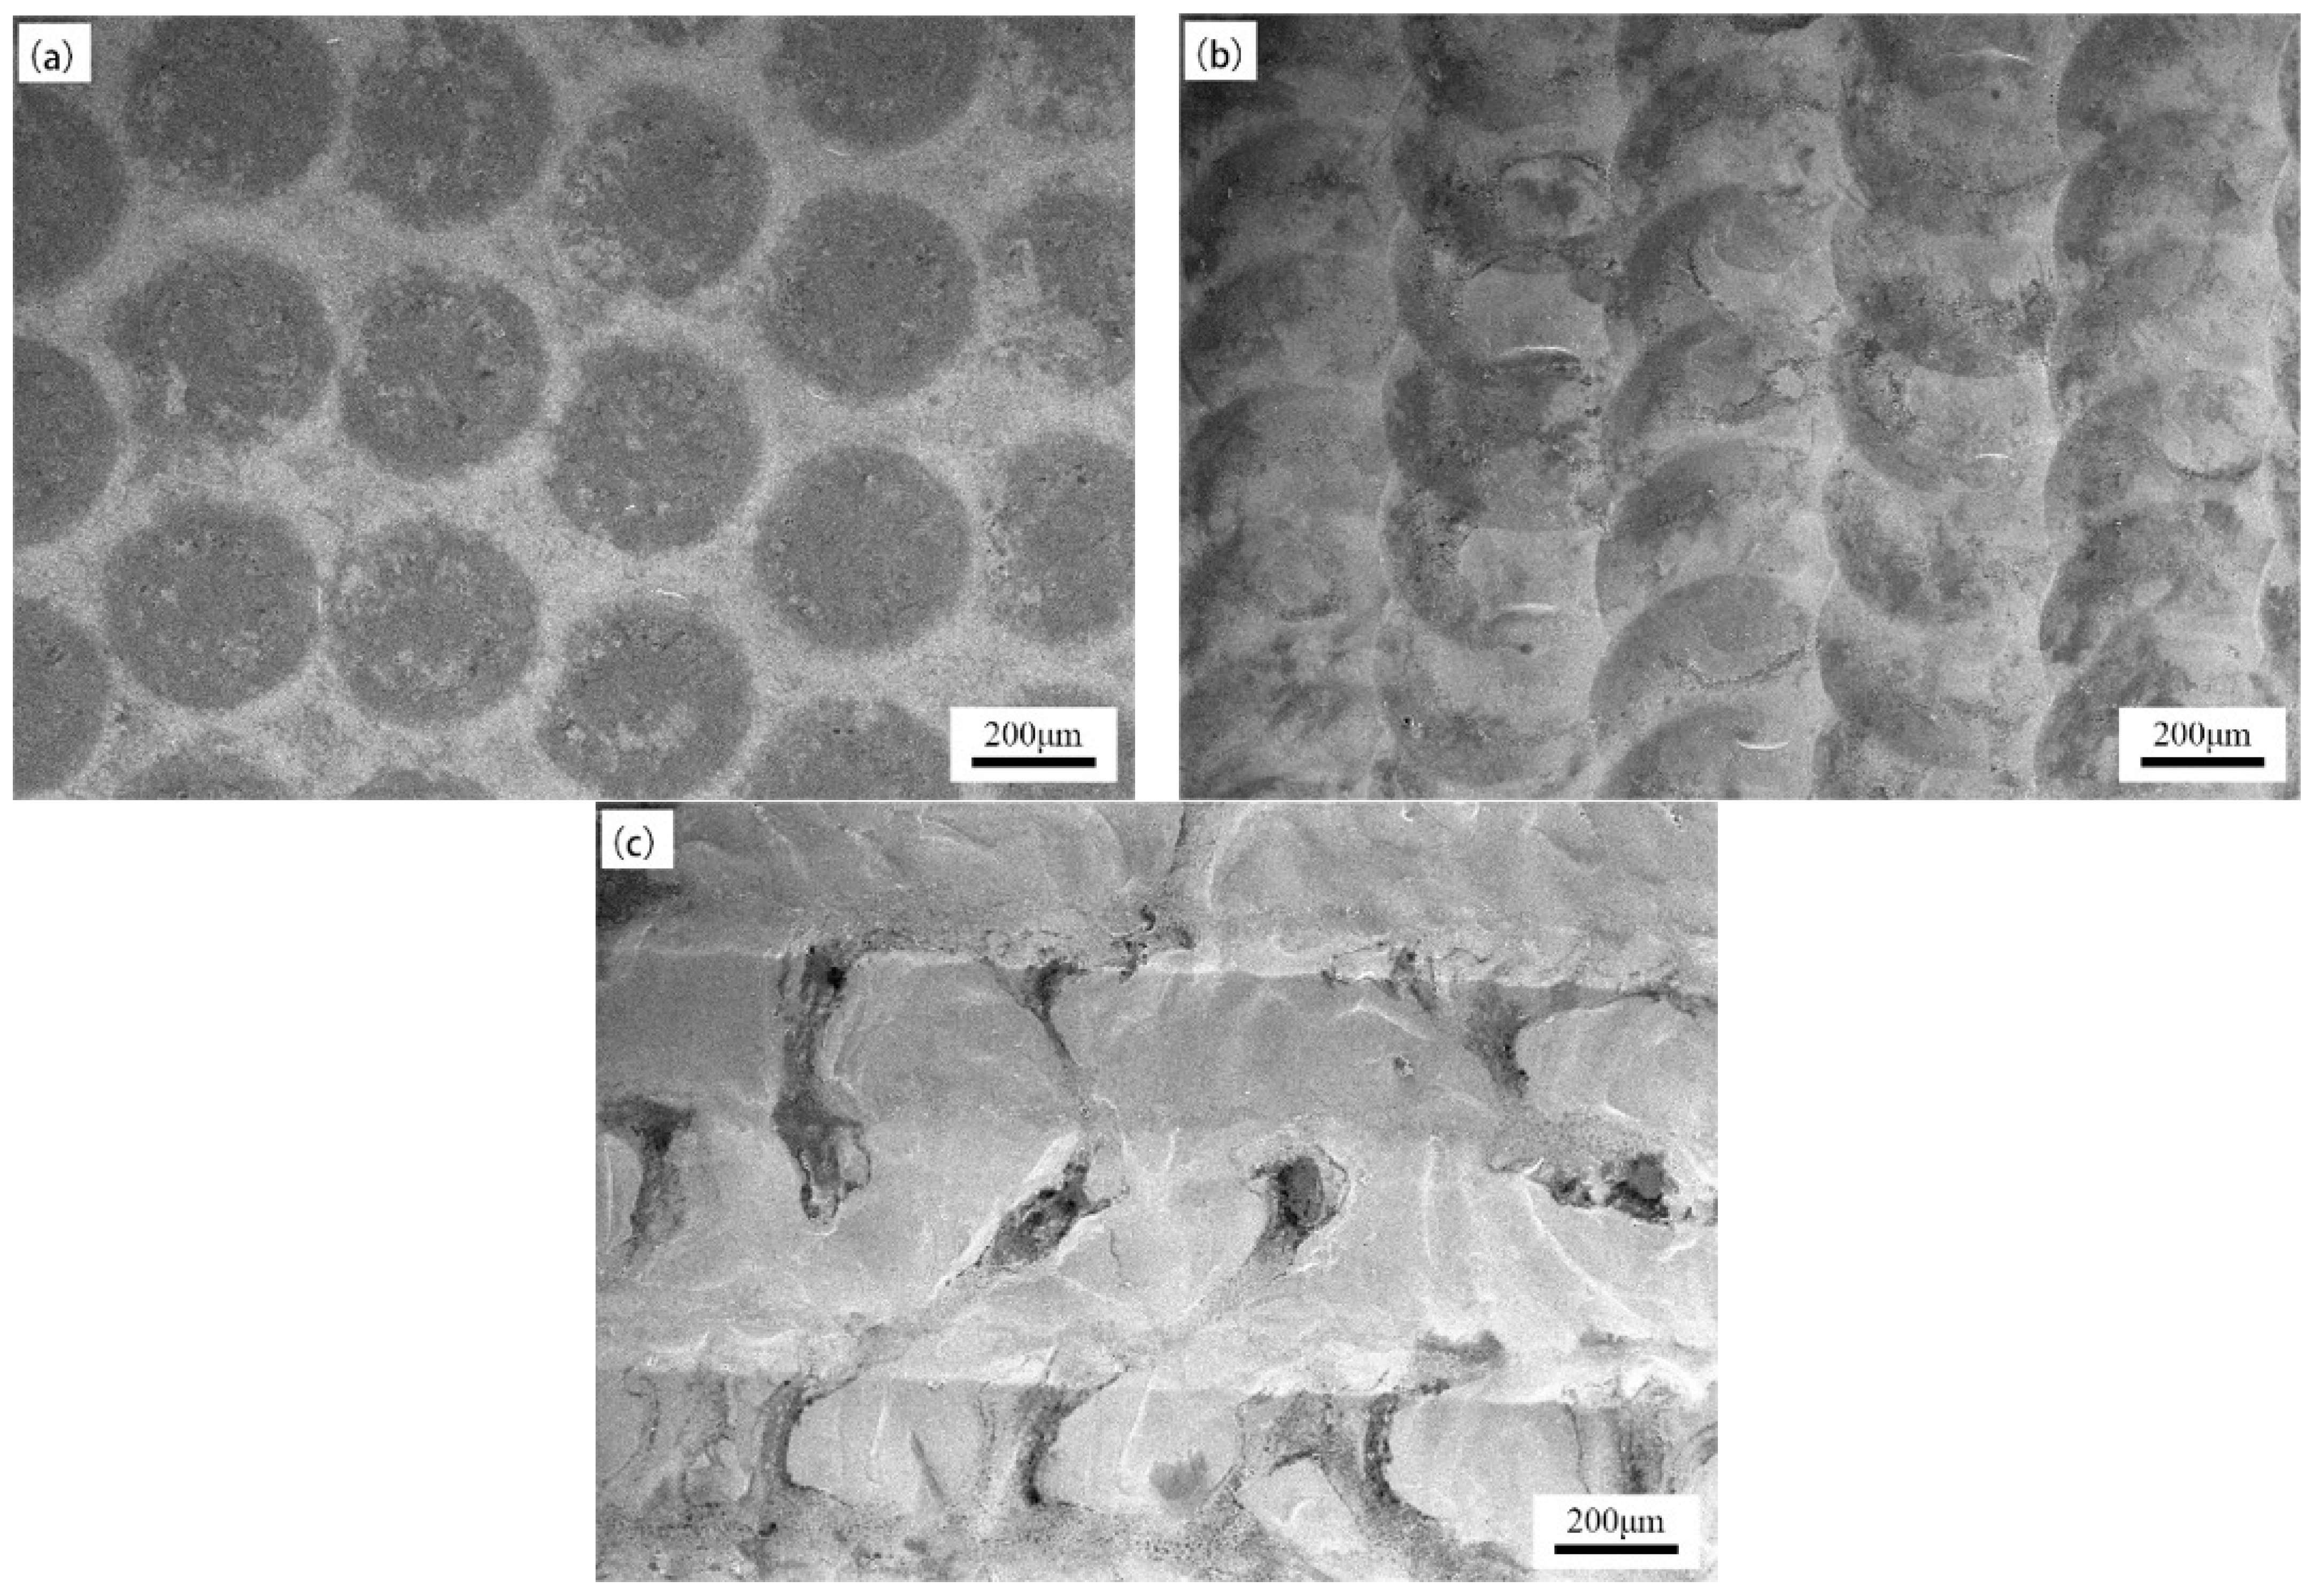
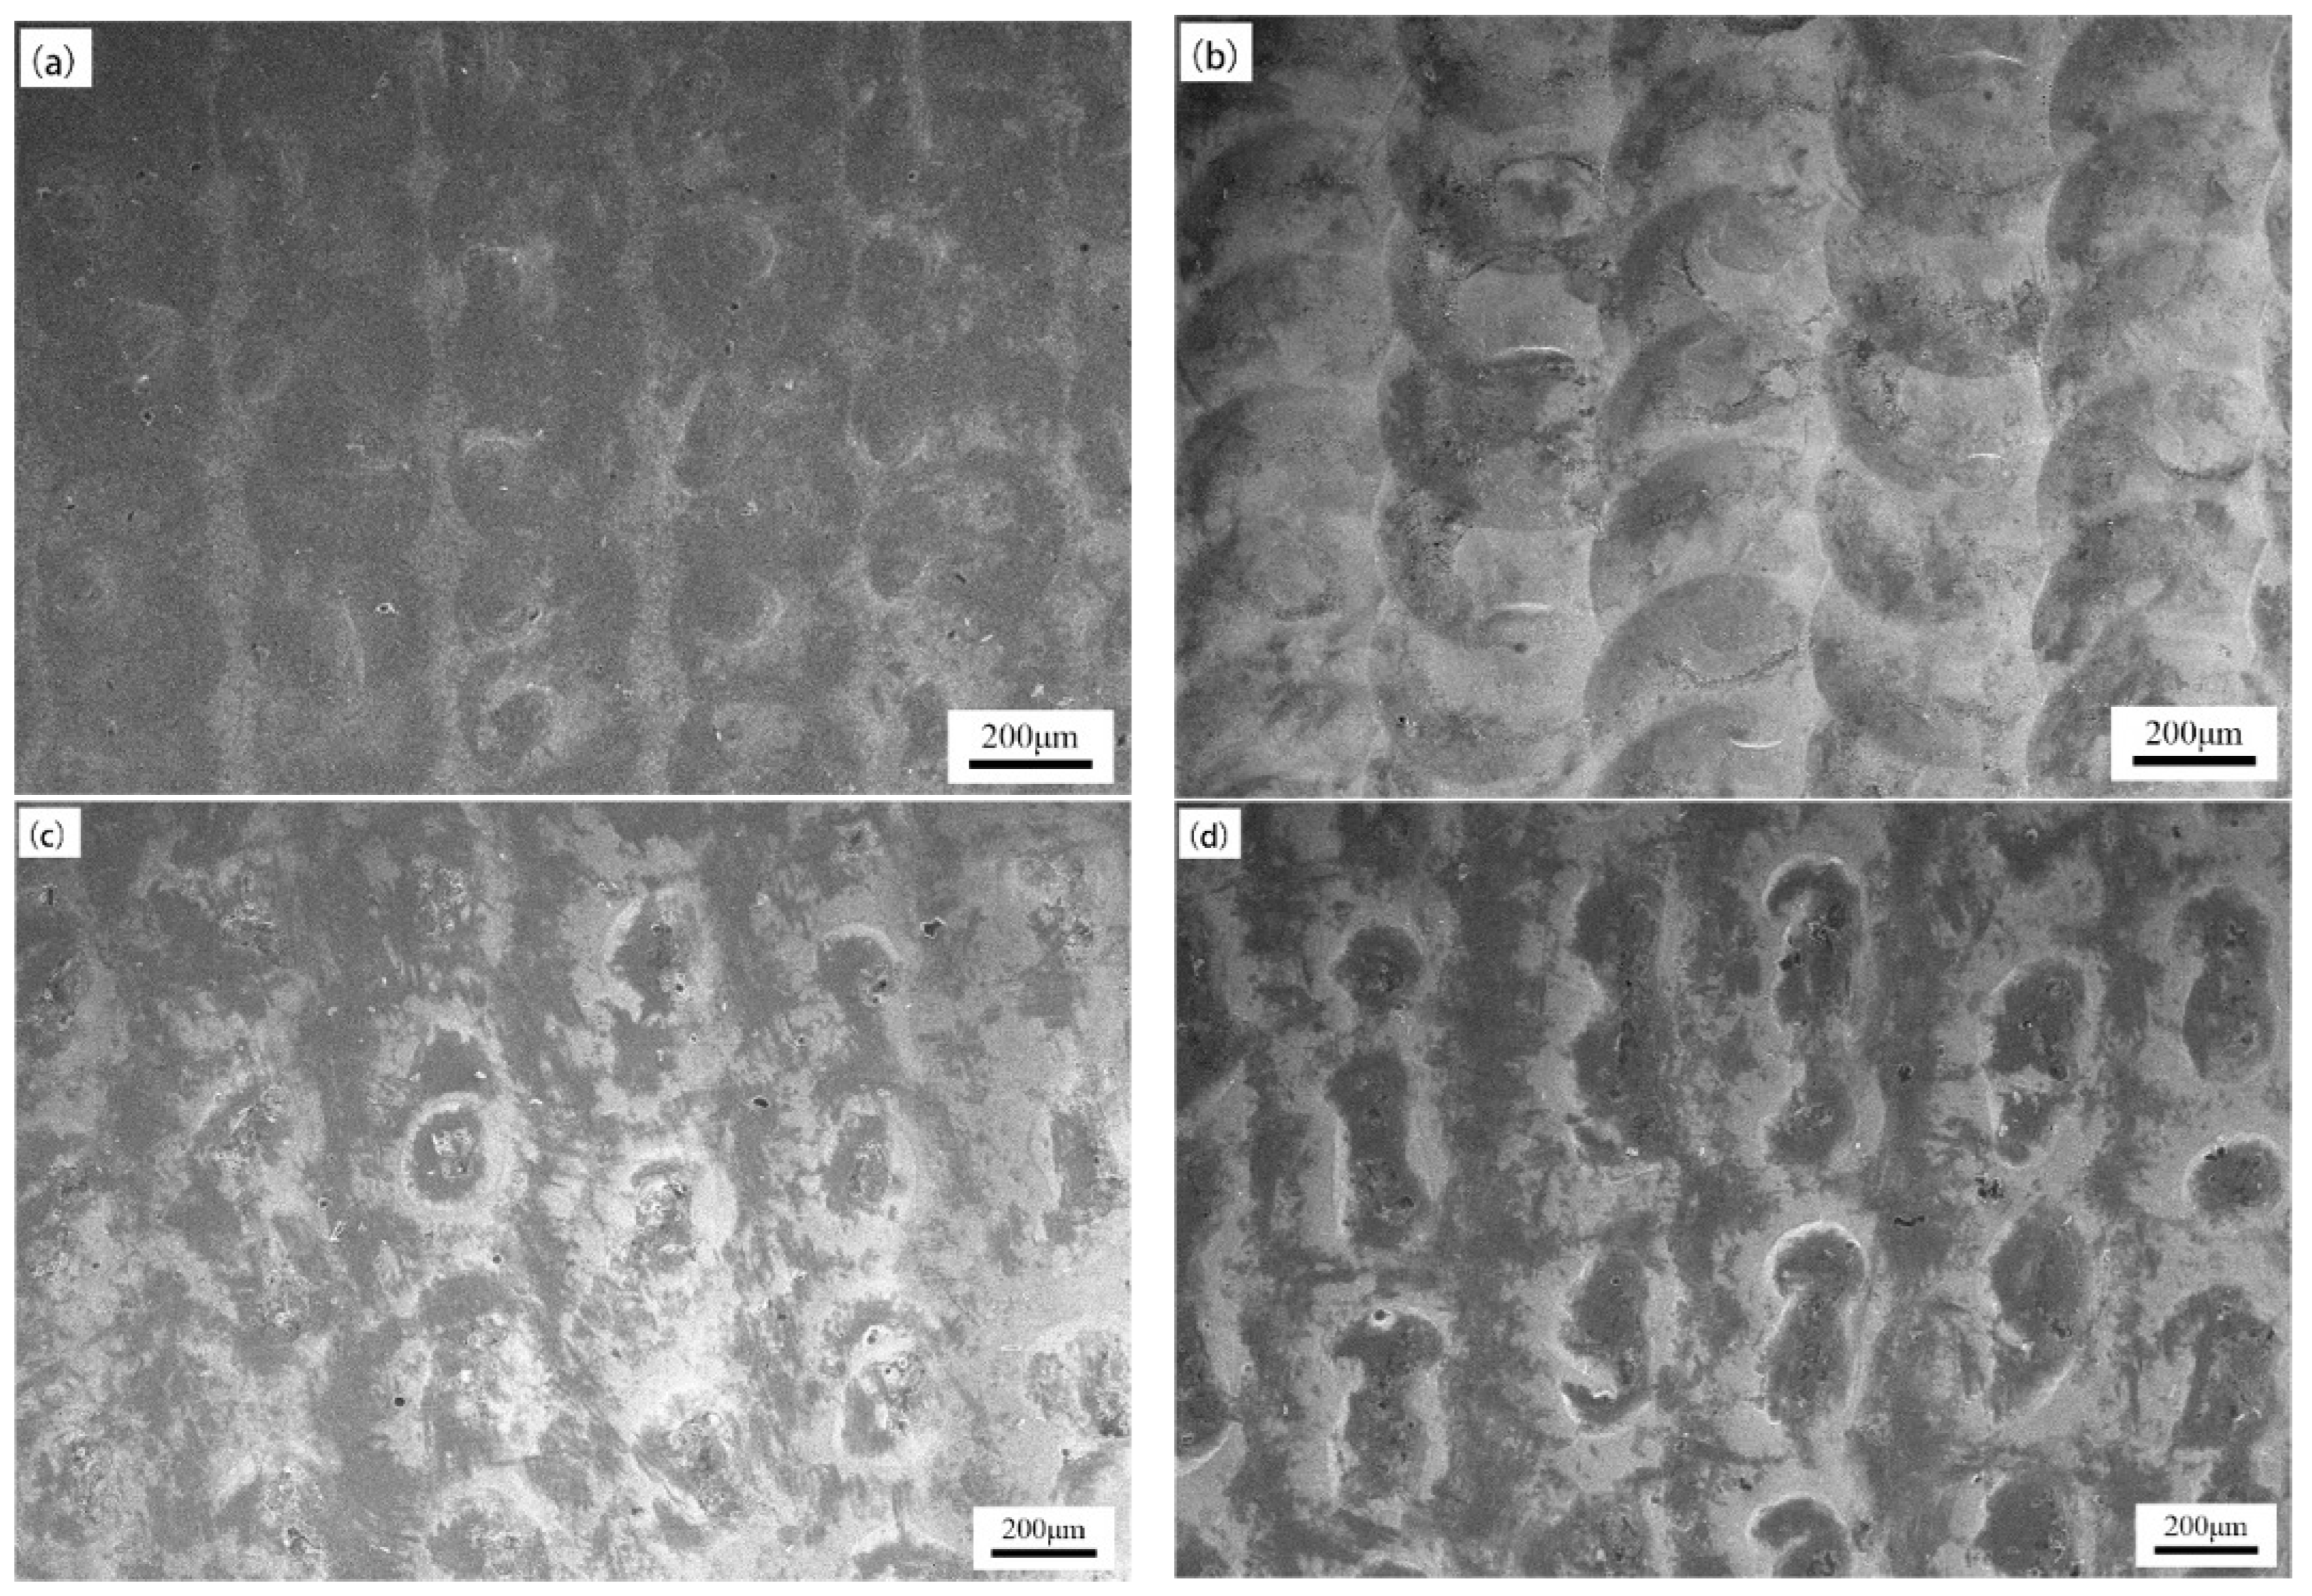
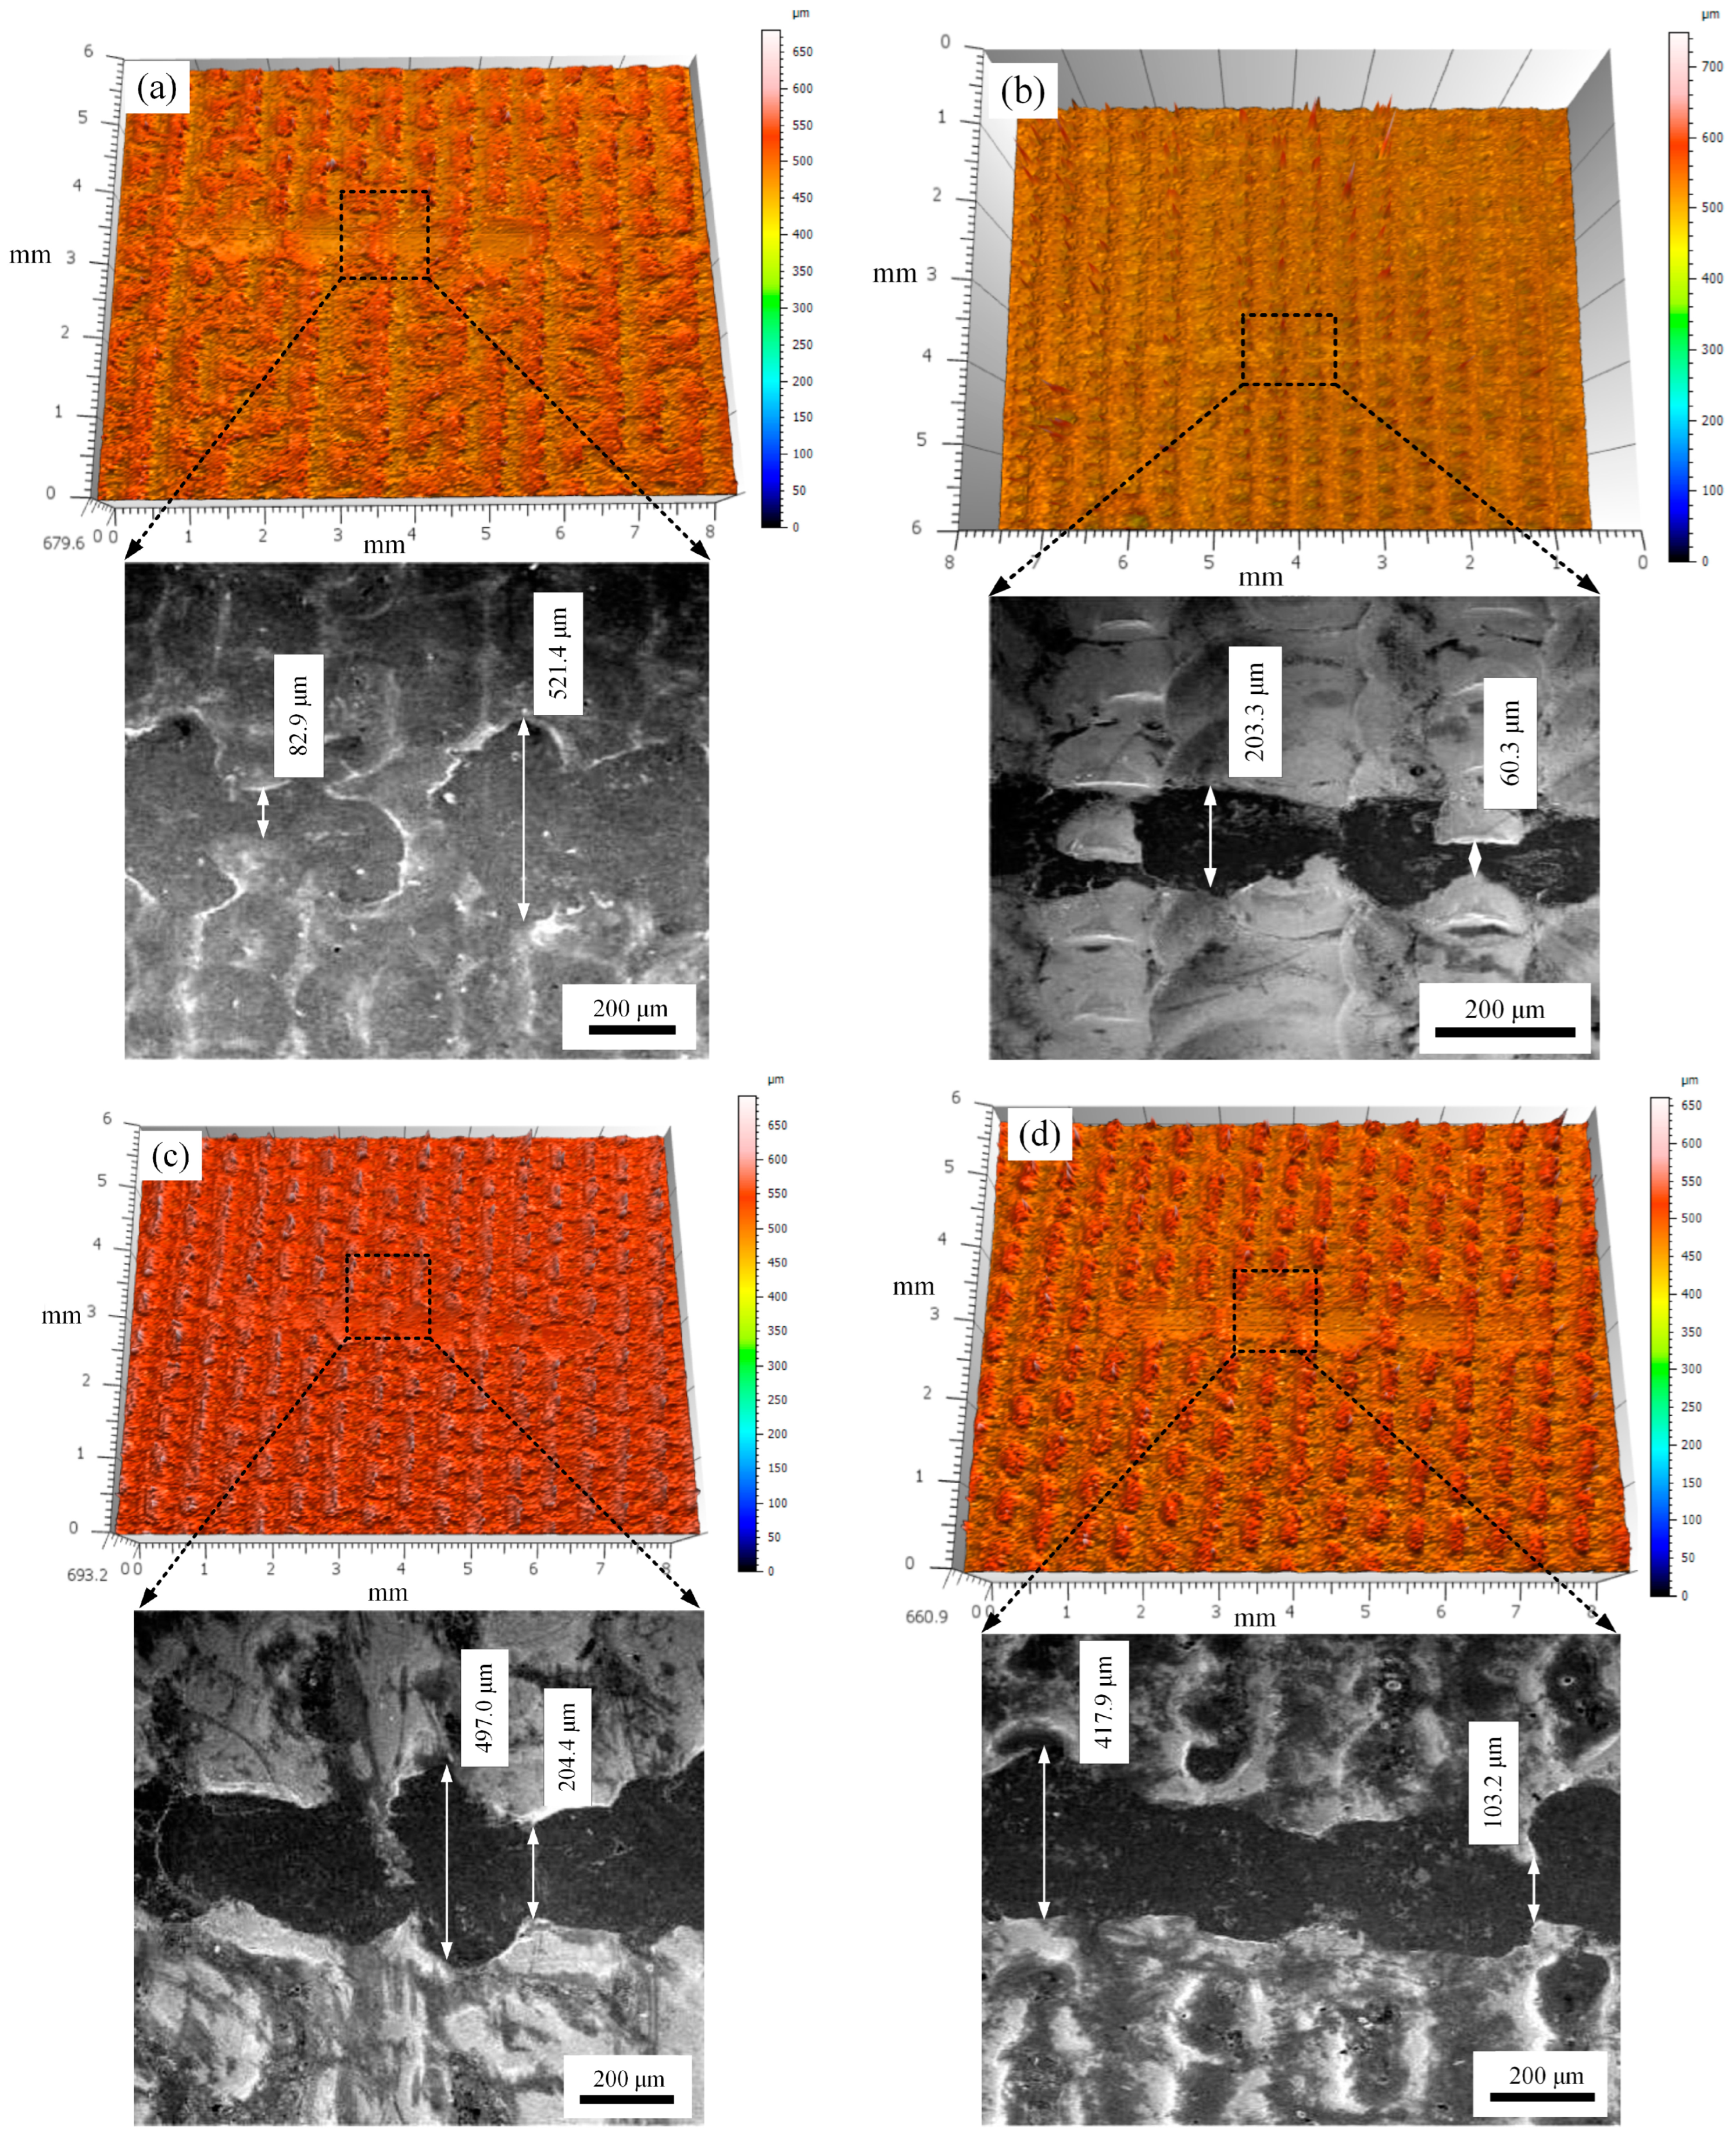
3.1. The Effect of Process Parameters on the Surface Morphology
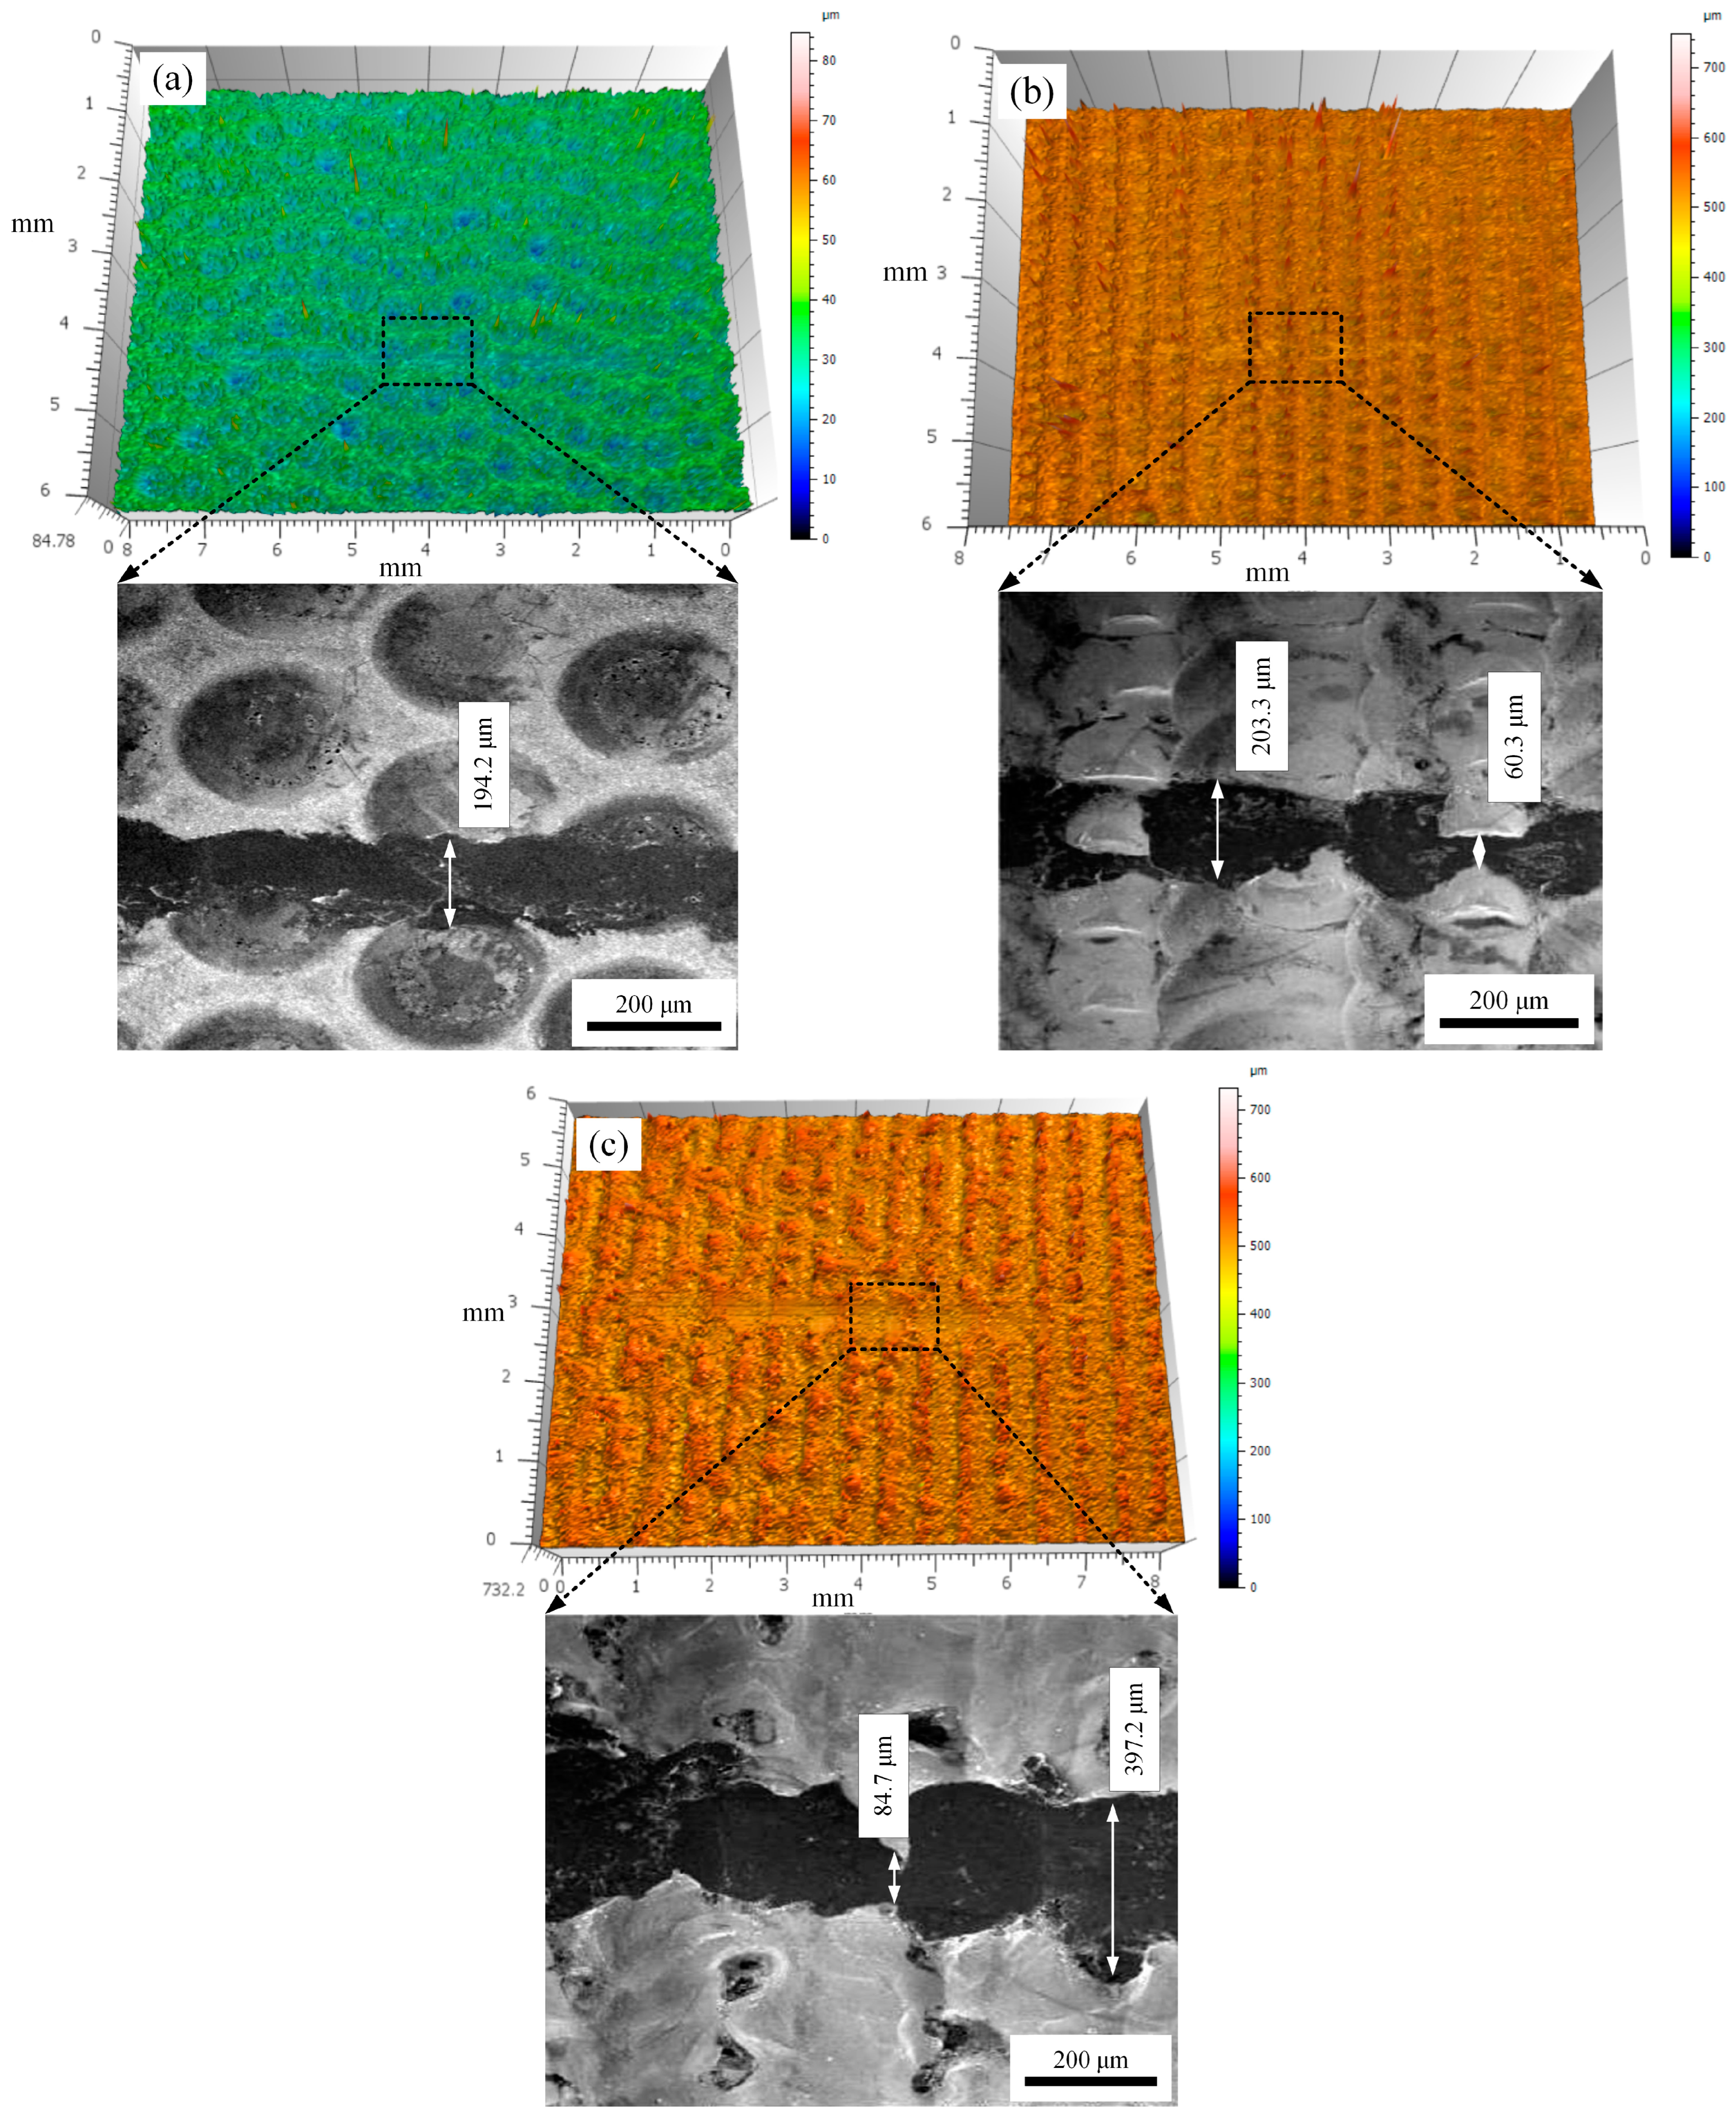
3.1.1. The Effect of Laser Frequency on the Surface Morphology
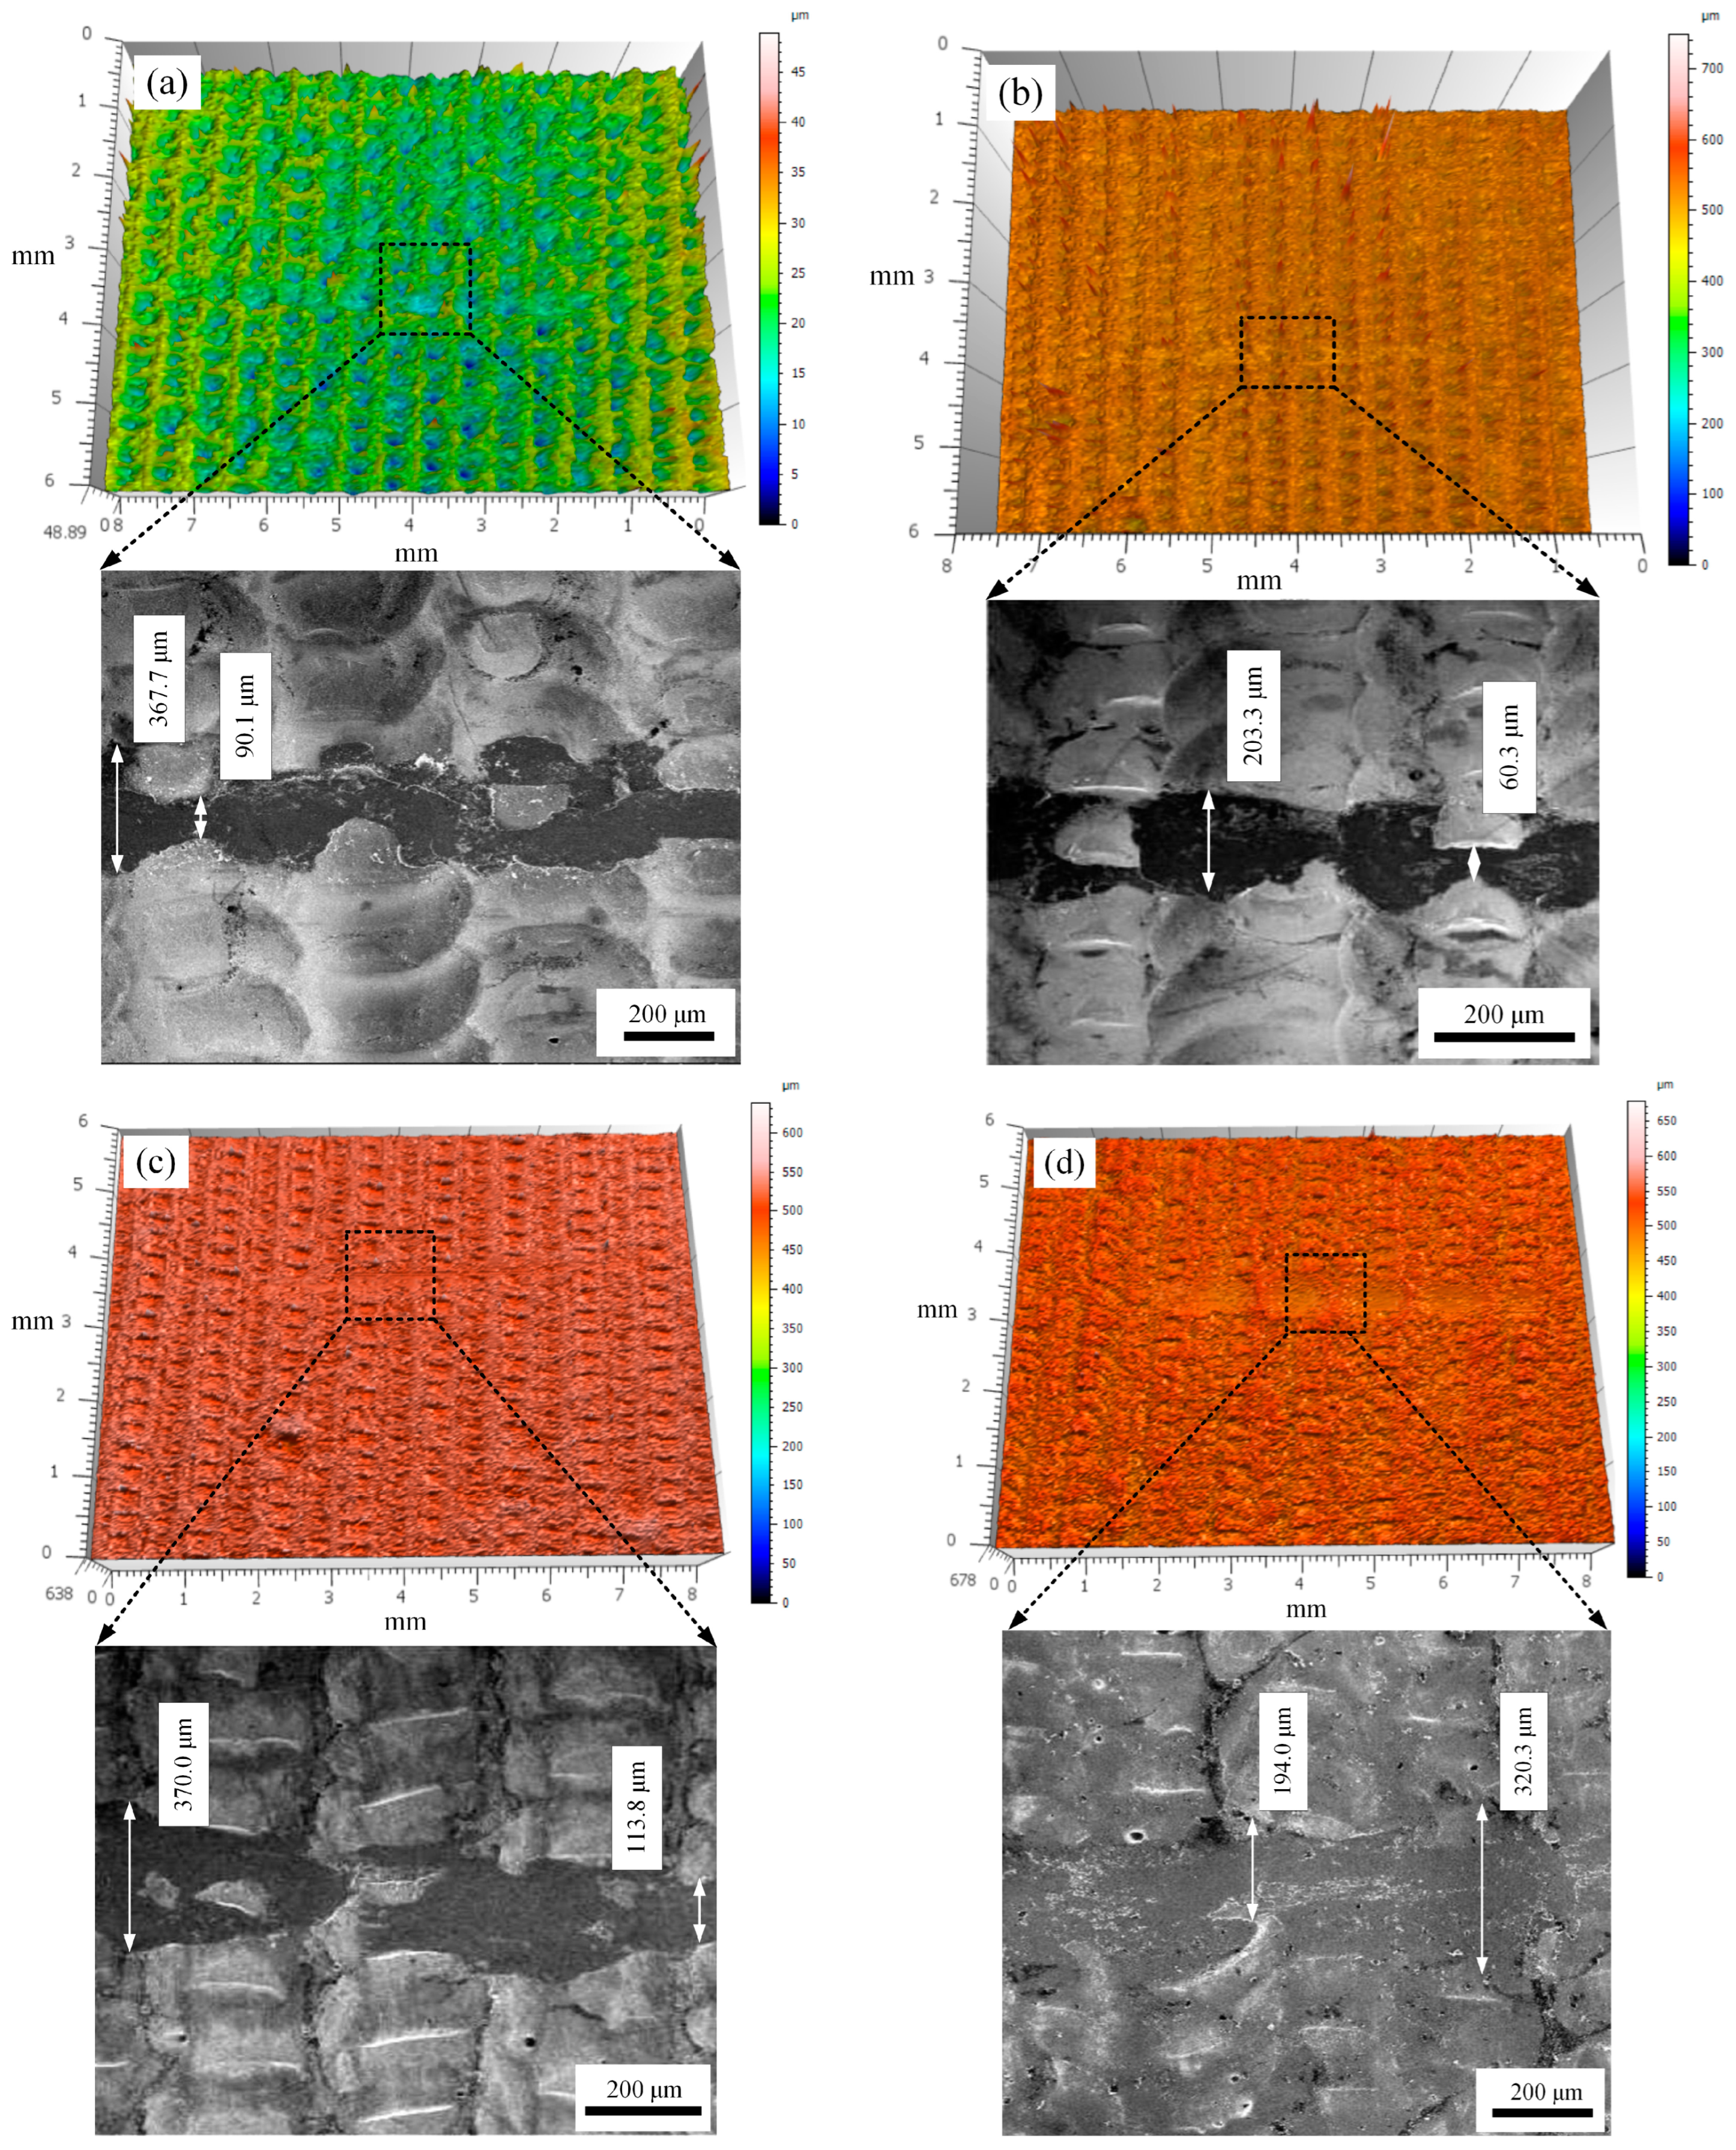
3.1.2. The Effect of Laser Pulse Width on the Surface Morphology
3.1.3. The Effect of Laser Energy Density on the Surface Morphology
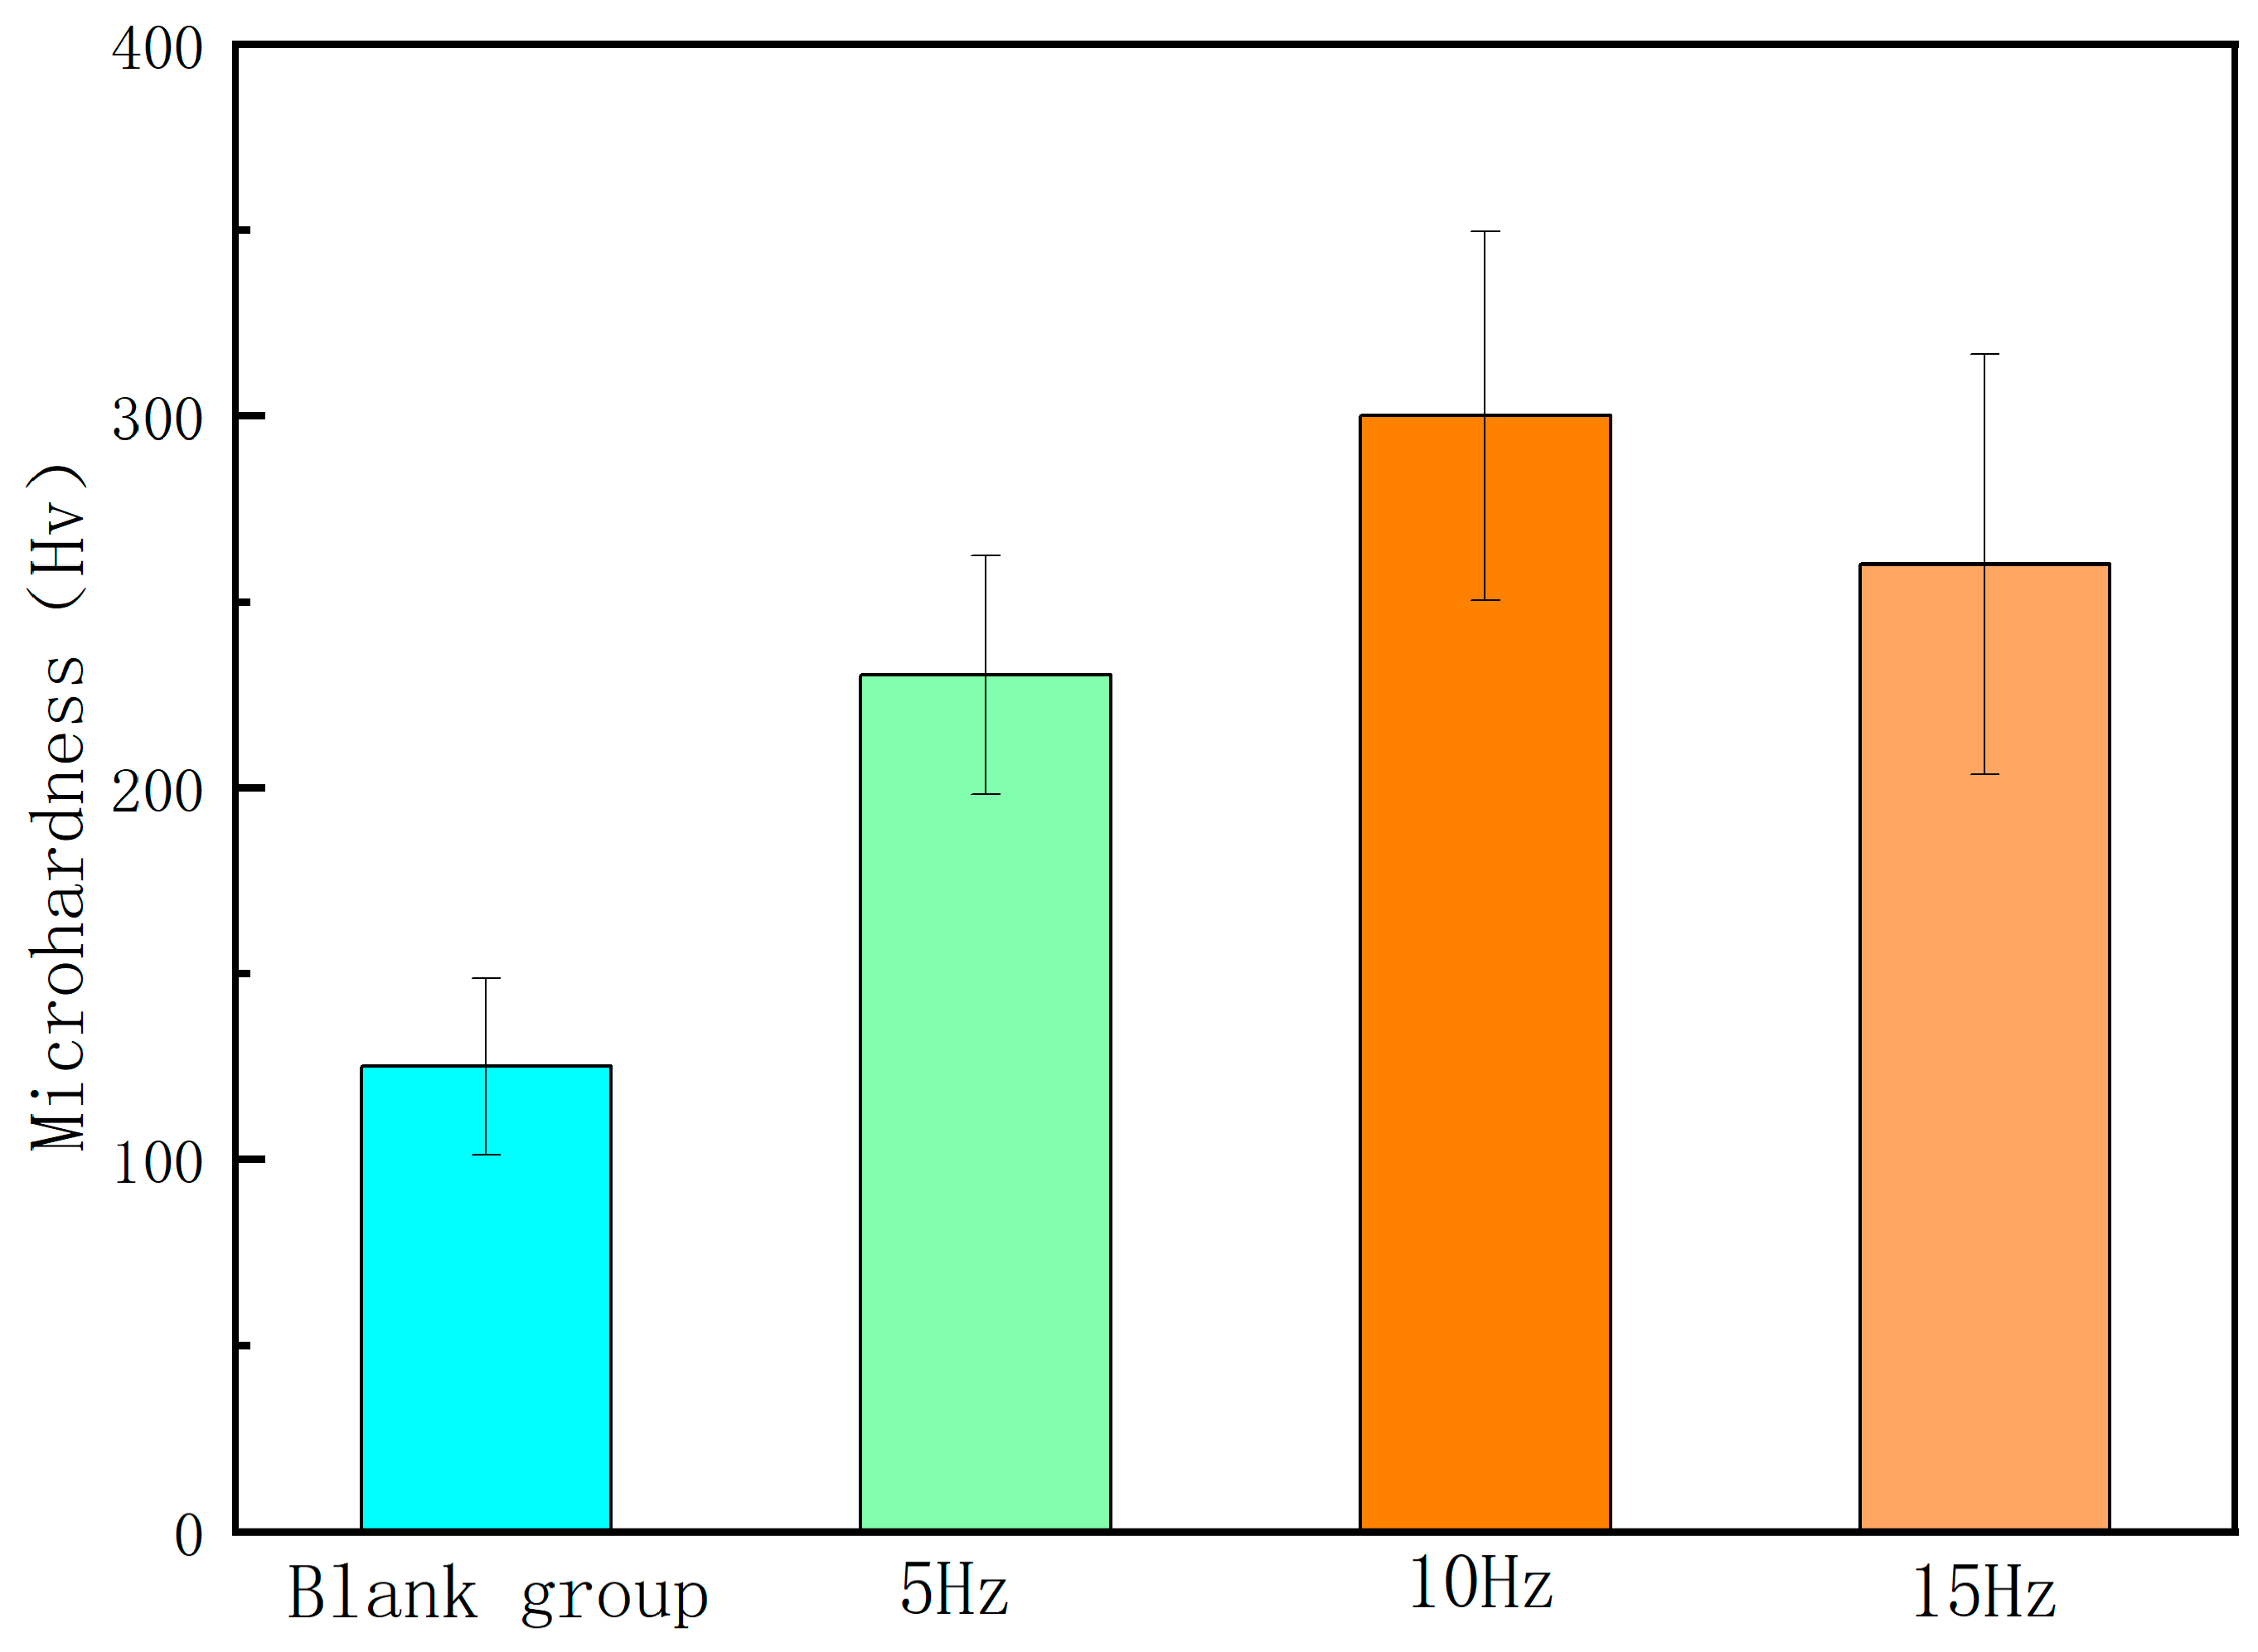
3.2. The Effect of Process Parameters on the Microhardness
3.2.1. The Effect of Laser Frequency on the Microhardness
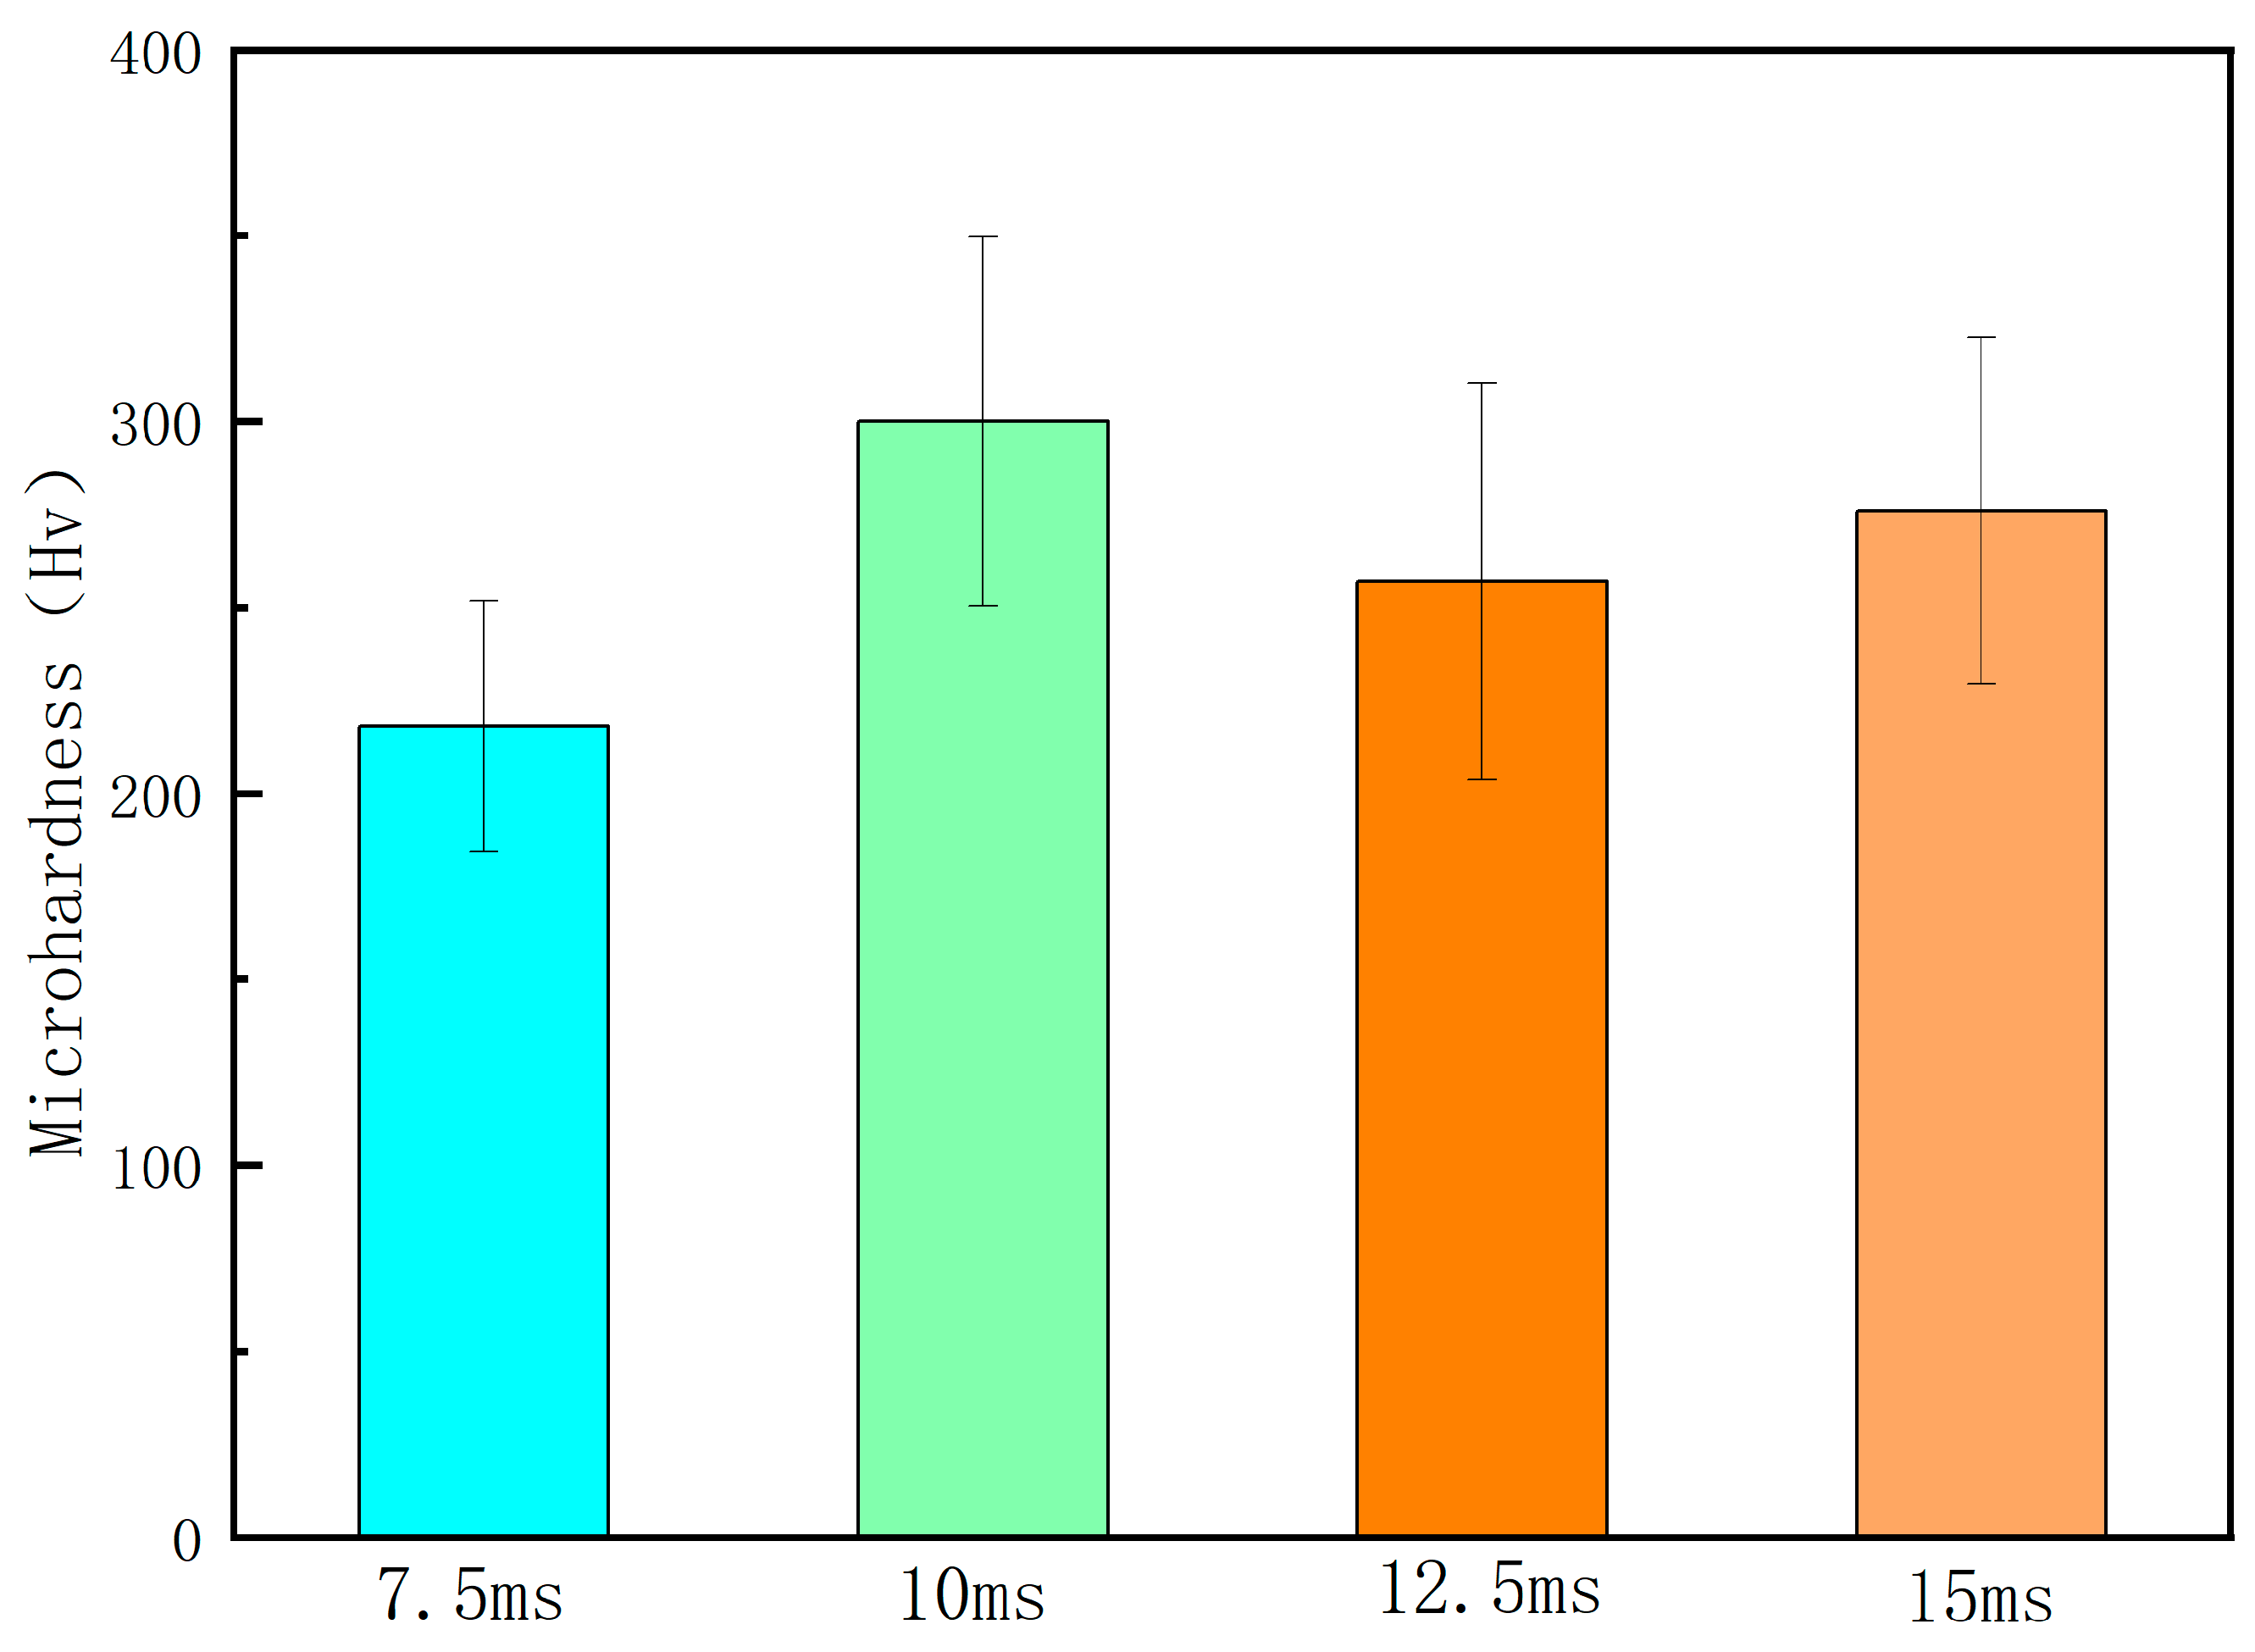
3.2.2. The Effect of Laser Pulse Width on the Microhardness
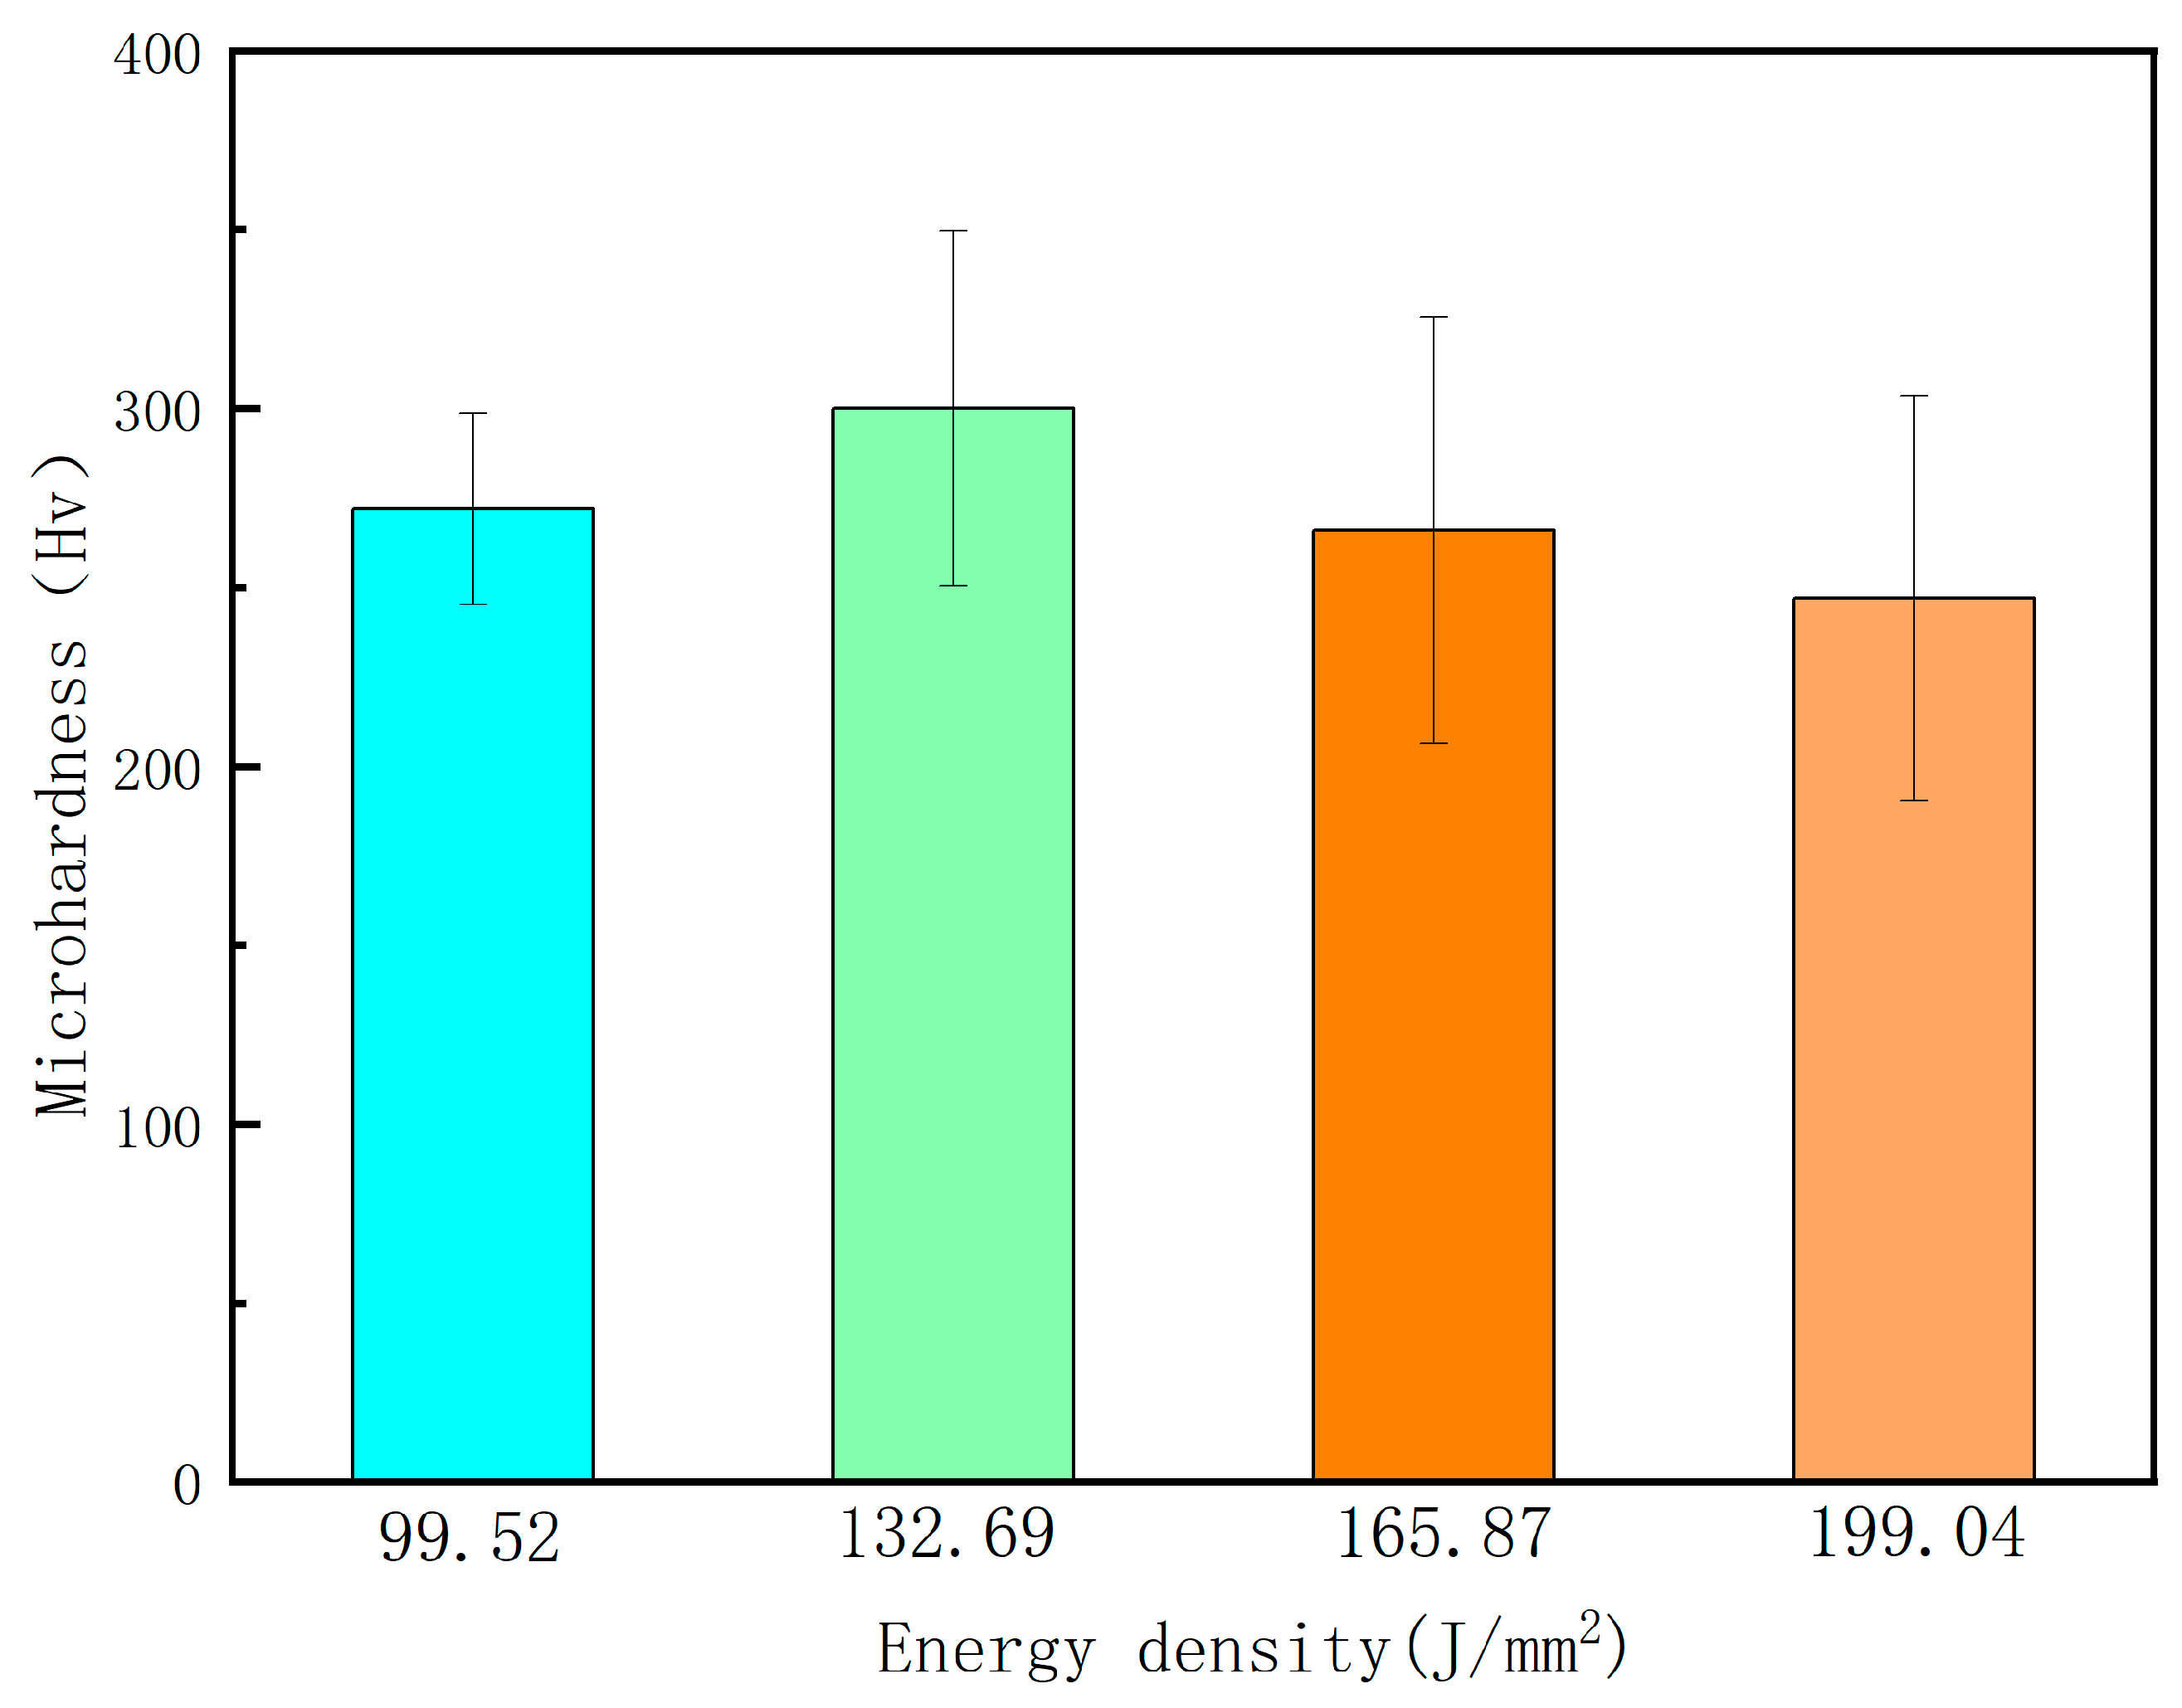
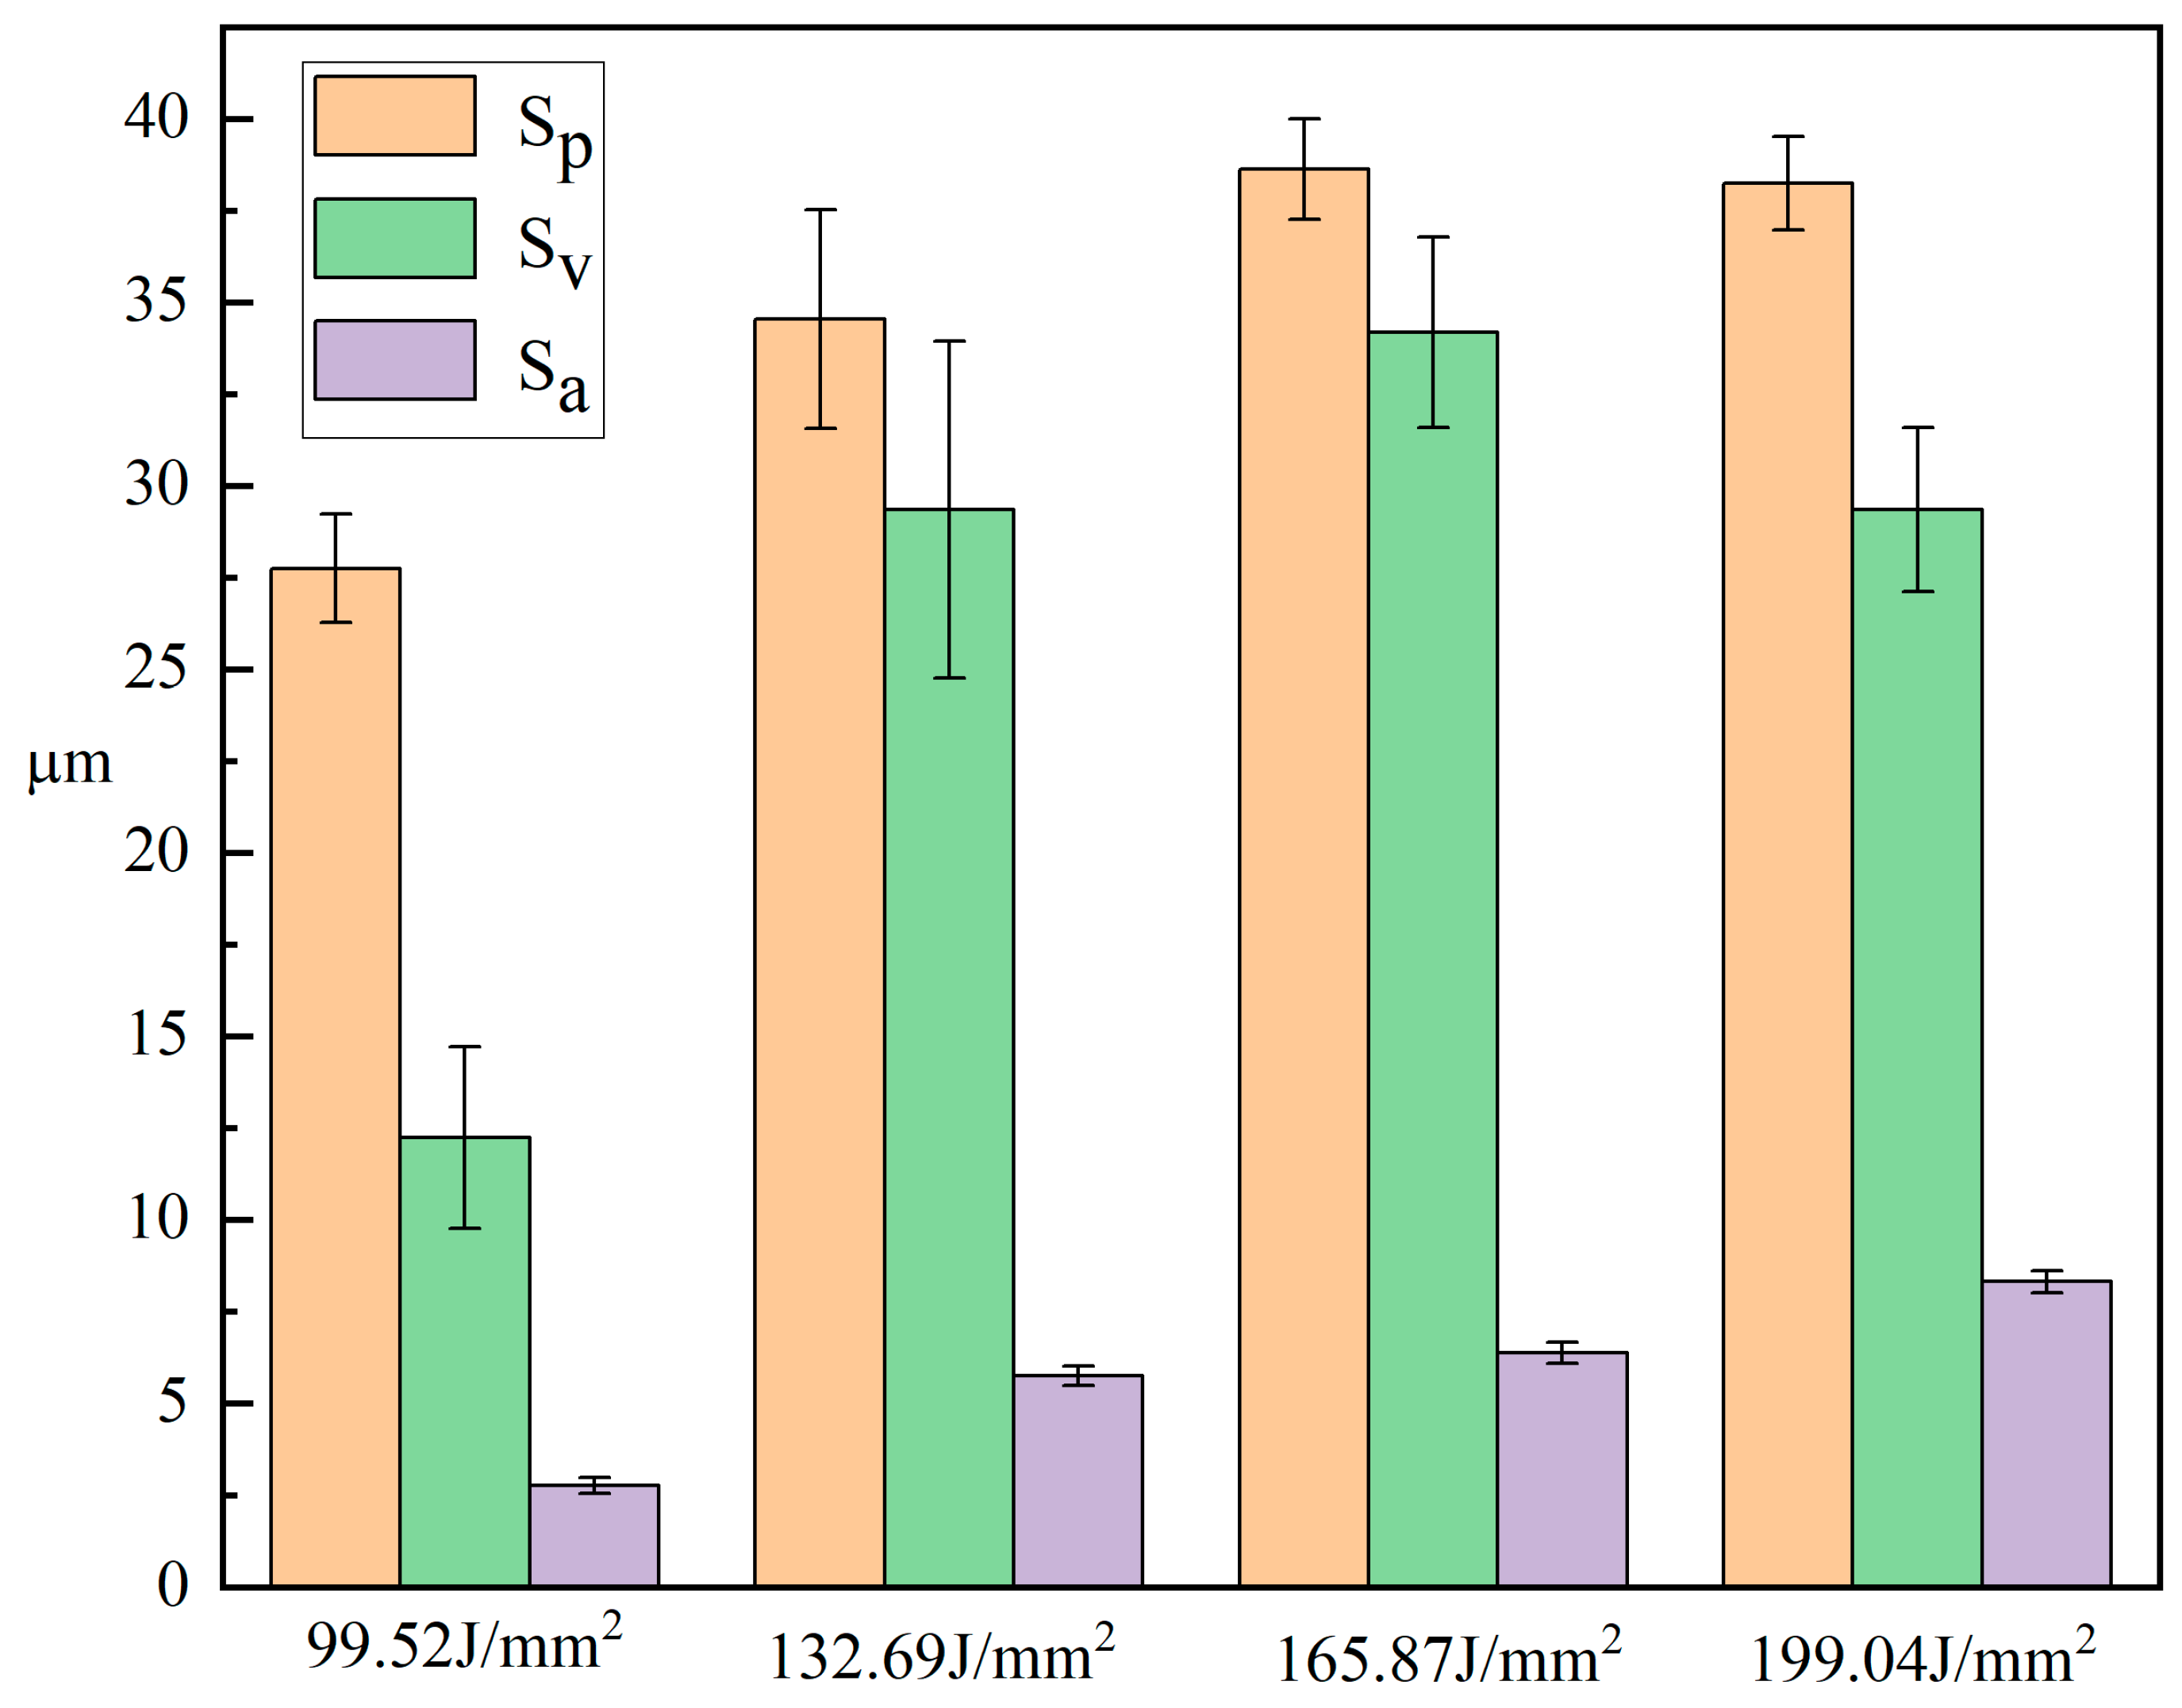
3.2.3. The Effect of Laser Energy Density on the Microhardness
3.3. The Effect of Process Parameters on the Surface Roughness
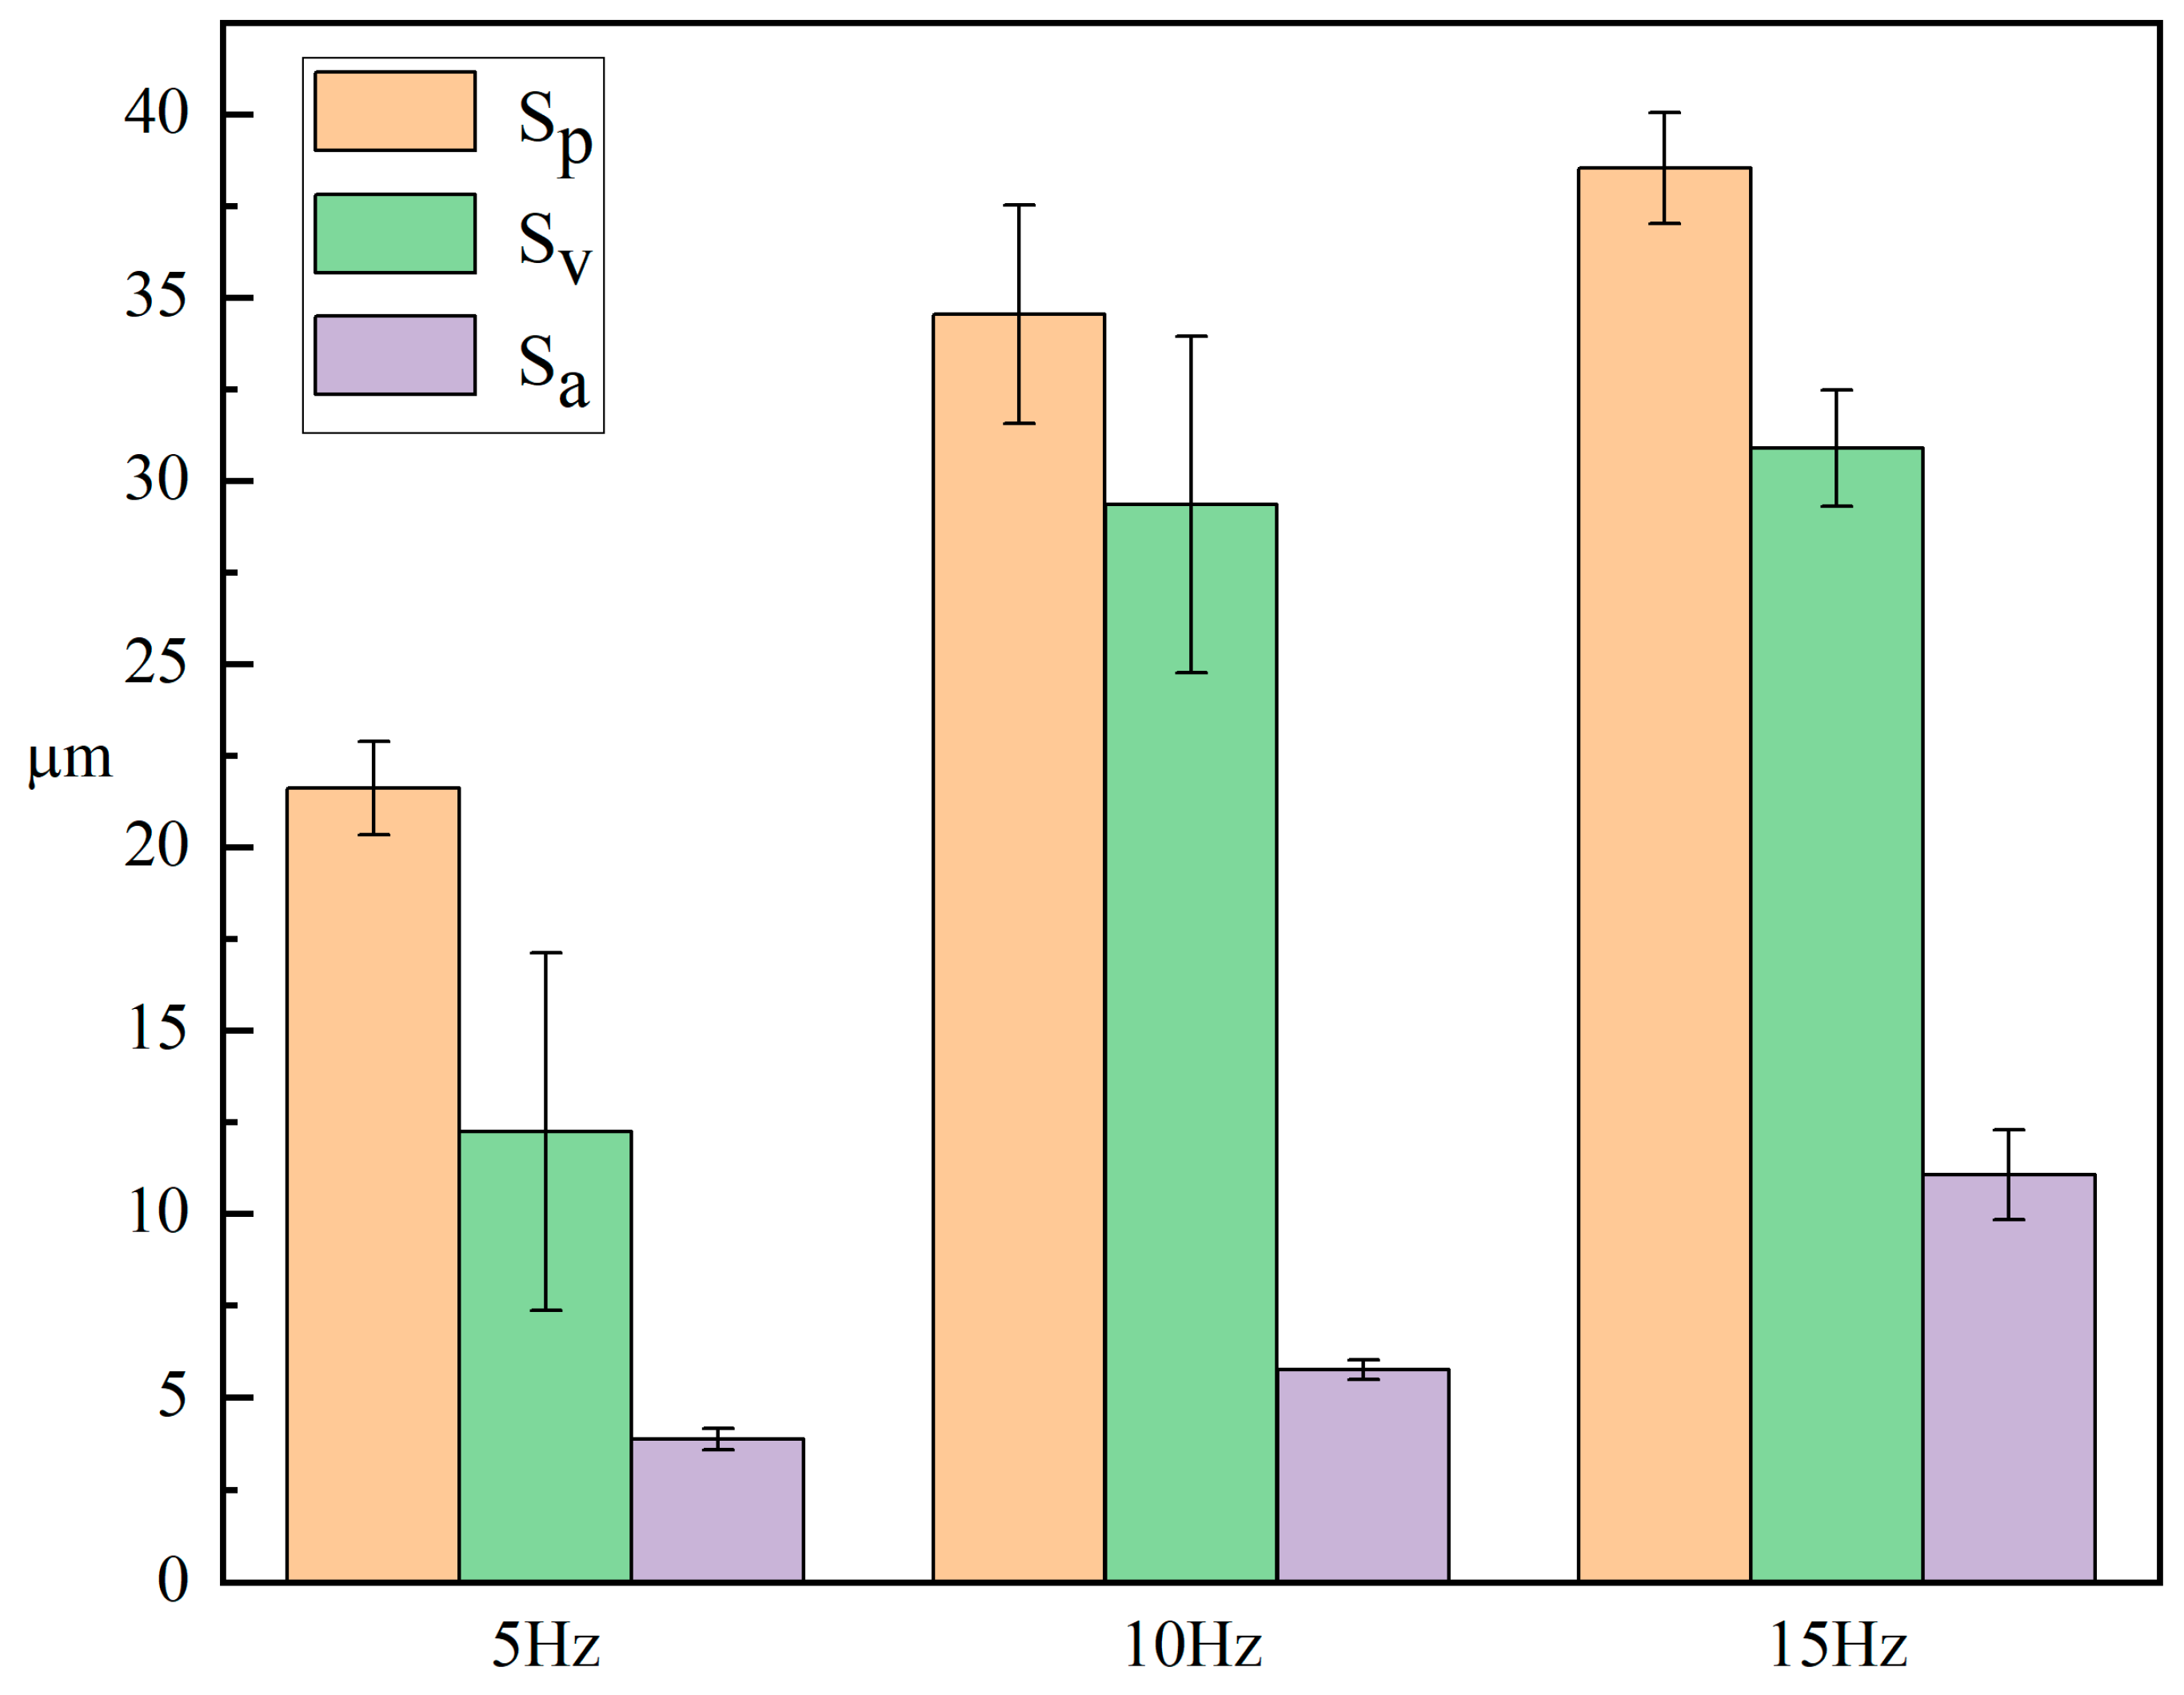
3.3.1. The Effect of Laser Frequency on the Surface Roughness
3.3.2. The Effect of Laser Pulse Width on the Surface Roughness
3.3.3. The Effect of Laser Energy Density on the Surface Roughness
4. Conclusions
Author Contributions
Funding
Data Availability Statement
Acknowledgments
Conflicts of Interest
References
- Liu, C.; Chen, J.; Wang, X.X. Quantitative Evaluation Model of the Quality of Remanufactured Product. IEEE Trans. Eng. Manag. 2023, 71, 7413–7424. [Google Scholar] [CrossRef]
- Liu, C.H.; Cai, W.; Zhang, C.X.; Wei, F.F. Data-driven intelligent control system in remanufacturing assembly for production and resource efficiency. Int. J. Adv. Des. Manuf. Technol. 2023, 128, 3531–3544. [Google Scholar] [CrossRef]
- Wu, G.P. Research on the Influence of Surface Microstructures on the Friction Characteristics of High-Speed and Heavy-Load Hydrostatic Bearings; Harbin University of Science and Technology: Harbin, China, 2021. [Google Scholar]
- Gao, J. Study on Laser Electrodeposition Composite Preparation and Lubrication Mechanism of Functional Micro-Nano Structures; Jiangsu University: Zhenjiang, China, 2023. [Google Scholar]
- Ding, J.P. Research on the Influence of PDMS Surface Micro-Groove Structure on the Friction Performance of Friction Pairs; Anhui University of Science and Technology: Huainan, China, 2019. [Google Scholar]
- Zhang, K.X. Study on Texture Technology and Lubrication Characteristics of Guiding Face of Rolling Bearing; Harbin Institute of Technology: Harbin, China, 2019. [Google Scholar]
- Gao, M.Y.; Xie, H.B.; Fang, Y.T.; Wang, H.T.; Liu, J.B. Progress in surface treatment techniques of copper and copper alloys. Chin. J. Nonferrous Met. 2021, 31, 1121–1133. [Google Scholar]
- Ghenwa, Z.; Xavier, S.; Samuel, J. Influence of crystalline defects on nitrogen implantation in copper for surface hardening. J. Scr. Mater. 2023, 231, 115440. [Google Scholar]
- Siddaiah, A.; Mao, B.; Liao, Y.L.; Menezes, P.L. Surface Characterization and Tribological Performance of Laser Shock Peened Steel Surfaces. Surf. Coat. Technol. 2018, 351, 188–197. [Google Scholar] [CrossRef]
- Reis, T.M.; Boeira, C.D.; Serafini, F.L.; Farias, M.C.M.; Figueroa, C.A.; Michels, A.F. Micro-abrasive wear resistance of heat-treated electroless nickel-phosphorus coatings deposited on copper-beryllium alloy C17200. Surf. Coat. Technol. 2022, 438, 128374. [Google Scholar] [CrossRef]
- Gilev, V.G.; Morozov, E.A.; Kilina, P.N.; Sirotenko, L.D. Laser Surface Hardening of Frictional Pairs Made from Steel-Copper Pseudoalloy. Russ. Eng. Res. 2016, 36, 152–155. [Google Scholar] [CrossRef]
- Lv, J.; Zhang, C.H.; Chen, Z.Y.; Bai, D.; Zhang, Y.W.; Li, G.S.; Lu, X.G. Fabrication and Characterization of Ni60A Alloy Coating on Copper Pipe by Plasma Cladding with Induction Heating. Coatings 2021, 11, 1080. [Google Scholar] [CrossRef]
- Li, Z.; Xiao, Z.; Jiang, Y.B.; Lei, Q.; Xie, J.X. Composition design, phase transition and fabrication of copper alloys with high strength and electrical conductivity. Chin. J. Nonferrous Met. 2019, 29, 2009–2049. [Google Scholar]
- Ren, G.C.; Li, Y.H.; Gao, S.Y.; Xu, J. Microstructure and mechanical properties of friction stir welding lap joint between copper alloy–stainless steel. Trans. China Weld. Inst. 2018, 39, 88–92+132. [Google Scholar]
- Tsuyama, M.; Kodama, Y.; Miyamoto, Y.; Kitawaki, I.; Nakano, H. Effects of Laser Peening Parameters on Plastic Deformation in Stainless Steel. J. Laser Micro/Nanoeng. 2016, 11, 227–231. [Google Scholar] [CrossRef]
- Girzhon, V.V.; Smolyakov, O.V.; Ovchinnikov, O.V.; Zavgorodny, O.V. Laser Surface Strengthening of Heat-Resistant Titanium Alloy for Gas Turbine Engines. Met Adv. Technol. 2022, 44, 383–391. [Google Scholar] [CrossRef]
- Li, H.P.; Sheng, J.M.; Li, B.; Chang, J.; Zhang, Y.J. Microstructure and Properties of Laser Surface Reinforced 316L Stainless Steel. Laser OptoElectron. Prog. 2020, 57, 199–204. [Google Scholar]
- Casalino, G.; Moradi, M.; Moghadam, K.M.; Khorram, A.; Perulli, P. Experimental and Numerical Study of AISI 4130 Steel Surface Hardening by Pulsed Nd: YAG Laser. Materials 2019, 12, 3136. [Google Scholar] [CrossRef] [PubMed]
- Cordovilla, F.; García-Beltrán, Á.; Sancho, P.; Domínguez, J.; Ruiz-de-Lara, L.; Ocaña, J.L. Numerical/experimental analysis of the laser surface hardening with overlapped tracks to design the configuration of the process for Cr-Mo steels. Mater. Des. 2016, 102, 225–237. [Google Scholar] [CrossRef]
- Wei, B.X.; Xu, J.; Cheng, Y.; Wu, J.J.; Sun, C.; Wang, Z. Microstructural response and improving surface mechanical properties of pure copper subjected to laser shock peening. Appl. Surf. Sci. 2021, 564, 150336. [Google Scholar] [CrossRef]
- Wang, F. Study on Surface Quality and Mechanical Properties of Copper Target Strengthened by Laser Shock; Jiangsu University: Zhenjiang, China, 2017. [Google Scholar]
- Wang, F.; Zuo, H.; Zhao, L.; Chen, M. Surface Quality and Property of Copper Treated by Laser Shock Peening. Prog. Laser Electron. 2017, 54, 041410. [Google Scholar] [CrossRef]
- Liu, X.P.; Zhang, P.L.; Lu, Y.L.; Yan, H.; Yu, Z. Study on Tribological Properties of Ni-Based Silicide Coating on Copper by Laser Cladding. China J. Lasers 2015, 42, 232–238. [Google Scholar]
- Lu, J.Z.; Duan, H.F.; Luo, K.Y.; Wu, L.J.; Deng, W.W.; Cai, J. Tensile properties and surface nanocrystallization analyses of H62 brass subjected to room-temperature and warm laser shock peening. J. Alloys Compd. 2017, 698, 633–642. [Google Scholar] [CrossRef]
- Park, C.; Jung, D.; Chun, E.J.; Ahn, S.; Jang, H.; Kim, Y.J. Effect of laser shock peening without coating on fretting corrosion of copper contacts. Appl. Surf. Sci. 2020, 514, 145917. [Google Scholar] [CrossRef]
- Zhu, L. Influence of Laser Impact on Copper Matrix Composites and Finite Element Simulation; Jiangsu University: Zhenjiang, China, 2010. [Google Scholar]
- Feng, Y.Y.; Ye, Y.X.; Lian, Z.Y.; Xuan, T. Experimental Research on Effect of Surface Quality of Copper Treated by Laser Shock Peening. Laser OptoElectron. Prog. 2015, 52, 198–204. [Google Scholar]
- Yuan, S.Q.; Gao, Z.G.; Fu, H.; Cheung, C.F.; Yang, X.S. Superior corrosion-resistant nanostructured hypoeutectic CrCoNi-based medium-entropy alloy processed by laser surface remelting. J. Alloys Compd. 2023, 967, 17802. [Google Scholar] [CrossRef]
- Yang, R.N.; Chen, W.J.; Tang, L.F.; Ma, J.C.; Zhou, Q.R.; Lei, X.W.; Yao, W.J.; Wang, N. Research on the Melt Pool Shape Formation Mechanism of the Laser Surface Remelting of Nickel-Based Single-Crystal Superalloy. Crystals 2023, 13, 1162. [Google Scholar] [CrossRef]
- Syed, B.A.M.; Naveed, H.; Farrukh, S.A.; Muhammad, A.T.; Azhar, K.A.; Muhammad, I.; Tahir, Q.H. Effect of laser surface remelting on Microstructure, mechanical properties and tribological properties of metals and alloys: A review. Opt. Laser Technol. 2023, 165, 109588. [Google Scholar]
- Arkajyoti, J.; Shivam, S.; Amit, C.; Ramji, M.; Gopinath, M. A study on developing process-structure–property relationship with molten pool thermal history during laser surface remelting of Inconel 718. Opt. Laser Technol. 2023, 157, 108732. [Google Scholar]
- Varghese, P.; Vetrivendan, E.; Vaishnavi, K.B.R.; Kumar, S.P.; Kishor, G.R.; Hemant, R.E.; Puppala, G.; Ningshen, S. Molten sodium corrosion of laser surface remelted yttria-stabilized zirconia thermal barrier coatings. Corros. Sci. 2021, 191, 109740. [Google Scholar] [CrossRef]


Disclaimer/Publisher’s Note: The statements, opinions and data contained in all publications are solely those of the individual author(s) and contributor(s) and not of MDPI and/or the editor(s). MDPI and/or the editor(s) disclaim responsibility for any injury to people or property resulting from any ideas, methods, instructions or products referred to in the content. |
© 2024 by the authors. Licensee MDPI, Basel, Switzerland. This article is an open access article distributed under the terms and conditions of the Creative Commons Attribution (CC BY) license (https://creativecommons.org/licenses/by/4.0/).
Share and Cite
Li, H.; Chen, Y.; Chen, S.; Liu, Y.; Liu, C. The Influence of Laser Remelting Parameters on the Surface Quality of Copper. Micromachines 2024, 15, 927. https://doi.org/10.3390/mi15070927
Li H, Chen Y, Chen S, Liu Y, Liu C. The Influence of Laser Remelting Parameters on the Surface Quality of Copper. Micromachines. 2024; 15(7):927. https://doi.org/10.3390/mi15070927
Chicago/Turabian StyleLi, Hengzheng, Yang Chen, Shuai Chen, Yan Liu, and Conghu Liu. 2024. "The Influence of Laser Remelting Parameters on the Surface Quality of Copper" Micromachines 15, no. 7: 927. https://doi.org/10.3390/mi15070927