1. Introduction
Sarcomas are a rare group of malignant tumors that arise from mesenchymal tissue. Molecular approaches have described three main genetics in these tumors: reciprocal translocations, specific mutations, and complex genomic profiles [
1]. Soft tissue sarcomas (STSs) with complex genomics, which represent 50% of STSs, display no specific genetic alterations [
2]. These tumors form a heterogeneous group with numerous histotypes such as leiomyosarcomas (LMSs), undifferentiated pleomorphic sarcomas (UPSs), myxofibrosarcomas, pleomorphic liposarcomas, and pleomorphic rhabdomyosarcomas. Patient outcome is mainly driven by the intrinsic tumor biology and aggressiveness but also by tumor response to systemic chemotherapy. The response rate to chemotherapy ranges from 20% to 60% during first-line chemotherapy with doxorubicin, the standard first-line treatment for the last 40 years [
2]. For metastatic sarcomas, the combination of gemcitabine and docetaxel provides a median overall survival (OS) of 18 months [
3]. Other molecules such as pazopanib [
3], regorafenib [
4], and trabectidine [
5] have also shown efficacy after failure of standard chemotherapy. More recently, a novel monoclonal antibody against platelet-derived growth factor receptor alpha (olaratumab) has been proposed as a first-line treatment in combination with doxorubicin. This drug is currently under phase III clinical evaluation [
6]. Since surgery is the current best treatment available against these neoplasms, it is necessary to enhance the efficiency of chemotherapy by improving our understanding of the mechanisms involved in drug resistance or by finding new therapeutic targets and biomarkers of tumor response.
These tumors are characterized by a complex karyotype. At the genomic level, there are numerous gains and losses of chromosomes or chromosome regions, mostly variable across tumors [
1]. Some recurring genetic alterations have been identified in these tumors, i.e., losses of chromosomes 10, 13, and 16 [
7]. Among them, the most frequent is the 13q14-21 region loss in LMSs and UPSs, leading to RB1 deletion or inactivation [
8]. However, no driver gene specific to the oncogenesis of these tumors has been identified so far.
In order to identify new genes involved in sarcoma oncogenesis, we applied an approach integrating clinical, genomic and transcriptomic data from 106 sarcomas samples [
9]. Since sarcomas with complex genetic profiles have many alterations, it is challenging to distinguish drivers from passengers. We hypothesized that some altered biological pathways are common to all sarcomas or specific to a sub-group (such as histotype, localization, prognosis, and clinical evolution). By selecting altered genes belonging to biological pathways dysregulated in all sarcomas, we identified
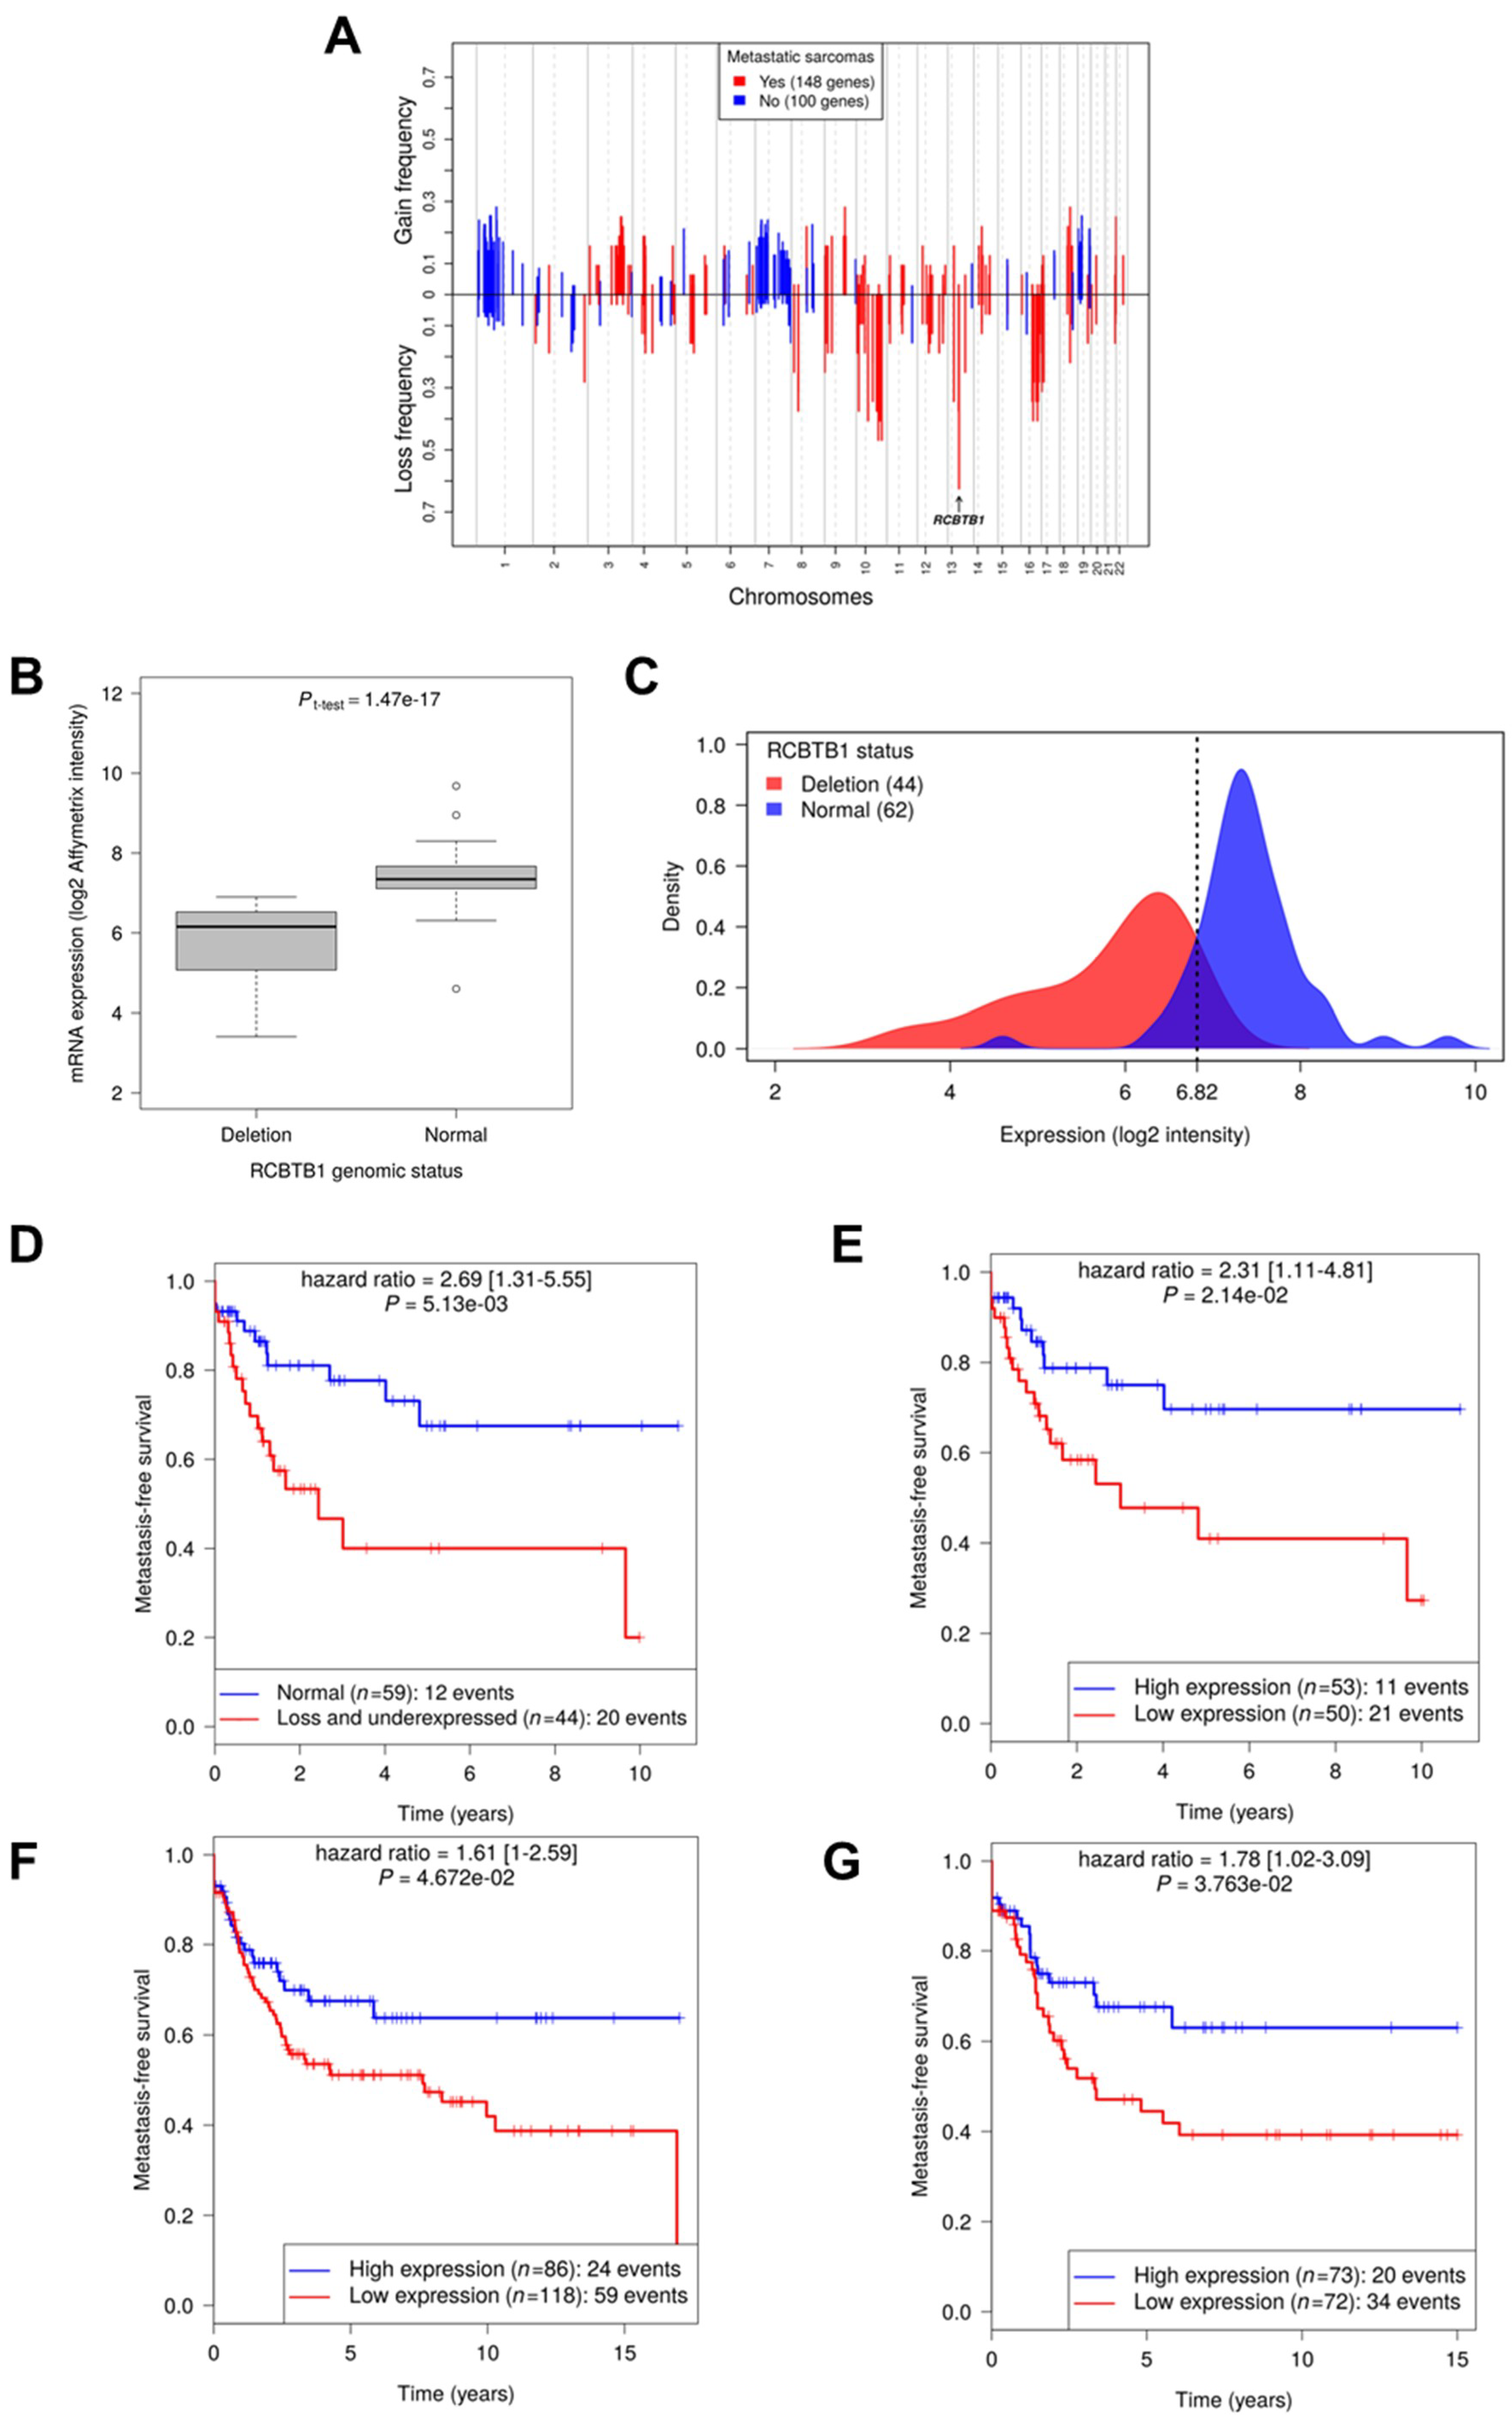
RCBTB1 (RCC1 And BTB Domain Containing Protein 1), for which downregulation is associated with metastatic progression.
3. Discussion
Sarcomas with complex genomics are rare and aggressive tumors, characterized by a high risk of metastasis, and consequently a poor overall survival. To improve patient care, it is important to understand their oncogenesis.
For that purpose, we first identified all the quantitatively altered genes and retained only those that are part of the biological pathways altered in 100% of sarcomas with complex genomics. This bioinformatic approach, based on commonly altered biological pathways instead of genes, allowed us to identify a gene significantly associated with metastatic progression. Here, we report that among the several genes located within the frequently deleted 13q14 band [
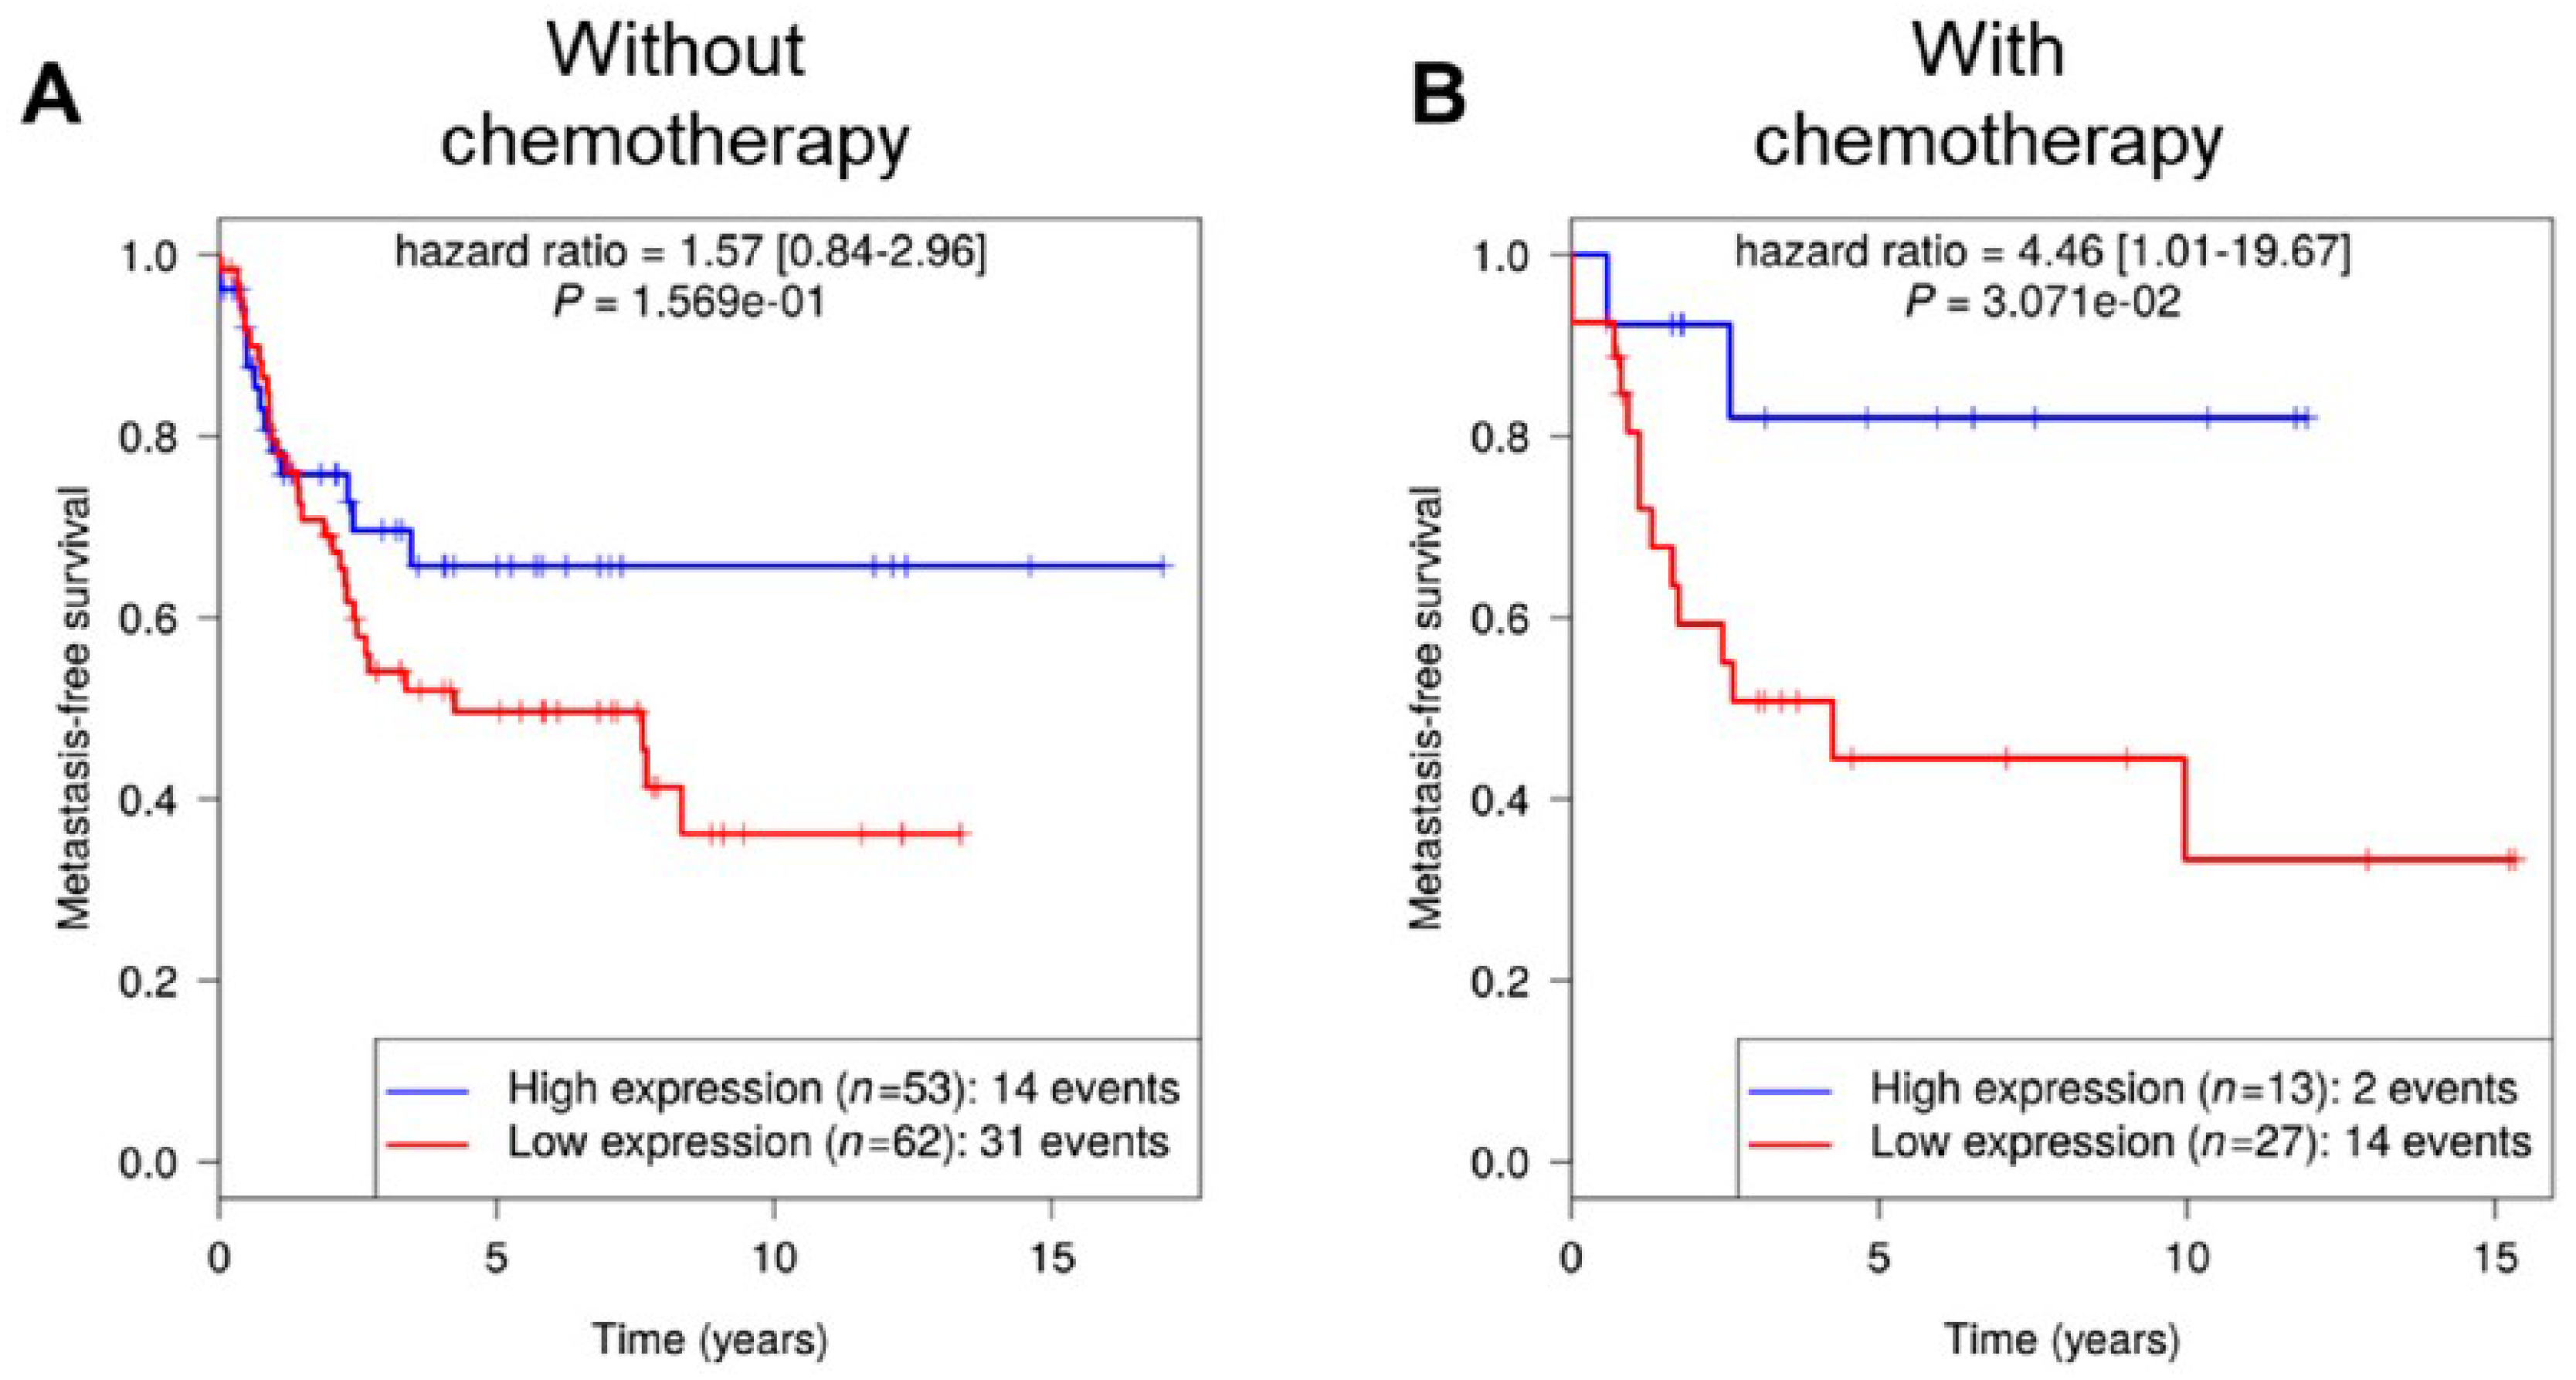
8], RCBTB1 was filtered out for its impact on the cell cycle pathway. aCGH and RNA sequencing revealed that this gene is mainly inactivated by a deletion mechanism. RCBTB1 downregulation is associated with metastatic evolution in sarcomas with complex genetics. Interestingly, the prognostic value of RCBTB1 was restricted to patients receiving chemotherapy. Altogether, these observations led us to formulate the hypothesis that RCBTB1 may be a tumor suppressor gene whose activity could be related to drug response.
Data reported here evidenced that
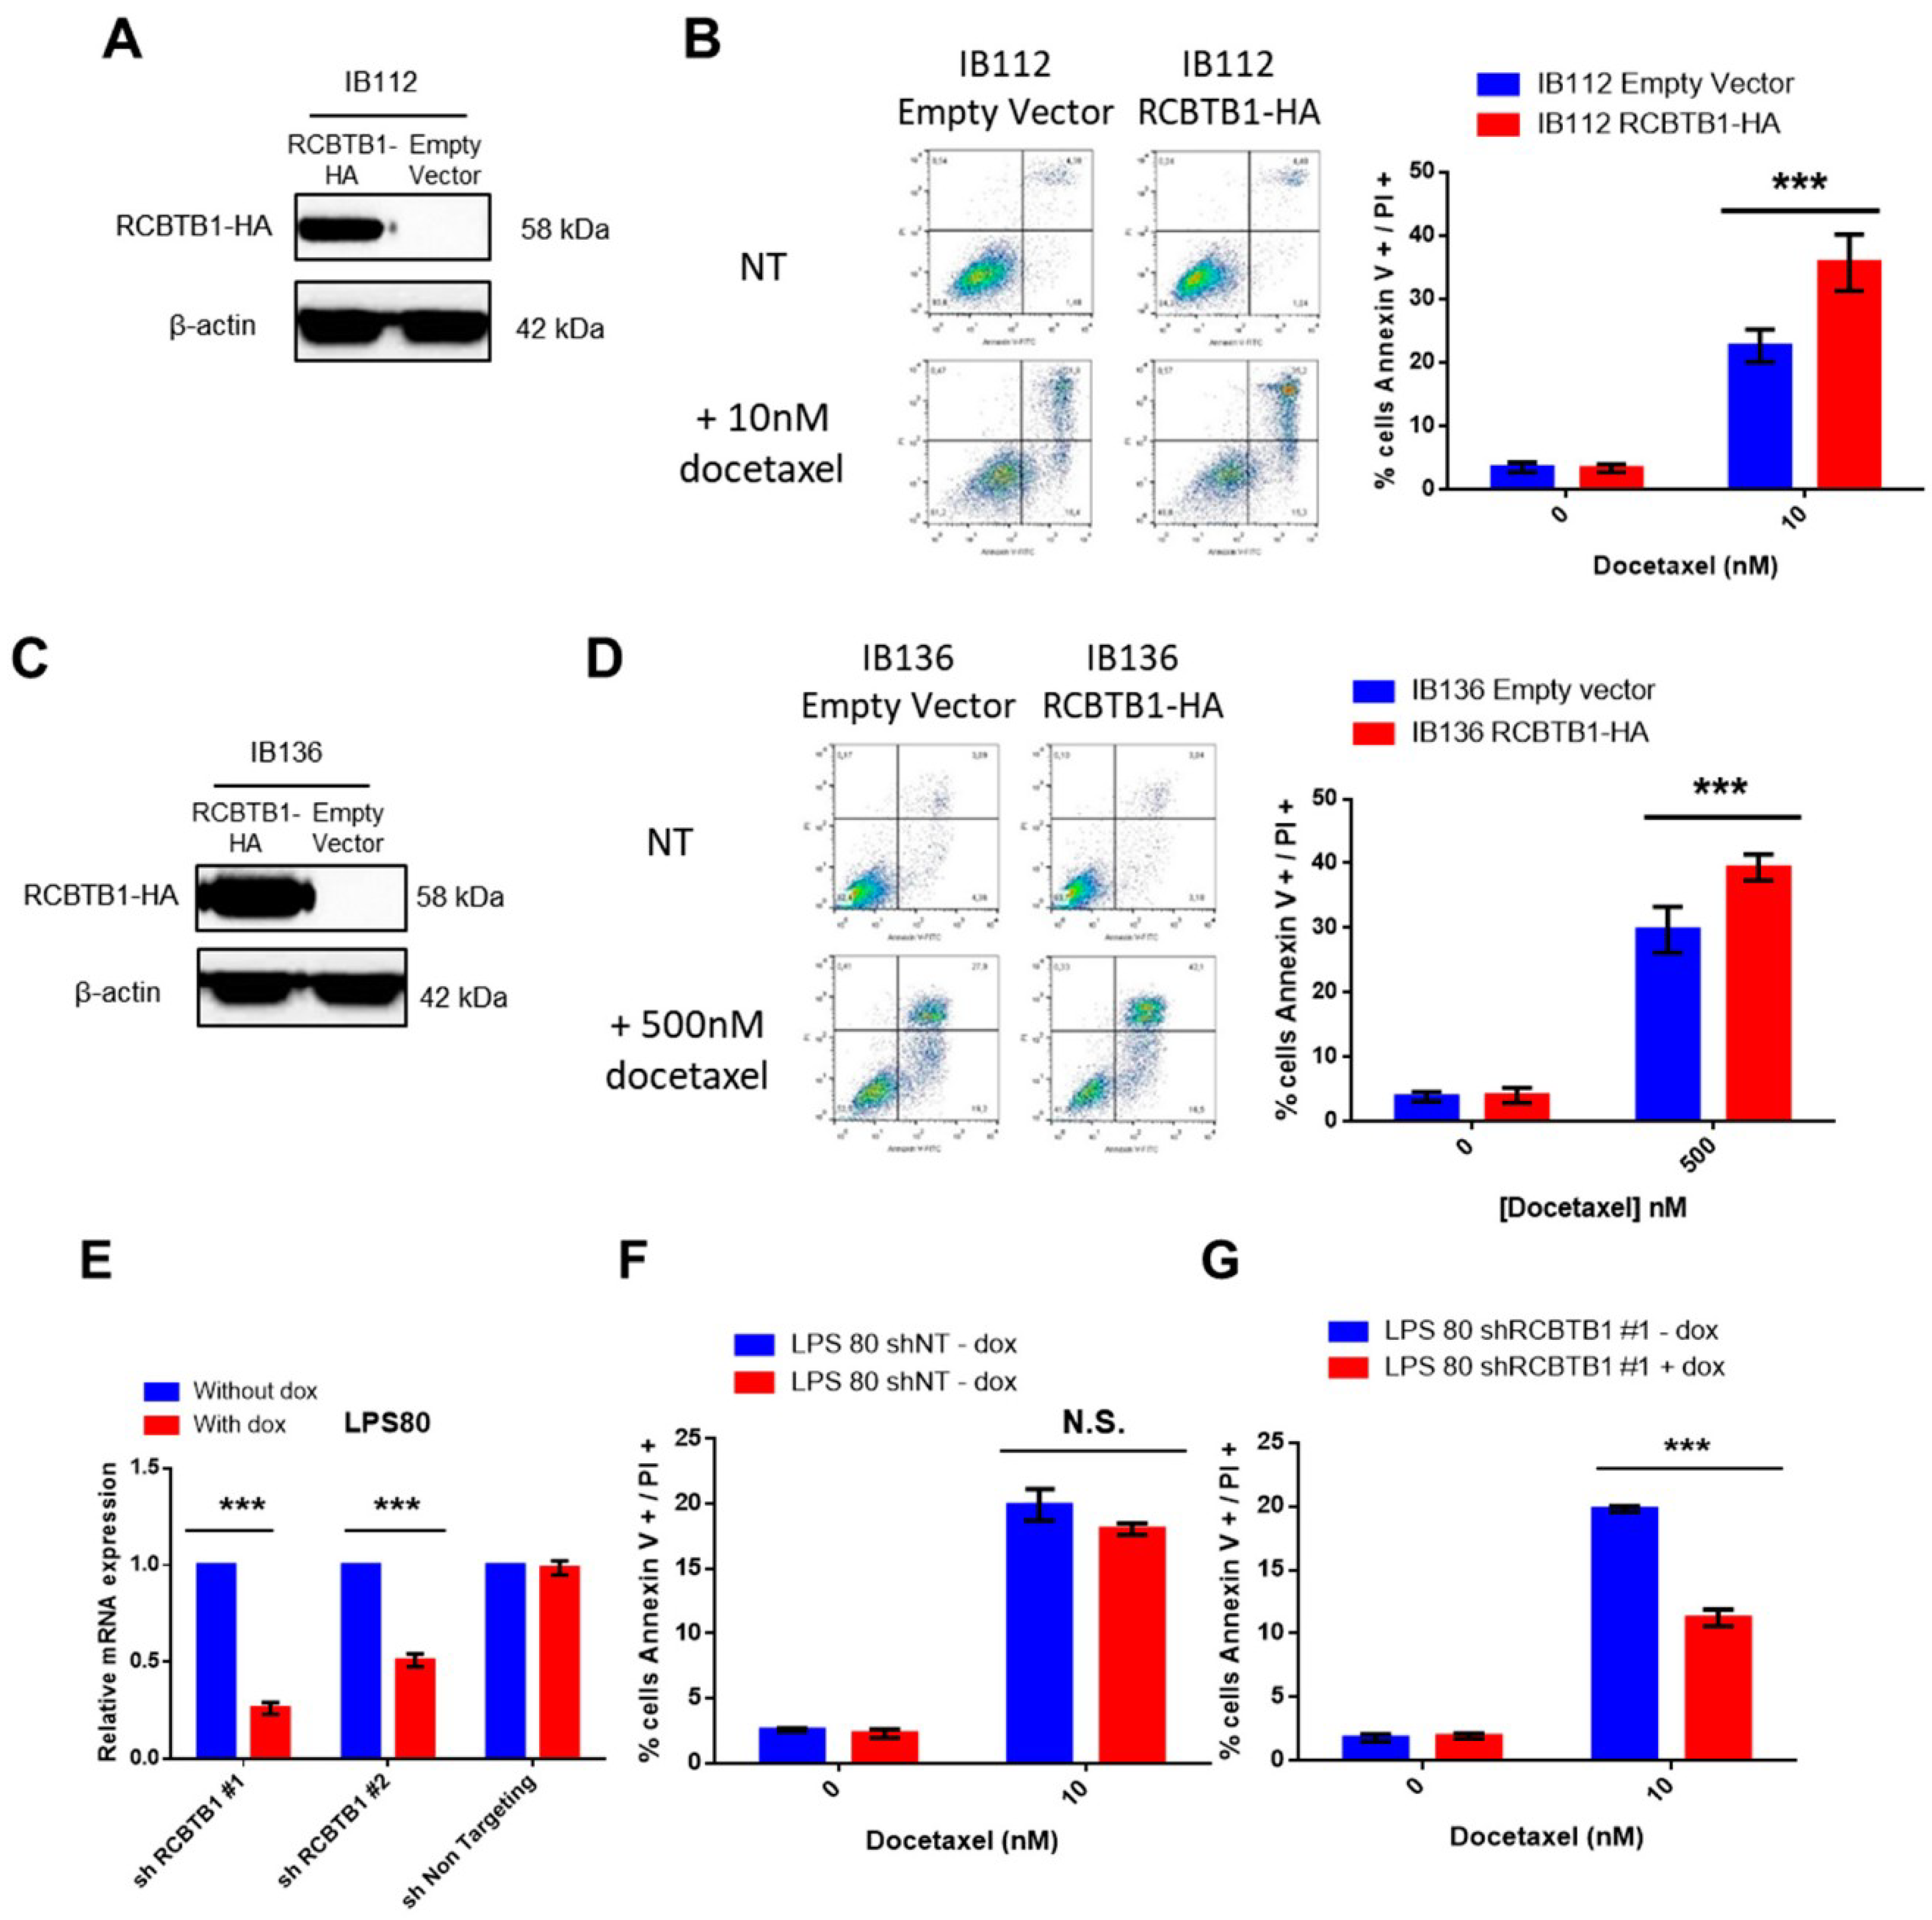
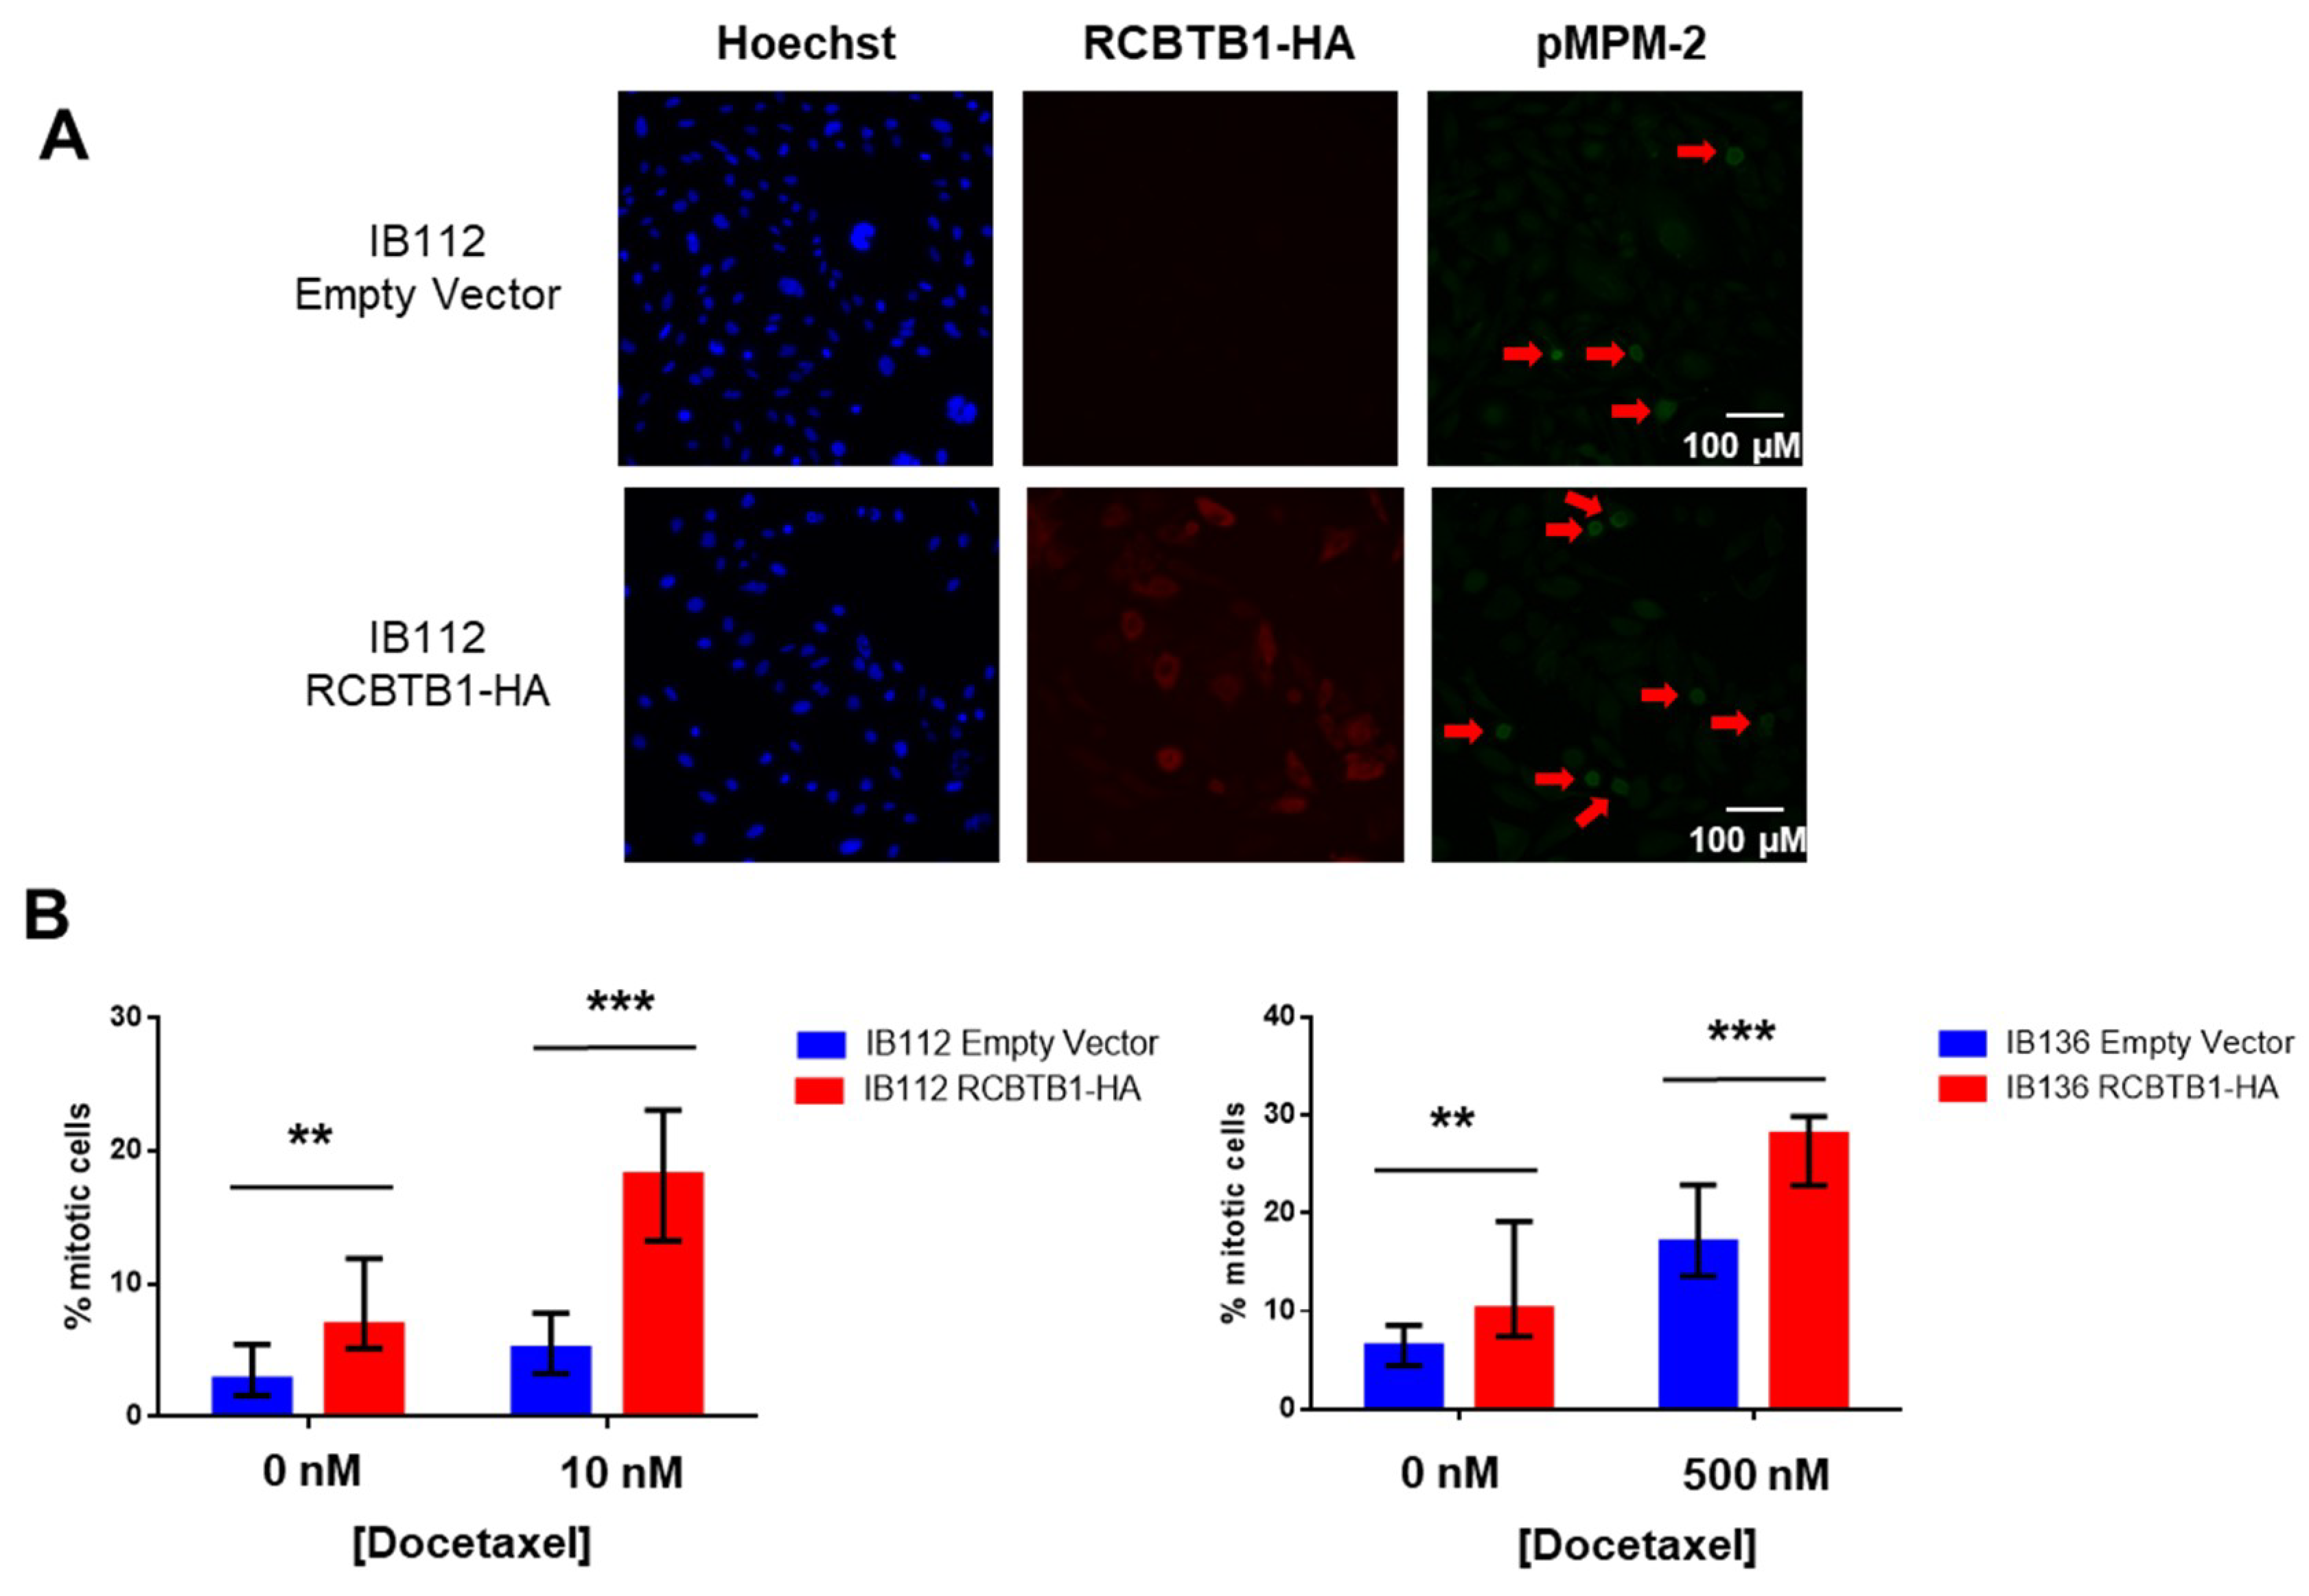
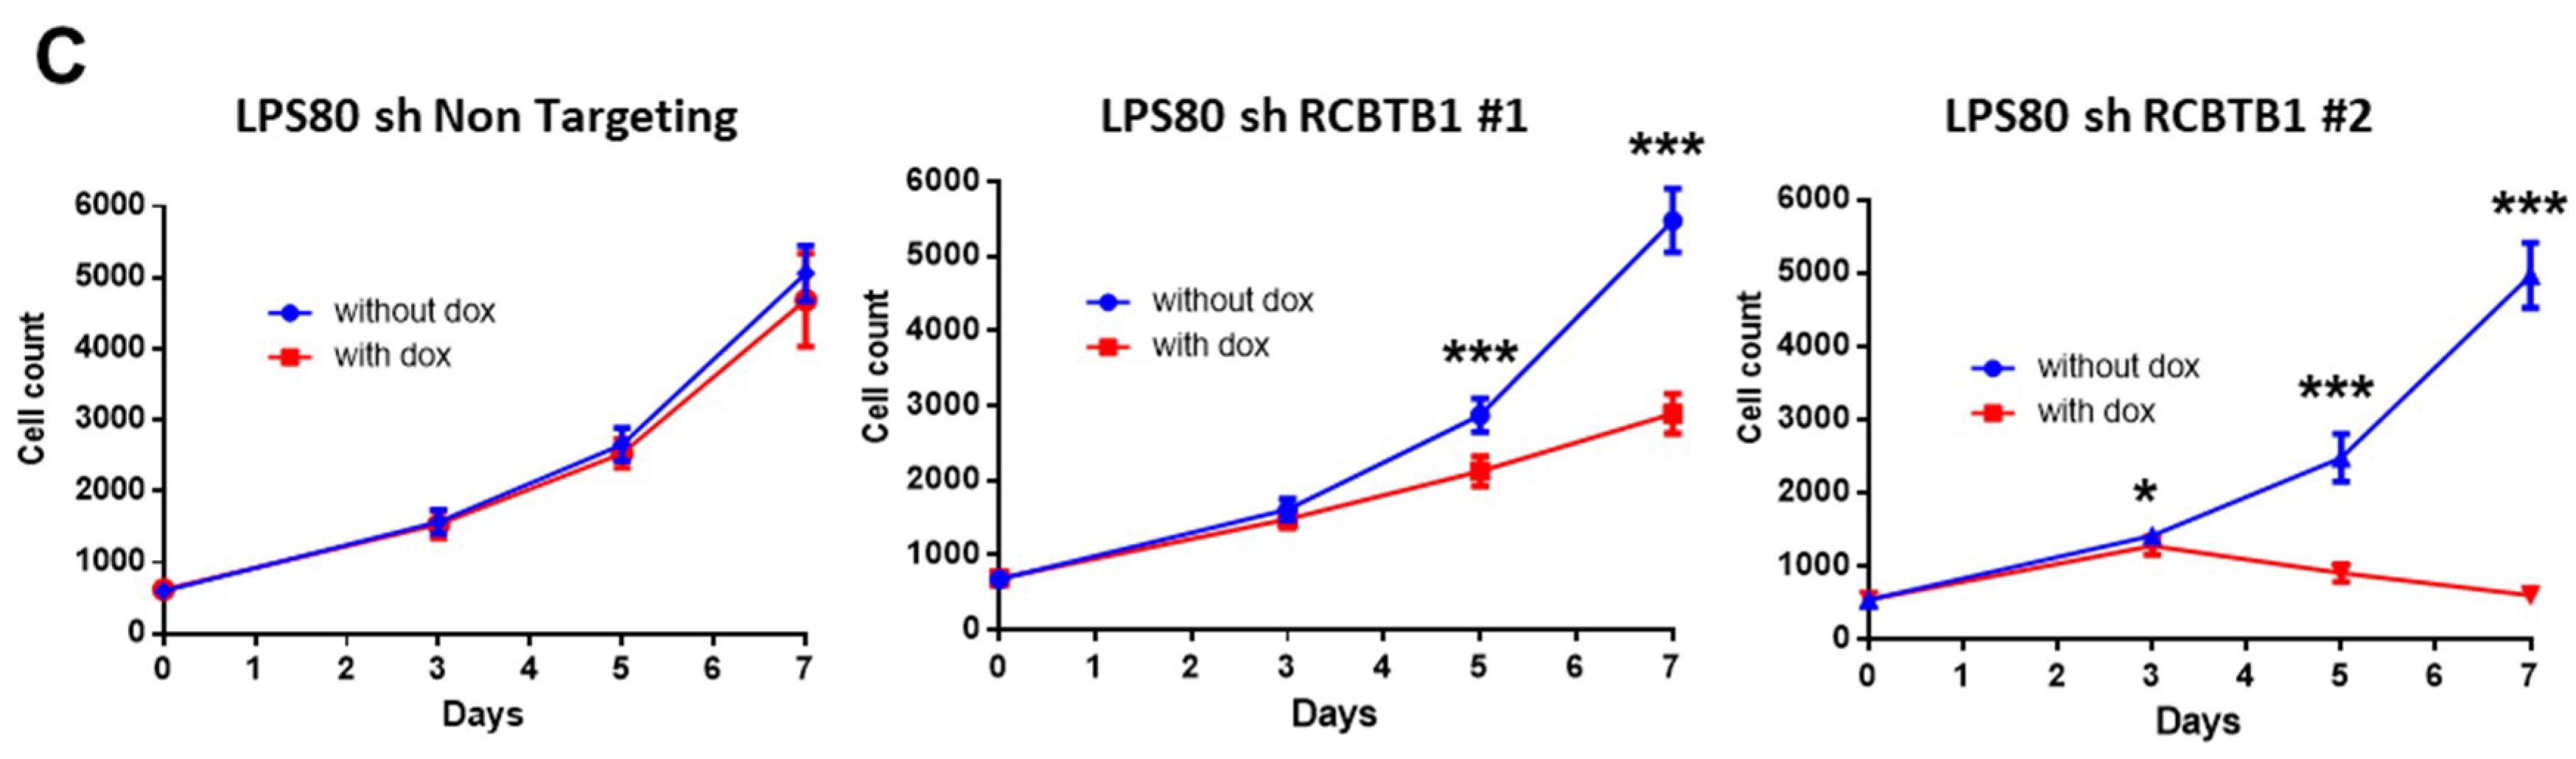
RCBTB1 expression impacts docetaxel-induced apoptosis in dedifferentiated liposarcoma (LPS80) and LMS (IB112, IB136) cell lines. In LPS80 cells,
RCBTB1 inhibition conferred resistance to docetaxel. Consistent with this observation, Lee et al. (2013) reported that
RCBTB1 inhibition protects in vitro liposarcoma cells from apoptosis induced by nocodazole [
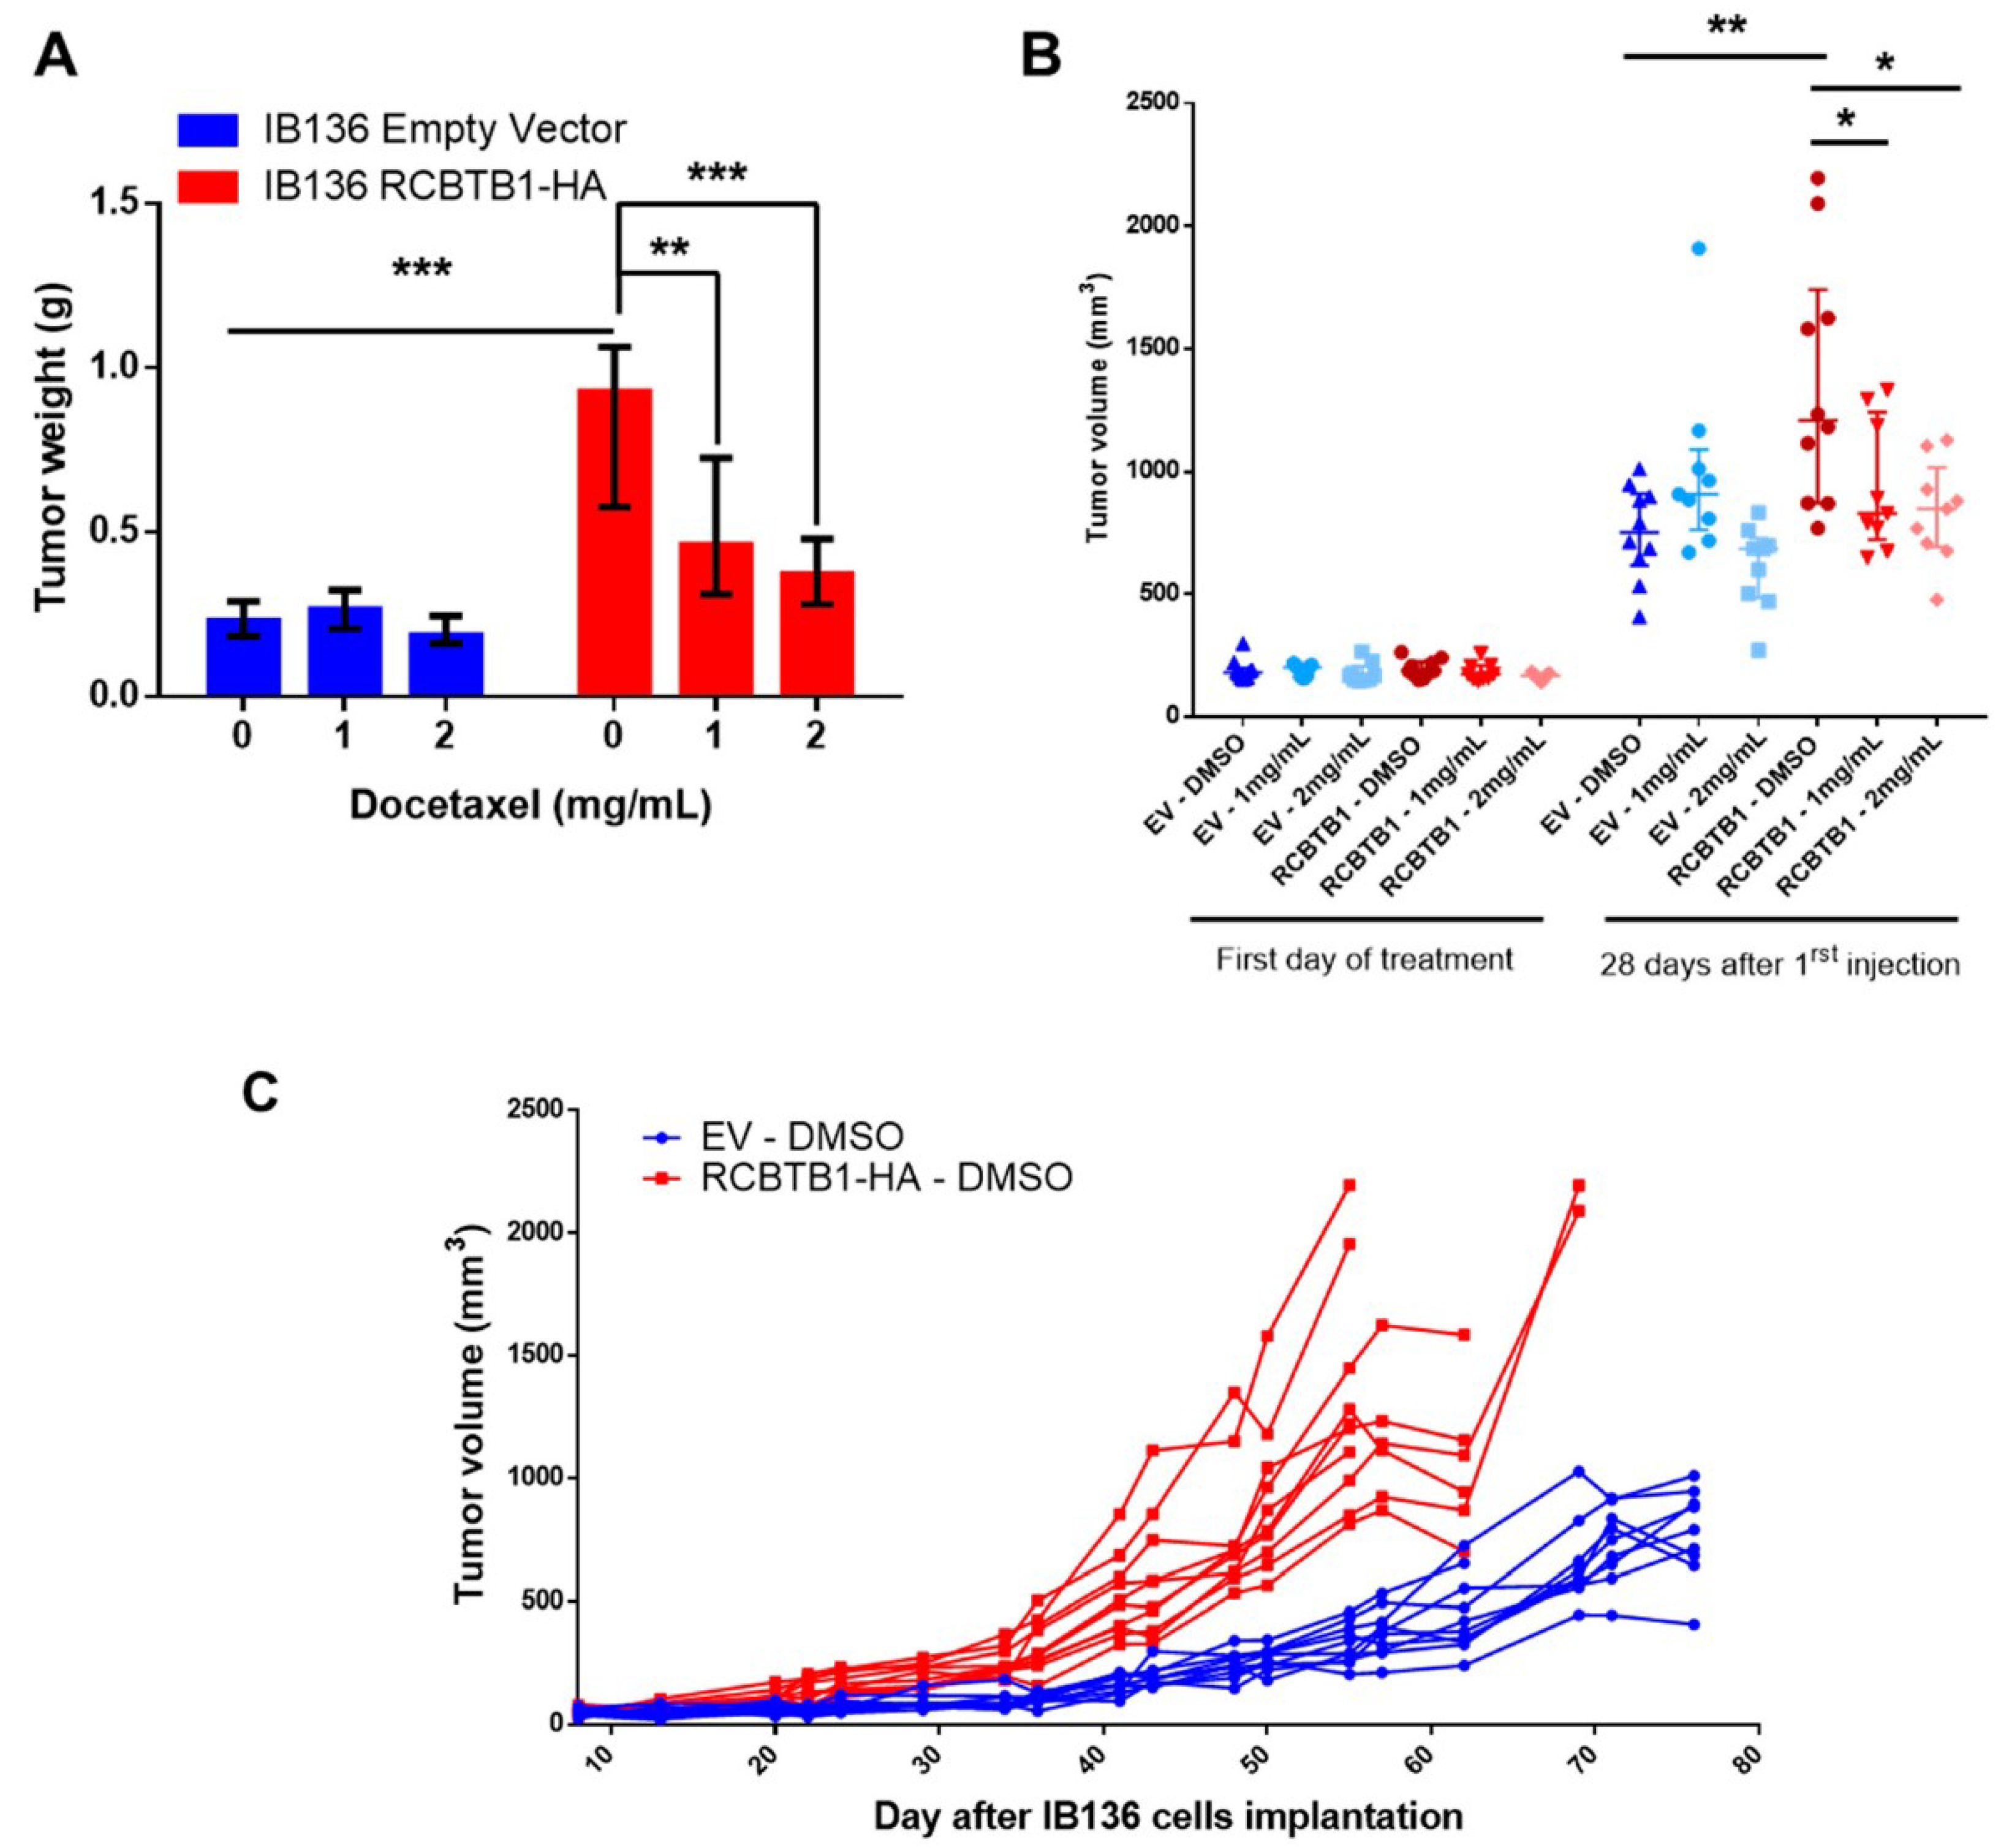
14], another inhibitor of microtubule polymerization. Conversely, in LMS cell lines overexpressing RCBTB1, we observed an enhanced apoptosis after docetaxel treatment. In vivo, IB136-RCBTB1-HA tumors were more sensitive to docetaxel treatment than tumors arising from the control cell line. These mechanistic insights should explain why the prognostic value of RCBTB1 is restricted to patients receiving chemotherapy. RCBTB1 expression loss or downregulation may represent a selective advantage for tumor cells during systemic treatments. Therefore, the next step would be to explore the predictive role of RCBTB1 expression on response to gemcitabine and docetaxel (GD) combination in the randomized study comparing gemcitabine alone (G) versus GD [
17]. One can hypothesize that GD and G will be equivalent in sarcomas harboring
RCBTB1 deletion whereas GD will be more effective than G on sarcomas with preserved
RCBTB1 expression. Nevertheless, although we did not observe in vitro any sensitization effect on IB112 cells after gemcitabine or doxorubicin treatment in our experimental conditions, it is not excluded that high
RCBTB1 expression could sensitize other sarcoma models to other chemotherapies than docetaxel. Indeed, Zhou et al. (2010) reported that downregulation of
RCBTB1 in epithelial cells reduces cisplatin-induced apoptosis [
15].
Unexpectedly, we also observed that higher expression of
RCBTB1 increases the proportion of mitotic LMS cells in vitro and promotes tumor growth in vivo. Reciprocally,
RCBTB1 downregulation dramatically decreased proliferation of dedifferentiated liposarcoma cells. These results are in conflict with the study of Zhou et al. (2010)
, which reported a growth suppressive activity of
RCBTB1 in U2OS cells in vitro [
15]. However, the impact of RCBTB1 on cell proliferation may be dependent on cellular context. Furthermore, its pro-proliferative action in our sarcoma cell lines provides at least one explanation for the efficacy of docetaxel, which targets mitotic cells, depending on the
RCBTB1 expression level.
The surprising pro-proliferative effect of RCBTB1 appears to be contradictory with our hypothesis of a tumor suppressor gene, coming out of our clinical data demonstrating that
RCBTB1 is frequently deleted and that its downregulation is prognostic for a higher risk for developing metastases. This assumption was also encouraged by the fact that
RCBTB1 is located in the 13q14 region [
15,
18], which comprises
RB1, a well-known tumor suppressor and among the most frequently altered gene in those sarcomas [
8]. The fact that
RCBTB1 and
RB1 have antagonistic roles in cell growth and are frequently co-deleted, as in 50% of our 106 sarcomas, suggests that
RCBTB1 may not be just a passenger gene affected by
RB1 deletion. Its inactivation in addition to
RB1 loss could avoid excessive cell proliferation, which could be deleterious for tumor development in terms of nutrient and energy expenditure for example but also in terms of response to treatment. Thus, co-deletion of
RCBTB1 and
RB1 might represent a selective advantage over cells only deleted for
RB1. This underlines also how carefully results arising from clinical data must be interpreted about the role of a commonly altered gene. Indeed, we notice here that RCBTB1 rather acts as an oncogene at cellular level by promoting tumor growth but might physiologically favor a less invasive phenotype, thus clinically appearing as tumor suppressor gene.
The idea that
RB1 is not the only target of the frequent deletions in this chromosomal region is reinforced by the fact that in the cohort of 106 sarcomas, 7% of tumors are deleted only for
RB1, whereas 13% carry a deletion that only affects
RCBTB1. Furthermore, in contrast to
RCBTB1,
RB1 is not associated with metastatic evolution in our cohort (
Supplementary Figure S5). This does not challenge the major and indisputable role of
RB1 in pleomorphic sarcoma oncogenesis, but rather suggests that, in our cohort, the prognostic value of
RCBTB1 is independent of
RB1 status. Altogether, this rules out the hypothesis that
RCBTB1 is only a passenger gene affected by
RB1 deletion. Deletion of this and other chromosomal regions could indeed participate in a larger oncogenic program based on copy number variations that simultaneously affect multiple weak drivers to exert a cumulative effect equivalent to a single potent driver [
19]. Furthermore, since we did not observe in vitro a direct effect of RCBTB1 on migratory capacities of sarcoma cells, this aspect should be examined in vivo, to understand if this negative result is due to the limitations of two-dimensional culture systems (absence of relevant microenvironment, no chemical or physical gradient, etc.) or if the link between RCBTB1 loss and metastasis mainly relies on adaptative capacities and selective advantage for cancer cells.
RCBTB1 deletion could possibly take part in the “Go or Grow” mechanism, which triggers a switch from a proliferative to an invasive phenotype in response to environmental stresses such as hypoxia, as demonstrated in other cancers [
20,
21]. This hypothesis offers new possibilities for investigation and could provide an additional explanation for the association between
RCBTB1 loss and metastatic progression.
Further investigation should identify the mechanisms and alterations that enable deleted cells (like IB112 and IB136) to continue the cell cycle, as
RCBTB1 downregulation dramatically decreases the proliferation of the LPS80 cell line. One research direction could be the regulation of sarcoma cell cycle by cullin3, which interacts with RCBTB1 for specific substrate degradation [
22], as described in other cellular models [
23]. Indeed, cullin3 recruits substrates for ubiquitination through polypeptide adaptors containing a BTB domain and these complexes have been reported as tumor suppressors since they regulate degradation of substrates involved in oxidative stress and cell cycle [
24,
25]. Consequently, RCBTB1 loss could result in accumulation of oncoproteins and in the dysregulation of cellular processes such as mitosis and microtubule dynamics, in turn leading to resistance towards anti-mitotic drugs. Understanding these mechanisms will probably shed light on a central role for
RCBTB1 deletion in tumor development, as suggested by our bioinformatic analysis and our in vivo experiments.
4. Materials and Methods
4.1. Ethics Statement
The samples used in this study are part of the Biological Resources Center of Institut Bergonié (CRB-IB, Bordeaux, France). In accordance with the French Public Health Code (articles L.1243-4 and R.1243-61), the CRB-IB has received the agreement from the French authorities to deliver samples for scientific research (number AC-2008-812). Expression and clinical data are extracted from ATGsarc database (
http://atg-sarc.sarcomabcb.org/; restricted access) which integrate array data and clinical annotations from declared and approved French Sarcoma Group databases. The sarcoma tumor banks and databases received authorizations from the Advisory Committee on Information Processing in Material Research in the Field of Health (CCTIRS) and the French Data Protection Authority (CNIL). The CCTIRS approval was obtained on 24 November 2009; CNIL approval (No. 909510) was obtained on 5 February 2010. Written informed consent was received from participants before inclusion in the study. Every case was histologically reviewed by the pathologist subgroup of the French Sarcoma Group and classified according to the 2013 World Health Organization classification by histology, immunohistochemistry, and molecular genetics when needed.
4.2. Sample Description
The first cohort (#1) is a training set of 106 sarcomas with complex genomics, with genomic and transcriptomic data. The second cohort (#2) is a validation set of 204 sarcomas analyzed by gene expression microarray. Cohorts #1 and #2 are described in
Table 1. The last cohort (#3, SRP057793) is a set of 145 sarcomas with RNA-seq expression, as previously described [
11]. Among the 145 tumors, 14 tumors were metastatic at the time of diagnosis.
4.3. Chemicals
Doxorubicin (Adriamycin; Pfizer, New York, NY, USA) and gemcitabine (Gemzar; Eli Lilly and Company, Neuilly-sur-Seine, France) were obtained from the pharmacy of the Institut Bergonié (Bordeaux, France). Docetaxel (Taxotere; Sanofi-Aventis, Gentilly, France) was obtained from Sigma Aldrich (#01885, St. Quentin Fallavier, France).
4.4. Cell Lines
Sarcoma cell lines were established as previously described [
25]. Authentication of cell line was performed by array CGH and compared with the corresponding original tumor. Sarcoma cell lines IB112, IB136, and LPS80 were cultured in RPMI-1640/GlutaMAX-I (Life Technologies Inc., brand of ThermoFisher Scientific, Waltham, MA, USA) supplemented with 10% Foetal Bovine Serum (FBS) and 1% penicillin–streptomycin (Life Technologies Inc.). The HEK-293T cell line was cultured in DMEM/GlutaMAX-I (Life Technologies Inc.) supplemented with 10% FBS and 1% penicillin–streptomycin (Life Technologies Inc.). Cells were grown at 37 °C in a humidified atmosphere containing 5% CO
2.
IB112 and IB136 were infected with a lentiviral vector containing the cDNA sequence of RCBTB1 coupled to the HA-tag under the control of a CMV promoter (EX-Z7772-Lv120, GeneCopoeia, Rockville, MD, USA). Control cell line was established with lentiviral transduction of an empty vector (pReceiver-Lv105, GeneCopoeia).
LPS80 was infected with a lentiviral vector containing a shRNA sequence under the control of Tet promoter. The control cell line expresses a shRNA targeting no human RNA (“sh Non-Targeting”).
Sequences of shRNA targeting RCBTB1: #1:CCGGGCTTATGTGGAAAGAAGATTACTCGAGTAATCTTCTTTCCACATAAGCTTTTTTG; #2: CCGGCTGGACAATGGCGAGGTATATCTCGAGATATACCTCGCCATTGTCCAGTTTTTTG.
Expression of shRNA is induced by doxycycline (2 µg/mL, #D9891, Sigma Aldrich, St. Quentin Fallavier, France).
For lentiviral transduction, Vesicular Stomatitis Virus Glycoprotein (VSV-G)-pseudotyped lentiviral particles were produced by co-transfection of 293T cells with previous vectors and the compatible packaging plasmids psPAX2 and pVSVg. Cell lines were incubated overnight with lentiviral supernatants in presence of polybrene (8 μg/mL, #H9268, Sigma Aldrich, St. Quentin Fallavier, France). Stably transduced cells were selected with addition of puromycin (2 µg/mL, #P9620, Sigma Aldrich, St.) into culture medium.
4.5. Comparative Genomic Hybridization (aCGH)
Genomic DNA was extracted using the standard phenol-chloroform extraction protocol [
7]. Affymetrix SNP array 6.0 (Affymetrix, brand of ThermoFisher Scientific, Waltham, MA, USA) was used according to the manufacturer’s instructions. Normalization of 106 samples and 5 normal control DNAs was performed with the Genotyping console 2.0 software (Affymetrix).
4.6. Gene Expression Microarray
Total RNAs were extracted as described previously [
8]. RNA quality was checked on an Agilent 2100 Bioanalyzer (Agilent Technologies, Santa Clara, CA, USA). Samples were then analyzed by Human Genome U133 Plus 2.0 array (Affymetrix), according to the manufacturer’s procedures.
4.7. Bioinformatics Analyses Pipeline for the Identification of Driver Genes
Data were analyzed with home-made Perl (v 5.10) and R scripts (2.14) and with the bioconductor package “GO.db”.
On the genomic array, probes meeting the following criteria were excluded: probes present in referenced constitutional copy number variation (CNV) regions, probes targeting sexual chromosomes, probes that are not localized in a gene and probes that are altered in control samples. In all, 512,055 probes were analyzed, representing 12,124 genes. A unique status was assigned to each gene based on the information gathered by all probes: normal, lost or gained. Among the 12,124 genes studied at the genomic level, 11,447 genes were present on the Affymetrix U133 Plus 2.0 array. For each gene, one probe was selected as representative of the expression of the gene, based on the maximum interquartile range (IQRmax) of all probes targeting the given gene. For further analysis, we considered that a gene was altered when its genomic status is lost or gained and when its expression is under the first quartile or above the third quartile of control group expression, which is calculated on at least 30 samples for which the genomic status of a given gene is normal.
Among the 11,447 genes studied at the transcriptomic level, 8527 genes were listed in the Gene Ontology (GO) at the time of the analysis. We considered that a GO biological pathway was involved in oncogenesis when at least one gene of the pathway was altered. The enrichment of a biological pathway or of an altered gene in a subgroup was tested with a Fisher’s exact test. A gene was considered as a candidate “driver” gene if both its biological pathway and its alteration were enriched in a subgroup.
4.8. RNA Sequencing
The process from RNA extraction to final BAM files was previously described [
11]. We used SAMtools and BCFtools (v0.1.19) [
26,
27] with custom depths (at least two alternate bases and five total bases) for reporting a candidate variant. These variants were then annotated by ANNOVAR (October 2013) [
28] with hg19 genome version, transcriptome annotations (November 2013) and following databases of observed variants: dbSNP (v138) [
29], 1000 G project (April 2012) [
30], ClinVar (September 2014) [
31], and COSMIC (v70) [
32].
4.9. Taqman Assay
cDNAs were synthesized from 1 μg of RNA using the GeneAmp RNA PCR core Kit (Applied Biosystems, brand of ThermoFisher Scientific, Waltham, MA, USA). Quantitative PCR analyses were performed using TaqMan Assays-on-demand Gene expression reagents (Applied Biosystems) with qPCR Mastermix Plus without UNG (Eurogentec, Seraing, Belgium). We used the TaqMan Gene Expression assays provided by Applied Biosystems. The assay IDs were as follows: Hs00216991_m1 for RCBTB1 and Hs99999902_m1 for RPLP0. For results normalization, RPLP0 was used as a reference gene.
4.10. Western Blot
Cells were rinsed with ice-cold PBS and lysed for 30 min at 4 °C in RIPA lysis and extraction buffer (#R0278, Sigma Aldrich, St.) supplemented with a protease/phosphatase inhibitor cocktail (#11697498001, Roche, Basel, Switzerland). Lysates were pelleted for 10 min at 13,000× g at 4 °C and supernatants were collected for protein quantitation (DC protein assay kit, Biorad, Hercules, CA, USA). After denaturation, 40 µg total proteins of each sample were separated by sodium dodecyl sulfate–polyacrylamide gel electrophoresis, and transferred to polyvinylidene difluoride membranes (iBlot2, ThermoFisher Scientific, Waltham, MA, USA) for membrane blocking and immunoblotting with the primary antibody (anti-HA, #sc-805, Santa Cruz Biotechnology, Dallas, TX, USA) at 4 °C overnight. After washing, blots were incubated for 1 h with a horseradish peroxidase-linked anti-rabbit antibody (Amersham, brand of GE Healthcare Europe GmbH, Velizy-Villacoublay, France) and processed for chemiluminescent substrate (Amersham ECL Select detection reagent kit, Sigma Aldrich, St.) according to the manufacturer’s instructions. Signal was detected using Fusion Fx7 (Thermo Fisher Scientific, Waltham, MA, USA) imaging system. β-actin (#A5316, Sigma Aldrich, St.) was used as a loading control.
4.11. Apoptosis Assay
To perform the assay, 75,000 cells were seeded into 12-well plates in three replicates. The day after, culture medium was replaced by drug-containing medium. After 72 h of incubation, cell death was measured by dual Annexin V-FITC/PI staining (#556547, BD Biosciences, San Jose, CA, USA) according to manufacturer’s recommendations. For doxorubicin, whose red coloration impairs PI staining, we analyzed only AnnexinV-FITC staining.
For each sample, 10,000 cells were analyzed by flow cytometry (FACS Calibur, BD Biosciences). Data were acquired using BD CellQuestPro software. Data analysis was performed with FlowJo v10.1 (FlowJo LLC, Ashland, OR, USA) and Prism6 v6.01 (GraphPad Software Inc., La Jolla, CA, USA) software.
4.12. In Vivo Experiments
NSG (NOD scid gamma, strain NOD.Cg-Prkdcscid Il2rgtm1Wjl/SzJ) mice received on the right flank a subcutaneous injection of 2.5 × 10⁶ cells. Tumor size was measured twice a week using a caliper and calculated using the formula: V = length × width2/2. When tumors reached a volume of 150 mm3, mice were treated with two intraperitoneal injections spaced by 4 days of DMSO or docetaxel at 1 mg/mL or docetaxel at 2 mg/mL. Twenty-eight days after the first treatment, mice were sacrificed. Tumors were recovered and weighed.
Animals were maintained under specific pathogen-free conditions in the animal facility of Bordeaux University (Bordeaux, France). Experiments were performed in conformity with the rules of the Institutional Animal Care and Use committee (approval number DIR13109) and all efforts were made to minimize animal suffering.
4.13. Immunofluorescence
Cells were seeded into 96-well imaging plates (#CLS3603, Sigma), incubated with drugs as indicated and fixed with 3.7% formaldehyde for 20 min at room temperature (RT). Then, cells were washed three times with PBS and permeabilized in 0.5% Triton X-100 for 5 min. Nonspecific binding was avoided by blocking with 0.2% gelatin/PBS for 30 min. Nuclei were stained with Hoechst 33,258 dye (Molecular Probes, brand of ThermoFisher Scientific, Waltham, MA, USA).
Staining was performed using a specific primary anti-HA (#sc-805 Santa Cruz Biotechnology, Dallas, TX, USA) antibody and anti-pMPM2 antibody (#05-368, Merck Millipore, brand of Merck KGaA, Darmstadt, Germany) overnight at 4 °C and a fluorescent secondary antibody conjugate (Alexa Fluor 488, anti-mouse and Alexa Fluor 594, anti-rabbit, Molecular Probes, brand of ThermoFisher Scientific, Waltham, MA, USA) for 1 h at RT. Cells were analyzed using a Leica DMi8 epifluorescent microscope (Leica Microsystems, Wetzlar, Germany) with appropriate filters. Pictures were captured using a Hamamatsu C11440-CCD camera and the Leica Application Suite X software (Leica Microsystems). To generate these results, three independent experiments with 15 replicates have been performed. For each replicate, four different fields were acquired. In this way, an average of 100 cells was analyzed for each replicate. The detection threshold for RCBTB1-HA-positive cells was set according to empty-vector expressing cells. For p-MPM2-positive cells, intense-green cells with mitotic figures (observed with Hoechst staining) were identified in control conditions, and the same detection threshold was applied to all conditions.
4.14. Proliferation Assays
In 96-well plates, 1000 cells were seeded in five replicates. Every 2 to 3 days, cells were washed, trypsinized, and harvested in a final volume of 200 µL PBS. The number of viable cells was evaluated by flow cytometry (FACS Calibur, BD Biosciences) based on their morphological features. Culture medium was changed at days 1, 3 and 6 with or without addition of doxycycline (2 µg/mL). Data were acquired using BD CellQuestPro software and analyzed using FlowJo (FlowJo LLC) and Prism6 v6.01 (GraphPad Software Inc., La Jolla, CA, USA) software.
4.15. Statistical Analysis
Metastasis-free survival (MFS) was defined as the interval between diagnosis and the time of distant recurrence or the last follow-up. Survival rates were estimated using the Kaplan-Meier method and compared using the log-rank test and hazard ratios (HR). Descriptive statistics were used to show the distribution of variables in the population. All statistical tests were two-sided, and p < 0.05 indicated statistical significance. All statistical analyses were carried out using the R statistical environment (v 3.3.2).
Each experiment was repeated at least three times. For examining the statistical significance of the results, analyses were performed with Prism6 v 6.01 (GraphPad Software Inc.) software. Normal distribution of data sets was examined with a Shapiro–Wilk normality test. If data passed normality test, statistical significance between two or more conditions was assessed with an unpaired t-test or an ANOVA (Holm–Sidak’s multiple comparisons test), respectively, and results were represented as mean ± SD. Otherwise, a Mann–Whitney test (for two groups) or a Kruskal–Wallis test (Dunn’s multiple comparisons test, to compare more than two groups) was used and medians with interquartile range (IQR) were plotted. Significant differences are represented as * if p-value p < 0.05, ** if p < 0.01 and *** if p < 0.001 on all figures.

 ,
, 


