1. Introduction
Infectious agents have long been hypothesized to contribute to lung carcinogenesis [
1,
2]. The Epstein-Barr virus (EBV) is an extremely ubiquitous human virus and is causally associated with a variety of lymphoproliferative and neoplastic disorders, including nasopharyngeal carcinoma, Burkitt’s lymphoma, Hodgkin’s disease, and gastric cancer [
3]. EBV may be associated with lung cancers (LC) since a higher EBV seropositivity was observed in LC patients compared to the one seen in the healthy control individuals [
4,
5]. EBV has been detected in the bronchoalveolar fluid collected from LC patients, indicating that the lung tissue may serve as a potential EBV reservoir [
6]. The first EBV-positive LC case was reported by Begin and colleagues in 1987 [
7] and histologically it seems that the EBV-positive LCs are more likely to be the primary pulmonary lymphoepithelioma-like carcinoma, a relatively rare form of non-small cell lung cancer (NSCLC) preferentially occurring in Asian patients [
8,
9,
10,
11,
12,
13]. Meanwhile, the presence of EBV in lung squamous-cell carcinomas (LUSC) and lung adenocarcinomas (LUAD) was also reported by several studies [
14,
15,
16,
17,
18,
19,
20].
To date, the association of EBV and LC remains inconclusive, since quite a few studies of EBV in LC have produced negative results [
21,
22,
23]. Notably, previous studies exclusively relied on traditional detection methods such as histology staining and polymerase chain reaction (PCR) to detect the EBV DNA and/or RNA. Although they are important methods, their intrinsic limitations (e.g., PCR false priming, usage of inappropriate/biased detection markers, etc.) can also lead to false discovery and/or controversy.
Recently, the next-generation sequencing (NGS) technology has been successfully applied to the discovery and interrogation of numerous cancer-associated pathogens. This approach utilizes an unbiased method to globally assess all the exogenous microbes within a cancer sample with high sensitivity and specificity. Several research groups including ours have successfully utilized NGS techniques and especially high-throughput RNA sequencing (RNA-seq) for the discovery and interrogation of exogenous pathogens associated with various types of cancers [
24,
25,
26,
27,
28,
29,
30,
31,
32,
33,
34]. To date, this technology has helped us not only discover new tumor-associated pathogens, but also elucidate previous false discoveries.
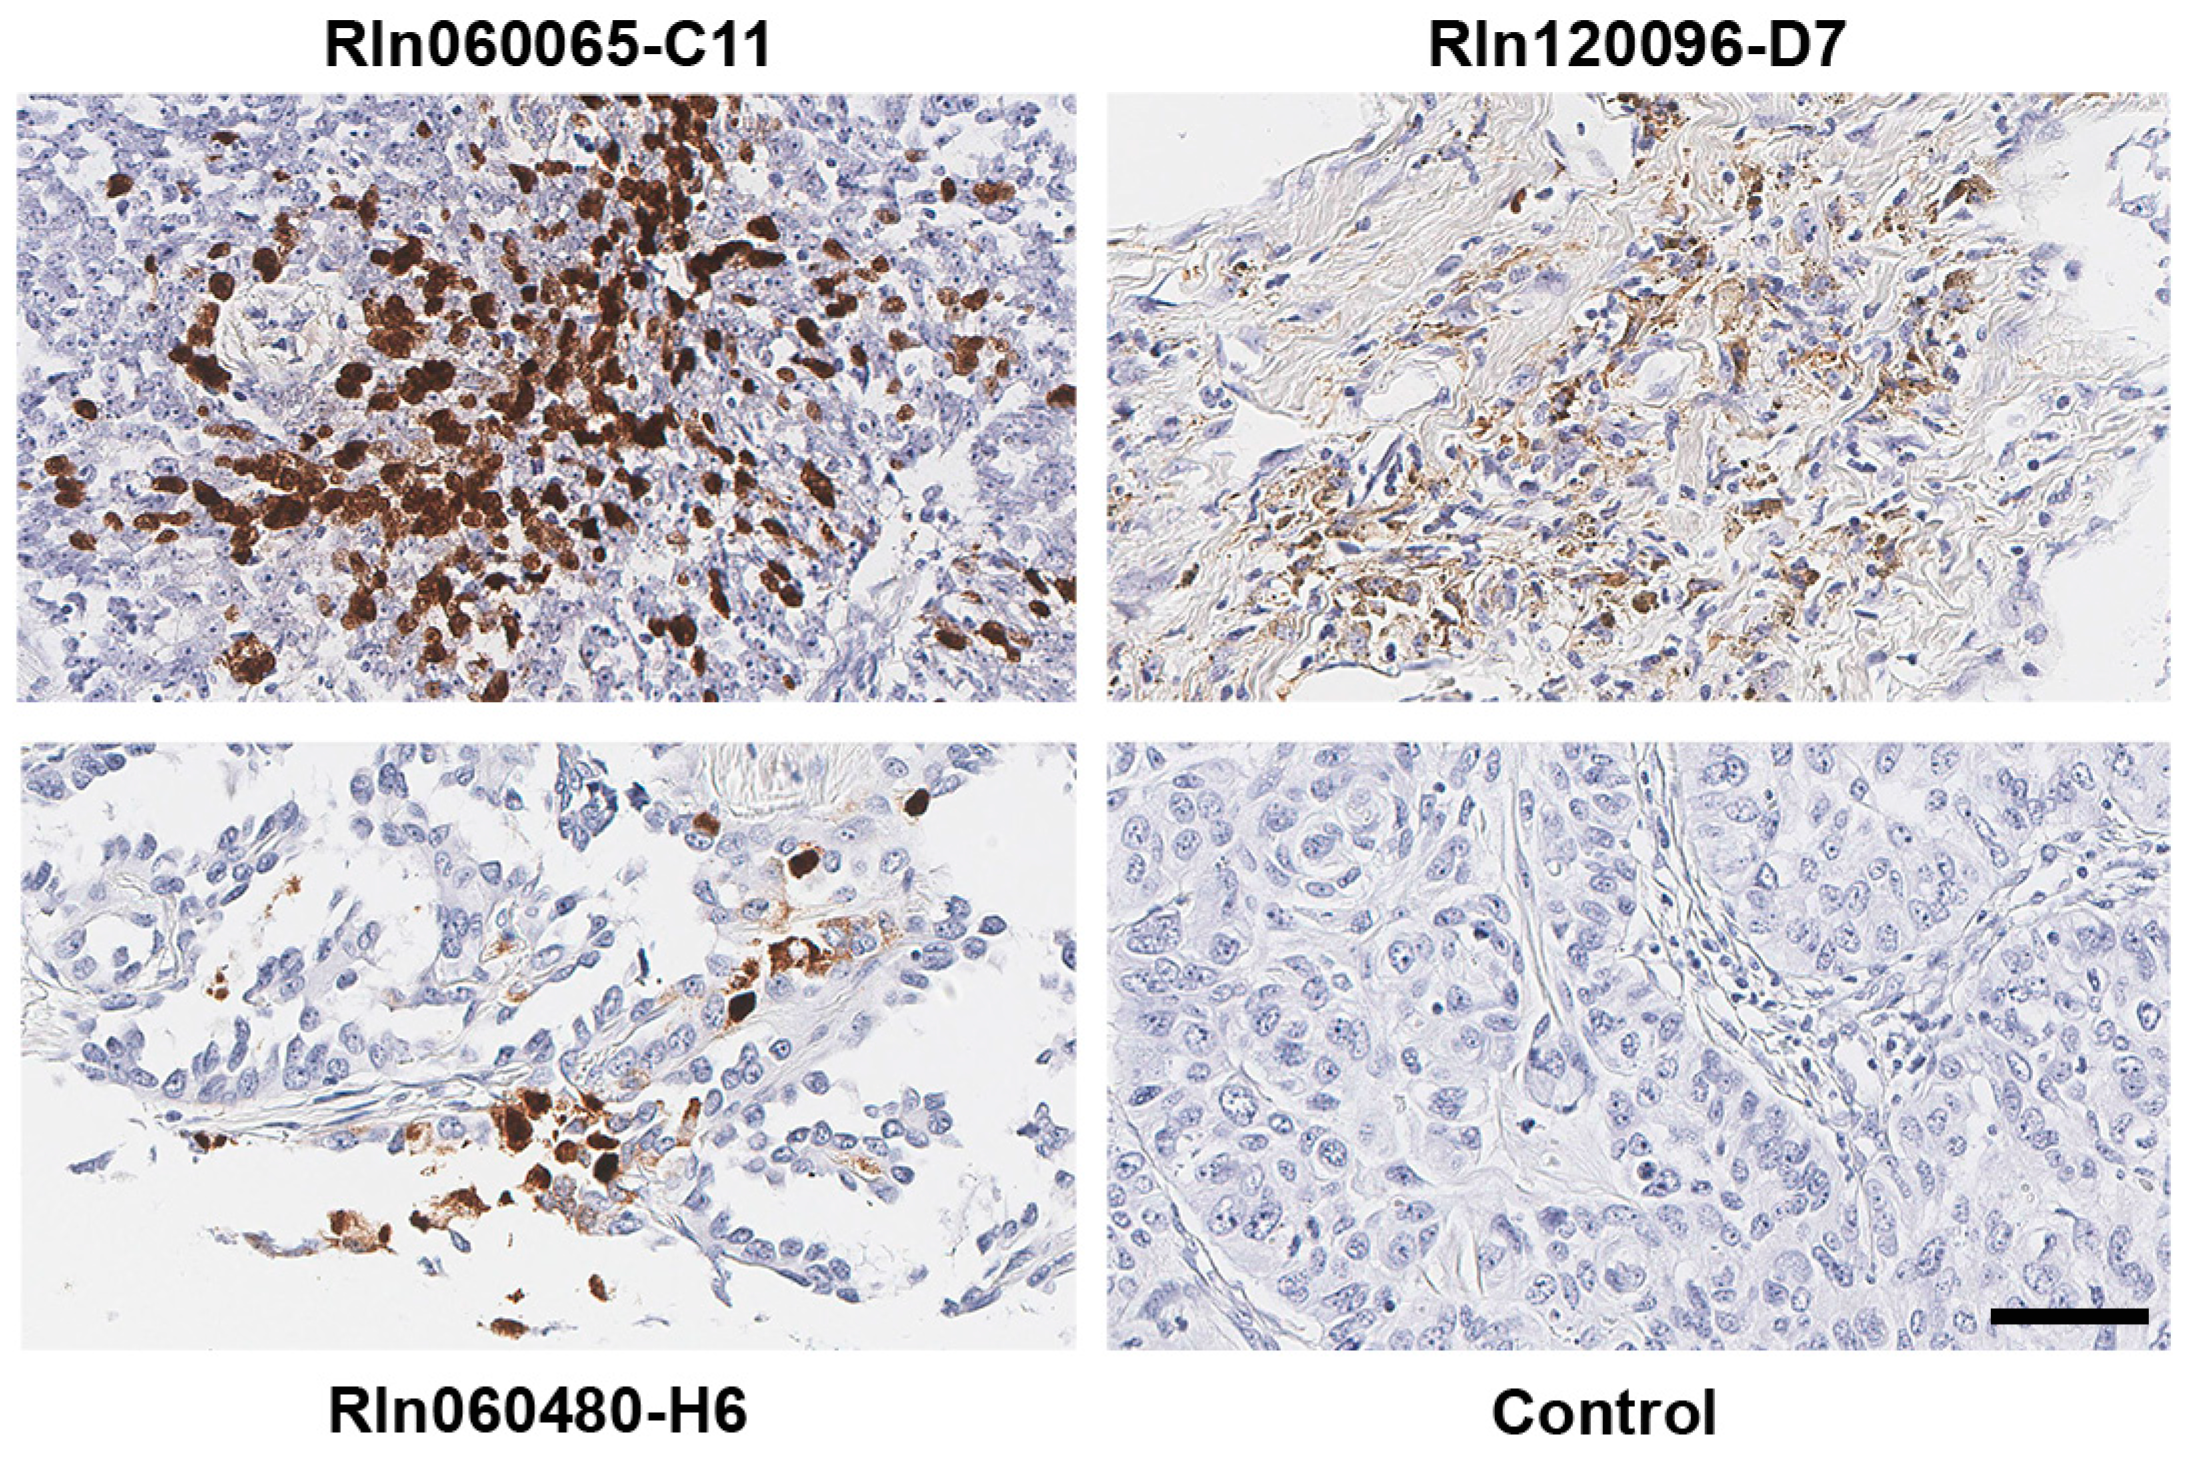
Although EBV is likely associated with a subtype of non-small cell lung cancers, the conclusion remains controversial. To resolve this long-standing controversy, we utilized our unbiased NGS-based informatics approaches together with traditional molecular methods to investigate the role of EBV in a total of 1127 LC (including 1017 LC RNA-seq data sets plus 110 LC tissue samples). As far as we know, the magnitude of such screening work for EBV infection in LC has not been reported before, and we reasoned that the sample size should be sufficient for us to draw a definitive conclusion of whether EBV is associated with LC. We first analyzed the expression of EBV transcripts in LC cells by staining 110 LC plus 10 paired normal lung tissue sections. Strong EBV-encoded RNA (EBER) signals were detected in tumor cells in 3 LC samples. However, we did not detect any EBER signals in the tumor-infiltrating immune cells among 110 LC samples, indicating the scarcity of EBV-positive immune cells infiltrated in the LC tissues. Further, to investigate the presence of EBV in a broader lung cancer patient population, we utilized our sequencing-based approaches to examine the EBV infection in a total of 1017 human non-small lung cancer as well as 110 paired adjacent normal lung tissue samples from the NIH’s The Cancer Genome Atlas (TCGA) project. The presence of EBV was determined by its transcriptional activity using our recently created computational pipeline RNA CoMPASS [
28,
29,
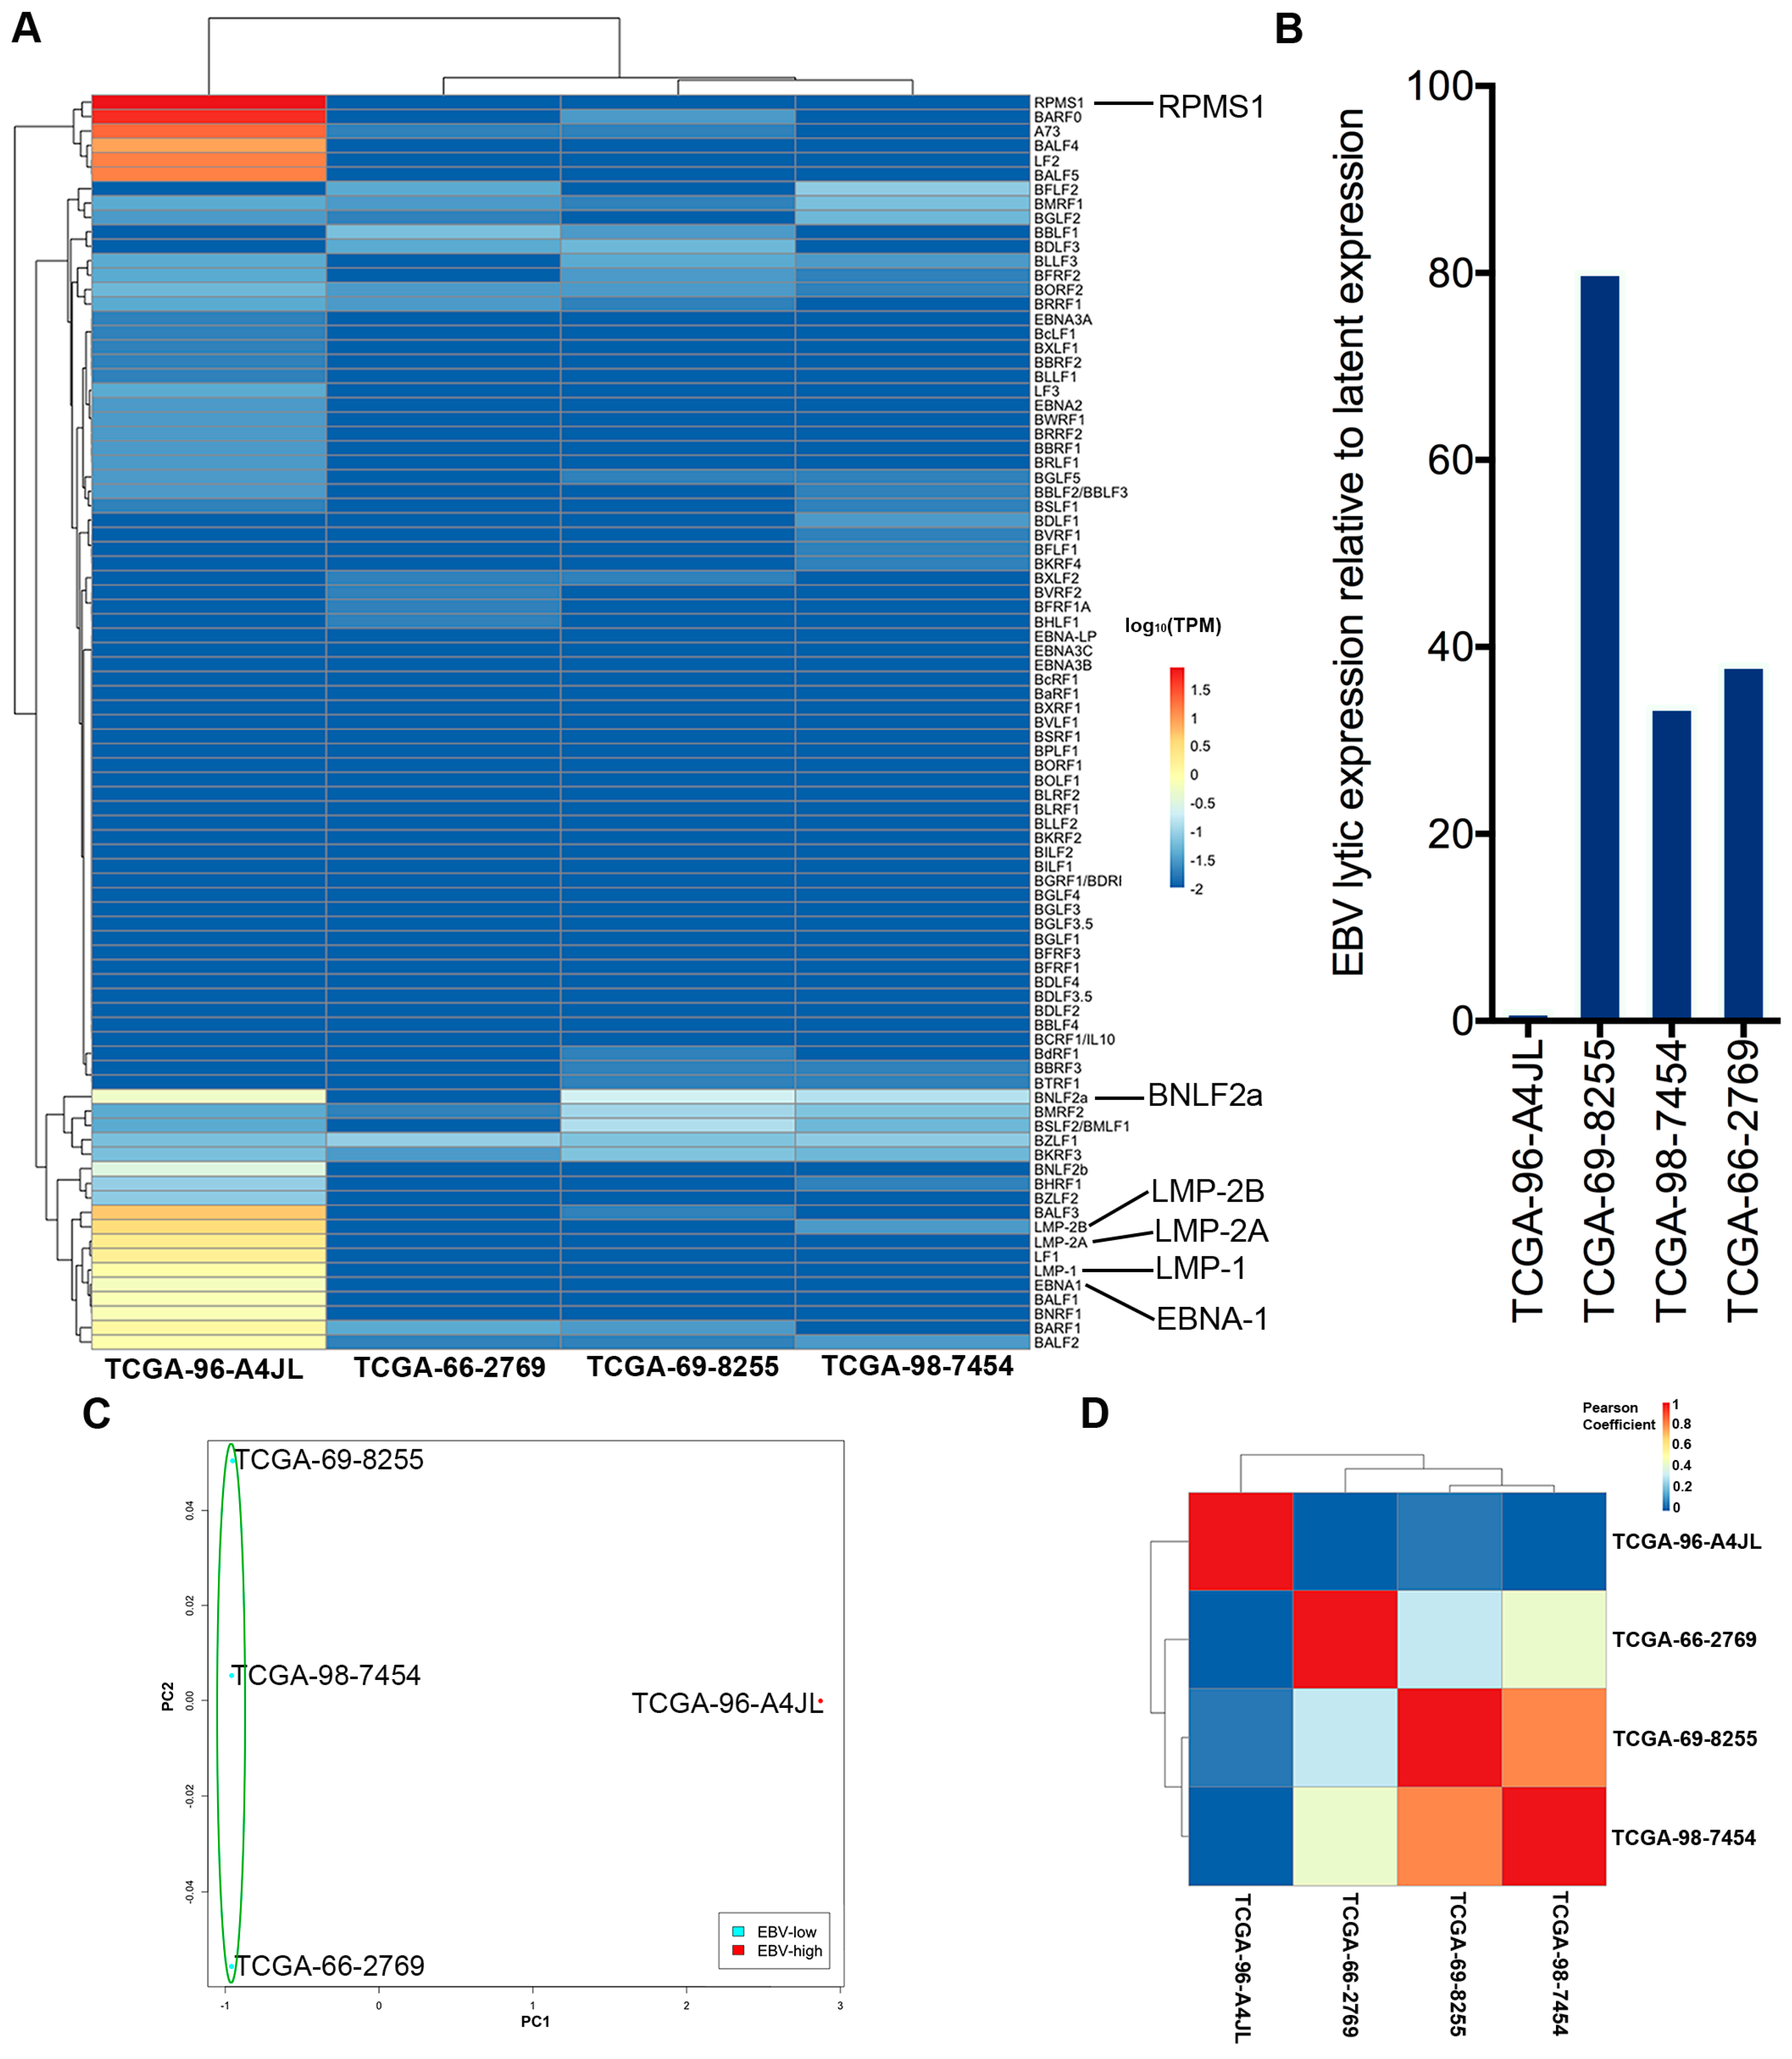
35]. EBV was detected in 4 out of 1017 NSCLC samples and the complete viral transcriptome structure was assessed. To the best of our knowledge, this is the first study to globally assess both EBV and its host transcriptomes in the lung cancer settings using RNA-seq. We for the first time revealed a type II latency-like viral transcriptome in the setting of LC in vivo. We also discovered high-level expression of viral BamHI A transcripts in LC, suggesting a functional role of these transcripts in LC development. In other EBV-associated cancers such as nasopharyngeal carcinomas, EBV is known to regulate the tumor immune microenvironment to facilitate tumor development. Interestingly, in the context of lung cancers, an increased immune cell infiltration was observed in the sample expressing high levels of EBV transcripts relative to samples expressing low EBV transcripts. Increased levels of immune checkpoint blockade factors were also detected in the sample with higher levels of EBV transcripts, indicating an induced immune tolerance. Lastly, our pathway analysis shows inhibition of immune pathways and activation of oncogenic pathways in the sample with high EBV transcripts, suggesting the direct regulation of tumor pathways by EBV.
Overall, our current study strongly indicates that EBV is not a major carcinogen for LC in general, but EBV may play a critical role to promote the development of a subset of lung squamous cell carcinoma and lung adenocarcinoma cases. Our data also led to significant insights into the EBV-host interactions and the mechanisms through which EBV promotes lung carcinogenesis.
3. Discussion
Although smoking is a key risk factor for lung cancer development, the incidence of lung cancer is slowly declining even after the dramatic reduction of smoking through public health awareness movement. Only 10–20% of total smokers develop lung cancer [
52]. Further, around 15% of male lung cancer patients and 53% of female lung cancer patients are never smokers, and lung cancer is believed to be the 7th most common cause of cancer death in never smokers [
53], indicating other etiological factors for lung cancer development.
EBV has been previously proposed to be associated with certain subtypes of lung cancer, but that conclusion was exclusively based on the results from traditional viral screening methods such as PCR. Due to the inherent limitations of those traditional screening methods (such as PCR priming issues, usage of inappropriate/biased detection markers, etc.), the reported EBV-lung cancer association was questionable. Here, in addition to the PCR-based method, we utilized an RNA-seq based informatics approach to comprehensively interrogate the involvement of EBV in the lung cancer in an unbiased and more accurate manner. Our analyzed data sets were derived from samples collected in nine countries such as the United States, Germany, Australia, etc. The patient population is not restricted to a particular race but includes Caucasians, Blacks, and Asians. The total number of RNA-seq data sets is 1127 (
Figure 2C). To the best of our knowledge, the magnitude of such screening work for EBV infection in lung cancer has not been reported before.
By doing in situ hybridization, we detected EBERs in non-small lung cancer cells but not the infiltrating immune cells. It suggests that EBV can indeed infect lung cancer cells. Meanwhile, our virome screening analyses of the TCGA data sets demonstrate that 4 cases with EBV positivity, but only the EBV-high sample undoubtedly represents a bona fide latent EBV infection of tumor cells. Although less likely, we cannot totally rule out the possibility that EBV reads detected in the 3 EBV-low samples are partially derived from the infiltrating EBV-positive immune B cells. If that is the case, the true EBV infection rate in the analyzed TCGA cohort is no more than 0.4%. This low EBV infection rate indicates that EBV is unlikely to play a significant role in the development of lung cancers in general, but may contribute to the development of a subset of lung cancer cases. In areas where EBV-associated cancers are endemic, such as sub-Saharan Africa and Southeast Asia, the connection between EBV and lung cancer may be more prevalent.
Another rational explanation for the observed low EBV incidence rate is that EBV may utilize the hit-and-run strategy to infect lung epithelial cells, which subsequently contributes to lung cancer development [
54]. The transient presence of EBV genomes can potentially cause some genetic scars in the host cells and lead to a permanent alternation of cellular gene expression and promote tumorigenesis. In accordance, a recent study reported that EBV may promote breast cancer development using the hit-and-run mechanism [
55].
Notably, the only EBV-high sample from the TCGA cohort was collected from an Asian female patient (
Table 6). This is consistent with the notion that the Asian population is more susceptible to EBV-associated lung cancer [
20,
56]. Our results support previous findings that in the lung cancer setting EBV is not restricted to the lymphoepithelioma-like carcinoma (LELC) subtype [
14,
15,
16,
17,
18,
19,
20]. Moreover, the EBV-high sample was collected from a never-smoking patient, indicating that EBV may promote lung carcinogenesis in a smoking independent manner. Although speculative, these findings offer a plausible explanation for the high incidence of lung cancer in never smoking Asian women [
57].
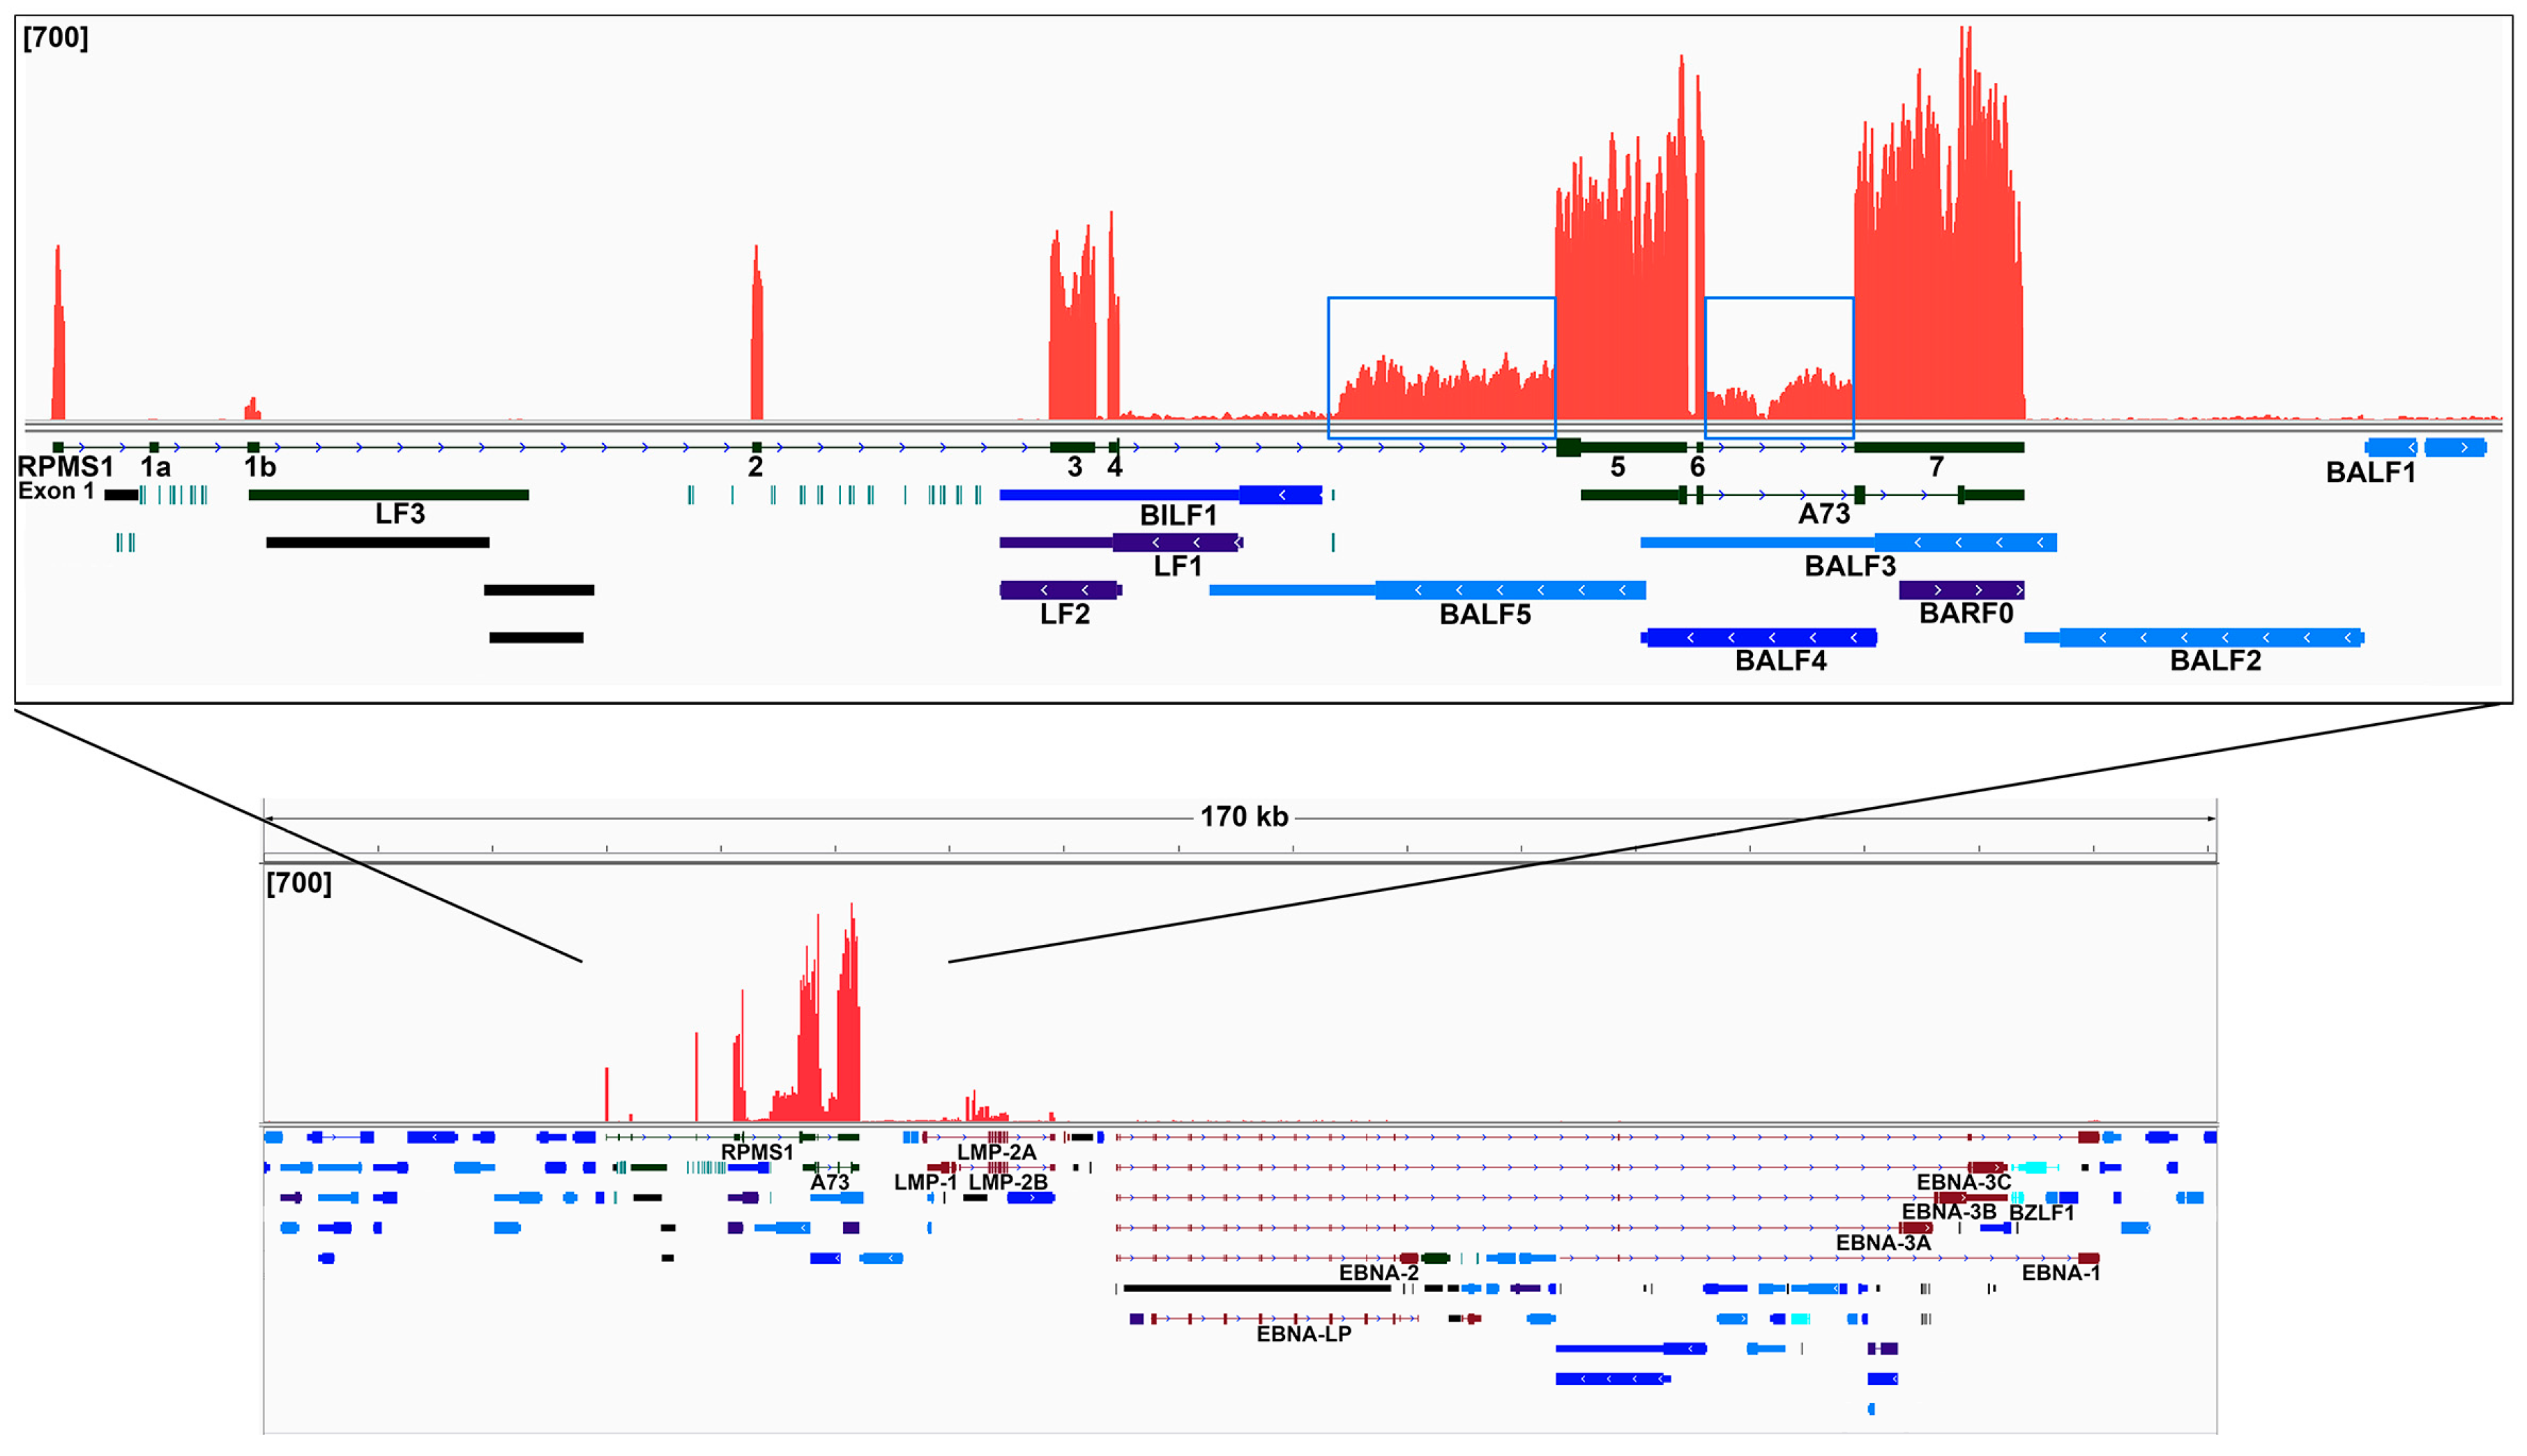
Since EBV may underlie the pathogenesis of some lung cancers, it is important to determine how EBV interacts with the host cells. Our analyses detect a type II latency-like EBV transcriptome in lung cancer, which mimics the viral gene expression pattern seen in the EBV associated gastric cancer. The high levels of BamHI A transcripts detected in the EBV-high lung cancer sample are consistent with true EBV latency, since BamHI A transcripts are more highly expressed in the infected epithelial cells than in B cells. We also detected transcripts from two novel regions within the BamHI A segment, the region between exons 4 and 5, as well as between exons 6 and 7. Since the coverage of reads starts in the middle of the intron between exons 4 and 5, there is likely a new transcription initiation site or a new splice acceptor site within this intron. We did not detect any splicing event near the beginning of this intron coverage. Therefore, we reasoned that a hidden upstream promoter may initiate this transcript and it is responsible for the observed coverage. Further analysis is warranted to characterize this region for new genes or new transcript isoforms.
Our analyses of RNA-seq evaluate transcript structures and quantify the expression of BamHI A region genes compared to other viral and cellular genes. Although previous studies have been unable to detect protein from naturally expressed BamHI A rightward transcripts [
58,
59], the high expression level of these transcripts in EBV-high NSCLC sample suggests a functional role in lung cancers, possibly as long non-coding RNAs (lncRNA), which has been previously proposed in the EBV(+) gastric cancers [
60]. Many lncRNAs function in complexes that repress transcription, which raises the possibility that the rightward BamHI A transcripts function as lncRNAs that selectively repress cellular gene expression in EBV-high NSCLCs. These rightward BamHI A transcripts also encode at least 44 intronic BART microRNAs (miRNAs). The function of these BART miRNAs in the EBV’s life cycle and in EBV-associated cancers have been previously explored [
61]. The high expression level of the BamHI A rightward transcripts in lung cancer would facilitate a significant role in modulating the cellular phenotype by BART miRNAs in this tumor type. In addition, the new coverage region detected in the RPMS1 and A73 region indicates that additional rightward exons/genes are present within this region and they may similarly play a role in noncoding RNA-mediated modulation of cellular function.
Previously, we and others have identified novel alternative splicing events of LMP2A in EBV associated cancers [
62,
63,
64]. Here, the sequencing depth of the EBV-high LC allows us to further characterize the transcript structure of LMP2A in the setting of LCs. In accord with the previous observation in the EBV(+) ENKTL (extra-nodal NK/T-cell lymphoma) and CAEBV (chronic active EBV) samples, classical splicing event between the first exon (exon 1A) and exon 2 of LMP2A was not detected (
Supplementary Figure S3). The read coverage of the intronic region next to the 5′ end of exon 2 indicates that an alternative promoter may be utilized to initiate the LMP2A transcription in EBV(+) lung cancers (
Supplementary Figure S3 inset). Furthermore, a novel splicing event between splicing sites located within LMP2A exon 2 and RPMS1 exon 7 was also detected. Thus, together with previous findings, our data indicate that the alternative splicing of LMP2A may be more common than we previously expected and it may play important regulatory and functional roles in EBV’s life cycle and pathogenesis.
We detected a high level of EBV BNLF2a gene expression in the absence of significant expression of other viral lytic genes in the EBV-high NSCLC sample. BNLF2a is an early lytic phase protein that suppresses immune detection of the EBV infected cells by blocking antigen presentation through inhibition of peptide loading onto the major histocompatibility complex (MHC) class I molecules [
30,
65,
66,
67,
68,
69]. Previously, we found that BNLF2a is expressed in a good portion of EBV- associated gastric cancers and EBV(+) gastric cancer cell lines [
28,
30]. Expression of BNLF2a with EBNA-1 and LMP-2 in the absence of reactivation suggests a new latency program. Thus, a subset of lung and gastric cancers may possess an EBV-associated etiology characterized by immune tolerance promoted by BNLF2a.
We reported previously that gastric carcinomas with high levels of EBV reads exhibit activation of distinctive pathways, compared to samples with low/no EBV reads [
28]. Here, using this established approach in the EBV-high NSCLC sample, we detected activation of EBV-associated oncogenic pathways and inhibition of multiple tumor suppressors. Moreover, our computational assessment of immune cell infiltration was confirmed in the stained tissue section from the EBV-high sample. Despite this heightened influx of immune cells, EBV-positive tumor cells persist in the patient. We reasoned that the tumor may have successfully employed certain immune evasion strategies perhaps facilitated by BNLF2a that allow virus/tumor survival. First, the limited expression of viral protein-coding genes in the EBV-high sample likely contributes to the avoidance of viral antigen targeting [
70]. Second, even though the EBV-encoded protein, EBNA-1 is required for viral episomal maintenance/replication and thereby must be expressed in proliferating cells, it encodes a glycine-alanine repeat domain to block its proteasomal processing for cytotoxic T-lymphocyte presentation [
71,
72]. Third, here we found elevated expression of multiple immune checkpoint inhibitors, such as IDO, PD-1, CTLA-4, LAG3, BTLA, and VISTA in the EBV-high NSCLC sample. These immune inhibitors may contribute to EBV-associated tumor immune tolerance. For example, IDO (indoleamine 2,4-dioxygenase), one of the top EBV-induced immune inhibitors, may inhibit the activities of cytotoxic T lymphocytes and NK cells by causing local tryptophan depletion in the tumor niche and thus help promote tumor survival [
28,
73,
74,
75], despite the enhanced immune infiltration in the EBV-high NSCLC. The recent development of antagonists for these immune checkpoint inhibitors in the tumor immunotherapy field may eventually help improve the prognosis of the EBV(+) NSCLC in the near future.
Together, our current data support the notion that EBV likely plays a pathological role in a subset of NSCLC. However, due to the limitation of our study (especially the limited number of EBV(+) NSCLC cases analyzed), a definitive association between EBV and the subset of NSCLC cannot be confidently established at this moment. Further study with inclusion of more EBV(+) NSCLC patients will surely help us solve this puzzle.
4. Materials and Methods
4.1. Sequencing Data Set Acquisition
Controlled access RNA-seq data from 1017 non-small cell lung cancer samples and 110 paired adjacent normal lung tissue samples generated through the National Institutes of Health (NIH), The Cancer Genome Atlas (TCGA) project were obtained from the Cancer Genomics Hub and Genomic Data Commons (
https://gdc.cancer.gov). Demographic and clinical data for each sample is available through the GDC data portal (
https://portal.gdc.cancer.gov). Briefly, surgically removed samples were obtained from 9 countries (including the United States, Germany, Australia, Canada, Russia, Switzerland, Ukraine, Romania, and Vietnam) with no previous treatment.
4.2. RNA CoMPASS Analysis
The RNA CoMPASS is an automated computational pipeline that seamlessly analyzes RNA-seq data sets [
28,
29,
35]. Briefly, to reduce the run time and random-access memory requirements incurred during the running of the BLAST component of the pipeline, 20 million reads (around 1/3 of the total reads) were extracted from each sample using the Unix split command. The extracted reads were then deduplicated using an in-house deduplication algorithm to remove PCR duplication. The deduplicated reads were subsequently aligned to the human reference genome, hg19 (Genome Reference Consortium GRCH37), plus a splice junction database (which was generated using the make transcriptome application from the Useq [
76]; splice junction radius set to the read length minus 4) using the Novoalign version 3.00.05 (Novocraft, Selangor, Malaysia) (-o SAM, default options) to identify human sequences. Unmapped sequencing reads were then isolated and subjected to consecutive BLAST (version 2.2.27 [
77], default options) searches against the Human RefSeq RNA database and then to the NCBI NT database to pinpoint reads corresponding to known exogenous organisms [
78]. Results from the NT BLAST searches were then filtered to eliminate matches with an E-value of greater than 1 × 10
−5. The results were then processed by the taxonomic classifier software MEGAN 4 (version 4.70.4 [
79]) for visualization of taxonomic classifications within the analyzed specimens. The RNA CoMPASS was run in parallel on three Intel Xeon Mac Pro workstations (with dual 12-core 2.66GHz CPUs and 64–96 GB of memory each).
4.3. Human and EBV Transcriptome Analysis
Raw sequencing reads were aligned to a reference genome containing a human genome (hg38; Genome Reference Consortium GRCH38) plus a modified Akata-EBV genome (Akata-NCBI accession number KC207813.1 [
26]). The alignments were conducted using the Spliced Transcripts Alignment to a Reference (STAR) aligner version 2.5.3 (-clip5pNbases 6, default options) [
80] and were subjected to visual inspection using the Integrative Genomics Viewer (IGV) genome browser [
81]. Transcript data from STAR were then analyzed using the RSEM software (version 1.3.0 [
82]) for quantification of human and EBV gene expression. Signal maps (i.e., the total number of reads covering each nucleotide position) were generated using the IGV tools, and read coverage maps were visualized using the IGV genome browser [
81]. The EB-Seq software [
40] was utilized to call statistically differentially-expressed genes using a false discovery rate (FDR) less than 0.05.
4.4. Circular RNA (circRNA Backsplice Junction) Analysis
CircRNA candidates were identified by the back-splicing junctions. Briefly, raw sequence data were analyzed by the find_circ pipeline [
83] using a reference genome containing a human genome (hg38; Genome Reference Consortium GRCH38) plus a modified Akata-EBV genome (Akata-NCBI accession number KC207813.1 [
26]) with default parameters.
4.5. Dimension Reduction, Correlation and Cluster Analysis of Human and EBV Expression Data
(i) Principal component analysis (PCA). PCA is a type of unsupervised dimension reduction method. It generates latent variables that are classified as principal components (PCs). The first principal component is a linear combination of the original variables that incorporates the greatest sources of variation within the datasets. The second and subsequent principal components are more latent variables which explain the greatest sources of variation that are left over beyond the first PC and lie orthogonal to it. To evaluate the variation between samples, we have utilized the PCA package (R version 3.4.1, the R Foundation, Vienna, Austria) (default settings), and analyzed both EBV and human gene expression data from 4 EBV(+) NSCLC datasets. The 2D plots were generated using the plot package (R version 3.4.1). (ii) Correlation analysis. The Pearson correlation coefficients were calculated by comparing both the human and EBV gene expression data of EBV(+) NSCLC samples using the correlation package (R version 3.4.1) with the default settings. Correlation plots were generated using the corrplot R package. (iii) Unsupervised hierarchical cluster analysis. The unsupervised hierarchical cluster analysis was performed using the pheatmap package with the default settings. The heatmaps and dendrograms were visualized using the pheatmap package with the default settings.
4.6. Deconvolution of Immune Cell Infiltration in the Tumor Tissue
The CIBERSORT software [
47] is a linear vector regression based machine learning approach and it is used to predict the proportions of immune cell subsets in tumor samples. Since the default CIBERSORT matrix panel is derived from the microarray data, it is thus not ideal to deconvole the RNA-seq data of tissue samples. To improve the accuracy of the deconvolution analyses, we utilized the CIBRESORT algorithm to build our custom CIBERSORT matrix panel of signature gene expression by using the gene expression data from the RNA-seq data sets of 18 immune cell subsets (NIH SRA# ERP004883, SRP075118, ERP013700, SRP059695, SRP066152, SRP066242). The gene expression data of EBV(+) LUSC samples were then used as input to infer proportions of 18 types of immune cells in the tumor tissue samples.
4.7. Ingenuity Pathway Analysis (IPA)
Differentially expressed genes between the EBV-high and EBV-low lung squamous cell carcinoma samples (false discovery rate (FDR) < 0.05) were identified by the EB-Seq software and used as input for the IPA’s Core Analysis including both the downstream effects analyses and the upstream regulators analyses [
84]. The downstream effects analyses were used to identify the biological processes and functions that are causally affected by the gene expression changes. The upstream regulator analyses were used to determine the molecules upstream of the genes that explain the altered gene expression. The Z-score is a value calculated by the Z-score algorithm of the IPA. The Z-score is utilized to predict the direction of change for a biological function or the activation state of the upstream regulator. The Z-score is calculated based on the uploaded gene expression pattern that is upstream to the biological function and downstream to an upstream regulator. A biological function is increased or an upstream regulator is activated if the Z-score is > 0. A biological function is decreased or an upstream regulator is inhibited if the Z-score is < 0.
4.8. EBERs In Situ Hybridization
The formalin-fixed paraffin-embedded (FFPE) lung cancer tissue array was obtained (Biomax, Derwood, MD, USA, catalog no. BC041115d). EBERs (EBER1 and EBER2) ISH was performed using the HistoSonda EBER XISH Probes kit (American MasterTech, Lodi, CA, USA). Briefly, the FFPE tissue sections were deparaffinized, rehydrated in a graded solution of xylene and alcohol, and deproteinized with proteinase K. Samples were incubated with a digoxigenin EBER probe and washed with deionized water and 1× PBS. They were incubated first with anti-digoxin antibody and anti-mouse horse peroxidase antibody and subsequently with 3,3′-diaminobenzidine (Biocare Medical, Pacheco, CA, USA), counterstained with hematoxylin (Sigma, St. Louis, MO, USA), and washed again with 1× PBS. Slides were then dehydrated in a graded solution of xylene and alcohol and subsequently sealed with the VectaMount permanent mounting medium (Vector Laboratories, Burlingame, CA, USA). Slides were scanned with an Aperio CS2 digital pathology scanner, and images were obtained with Aperio ImageScope software (version 12.3.2.8013, Leica, Buffalo Grove, IL, USA) with 40× magnification.
4.9. Histopathology Images of TCGA Lung Cancer Samples
Hemotoxylin and eosin (H&E) stained histopathology images of the EBV(+) lung cancer samples of the TCGA cohort were obtained from the Genomics Data Commons (
https://gdc.cancer.gov). All the tumor samples were collected by surgical excision. Representative images were generated using the Aperio ImageScope software (version 12.3.2.8013, Leica, Buffalo Grove, IL, USA) with 20× magnification.
4.10. Cell Culture
NCI-H1703 is a lung squamous cell carcinoma cell line and was purchased from the ATCC (Catalog number CRL-5889, Manassas, VA, USA). Cells were grown in RPMI 1640 medium (ThermoFisher Scientific, Waltham, MA, USA; catalog number SH30027) plus 10% fetal bovine serum (FBS; Invitrogen-Gibco, Carlsbad, CA, USA; catalog number 10437-028) with 0.5% pen-strep (Invitrogen-Gibco, Carlsbad, CA, USA; catalog number 15070-063) at 37 °C in a humidified 5% CO2 incubator.
4.11. DNA Transfection
NCI-H1703 cells were seeded on either 6-well plates or chamber slides in RPMI 1640 medium supplemented with 10% FBS 1 day before transfection. On the day of transfection, DNA plasmids carrying either recombinant EBV M81 strain (rM81; a kind gift from Henri-Jacques Delecluse, [
85]) or B95.8 strain (rB95.8; a kind gift from Wolfgang Hammerschmidt, [
86]) or control pUHD10 plasmid were transfected into NCI-H1703 cells using the TransIT-X2 kit (Mirus, Madison, WI, USA; catalog number MIR6003) according to the vendor’s protocols. Cells were harvested 48 h later for the subsequent analyses.
4.12. RNA Extraction
Total cellular RNAs were isolated using the miRNeasy minikit (Qiagen, Germantown, MD, USA; catalog number 217004) according to the vendors’ protocols and treated with RNase-free DNase (Qiagen, Germantown, MD, USA; catalog number 79254) according to the vendor’s protocol. The quantity of the isolated RNA was further analyzed using a NanoDrop 2000 spectrophotometer (ThermoFisher Scientific, Waltham, MA, USA). RNA quality was examined by running RNA on a 1% agarose gel with ethidium bromide using a BioRad gel documentation system.
4.13. Real-Time RT-PCR Analysis
Total RNA was reverse transcribed using the iScript cDNA synthesis kit for reverse transcription-PCR (RT-PCR) (BioRad, Hercules, CA, USA; catalog number 4106228). Random hexamers were used along with 1 µg of RNA in a 20-µL reaction volume according to the manufacturer’s instructions. For the incubation steps (25 °C for 5min followed by 46 °C for 20 min), a T100 thermal cycler (BioRad, Hercules, CA, USA) was used. The resulting cDNA was subjected to quantitative (real-time) PCR using sequence-specific forward and reverse primers (Integrated DNA Technologies, Coralville, Iowa, USA). For real-time PCR, 1 µL of the resulting cDNA was used in a 10-µL reaction volume that included 5 µL of Sybr green (BioRad, Hercules, CA, USA; catalog number 64213937) and a 500 nM concentration each of forward and reverse primers. Amplification was carried out using the following conditions: 95 °C for 3 min followed by 40 cycles of 95 °C for 15 s and 60 °C for 60 s. Melt curve analysis was performed at the end of every qRT-PCR run. Samples were tested in triplicates. No-template controls were included in each PCR run. PCRs were performed on a Bio-Rad CFX96 real-time system, and data analysis was performed using CFX Manager 3.0 software (BioRad, Hercules, CA, USA). Relative detection levels were calculated by normalizing with the glyceraldehyde-3-phosphate dehydrogenase (GAPDH) gene as a reference gene. Primer sequences for VISTA forward, ACCACCACTCGGAGCACAGG; reverse, TTGTAGACCAGGAGCAGGATGAGG; IDO forward, AGCCCTTCAAGTGTTTCACCAA; reverse, GCCTTTCCAGCCAGACAAATATA; BTLA forward, CATCTTAGCAGGAGATCCCTTTG; reverse, GACCCATTGTCATTAGGAAGCA; PD-1 forward, CGTGGCCTATCCACTCCTCA; reverse, ATCCCTTGTCCCAGCCACTC; CTLA-4 forward, AGCCAGGTGACTGAAGTCTG; reverse, CATAAATCTGGGTTCCGTTG; LAG3 forward, GCGGGGACTTCTCGCTATG; reverse, GGCTCTGAGAGATCCTGGGG; EBER forward, GGACCTACGCTGCCCTAG; reverse, CAGCTGGTACTTGACAGA; BZLF1 forward, CGACGTACAAGGAAACCACTAC; reverse, GAAGCCACCCGATTCTTGTAT; RPMS1 forward, CTAGTGCTGCATGGGCTCCTC; reverse, TGCAGATATCCTGCGTCCTCT; GAPDH forward, CCAAGGTCATCCATGACAACT; reverse, ATCACGCCACAGTTTCCC.
4.14. Fluorescence Microscopy Analysis
On the chamber slides, cells were fixed with 3.7% formaldehyde for 15 min at the room temperature. Fixed cells were then washed with 1× PBS for 5 min for 3 times. Nuclei were then counterstained for 15 min with NucBlue reagent (ThermoFisher scientific, Waltham, MA, USA; catalog number R37605) at the room temperature. Cells were then washed with 1× PBS for 5 min for 3 times. For fluorescence microscopy, slides were examined with a Nikon ECLIPSE 80i microscope (Nikon, Melville, NY, USA).

 ,
, 


