Progression of Pulmonary Function and Correlation with Survival Following Stereotactic Body Radiotherapy of Central and Ultracentral Lung Tumors

 , , and
Abstract
:Simple Summary
Abstract
1. Introduction
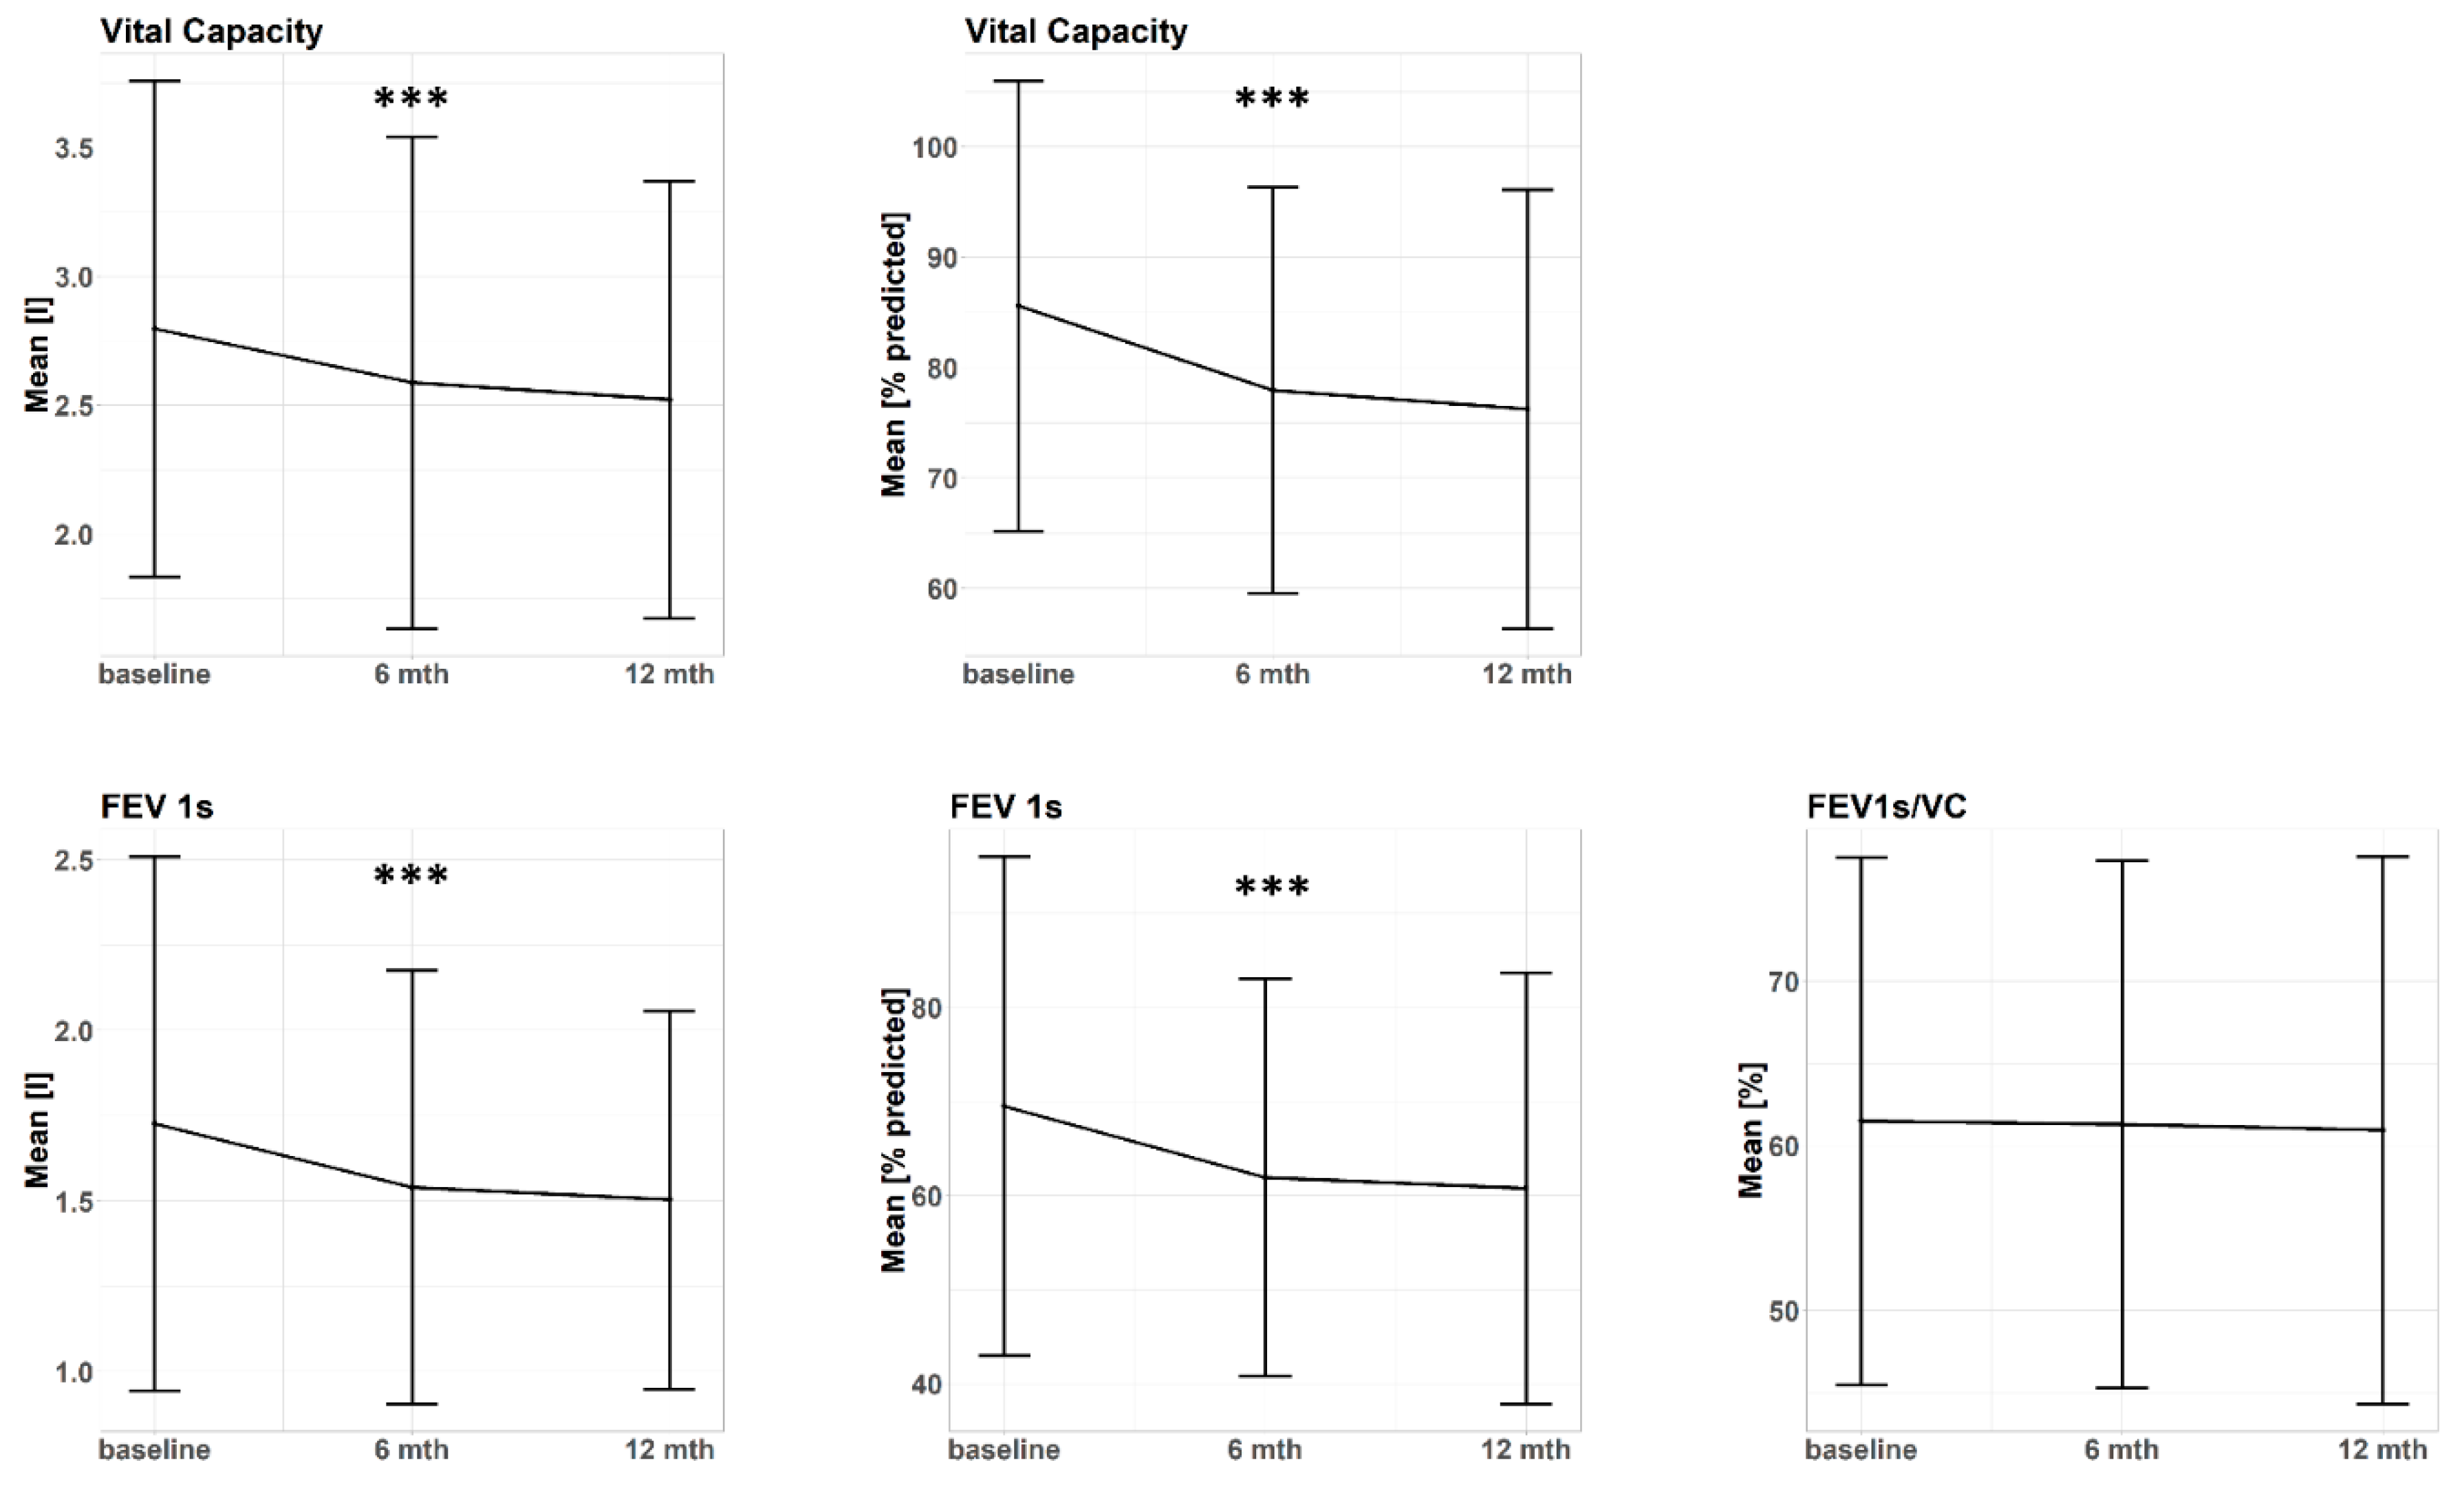
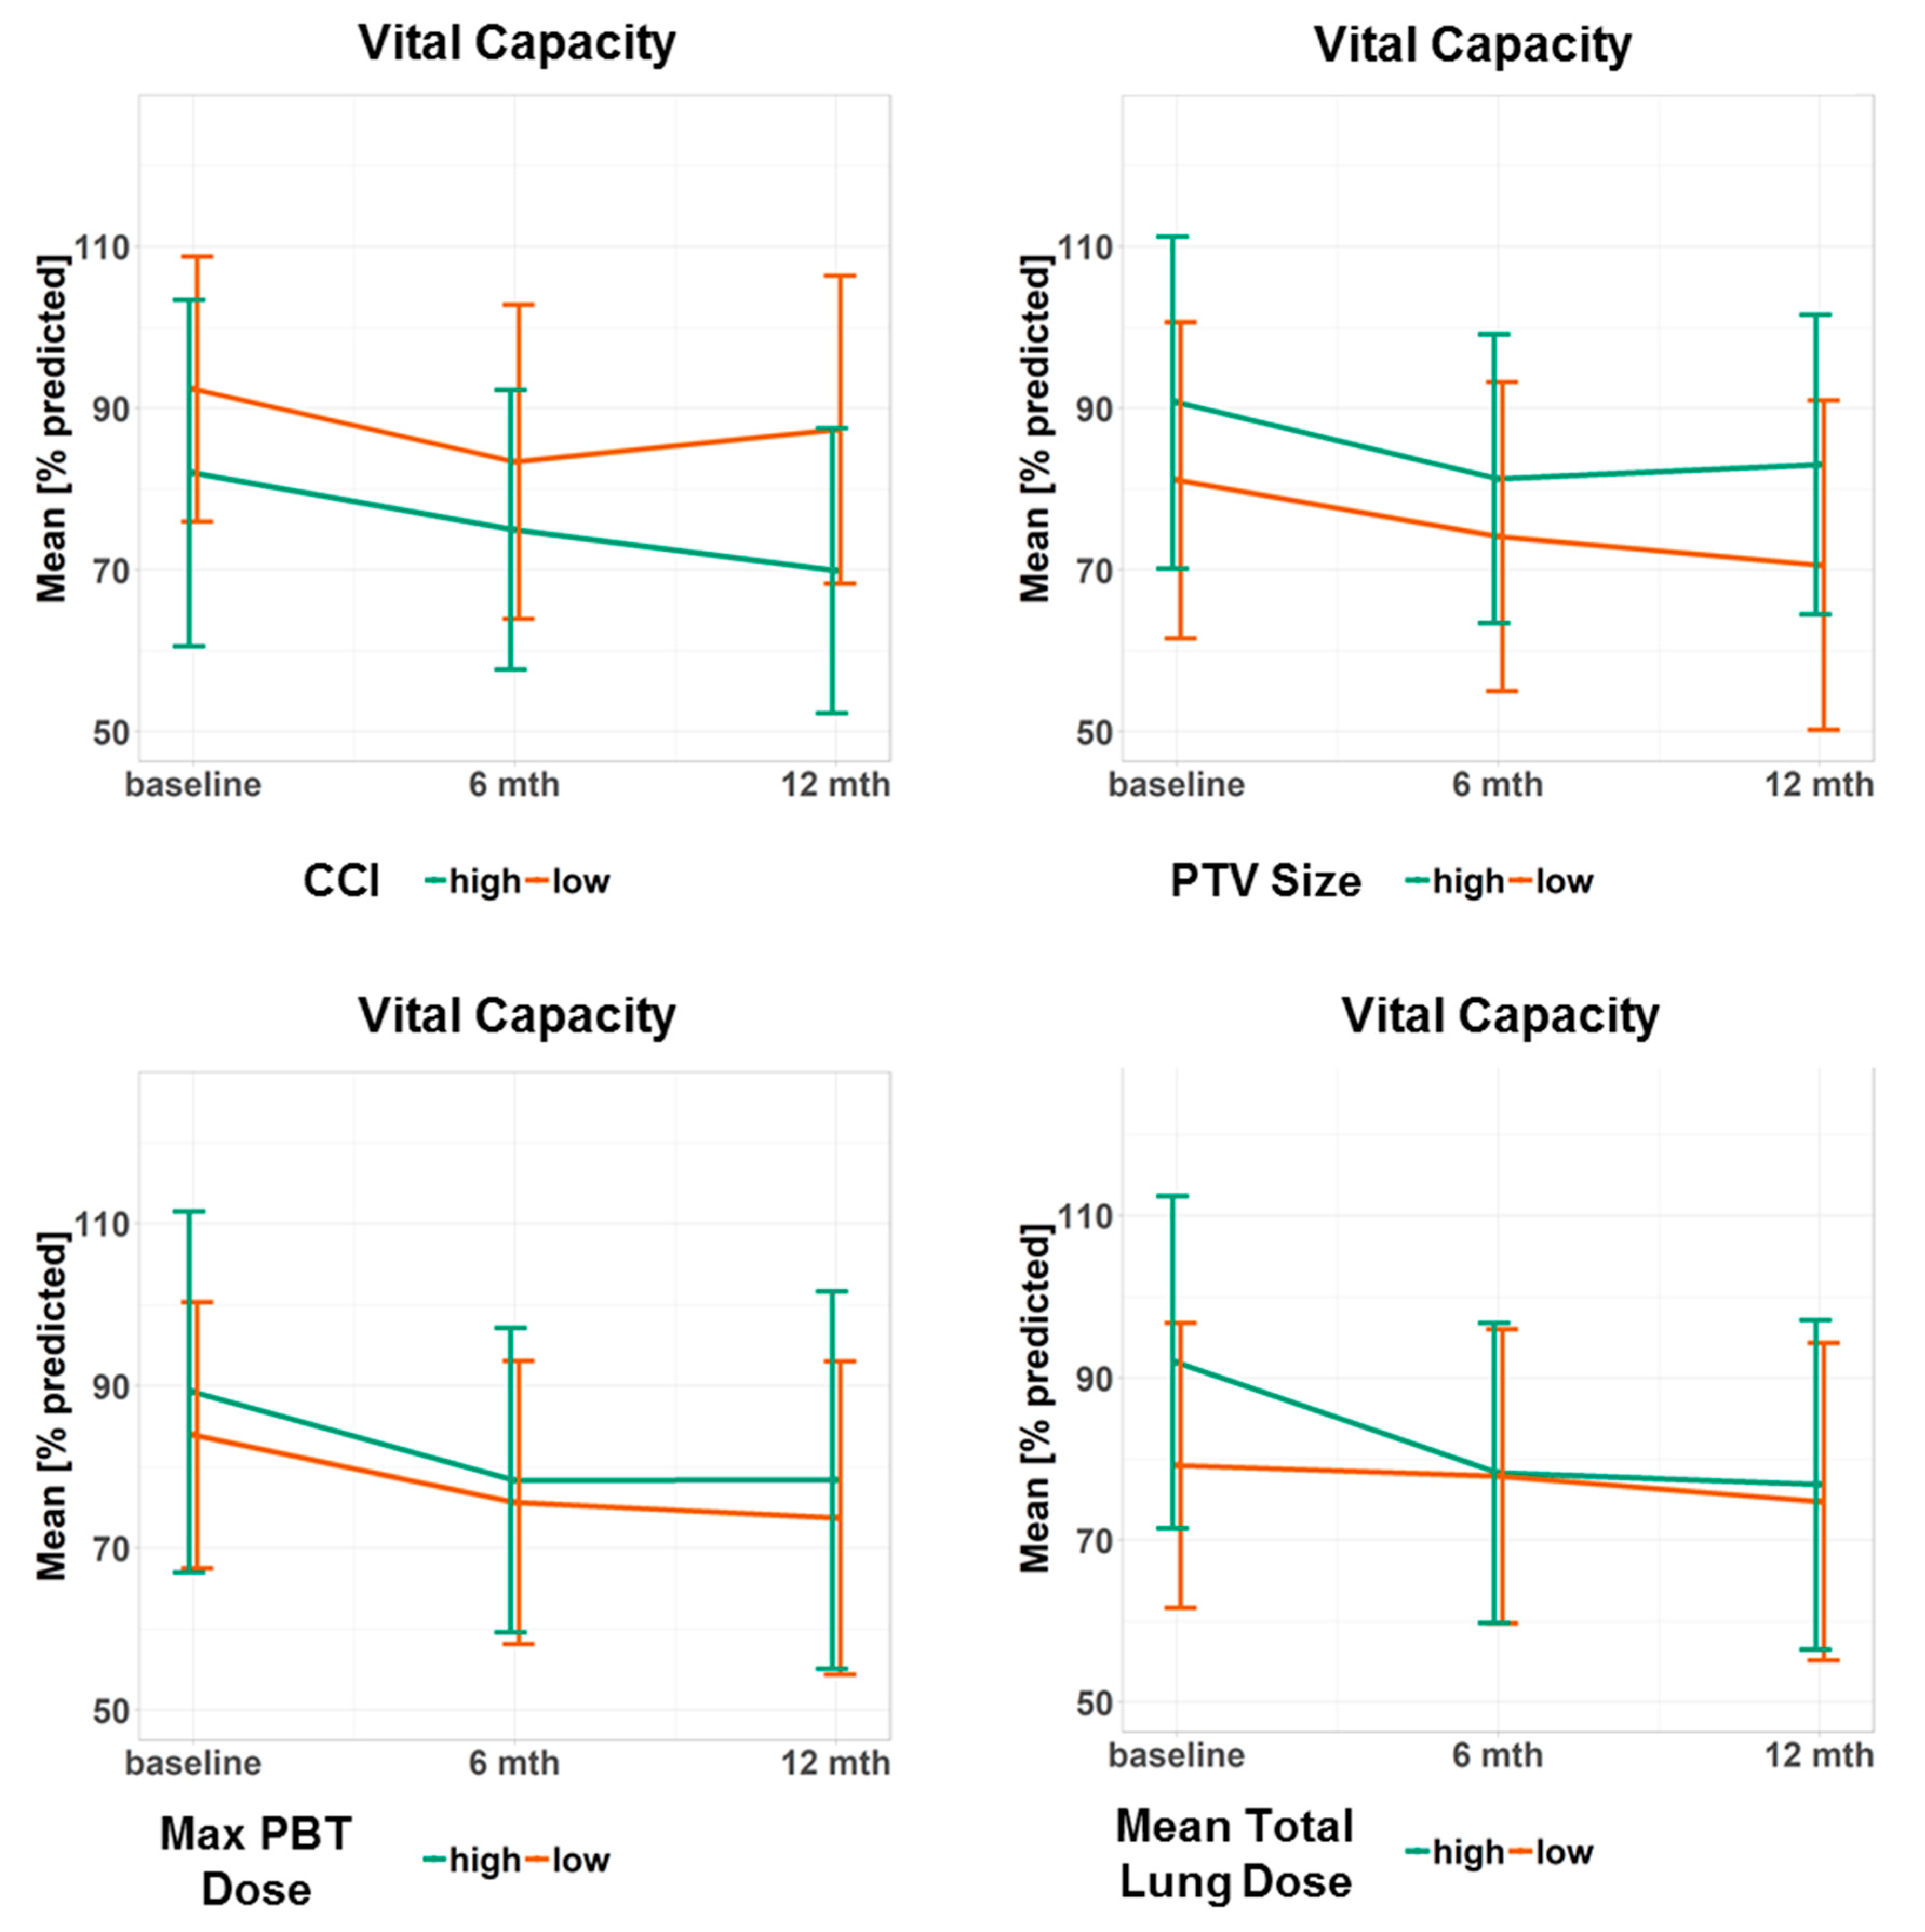
2. Results
2.1. Pulmonary Function Parameters
2.2. Overall Survival
3. Discussion
3.1. Central vs. Peripheral SBRT
3.2. Clinical and Dosimetry Correlation
3.3. Overall Survival
3.4. Limitations and Strenghts
4. Materials and Methods
4.1. Patients
4.2. Radiation Treatment
4.3. Follow-Up
4.4. Statistics
4.5. Ethics
5. Conclusions
Supplementary Materials
Author Contributions
Funding
Acknowledgments
Conflicts of Interest
References
- Timmerman, R.; McGarry, R.; Yiannoutsos, C.; Papiez, L.; Tudor, K.; DeLuca, J.; Ewing, M.; Abdulrahman, R.; Desrosiers, C.; Williams, M.; et al. Excessive Toxicity When Treating Central Tumors in a Phase II Study of Stereotactic Body Radiation Therapy for Medically Inoperable Early-Stage Lung Cancer. J. Clin. Oncol. 2006, 24, 4833–4839. [Google Scholar] [CrossRef]
- Lagerwaard, F.J.; Haasbeek, C.J.; Smit, E.F.; Slotman, B.J.; Senan, S. Outcomes of Risk-Adapted Fractionated Stereotactic Radiotherapy for Stage I Non–Small-Cell Lung Cancer. Int. J. Radiat. Oncol. 2008, 70, 685–692. [Google Scholar] [CrossRef]
- Guckenberger, M.; Wulf, J.; Mueller, G.; Krieger, T.; Baier, K.; Gabor, M.; Richter, A.; Wilbert, J.; Flentje, M. Dose–Response Relationship for Image-Guided Stereotactic Body Radiotherapy of Pulmonary Tumors: Relevance of 4D Dose Calculation. Int. J. Radiat. Oncol. 2009, 74, 47–54. [Google Scholar] [CrossRef]
- Hörner-Rieber, J.; Bernhardt, D.; Blanck, O.; Duma, M.; Eich, H.T.; Gerum, S.; Gkika, E.; Hass, P.; Henkenberens, C.; Herold, H.-U.; et al. Long-term Follow-up and Patterns of Recurrence of Patients with Oligometastatic NSCLC Treated With Pulmonary SBRT. Clin. Lung Cancer 2019, 20, e667–e677. [Google Scholar] [CrossRef]
- Pasalic, D.; Lu, Y.; Betancourt-Cuellar, S.L.; Taku, N.; Mesko, S.M.; Bagley, A.F.; Chance, W.W.; Allen, P.K.; Tang, C.; Antonoff, M.B.; et al. Stereotactic ablative radiation therapy for pulmonary metastases: Improving overall survival and identifying subgroups at high risk of local failure. Radiother. Oncol. 2020, 145, 178–185. [Google Scholar] [CrossRef]
- Bezjak, A.; Paulus, R.; Gaspar, L.E.; Timmerman, R.D.; Straube, W.L.; Ryan, W.F.; Garces, Y.I.; Pu, A.T.; Singh, A.K.; Videtic, G.M.; et al. Safety and Efficacy of a Five-Fraction Stereotactic Body Radiotherapy Schedule for Centrally Located Non–Small-Cell Lung Cancer: NRG Oncology/RTOG 0813 Trial. J. Clin. Oncol. 2019, 37, 1316–1325. [Google Scholar] [CrossRef]
- Song, S.Y.; Choi, W.; Shin, S.S.; Lee, S.-W.; Ahn, S.D.; Kim, J.H.; Je, H.U.; Park, C.I.; Lee, J.S.; Choi, E.K. Fractionated stereotactic body radiation therapy for medically inoperable stage I lung cancer adjacent to central large bronchus. Lung Cancer 2009, 66, 89–93. [Google Scholar] [CrossRef]
- Haseltine, J.M.; Rimner, A.; Gelblum, D.Y.; Modh, A.; Rosenzweig, K.E.; Jackson, A.; Yorke, E.D.; Wu, A.J. Fatal complications after stereotactic body radiation therapy for central lung tumors abutting the proximal bronchial tree. Pr. Radiat. Oncol. 2016, 6, e27–e33. [Google Scholar] [CrossRef] [Green Version]
- Murrell, D.H.; Labe, J.; Erickson, A.; Millman, B.; Palma, D.A.; Louie, A.V. Stereotactic ablative radiotherapy for ultra-central lung tumors: Prioritize target coverage or organs at risk? Radiat. Oncol. 2018, 13, 57. [Google Scholar] [CrossRef] [Green Version]
- Tekatli, H.; Haasbeek, N.; Dahele, M.; De Haan, P.; Verbakel, W.; Bongers, E.; Hashemi, S.; Nossent, E.; Spoelstra, F.; De Langen, A.J.; et al. Outcomes of Hypofractionated High-Dose Radiotherapy in Poor-Risk Patients with “Ultracentral” Non–Small Cell Lung Cancer. J. Thorac. Oncol. 2016, 11, 1081–1089. [Google Scholar] [CrossRef] [Green Version]
- Rim, C.H.; Kim, Y.; Kim, C.Y.; Yoon, W.S.; Yang, D.S. Is stereotactic body radiotherapy for ultra-central lung tumor a feasible option? A systemic review and meta-analysis. Int. J. Radiat. Biol. 2019, 95, 329–337. [Google Scholar] [CrossRef] [PubMed]
- Stone, B.; Mangona, V.S.; Johnson, M.D.; Ye, H.; Grills, I.S. Changes in Pulmonary Function Following Image-Guided Stereotactic Lung Radiotherapy. J. Thorac. Oncol. 2015, 10, 1762–1769. [Google Scholar] [CrossRef] [PubMed] [Green Version]
- Navarro-Martin, A.; Aso, S.; Cacicedo, J.; Arnaiz, M.; Navarro, V.; Rosales, S.; De Blas, R.; Ramos, R.; Guedea, F. Phase II Trial of SBRT for Stage I NSCLC: Survival, Local Control, and Lung Function at 36 Months. J. Thorac. Oncol. 2016, 11, 1101–1111. [Google Scholar] [CrossRef] [PubMed] [Green Version]
- Hörner-Rieber, J.; Dern, J.; Bernhardt, D.; König, L.; Adeberg, S.; Verma, V.; Paul, A.; Kappes, J.; Hoffmann, H.; Debus, J.; et al. Parenchymal and Functional Lung Changes after Stereotactic Body Radiotherapy for Early-Stage Non-Small Cell Lung Cancer—Experiences from a Single Institution. Front. Oncol. 2017, 7. [Google Scholar] [CrossRef] [Green Version]
- Stephans, K.; Djemil, T.; Reddy, C.A.; Gajdos, S.M.; Kolar, M.; Machuzak, M.; Mazzone, P.; Videtic, G.M.M. Comprehensive Analysis of Pulmonary Function Test (PFT) Changes After Stereotactic Body Radiotherapy (SBRT) for Stage I Lung Cancer in Medically Inoperable Patients. J. Thorac. Oncol. 2009, 4, 838–844. [Google Scholar] [CrossRef] [Green Version]
- Mangona, V.S.; Aneese, A.M.; Marina, O.; Hymas, R.V.; Ionascu, D.; Robertson, J.M.; Gallardo, L.J.; Grills, I.S. Toxicity After Central versus Peripheral Lung Stereotactic Body Radiation Therapy: A Propensity Score Matched-Pair Analysis. Int. J. Radiat. Oncol. 2015, 91, 124–132. [Google Scholar] [CrossRef]
- Henderson, M.; McGarry, R.; Yiannoutsos, C.; Fakiris, A.; Hoopes, D.; Williams, M.; Timmerman, R. Baseline Pulmonary Function as a Predictor for Survival and Decline in Pulmonary Function Over Time in Patients Undergoing Stereotactic Body Radiotherapy for the Treatment of Stage I Non–Small-Cell Lung Cancer. Int. J. Radiat. Oncol. 2008, 72, 404–409. [Google Scholar] [CrossRef]
- Bishawi, M.; Kim, B.; Moore, W.H.; Bilfinger, T. Pulmonary Function Testing After Stereotactic Body Radiotherapy to the Lung. Int. J. Radiat. Oncol. 2012, 82, e107–e110. [Google Scholar] [CrossRef]
- Stanic, S.; Paulus, R.; Timmerman, R.D.; Michalski, J.M.; Barriger, R.B.; Bezjak, A.; Videtic, G.M.; Bradley, J. No Clinically Significant Changes in Pulmonary Function Following Stereotactic Body Radiation Therapy for Early- Stage Peripheral Non-Small Cell Lung Cancer: An Analysis of RTOG 0236. Int. J. Radiat. Oncol. 2014, 88, 1092–1099. [Google Scholar] [CrossRef] [Green Version]
- Guckenberger, M.; Klement, R.J.; Kestin, L.L.; Hope, A.J.; Belderbos, J.; Werner-Wasik, M.; Yan, D.; Sonke, J.-J.; Bissonnette, J.-P.; Xiao, Y.; et al. Lack of a Dose-Effect Relationship for Pulmonary Function Changes After Stereotactic Body Radiation Therapy for Early-Stage Non-Small Cell Lung Cancer. Int. J. Radiat. Oncol. 2013, 85, 1074–1081. [Google Scholar] [CrossRef]
- Alberts, L.; El Sharouni, S.Y.; Hofman, F.N.; Van Putte, B.P.; Tromp, E.; Van Vulpen, M.; A Kastelijn, E.; Schramel, F.M.N.H. Changes in Pulmonary Function After Stereotactic Body Radiotherapy and After Surgery for Stage I and II Non-small Cell Lung Cancer, a Description of Two Cohorts. Anticancer. Res. 2015, 35. [Google Scholar]
- Hanna, G.; Murray, L.; Patel, R.; Jain, S.; Aitken, K.; Franks, K.; Van As, N.; Tree, A.; Hatfield, P.; Harrow, S.; et al. UK Consensus on Normal Tissue Dose Constraints for Stereotactic Radiotherapy. Clin. Oncol. 2018, 30, 5–14. [Google Scholar] [CrossRef] [PubMed] [Green Version]
- Quanjer, P.H.; Stanojevic, S.; Cole, T.J.; Baur, X.; Hall, G.L.; Culver, B.H.; Enright, P.L.; Hankinson, J.L.; Ip, M.S.; Zheng, J.; et al. Multi-ethnic reference values for spirometry for the 3–95-yr age range: The global lung function 2012 equations. Eur. Respir. J. 2012, 40, 1324–1343. [Google Scholar] [CrossRef] [PubMed]


| Pulmonary _Function Parameter | Baseline (n = 107) | 6 Months (n = 73) | 12 Months (n = 55) |
|---|---|---|---|
| FEV1s [l] (Δ baseline) | 1.7 ± 0.8 (0) | 1.5 ± 0.6 (−0.2 ± 0.3) | 1.5 ± 0.6 (−0.2 ± 0.3) |
| β estimate [l/6 months] | β = −0.1 [−0.2–−0.1], p = 2 × 10⁻⁹ | ||
| FEV1s [% predicted] (Δ baseline) | 69.5 ± 26.5 (0) | 61.9 ± 21.1 (−8.5 ± 12.6) | 60.8 ± 22.9 (−7.7 ± 12.4) |
| β estimate [%/6 months] | β = −4.4 [−6.0–−2.9], p = 1 × 10⁻⁸ | ||
| VC [l] (Δ baseline) | 2.8 ± 1.0 (0) | 2.6 ± 1.0 (−0.2 ± 0.5) | 2.5 ± 0.9 (−0.3 ± 0.5) |
| β estimate [l/6 months] | β = −0.2 [−0.2–−0.1], p = 6 × 10⁻⁸ | ||
| VC [% predicted] (Δ baseline) | 85.6 ± 20.4 (0) | 77.6 ± 18.4 (−7.8 ± 14.9) | 76.3 ± 19.9 (−9.4 ± 14.5) |
| β estimate [%/6 months] | β = −5.1 [−6.9–−3.3], p = 2 × 10⁻⁸ | ||
| FEV1s/VC [%] (Δ baseline) | 61.5 ± 16 (0) | 61.3 ± 16.0 (−0.9 ± 6.1) | 60.9 ± 16.6 (0.5 ± 6.8) |
| β estimate [l%/6 months] | β = 0.1 [−0.7–0.8], p = 0.89 | ||
| Fixed Effects | VC [% Predicted] | FEV1s [% Predicted] | ||
|---|---|---|---|---|
| β [95% CI] | p-Value | β [95% CI] | p-Value | |
| Age (1 year) | 0 [−0.4–0.4] | 0.98 | 0 [−0.5–0.4] | 0.91 |
| Time (6 months) | −14.2 [−26.4–−1.9] | 0.02 | −9.8 [−23.4–−2.4] | 0.02 |
| Age Time | 0.1 [0–0.3] | 0.14 | 0.1 [0–0.3] | 0.11 |
| CCI (1 point) | −1.5 [−3.6–0.6] | 0.15 | −3.1 [−5.7–−0.6] | 0.02 |
| Time (6 months) | −4.9 [−9.6–0.2] | 0.04 | −5.7 [−10.3–−2.4] | 2 × 10⁻³ |
| CCI Time | 0 [−1.1–1.0] | 0.93 | 0.2 [−0.4–1.3] | 0.31 |
| Localization (central) | 6.0 [−1.4–13.5] | 0.11 | 7.5 [−1.8–16.8] | 0.12 |
| Time (6 months) | −5.3 [−7.6–−3.0] | 6 × 10⁻⁶ | −4.5 [−6.4–−2.5] | 1 × 10⁻⁵ |
| Localization • Time | 0.6 [−3.0–4.2] | 0.75 | −1.1 [−3.0–3.1] | 0.97 |
| Following ST (none) | −0.3 [−10.4–9.8] | 0.95 | 6.3 [−6.3–18.9] | 0.33 |
| Time (6 months) | −5.0 [−7.1–−2.8] | 5 × 10⁻⁶ | −4.0 [−5.8–−2.2] | 2 × 10⁻⁵ |
| Following ST Time | −0.3[−5.0–4.5] | 0.91 | −1.3 [−5.6–2.5] | 0.45 |
| Pneumonitis (none) | 3.8 [−7.0–14.5] | 0.49 | 6.8 [−17.8–15.8] | 0.32 |
| Time (6 months) | −5.1 [−7.1–−3.2] | 1 × 10⁻⁷ | −4.4 [−6.1–−2.9] | 1 × 10⁻⁷ |
| Pneumonitis Time | 0.4 [−4.9–5.7] | 0.88 | −0.2[−4.1–5.0] | 0.94 |
| Local Progression (none) | 5.1 [−8.3–18.6] | 0.46 | −1.0 [−20.5–15.8] | 0.91 |
| Time (6 months) | −5.1 [−7.0–−3.2] | 2 × 10⁻⁷ | −4.5 [−6.6–−3.1] | 7 × 10⁻⁸ |
| Local Progression Time | −0.3 [−5.6–5.0] | 0.88 | 0.4 [−3.3–6.7] | 0.85 |
| PBT Max (10 Gy) | 0.4 [−0.4–1.2] | 0.33 | 0.1 [−0.9–1.1] | 0.82 |
| Time (6 months) | 2.6 [−2.7–7.9] | 0.34 | 0.5 [−4.2–5.2] | 0.82 |
| PBT Max Time | −0.6 [−1.0–−0.2] | 3 × 10⁻³ | −0.4 [−0.7–0] | 0.03 |
| Total Lung Mean (10 Gy) | 14.2 [5.7−22.6] | 1 × 10⁻³ | 21.0 [10.6–31.4] | 8 × 10⁻⁵ |
| Time (6 months) | −0.2 [−5.0–4.7] | 0.95 | −1.1 [−5.2–3.0] | 0.61 |
| Total Lung Mean Time | −4.8 [−9.2–−0.4] | 0.03 | −3.1 [−6.8–0.6] | 0.10 |
| PTV Size (10 cm³) | 0.6 [0.1–1.0] | 0.01 | 0.6 [0.1–1.2] | 0.03 |
| Time (6 months) | −3.5 [−6.4–−0.7] | 0.02 | −3.6 [−6.1–−1.1] | 5 × 10⁻³ |
| PTV Time | −0.1 [−0.4–0.1] | 0.16 | −0.1 [−0.3–0.1] | 0.31 |
| Time (6 months) | 6.7 [0.1–13.4] | 0.05 | 0.6 [−4.1–5.3] | 0.80 |
| CCI (1 point) | −−− | −−− | −2.8 [−5.3–−0.4] | 0.02 |
| PBT Max Time (10 Gy • 6 months) | −0.5 [−0.9–−0.2] | 5 × 10⁻³ | −0.4 [−0.7–0] | 0.03 |
| PTV Size (10 cm³) | 0.3 [−0.2–0.8] | 0.18 | 0.2 [−0.4–0.9] | 0.44 |
| Total Lung Mean (10 Gy) | 10.3 [0.4–20.1] | 0.04 | 13.6 [2.0–5.2] | 0.02 |
| Total Lung Mean Time (10 Gy • 6 months) | −4.6 [−8.9–−0.2] | 0.04 | −−− | −−− |
| Univariate | ||
|---|---|---|
| Pulmonary Function Parameter | HR (95% CI) | p-Value |
| FEV1s [l] | 0.93 (0.64–1.37) | 0.73 |
| FEV1s [% pred] | 0.99 (0.98–1.0) | 0.03 |
| VC [l] | 1.22 (0.92–1.62) | 0.18 |
| VC [% pred] | 0.99 (0.98–1.01) | 0.34 |
| FEV1s/VC [%] | 0.98 (0.96–1.0) | 0.01 |
| Δ FEV1s (0–6 months) [l] | 1.25 (0.39–3.97) | 0.71 |
| Δ FEV1s (0–6 months) [% pred] | 1.02 (0.99–1.04) | 0.29 |
| Δ FEV1s (0–12 months) [l] | 0.40 (0.13–1.26) | 0.12 |
| Δ FEV1s (0–12 months) [% pred] | 0.99 (0.96–1.01) | 0.30 |
| Δ FEV1s (6–12 months) [l] | 0.02 (0–0.21) | 1 × 10⁻³ |
| Δ FEV1s (6–12 months) [% pred] | 0.91 (0.86–0.97) | 4 × 10⁻³ |
| Δ VC (0–6 months) [l] | 0.951 (0.48–1.87) | 0.88 |
| Δ VC (0–6 months) [% pred] | 1.0 (0.98–1.02) | 0.81 |
| Δ VC (0–12 months) [l] | 0.35 (0.17–0.74) | 6 × 10⁻³ |
| Δ VC (0–12 months) [%pred] | 0.97 (0.95–1.0) | 0.03 |
| Δ VC (6–12 months) [l] | 0.30 (0.15–0.63) | 1 × 10⁻³ |
| Δ VC (6–12 months) [%pred] | 0.95 (0.92–0.98) | 1 × 10⁻³ |
| Δ FEV1s/VC (0–6 months) [%] | 1.03 (0.98–1.09) | 0.19 |
| Δ FEV1s/VC (0–12 months) [%] | 1.02 (0.97–1.07) | 0.42 |
| Δ FEV1s/VC (6–12 months) [%] | 1.0 (0.95–1.06) | 0.93 |
| Multivariate | ||
| FEV1s/VC [%] | 1.0 (0.95–1.05) | 0.86 |
| FEV1s [% pred] | 0.97 (0.94–1.0) | 0.09 |
| Δ FEV1s (6–12 months) [% pred] | 0.90 (0.84–0.97) | 6 × 10⁻³ |
| Δ VC (0–12 months) [% pred] | 0.95 (0.91–0.98) | 4 × 10⁻³ |
| Δ VC (6–12 months) [% pred] | 1.0 (0.95–1.05) | 0.94 |
| Patient Characteristics | |
|---|---|
| Age (years) | |
| Mean ± SD | 71.6 ± 10.4 |
| Sex | |
| Male | 52 |
| Female | 55 |
| CCI | |
| Median (IQR) | 4 (3–5) |
| Localization | |
| Central | 62 |
| Ultracentral | 45 |
| Tumor Entity | |
| NSCLC | 88 |
| PET Positive Lung Nodule * | 12 |
| Extrapulmonary Primary | 7 |
| SBRT Target | |
| Primary | 68 |
| Local Recurrence | 20 |
| Lung Metastasis | 19 |
| Systemic Therapy during Follow-Up | |
| Chemotherapy | 8 |
| Checkpoint Inhibition | 6 |
| Chemotherapy + Checkpoint Inhibition | 1 |
| Other | 4 |
| None | 74 |
| Unknown | 14 |
| Maximum BED3 in PBT | |
| Mean ± SD | 115.7 ± 49.2 |
| Mean BED3 in Total Lung | |
| Mean ± SD | 10.1 ± 4.4 |
| PTV Size (cm³) | |
| Mean ± SD | 105.0 ± 84.0 |
| PFT Time Intervals (days) | |
| Δ Baseline–SBRT Start (Mean ± SD) | −42 ± 30 |
| Δ SBRT Start–1st Follow-Up (Mean ± SD) | 182 ± 37 |
| Δ SBRT Start–2nd Follow-Up (Mean ± SD) | 359 ± 45 |
| Pneumonitis during Follow-Up | |
| II° | 10 |
| III° | 5 |
| Local Progression during Follow-Up | 9 |
© 2020 by the authors. Licensee MDPI, Basel, Switzerland. This article is an open access article distributed under the terms and conditions of the Creative Commons Attribution (CC BY) license (http://creativecommons.org/licenses/by/4.0/).
Share and Cite
Regnery, S.; Eichkorn, T.; Weykamp, F.; Held, T.; Dinges, L.-A.; Schunn, F.; Winter, H.; Thomas, M.; Debus, J.; El Shafie, R.A.; et al. Progression of Pulmonary Function and Correlation with Survival Following Stereotactic Body Radiotherapy of Central and Ultracentral Lung Tumors. Cancers 2020, 12, 2862. https://doi.org/10.3390/cancers12102862
Regnery S, Eichkorn T, Weykamp F, Held T, Dinges L-A, Schunn F, Winter H, Thomas M, Debus J, El Shafie RA, et al. Progression of Pulmonary Function and Correlation with Survival Following Stereotactic Body Radiotherapy of Central and Ultracentral Lung Tumors. Cancers. 2020; 12(10):2862. https://doi.org/10.3390/cancers12102862
Chicago/Turabian StyleRegnery, Sebastian, Tanja Eichkorn, Fabian Weykamp, Thomas Held, Lisa-Antonia Dinges, Fabian Schunn, Hauke Winter, Michael Thomas, Jürgen Debus, Rami A. El Shafie, and et al. 2020. "Progression of Pulmonary Function and Correlation with Survival Following Stereotactic Body Radiotherapy of Central and Ultracentral Lung Tumors" Cancers 12, no. 10: 2862. https://doi.org/10.3390/cancers12102862