1. Introduction
Several chemotherapeutic agents kill cancer cells by initiating apoptosis. Dysfunctional apoptosis is recognised as a key factor in malignant progression and development of chemotherapy resistance in cancer [
1,
2]. The mitochondrial apoptosis pathway plays an important role in chemotherapy-induced cell death [
1]. BCL-2 family proteins are master regulators of mitochondrial apoptosis, and act on mitochondria to induce, or inhibit, mitochondrial outer membrane permeabilization (MOMP). MOMP is achieved through the activation and homo-oligomerisation of two channel-forming, pro-apoptotic multi-domain proteins within the B-cell lymphoma 2 (BCL-2) family, bcl-2-like protein 4 (BAX) and Bcl-2 homologous antagonist/killer (BAK). Monomeric activated BAX and BAK are sequestered and neutralised by a number of anti-apoptotic multi-domain proteins within the BCL-2 family. The anti-apoptotic function of these proteins are antagonised by a third set of proteins within the family, the Bcl-2 homology-3 (BH3)-only proteins. These are activated by transcription or post-translational modification in response to cellular stress [
3,
4]. Thus, whether cells undergo mitochondrial apoptosis or not is regulated by a complex network of BCL-2 protein interactions.
Small molecule apoptosis sensitisers, such as BCL-2 antagonists restore or induce cell death signalling in cancer cells. There are now several selective BCL-2 antagonists targeting anti-apoptotic BCL-2 family proteins, with the selective BCL-2 antagonist ABT-199 (venetoclax) now approved for the treatment of acute myeloid leukaemia, chronic and small lymphocytic lymphoma patients who received at least one prior therapy [
5]. Unlike many haematological cancers, which often overexpress a single anti-apoptotic BCL-2 protein, solid tumours routinely express several pro- and anti-apoptotic proteins [
6]. In the setting of solid tumours, it is therefore more challenging to determine which cancer type and which individual patients may best benefit from a given BCL-2 antagonist, highlighting the need for novel systems-based patient stratification tools.
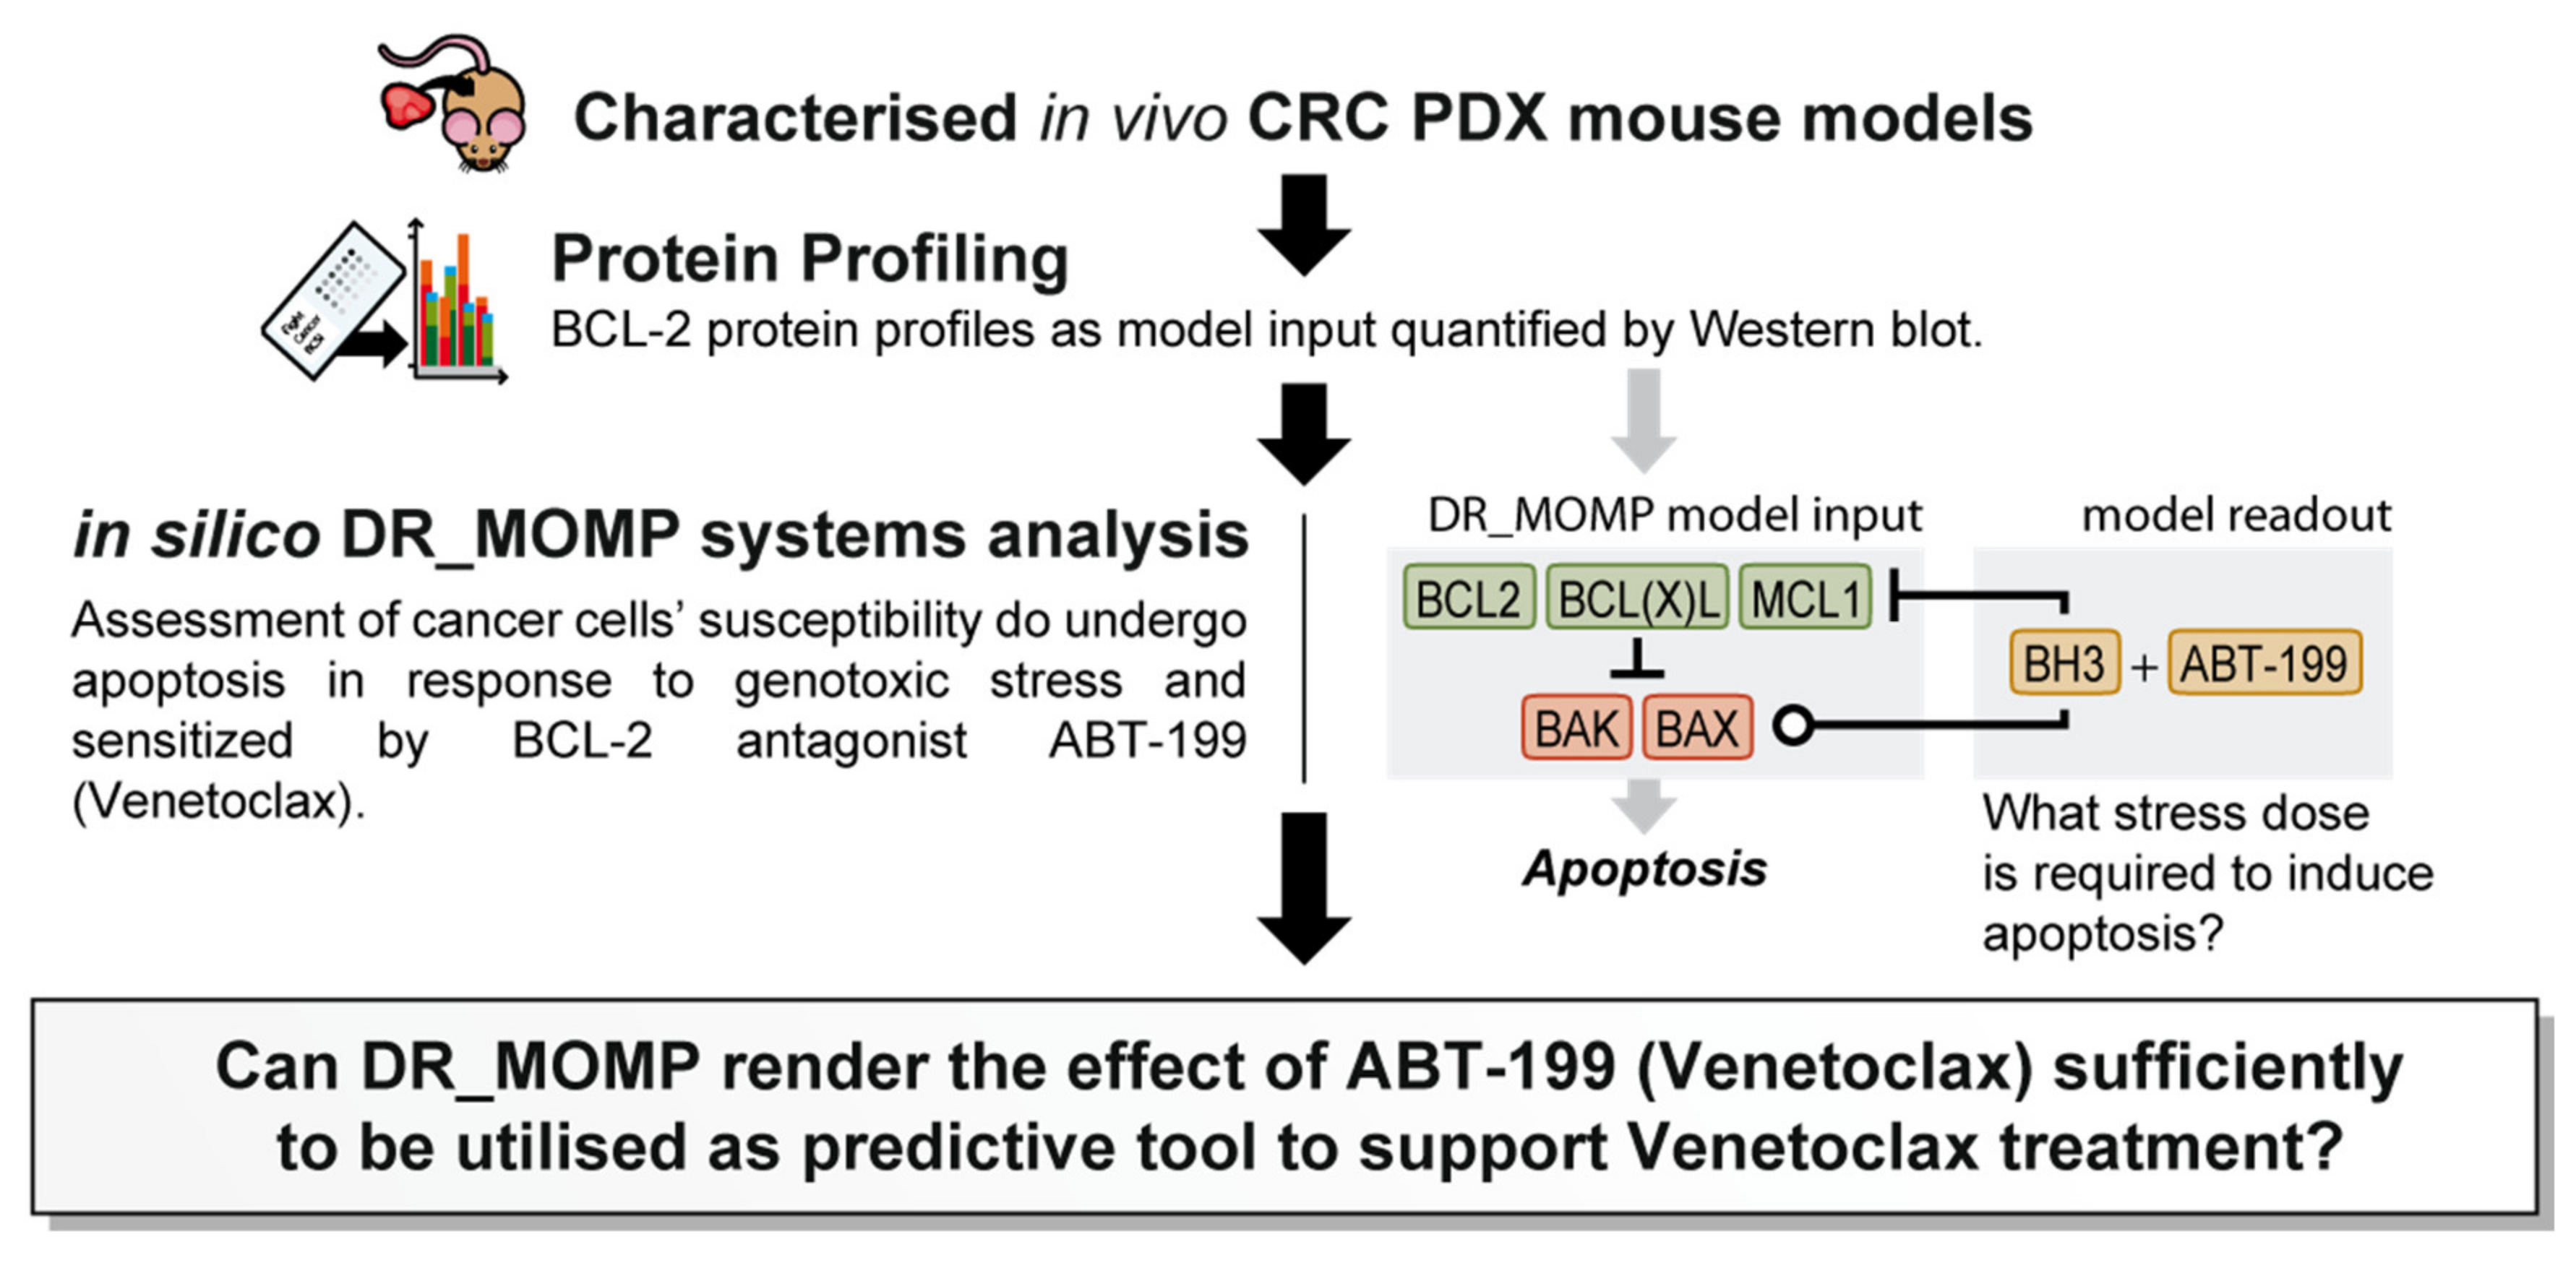
We previously developed and extensively validated a computational tool, DR_MOMP, which determines the sensitivity of cancer cells to undergo apoptosis [
7,
8,
9]. DR_MOMP is a systems model based on ordinary differential equations (ODEs). It incorporates BCL-2 protein levels of five BCL-2 family members BAK, BAX, BCL-2, BCL-2-like 1-long (BCLxL), and myeloid leukaemia cell differentiation protein (MCL-1), measured by quantitative Western blotting or reverse phase protein array analysis, their interaction kinetics, as well as translocation and degradation kinetics of these proteins to calculate the amount of BH3-only proteins (‘stress dose’) required to induce the process of MOMP [
7,
9]. DR_MOMP hence delivers for each tumour/cell type a numerical value (‘stress dose’) that is a prognostic marker of clinical outcome in colorectal cancer (CRC) [
7,
8,
9], and capable of predicting the response of CRC [
7] and breast cancer cells [
10] to genotoxic therapy. Here, we extended the application of DR_MOMP to include the effect of ABT-199 on the apoptosis signalling network, and to determine whether the deterministic model could also be used as a stratification tool for the BCL-2 antagonist ABT-199 in in vivo CRC patient derived xenograft (PDX) models (
Figure 1). A secondary, hypothesis generating-aspect of the research question was to investigate whether tumour glucose metabolism and/or radiomics features derived from preclinical
18F-Flourodeoxyglucose positron emission tomography/computed tomography (18F-FDG-PET/CT) supported model predictions.
3. Discussion
In this study we have investigated whether the BCL-2 systems model DR_MOMP could be exploited as a predictive tool for response to ABT-199 treatment in mCRC patients. In line with previous studies [
9,
16], the model successfully identified tumour cells resistant to 5-FU/OX treatment. To note, in a previous study using a panel of colon cancer cell lines (
n = 6) we showed a correlation between DR_MOMP scores and sensitivity to genotoxic drugs 5-FU/OX ([
7],
Figure 3). Here, we demonstrate that DR_MOMP can identify mCRC tumours that benefit from the addition of ABT-199 to 5-FU/OX-based genotoxic therapy. ABT-199 was approved by the Food and Drug Administration (FDA) in 2016 for treatment of chronic lymphocytic leukaemia and is currently incorporated in more than 150 ongoing clinical trials [
17]. However, there are limited trials in solid tumours and none specifically related to CRC, which is surprising considering the well-known relationship between BCL-2 family protein expression to both prognosis and resistance to treatment in CRC [
7,
17,
18,
19,
20]. CRC tumours show high heterogeneity in their expression of multiple pro- and anti-apoptotic BCL-2 family proteins [
7,
9]. Tools such as DR_MOMP may, as demonstrated here, identify individual mCRC patients who might benefit from BCL-2 antagonist therapy in future clinical studies.
In vitro, DR_MOMP predicted for DLD-1 and HCT-116 CRC cell lines similar responses to ABT-199 and FOLFOX despite differences in their BCL-2 and BCL-xL levels. In both DLD-1 and HCT-116 cells, the combination of ABT-199 with low concentrations of genotoxic drugs (0.2 µM OX plus 1 µM 5-FU) did not result in more cell death when compared to cultures treated with ABT-199 only (
Figure S2C,D), and combination of ABT-199 with higher concentrations of OX plus 5FU (5.0 µM and 25 µM) were required to induce higher levels of cell death. Both cell lines showed a numerically homologous response in their in vitro decrease in cell viability and in silico decrease in DR_MOMP score (
Figure S2B–D), however the possibility also remains that low concentrations of OX plus 5-FU were protecting cells from ABT-199 induced death by activating protective stress responses induced by DNA damage.
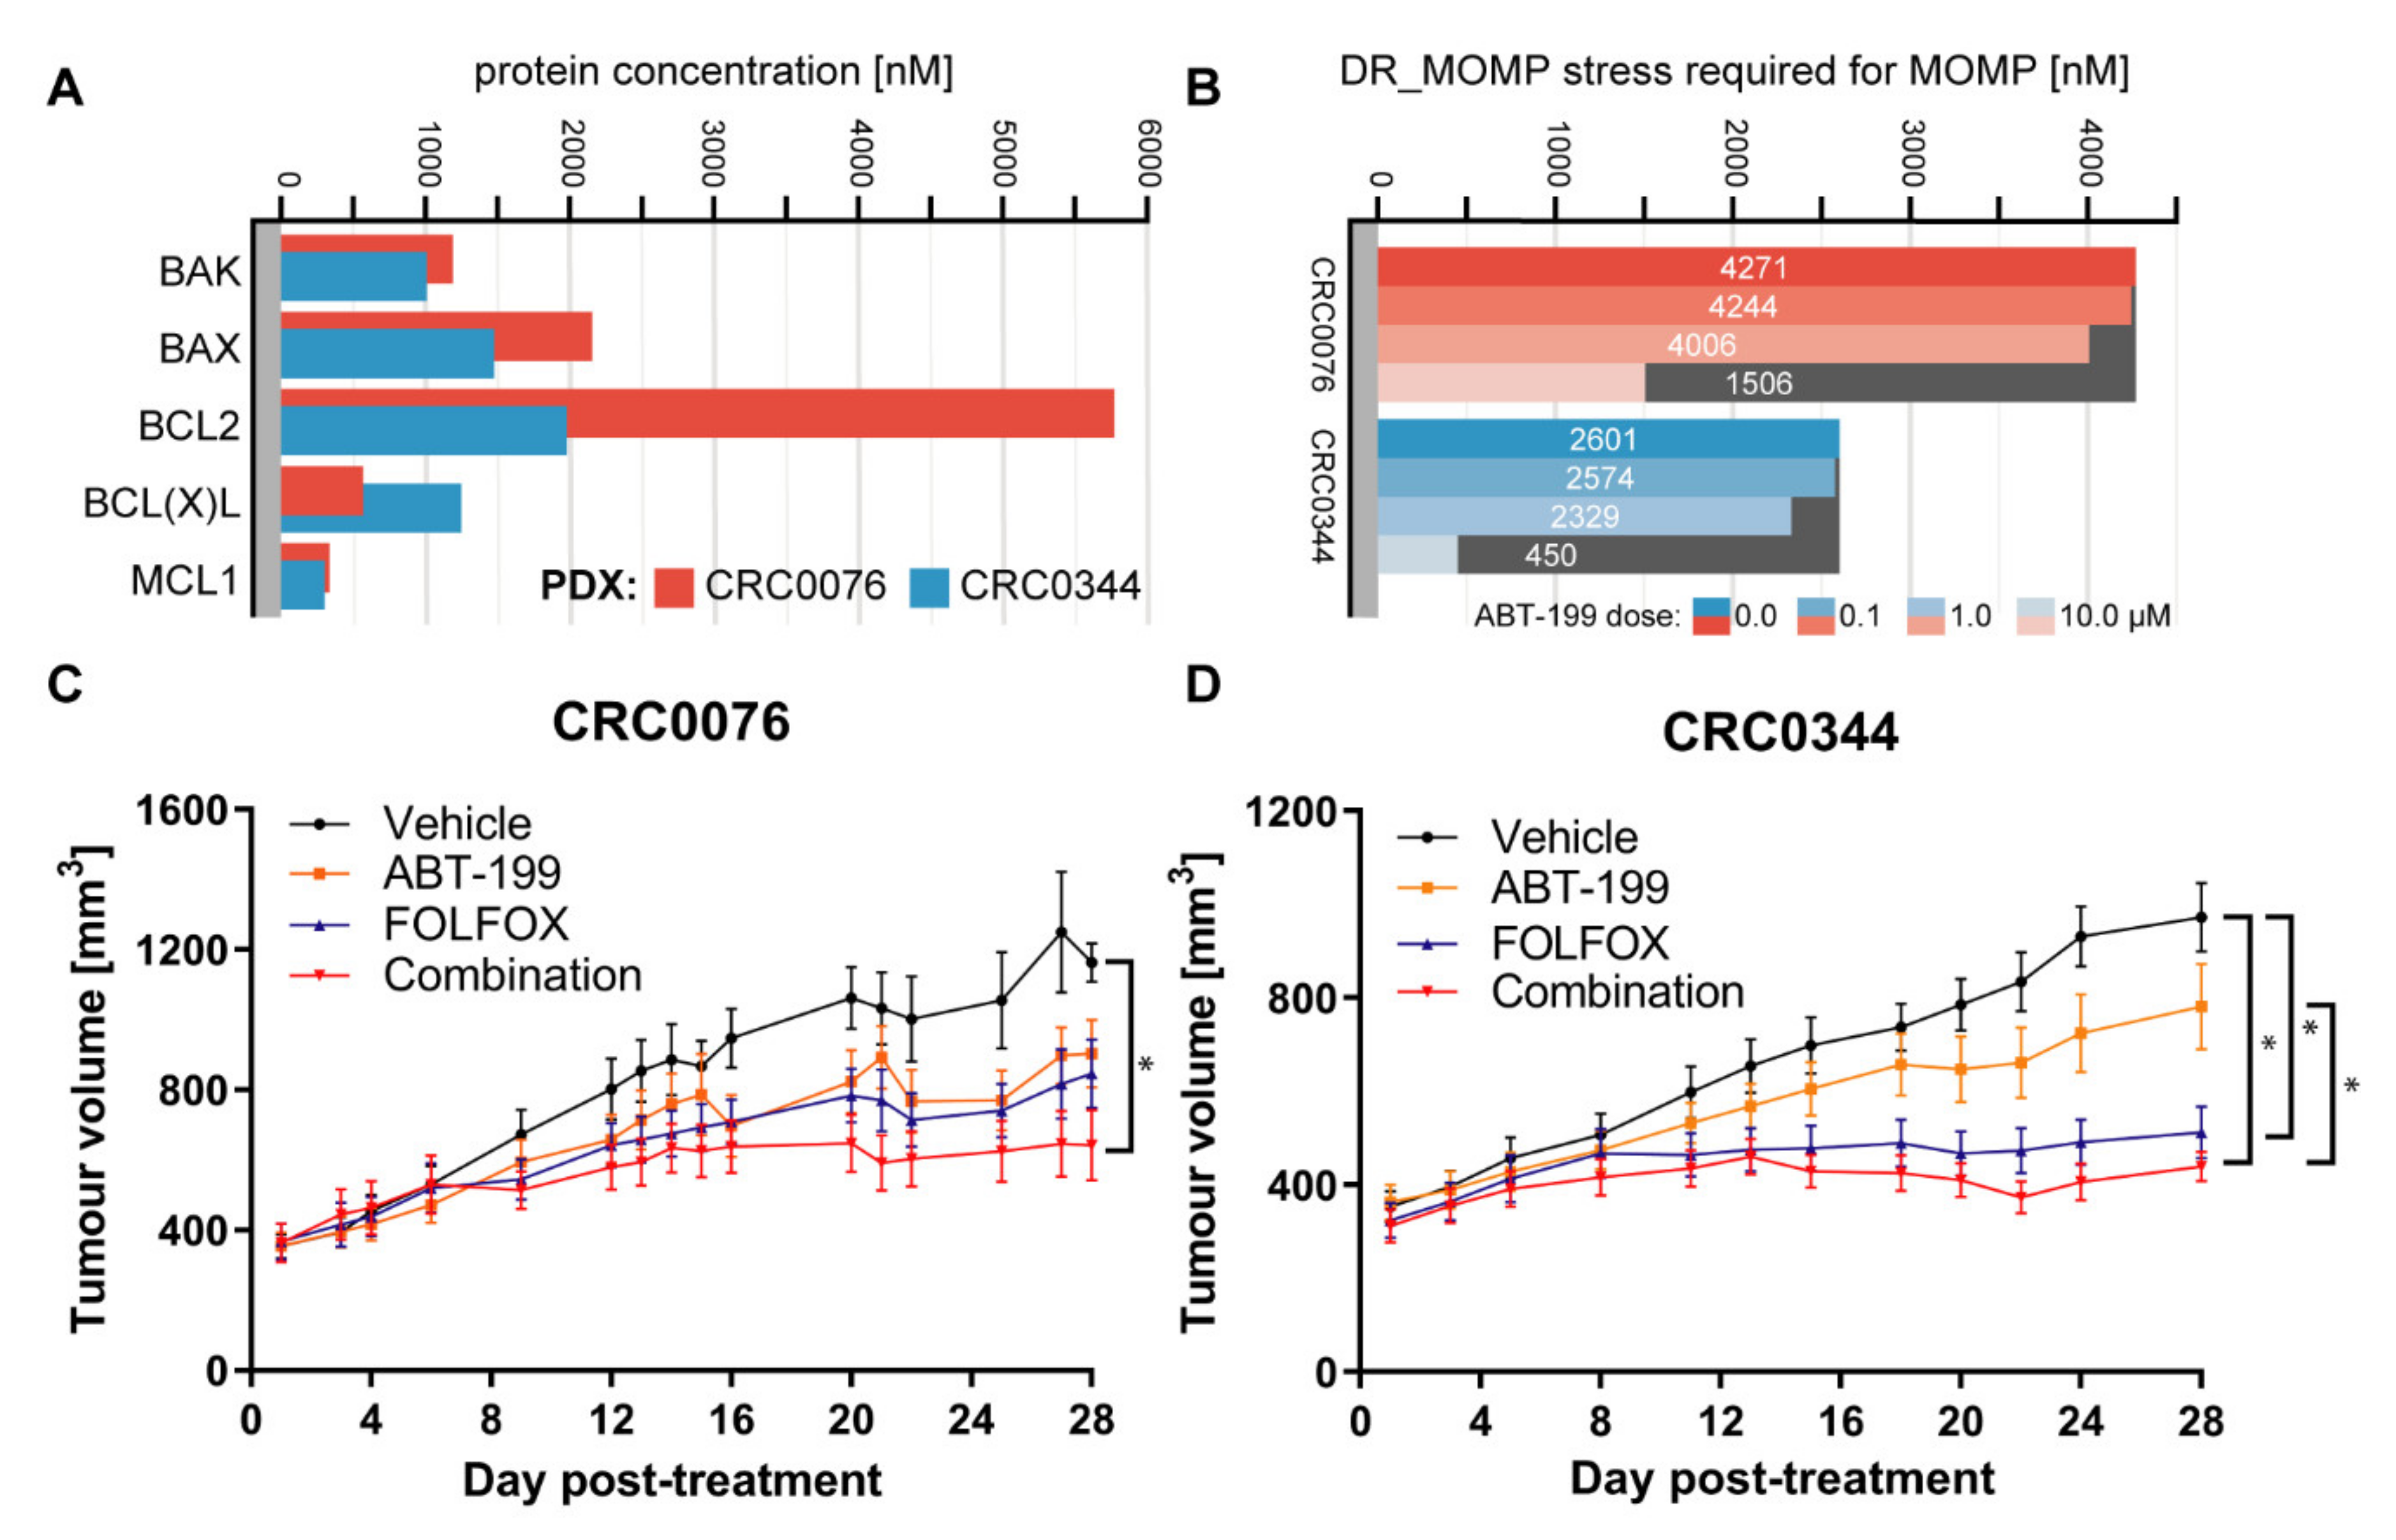
In the PDX models, which also showed varying BCL-2 family protein levels, while DR_MOMP predicted a differential response to ABT-199 and FOLFOX for CRC0076 and CRC0344, an n-fold greater BCL-2 concentration in one tumour did not translate to an n-fold higher requirement for BCL-2 antagonists (
Figure 2A,B). Previous observations have suggested that it may be sufficient to quantify BCL-2 protein levels as stratification tool for ABT-199 [
21]. However, our findings in both cell and tumour models, reinforce the assertion that individual BCL-2 family protein levels alone may be insufficient as a sole predictive biomarkers for ABT-199 response in CRC patients. This highlights the power of systems approaches to estimate drug responsiveness and further supports the role of systems-informed biomarkers in this setting.
To validate DR_MOMP predictions in an in vivo, clinically relevant setting, two PDX models were studied. CRC0076 was identified by DR_MOMP as having higher resistance to 5-FU/OX (thus rendering it potentially more susceptible to sensitisation by ABT-199) compared to CRC0344 (
Figure 2B). It is noteworthy that CRC0076 is faster growing than CRC0344, reflecting clinical differences in tumour growth rates as evidenced in patients. As predicted, a significant in vivo response to FOLFOX alone was elicited in PDX CRC0344, which was not significantly different to the response to ABT-199 + FOLFOX combination. In contrast, within PDX CRC0076 a significant response was only evident upon treatment with the ABT-199 + FOLFOX combination. The DR_MOMP prediction for which PDX would benefit from the addition of ABT-199 to FOLFOX was thus validated in our in vivo model. As ABT-199 is not an approved drug for the treatment of CRC (and therefore was not used to treat the two patients from which PDXs were derived), we were unable to establish if DR_MOMP was also predictive of patient outcome. Nevertheless, we have previously shown that DR_MOMP can predict response to adjuvant chemotherapy and neoadjuvant chemoradiation therapy in colon and rectal cancer patients. Moreover, DR_MOMP can also be used to calculate a predicted response of patients to BCL-2 antagonists [
7,
8,
9]. Future studies to further determine the translational relevance of DR_MOMP are now warranted (e.g., large-scale PDX co-clinical trials). Ultimately, future implementation of this technology in the clinic will require a tailored clinical trial.
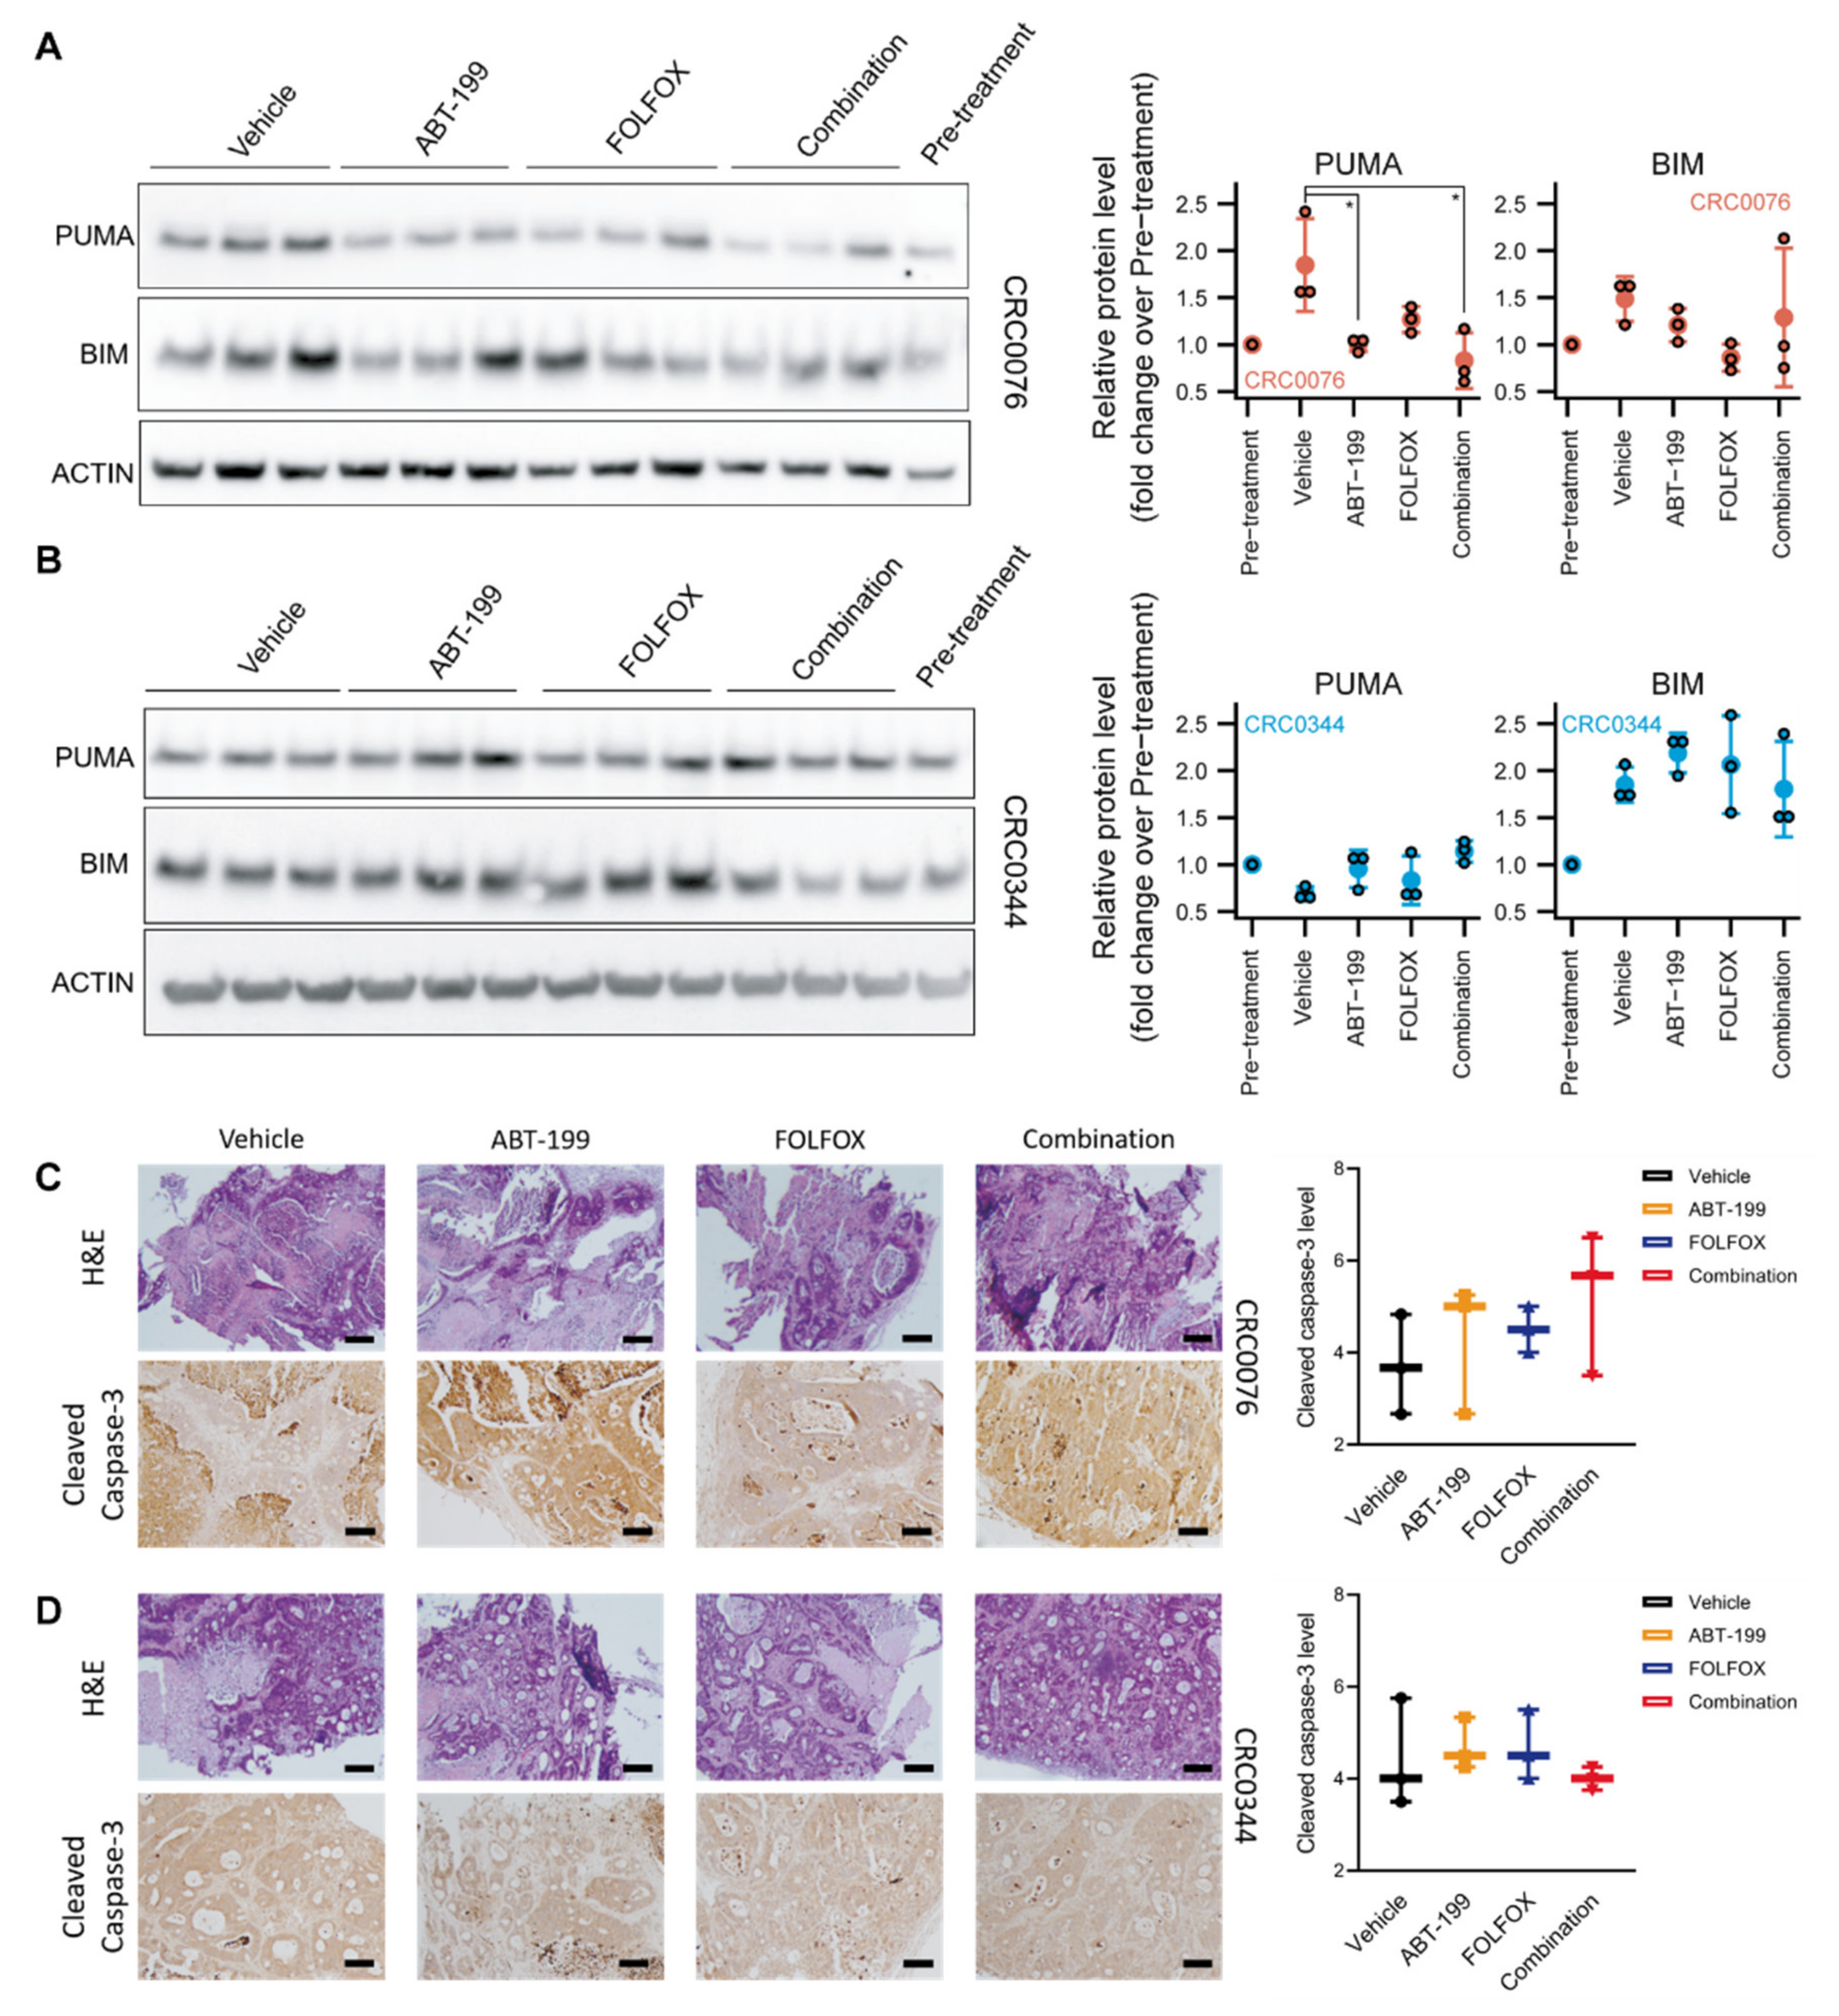
In growing tumours, the pro-apoptotic BH3-only protein PUMA is normally sequestered by BCL-2 and stabilised. In PDX CRC0076, which required ABT-199 for sensitisation, we observed significantly reduced levels of PUMA in ABT-199 treated animals, suggesting that it was released from BCL-2 (which is particularly high in this model) and degraded through the proteasome after ABT-199 treatment [
22]. These experiments therefore suggest efficient target engagement in vivo. BIM protein levels are also subject to rapid proteasomal degradation [
23], but were not significantly altered by ABT-199, although there was variability between the different groups. In PDX CRC0344, PUMA protein levels were not significantly altered by ABT-199 treatment, suggesting that any PUMA induced is functional (but rapidly degraded) and not sequestered by BCL-2. BIM levels were likewise not altered by the treatments.
Although histological examination of CRC0076 and CRC0344 PDX tumours revealed no significant change between the treatment groups in cleaved caspase-3 levels after 28 days of treatment, it is important to note that cleaved, active caspase-3 is likely only detectable in tissues for minutes to hours [
24]. Moreover, BCL-2 family mediated mitochondrial membrane permeabilisation controls both caspase-dependent and caspase-independent cell death pathways such as necroptosis, autophagic cell death and necrosis (reviewed in [
25]). Ki-67 staining showed a trend towards reduced cell proliferation in the high BCL-2 expressing CRC0076 PDXs upon ABT-199 treatment. These data suggest that BCL-2 might also control or correlate with cell proliferation, and that ABT-199 inhibits cell proliferation when administrated as a monotherapy (as also seen in ER-positive breast cancer [
26]). This effect may be linked to the ability of BCL-2 to improve bioenergetics in cancer cells, which in turn would be inhibited by Bcl-2 and Bcl-xL antagonists [
10]. However, we did not observe an inhibitory effect on cell proliferation in the combined treatment group. Here, the induction of apoptosis may have activated a compensatory effect on cell proliferation, a process that is known to occur both physiologically and in the cancer setting (reviewed in [
27]).
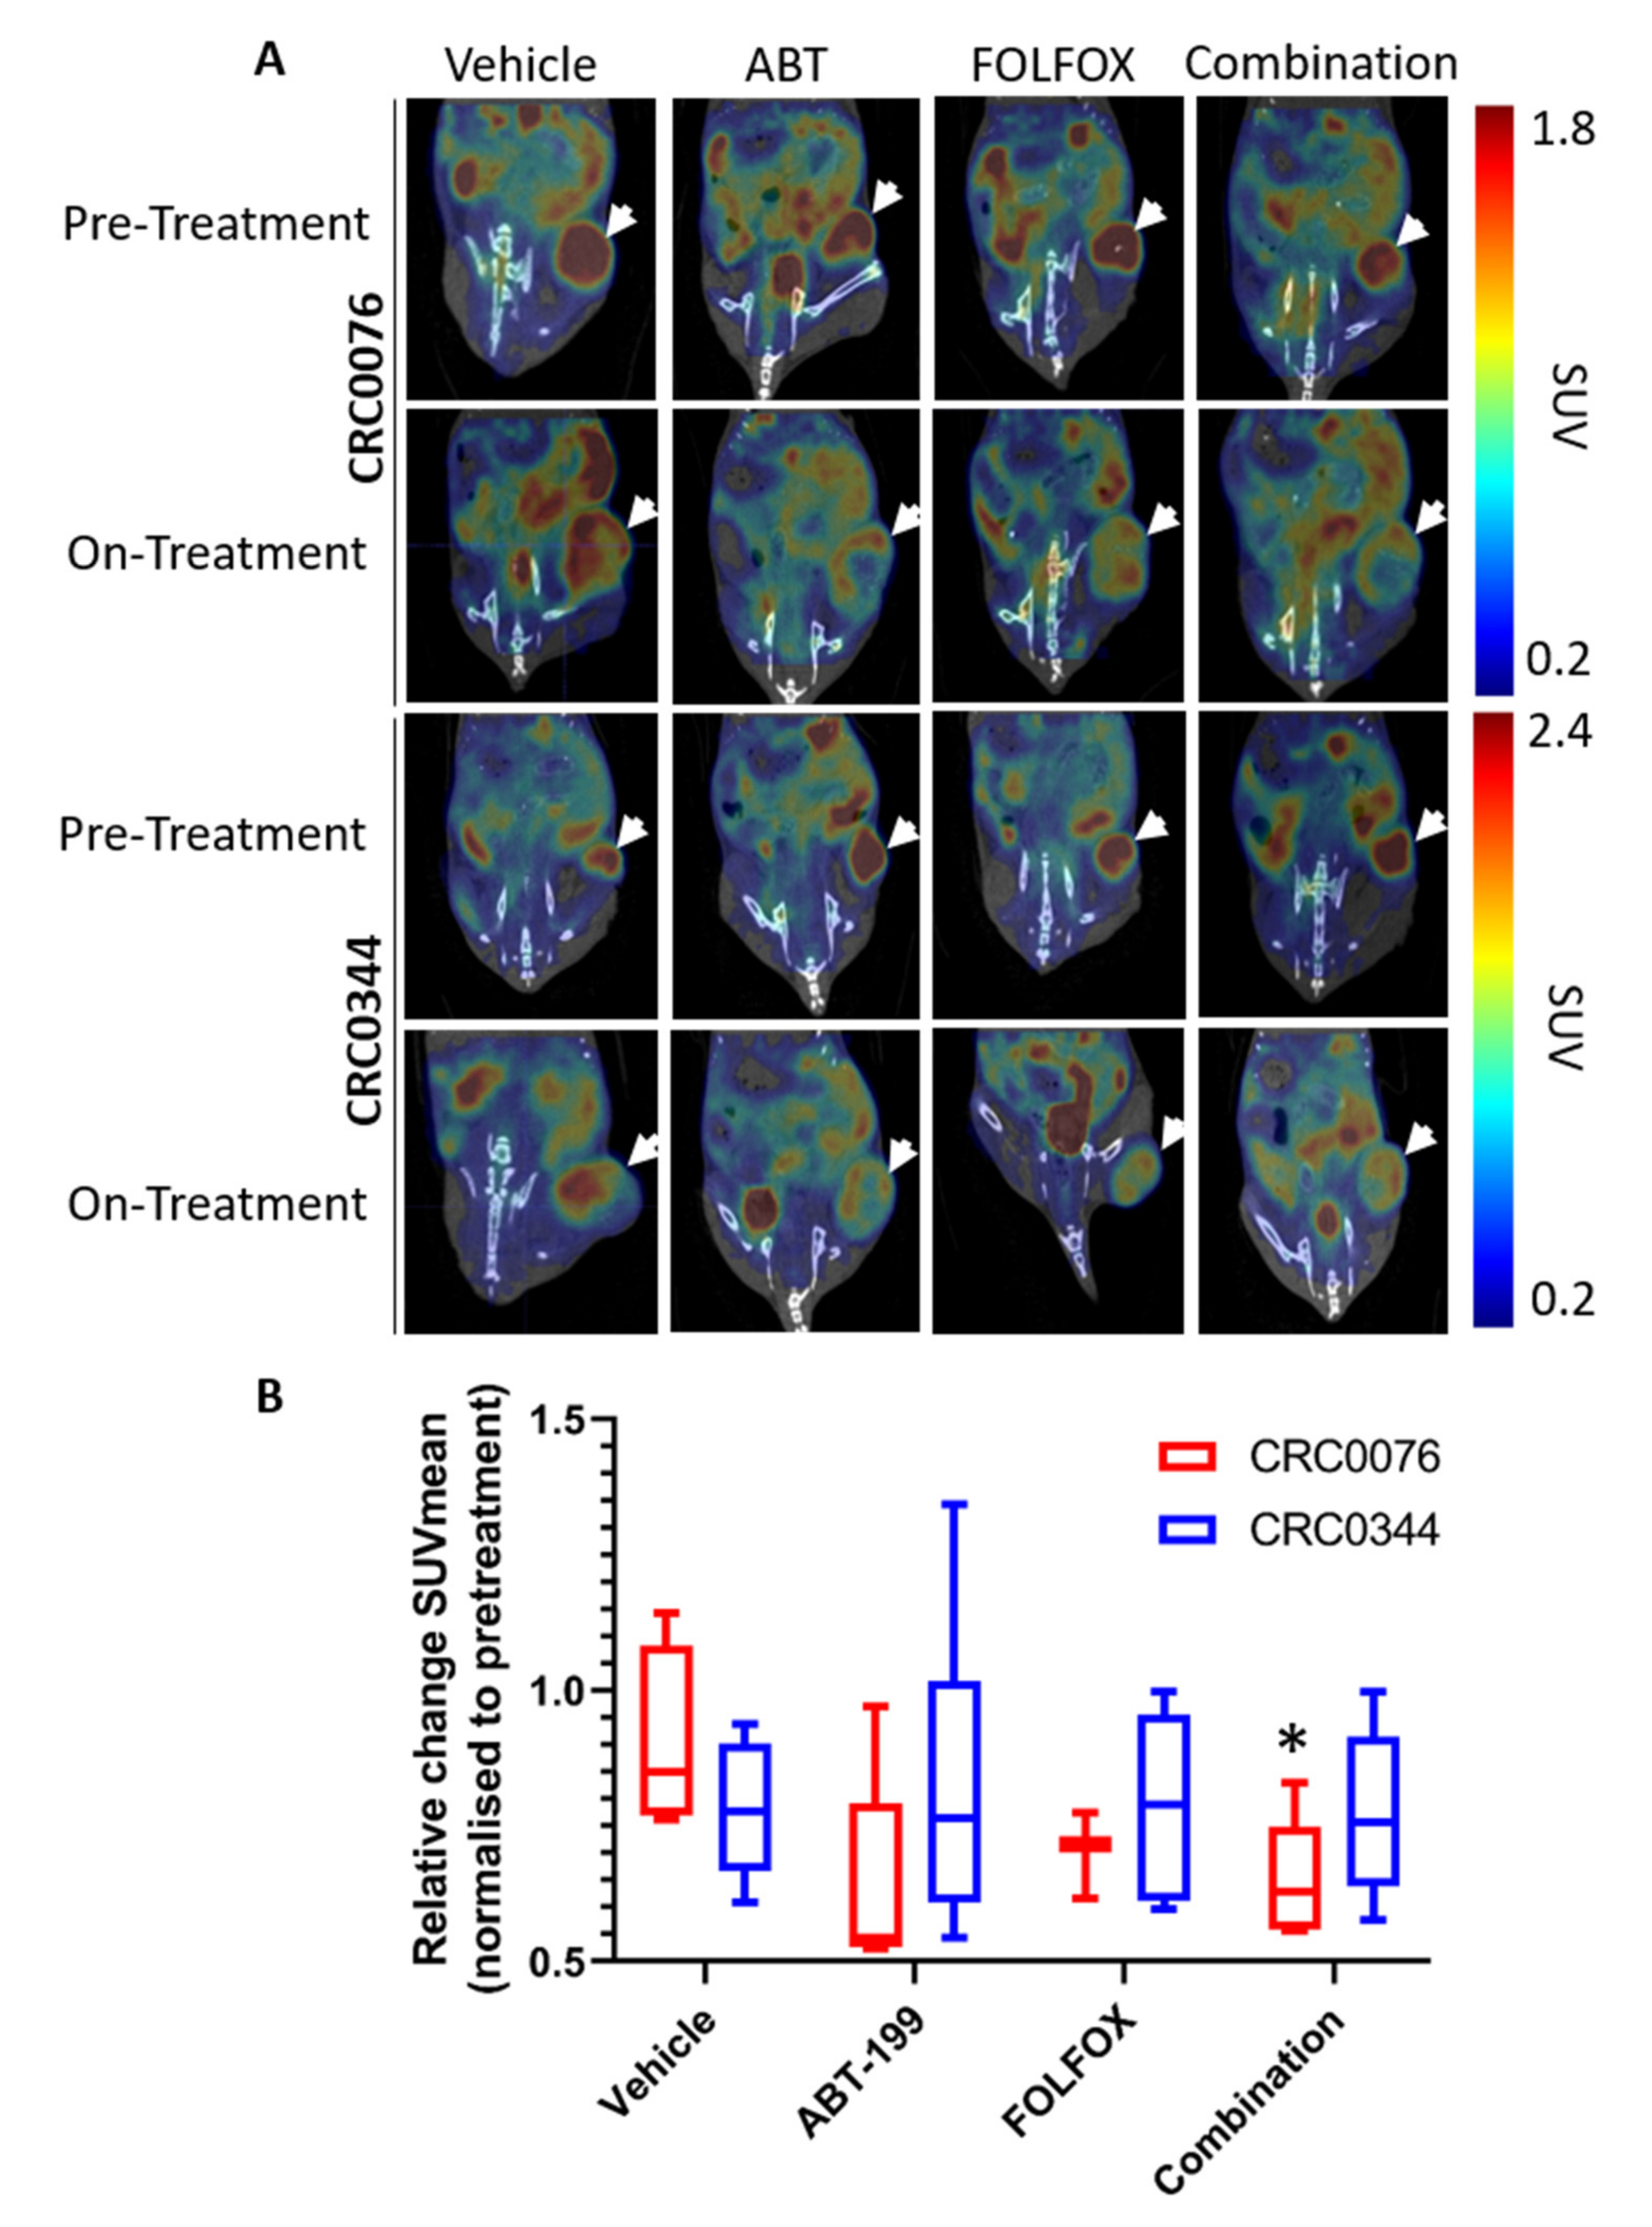
We next implemented an
18F-FDG-PET imaging approach to determine if early changes in tumour glucose uptake and metabolism could predict treatment outcome. The rationale here was that in addition to controlling the process of MOMP during apoptosis, BCL-2 family proteins also regulate the bioenergetics status of cells and may act directly on the mitochondrial respiratory chain as discussed above [
28,
29,
30,
31,
32]. Thus, we hypothesised that
18F-FDG-PET may predict response to therapy at an earlier time point than that seen using other clinical parameters (e.g., change in tumour size). Interestingly after two weeks of treatment, only CRC0076 tumours exposed to combination therapy showed a significant decrease in SUV mean (indicative of overall glucose metabolism). SUVmax (generated using the most intense 4 voxels per volume of interest (VOI) was also investigated but provided no additional insight). In this model, tumours in the combination group were significantly smaller than those treated with FOLFOX or ABT-199 alone. These data suggest that in tumours characterised by high BCL-2 levels, and predicted by DR_MOMP to respond favourably to the addition of ABT-199 to FOLFOX,
18F-FDG-PET may be an early response biomarker. Corroborating these results, a recent phase 1b study of ABT-199 combined with tamoxifen in ER and BCL-2–positive metastatic breast cancer treatment responses were pre-empted by metabolic responses using
18F-FDG-PET [
26]. Importantly, this was the first clinical study to evaluate ABT-199 in a solid tumour. It remains unclear as to why glucose metabolism was not reduced in the CRC0344 model despite both FOLFOX alone and the combination tumours being significantly smaller than untreated controls. One possible explanation is that non-apoptotic functions of BCL-2 family proteins include effects on glucose metabolism [
33,
34]. In
Figure 2A CRC0076 is seen to have elevated BCL-2 but lower BCL-xL levels compared to CRC0344. Moreover, the effect on PUMA and BIM following treatment was variable between the two models (
Figure 3). It is possible that differential expression of other BCL-2 family members could underpin variance in glucose metabolism across the two models. Further mechanistic studies are warranted.
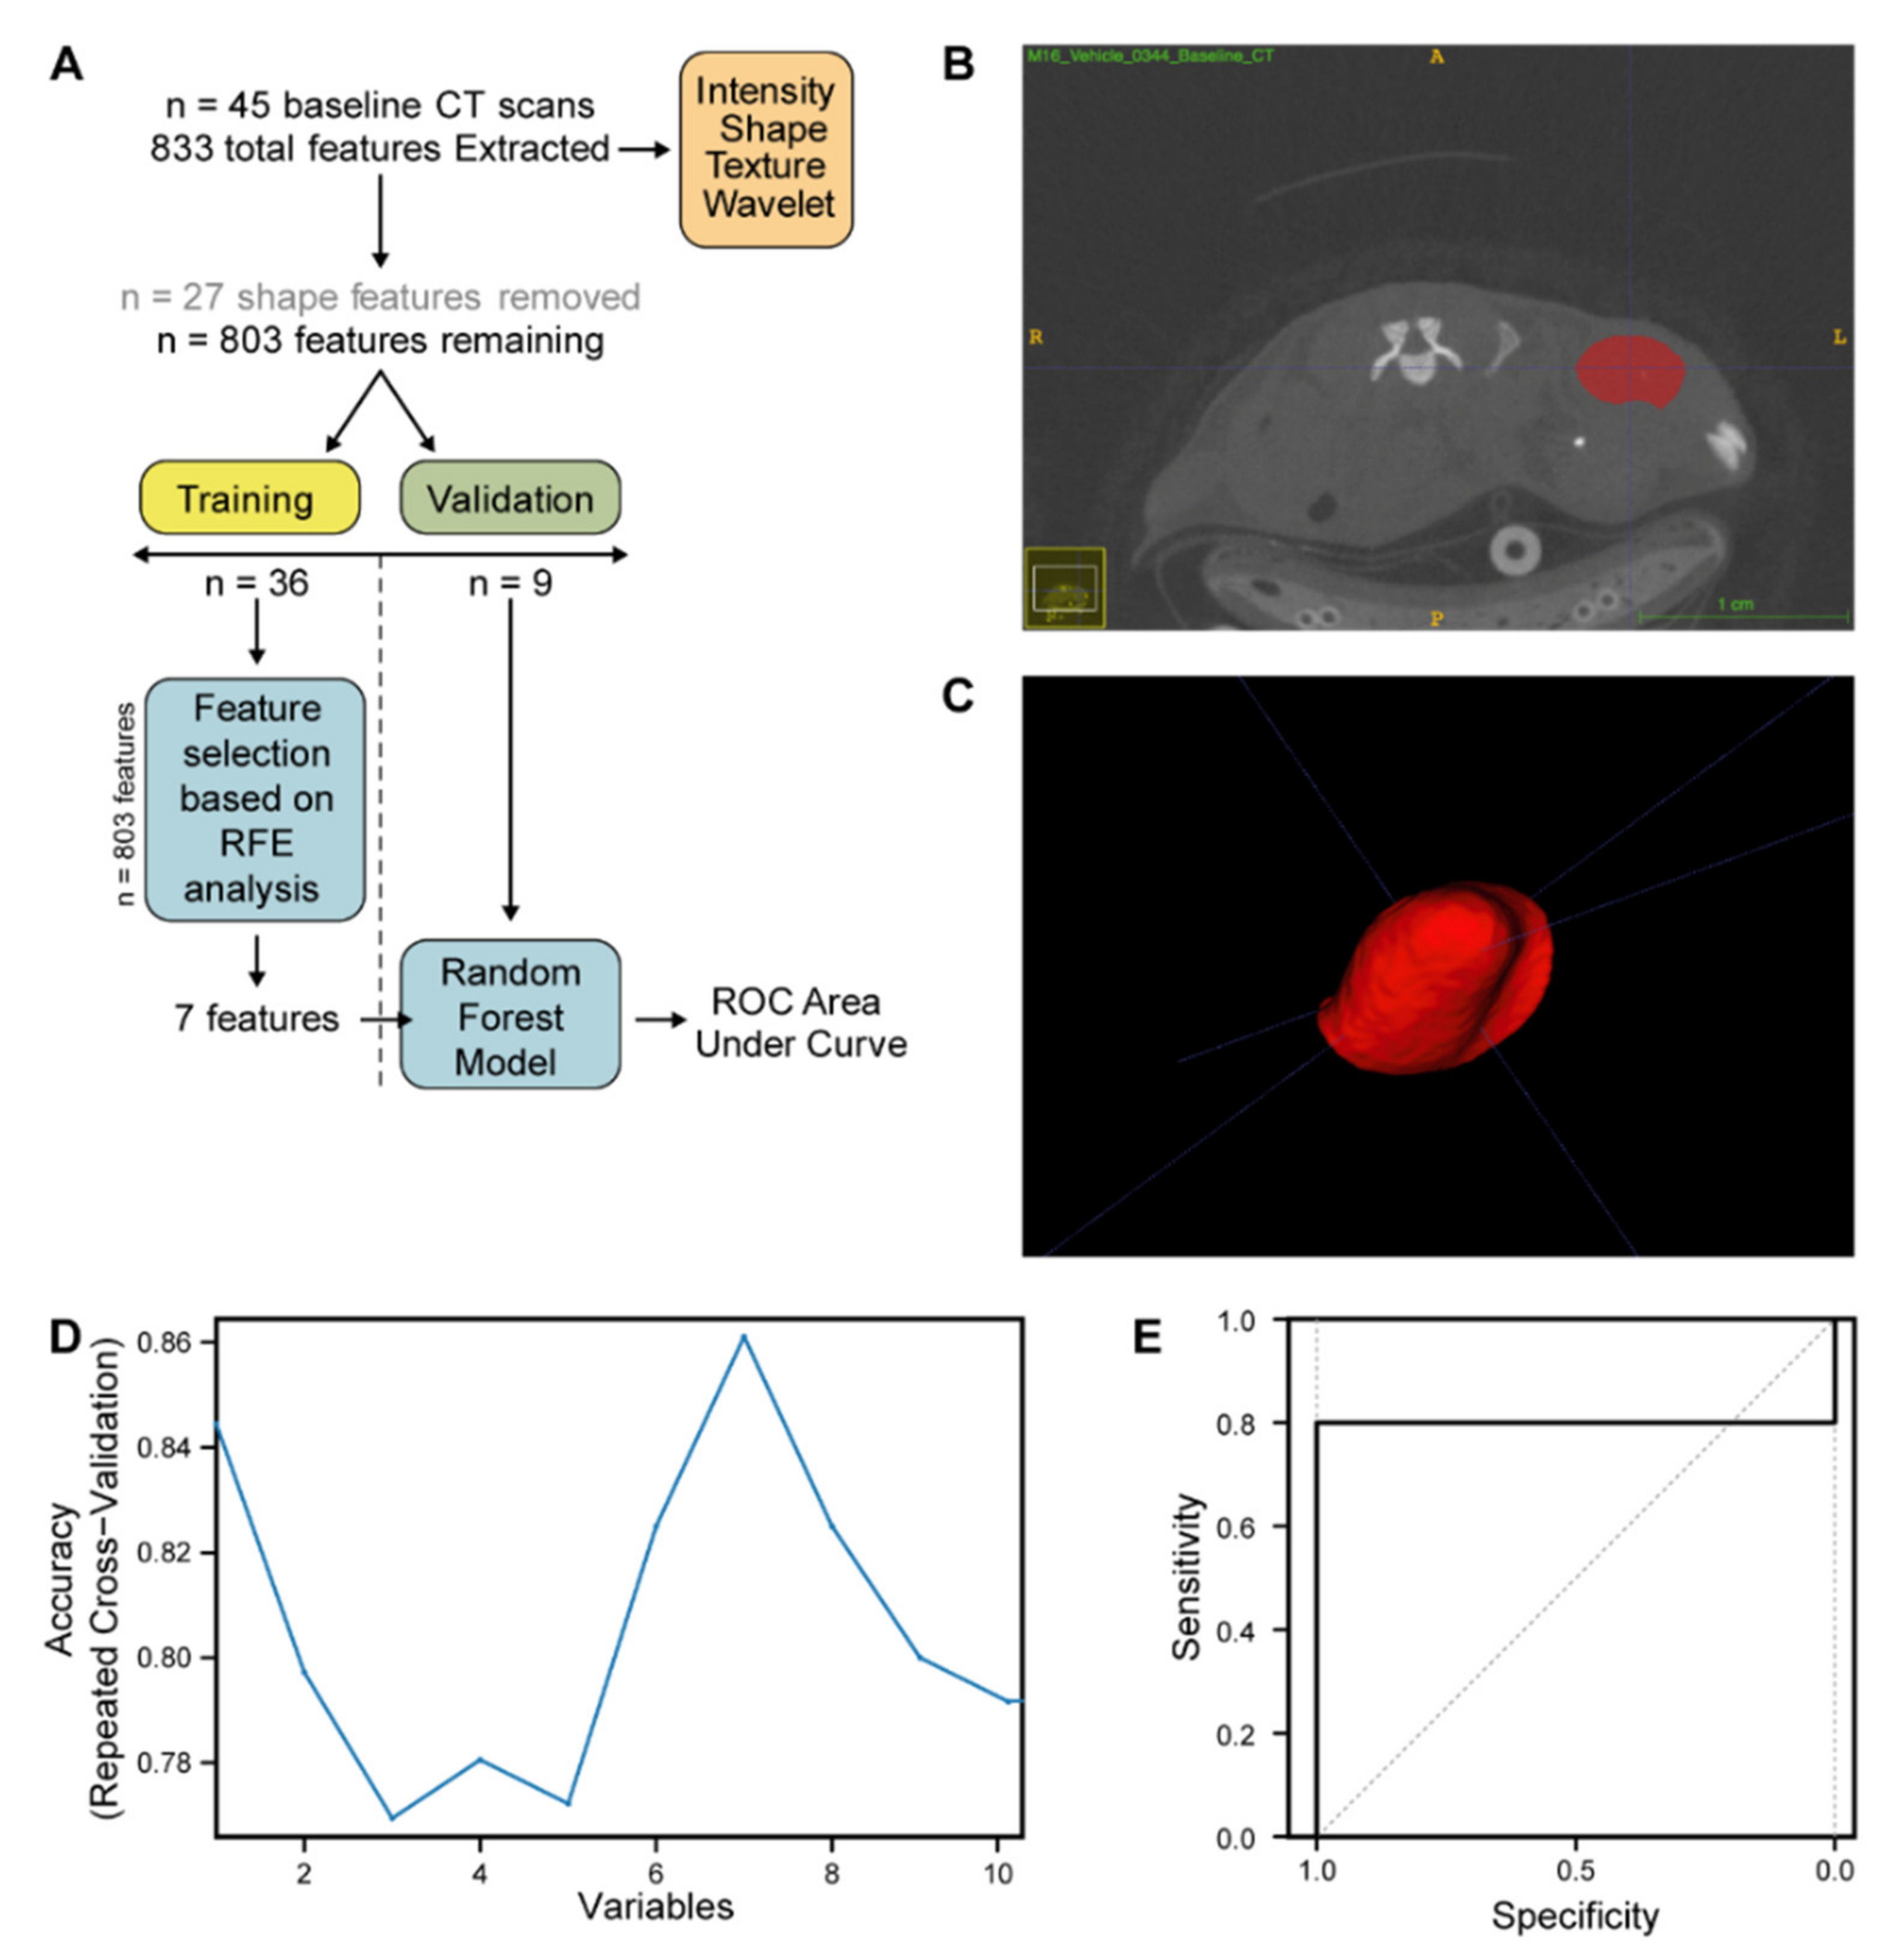
Next, CT data from pre-treatment and 2 weeks post-treatment PDX mouse tumour scans from DR_MOMP predicted combination-only responder (CRC0076) and FOLFOX alone responder (CRC0344) PDX models underwent additional radiomic analysis. Radiomics is a multistep process in which radiographic features based on shape, pixel intensities, and texture are extracted both from clinical and pre-clinical radiological images [
35,
36,
37]. Radiomic analysis of CT data was undertaken due to the clinical relevance of CT in the CRC patient setting. In addition to providing novel methods of tumour classification and staging, radiomic analyses may also reveal critical information underpinning the biology of tumours [
38]. Here, our CT radiomics pipeline identified 7 radiographic features, extracted from pre-treatment PDX CT images, that when combined into a random forest model were able to classify PDX CRC0076 from PDX CRC0344 (
Figure 5D, AUC 0.8 95% CI 0.408–1). These hypothesis-generating data suggest that the model can discriminate the two PDXs based on radiomics features. Interestingly, 6 of 7 of these features were wavelet or multiscale textural features. Such features have previously been employed in patient tumour classification. Specifically, Chaddad et al. used wavelets to classify and discriminate whole slide colon cancer images into different grades of CRC with 93.33% accuracy [
39]. This suggests that a CRC PDX CT radiomics pipeline is likely to have useful translational potential. Further validation to understand the predictive potential of wavelet or multiscale textural CT radiomic features in interventional CRC PDX population [
40] and clinical trial datasets are warranted.
We subsequently investigated if any of the identified 7 features could individually predict end-study treatment outcome in the DR_MOMP predicted combination-only (CRC0076) responder or FOLFOX alone responder (CRC0344) models. Due to the limitation of treatment group size (
n = 5–6), modelling was not undertaken on the post-treatment scan feature sets. Rather, we compared the values of each radiomics feature, extracted from 2 week post-treatment images, to pre-treatment values (
Figure S6). In CRC0076 PDX tumours treated with ABT-199, after 2 weeks of treatment the intensity of feature Wavelet.HHL_ngtdm_Busyness was significantly higher (
p = 0.04526) than at baseline (
Figure S6A). This observation suggests that treatment with ABT-199 alone alters the radiographic phenotype of the tumour. However this feature change was not represented by a change in tumour volume at this time point. Moreover, this change did not precede a significant treatment response after 4 weeks (
Figure 2C). All other significant changes in radiomic feature intensity observed after 2 weeks of treatment in either PDX were seen across all cohorts including vehicle (
Figure S6C,D,F,H,N). As feature intensities changed equivalently across cohorts, these changes are likely associated with inherent phenotypic changes in PDX tumours over time, including tumour volume. Future studies should consider the implication of tumour size; Specifically, comparing tumours of a similar volume would decrease “noise” and improve comparisons.
A limitation of the current radiomics study is the relatively small number of available PET/CT images compared with previous reports [
41]. Here, radiomics was performed using limited available data from a preclinical study powered in the first-instance for drug efficacy comparisons. Moreover, test-retest analyses were not performed. Nevertheless, to the best of our knowledge we have for the first time established a CT radiomics pipeline for application in CRC PDX studies. Such analyses will likely become increasingly important as the PDX field evolves, with an expanding focus on the use of orthotopic models requiring clinically relevant imaging [
40,
42,
43]. Indeed, the translational relevance of pre-clinical radiomic ‘discovery’ studies in animal models is now becoming evident. For example, Zinn et al. recently employed radiomic analyses on glioblastoma magnetic resonance data sets from mice and humans, and showed that selected imaging features are conserved across species [
44]. In the current context, future work employing CT scan data from large scale population-based CRC PDX trials is now warranted. Increasing the number of CT images available for analysis could identify more robust predictive radiomics signatures having utility as predictive biomarkers.
4. Materials and Methods
4.1. Quantitative Western Blotting
Western blot analysis was performed as previously described [
8]. Briefly, tumour specimen pellets (tumours were halved following removal and all material was used for blotting) were directly homogenised and mixed with lysis buffer containing 0.5 mmol/L Tris(hydroxymethyl)aminomethane—hydrogen chloride (Tris-HCl) (pH 6.8), 10% glycerin (
w/v), 2% sodium dodecyl sulfate (SDS) (
w/v), and protease and phosphatase inhibitor cocktails (Sigma Aldrich, Gillingham, UK). Cell pellets were directly mixed with the lysis buffer. Proteins were transferred onto nitrocellulose membranes using semi-dry transfer. Primary antibodies for BAX, BCL-xL (Cell Signaling Technology, London, UK), BIM (Abcam, Cambridge, UK), BCL-2, MCL-1, BAK, and PUMA (Santa Cruz, Heidelberg, Germany) were used. A 1:5000 dilution was used for β-actin (Sigma Aldrich) and glyceraldehyde 3-phosphate dehydrogenase (GAPDH) (Abcam) proteins as loadings control. After overnight incubation, peroxidase-conjugated secondary antibodies (Chemicon, France or Jackson ImmunoResearch, Ely, UK) at a 1:5000 dilution were added. Images were captured using a LAS-3000 Imager equipped with a cooled 12-bit digital charge-coupled device camera (FUJIFILM UK Ltd. Systems, Sheffield, UK). For BCL-2 family protein quantification HeLa cell extracts (20 µg) were blotted alongside samples for standardisation and quantification. For densitometry analysis, the intensity of protein bands within tumour samples were normalised to the loading control after background subtraction using ImageJ software (National Institutes of Health, Bethesda, MD, USA). Absolute protein levels were calculated by normalising values to HeLa cells. Absolute protein concentrations in HeLa cells were determined with recombinant proteins previously [
7].
4.2. DR_MOMP Calculation
Cells’ sensitivity to undergo apoptosis was calculated using the ordinary differential equation-based systems model DR_MOMP [
7]. Absolute protein levels of BAK, BAX, BCL-2, BCL-xL, and MCL-1 were used to calculate the genotoxic stress dose that induces MOMP (‘stress dose’). ABT-199’s binding affinities were modelled with dissociation constants 0.01 nM for BCL-2, 48.00 nM for BCL-xL and 444.00 nM for MCL-1 [
10,
21]. Sensitivity of CRC cell lines and PDX models to undergo apoptosis was determined without and with different doses of ABT-199 ranging from 0 to 10 μM. The ABT-199 dose was applied at the same time and for the same duration as the modelled genotoxic stress (12 h). DR_MOMP was executed with Matlab R2007b (V.7.5.0.342; The MathWorks, Natick, MA, USA). Where p53 status was known (DLD-1 cells), DR_MOMP calculations accounted for deficient Puma and Noxa induction [
7].
4.3. Chemicals
ABT-199 was kindly provided by AbbVie (North Chicago, IL, USA). Oxaliplatin (OX) and Fluorouracil (5-FU) were obtained from Sigma-Aldrich (St. Louis, MO, USA) when used for in vitro studies. OX (TEVA UK Ltd., Castleford, UK), 5-FU (ITH PHARMA, London, UK) and folinic acid (TEVA UK Ltd., Castleford, UK) were kindly provided by Beaumont Hospital Dublin when used for in vivo studies (FOLFOX treatment regimen).
4.4. Cell Lines
Authenticated human CRC (HCT-116 and DLD-1) cell lines were provided by the School of Medicine, Dentistry and Biomedical Sciences, Queen’s University Belfast, United Kingdom. Furthermore, all cell lines were Mycoplasma tested regularly. Cells were cultured in RPMI 1640 medium (Sigma-Aldrich). All cell lines were maintained at 37 °C in a humidified atmosphere supplied with 5% CO2.
4.5. In Vitro Toxicity Assays and Synergy Calculations
Acid phosphatase assay was used to measure cell viability based on the conversion of 4-Nitrophenyl phosphate (pNPP) to p-nitrophenol by cytosolic acid phosphatase [
45]. pNPP disodium salt hexahydrate was purchased from Sigma-Aldrich. Cells were grown in a 96 well plate at a density of 1.5 × 10
4 cells per well and treated with increasing concentrations of 5-FU/OX (with a concentration ratio of 1:5 between OX and 5-FU) in combination with increasing concentrations of ABT-199. After 48 h treatment medium was removed and each well was washed once with 200 μL of 1× phosphate buffered saline (PBS). To each well, 100 μL of assay buffer (0.1 M sodium acetate at pH 5.0, 0.1% Triton X-100, and 7.25 mM p-nitrophenyl phosphate) was added. The plates were then incubated at 37 °C for 2 h. The reaction was finally stopped with the addition of 50 μL and colour development was assayed at 405 nm using a Clariostar plate reader (BMG Labtech, Offenburg, Germany), and applying a path length correction of 200 µL. The non-enzymatic hydrolysis of the pNPP substrate was also determined by including wells with the assay buffer and without any cells. An excel template was used to calculate the fraction affected from viability percentages and the results were analysed with the web version of Chalice Analyzer (Horizon Discovery, Waterbeach, UK) to calculate isobolograms.
4.6. Animals
Four- to six-week old (c. 20–25 g) female non-obese diabetic/severe combined immunodeficient (NOD/SCID) mice were purchased from Charles River Laboratories (Cambridge, UK). All animal procedures were approved by the Health Products Regulatory Authority (HPRA) (#AE18982-P099) and the University College Dublin Animal Research Ethics Committee (AREC) (#AREC-16-11).
4.7. PDX Efficacy Study
PDX CRC0076 and CRC0344 were selected for in vivo studies based on model predictions and known tumorigenicity of these models in vivo. The researcher performing the in vivo studies was blinded to the predicted DR_MOMP predictions. PDX implantation and expansion was performed as previously described [
46].
Mice with established tumours (n = 13–14/group/PDX) average volume 360 mm3) were assigned into groups ensuring that an even distribution of tumour sizes was represented in each group and that group averages were equal. Groups were subsequently treated for 4 weeks with either (i) ABT-199 (oral gavage, once daily at 100 mg/kg, dissolved in 60% phosal, 50 propylene glycol (PG), 30% polyethylene glycol (PEG) 400 and 10% ethanol), (ii) FOLFOX (all constituent drugs delivered IP, once weekly (on day 3 of each cycle), 5-FU (40 mg/kg in PBS) + Folinic Acid (13.4 mg/kg in PBS) followed two hours later by OX (2.4 mg/kg in 5% glucose/water (v/v)), (iii) a combination of both regimens (ABT-199 + FOLFOX), or (iv) all diluent vehicle solutions, as described. Tumour size was evaluated three times per week by caliper and volume calculated using the formula Tumour Volume = 4/3π × (d/2)2 × D/2, where d is the minor tumour axis and D is the major tumour axis.
4.8. Immunohistochemistry (IHC)
Subcutaneous tumours were excised, rinsed twice in Dulbecco’s-(D)PBS and fixed in 4% formaldehyde for 48 h. Tissues were embedded in paraffin and 5 μm thick sections were cut. Routine hematoxylin and eosin (H&E) staining was performed to facilitate histological evaluation. Standard immunohistochemistry methods were used to detect cleaved caspase-3 on 3 tumours from each treatment group. Briefly, antigen retrieval was performed using pH 6.8 sodium citrate buffer. Primary antibodies (Rabbit polyclonal antibody to cleaved caspase-3, 1:200 dilution or Mouse IgG antibody to Ki-67, 1:150 dilution [both Cell Signaling Technology, London, UK]) were incubated for 1 hr at room temperature, and staining completed using the Lab Vision UltraVision Large Volume Detection System (Fisher Scientific, Dublin, Ireland). All sections were scored blindly and semi-quantitatively by two independent observers. The Allred Score Method based on proportion of positive cells (scored on a scale of 0–5) and staining intensity (scored on a scale of 0–3) was used for cleaved caspase-3. The proportion and intensity were then summed and averaged to produce a total score [
15]. For Ki-67 analysis, slides were imaged and colour deconvolution was performed using ImageJ. The Ki-67 proliferation index was determined by calculating Ki-67 stained cells as a percentage of total cells.
4.9. 18F-FDG-PET/CT Study
Mice were fasted for 6 to 12 h prior to imaging and water provided ad libitum. 18F-FDGPET/CT scans was performed on a LabPET4 Triumph scanner (Trifoil Imaging, Chatsworth, CA, USA). PET system calibration was carried out by scanning a phantom scan of known activity as measured in a dose calibrator (Capintec, Florham, NJ, USA). A baseline scan was performed prior to treatment starting and a second scan was performed after 2 weeks of treatment. For imaging, mice were placed in a warming box for 20 min followed by intravenous (IV) tail vein injection under isoflurane anaesthesia, of 8.9 megabecquerels (MBq) (+/− 0.8 MBq) 18F-FDG diluted with saline to a volume of 200 µL. Following injection of 18F-FDG, mice remained under anaesthesia for a 1-h uptake time, with appropriate heating provided to maintain body temperature. A CT scan was taken immediately prior to a 15 min PET scan. Cone beam CT images (focal spot size, 33 mm) were acquired over ~5 min with 512 projections at a geometric magnification equal to 2. X-ray tube voltage and current were 50 peak kilovoltage (kVp) and 350 µA respectively and exposure was 232 ms. CT images were reconstructed with Cobra (Exxim Computing version 7.3.4, Pleasanton, CA, USA)) to a voxel size of 0.1 × 0.1 × 0.1 mm3. PET images were re-constructed with a 3-dimensional (3D) MLEM (Maximum Likelihood Expectation Maximisation) reconstruction algorithm (15 iterations, voxel size of 0.5 × 0.5 × 0.6 m3) using the LabPET software (version 1.14.0, Trifoil Imaging) PMOD (Version 3.208, PMOD Technologies, Zürich, Switzerland) software was used to draw VOIs around the entire tumour and SUV was calculated using the following equation: SUV = A/(ID/BW), where A is the activity in the tumour per unit volume, ID/BW is the injected dose per bodyweight and all activities are decay corrected to injection time. SUVmean is the mean SUV value of all voxels included in the VOI and is a measure of glucose uptake and metabolism (i.e., overall glucose metabolism) within the VOI, in this case in the PDX tumours. SUVmax is the average value of the four most intense voxels from each VOI. PET images were co-registered and resliced to CT data for illustration purposes or for guidance as required when delineating CT tumour volumes.
4.10. Radiomic Analysis of CRC PDX CT Images
Following reconstruction of image volumes, 45 tumours from
n = 2 PDX models (CRC0334 and CRC0076) were delineated by three independent researchers. ROI (region of interest) were generated and segmentation carried out on CT scans of PDX tumours using a semi-automatic method using ITK-Snap [
47] and PMOD software (Version 3.208, PMOD Technologies). Radiomic feature extraction was performed with PyRadiomics V2.7.7 (Harvard Medical School, Boston, MA, USA) [
48]. A total of 833 features were extracted from each pre-treatment CRC PDX CT image, including first order, shape, Gray Level Size Zone Matrix (GLSZM), and Gray Level Run Length Matrix (GLRLM). The feature data set of the 45 pre-treatment CRC PDX images was next split into two cohorts, training and validation, in a 80:20 ratio (
n = 36 and
n = 9 respectively, ensuring a 50:50 spilt of the two PDXs (CRC0076 and CRC0344) in each cohort). Feature selection and model training were performed only on the training cohort to prevent information leakage. Features were selected in a three-step approach; All features related to shape (in PDX subcutaneous models, shape features are highly conserved) were removed from further analysis. Inter-correlated features (determined in the training dataset by pairwise spearman correlation (>0.85) and removing the feature with the highest correlation to the remaining features) were likewise removed, yielding 71 features. To further reduce feature dimensionality for this small training dataset a decision tree-based recursive feature elimination method was applied (
Figure 5C) and recursive feature elimination was performed using the recursive feature elimination (RFE) function (caret package) with 3 repeats and a resampling method of repeated CV [
49]. The performance of the selected number of features was evaluated on the validation dataset via AUC for the ROC. All statistical analysis, model building, and model evaluation were performed in R (version 3.5.2;
http://www.r-project.org). The R code used to develop the radiomic classifier to separate PDX CRC0076 and PDX CRC0344 can be found in
Supplementary Document 1.
4.11. Statistical Analyses
Analyses were performed using R (Version 3.4.4, The R Foundation, Vienna, Austria) unless otherwise stated. One-way analysis of variance (ANOVA) with Tukey’s ‘Honest Significant Difference’ (Tukey-HSD) post-hoc tests were used to prove for differences in mean values in vitro and for PUMA and BIM protein level, cleaved caspase-3 and Ki-67 IHC data. p-values were not adjusted for multiple comparison among multiple ANOVAs. For in vivo PET analysis, multiple paired t-tests were employed to compare raw PET values for each animal to its own pre-treatment measurement. p-values were adjusted for multiple comparison using the Holm method. SAS Software Version 9.3 (SAS Institute Inc., Cary, NC, USA) was employed for in vivo data management and its statistics, including linear mixed models to model CRC0076 and CRC0344 PDX tumour growth separately. Mouse identifier was included as a random effect and time effects were included as a continuous covariate, in addition to treatment, as a factor. Model diagnostics included evaluation of leverage, studentised residuals and best linear unbiased predictions of mouse effects. All pairwise treatment comparisons were performed and corrected for multiple testing (Bonferroni correction). The nominal 5% level of significance was used and therefore each of the 6 pairwise comparisons were evaluated at the 0.8% level. Throughout, p values ≤ 0.05 were considered statistically significant. For CT radiomic feature analysis, Wilcoxon rank sum test was applied to compare radiomic features between treatment groups. All radiomic feature statistical analysis was performed using R.

 ,
, 


