Health-Related Quality of Life in Patients with Philadelphia-Negative Myeloproliferative Neoplasms: A Nationwide Population-Based Survey in Denmark

 and
and
Abstract
:Simple Summary
Abstract
1. Introduction
2. Results
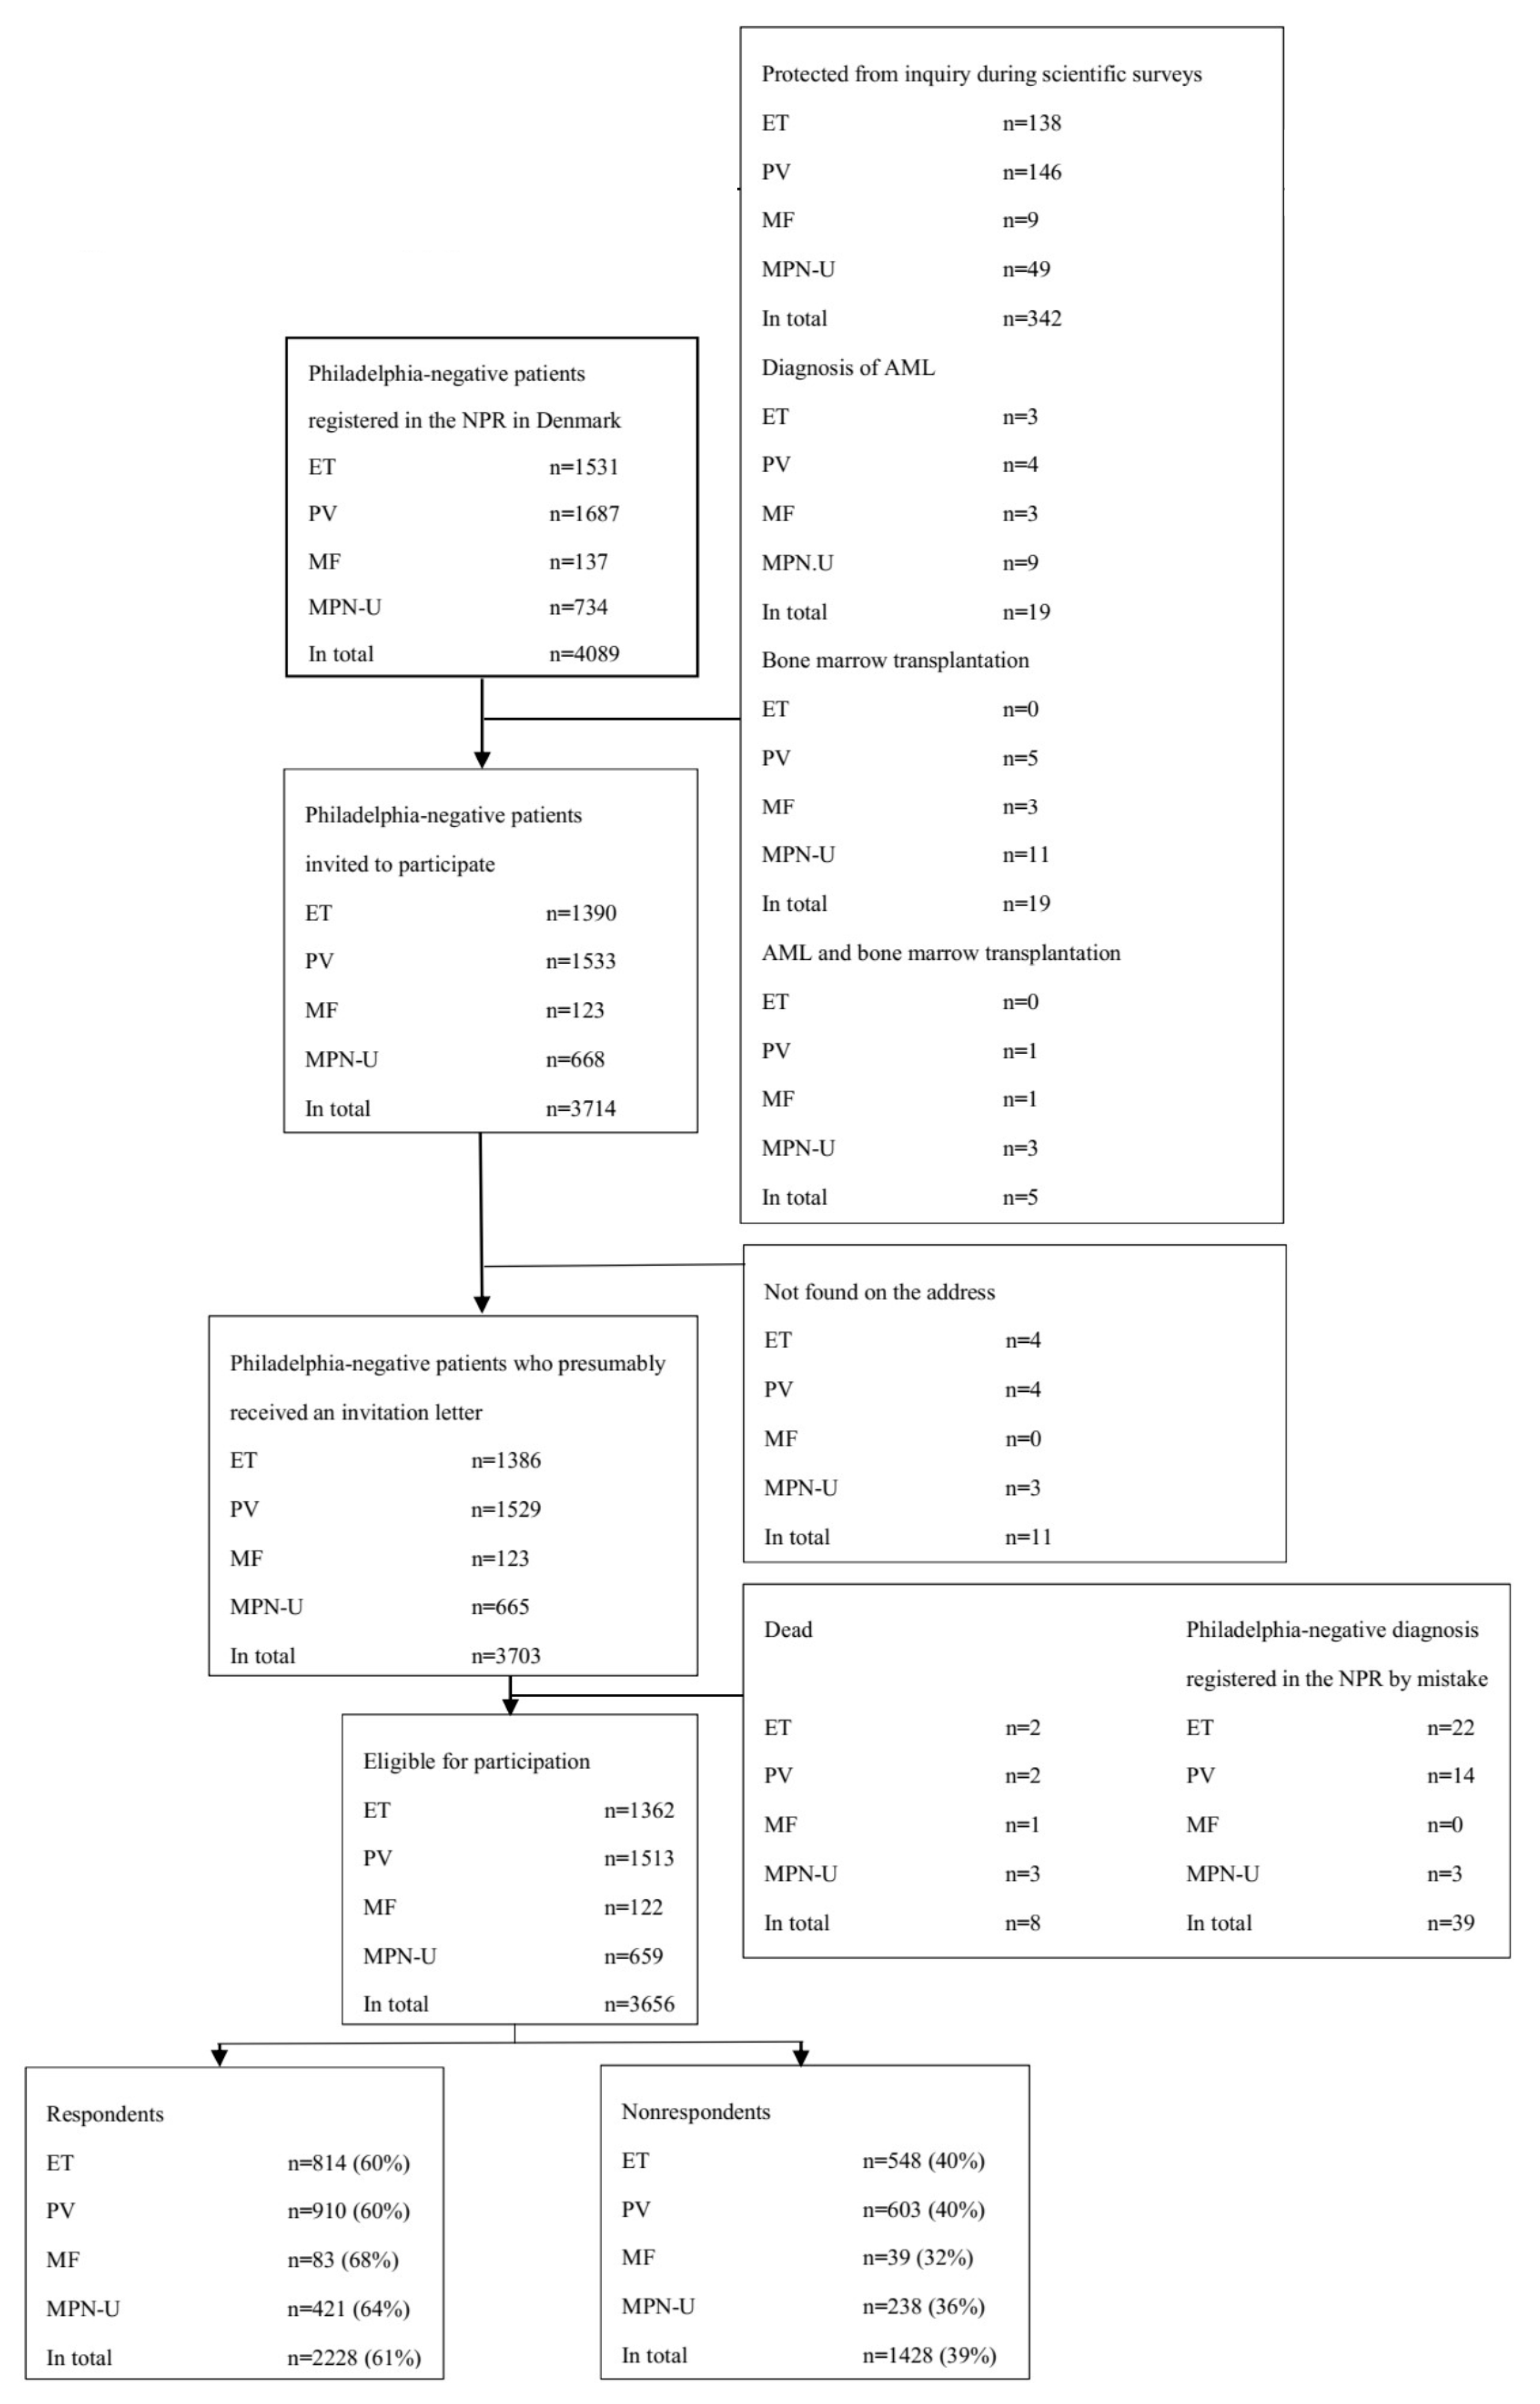
2.1. Participants
2.2. Missing Survey Data
2.3. Functioning
2.4. Symptom Burden
2.5. Fatigue
2.6. Global Health/Quality of Life
2.7. Comorbidity and Lifestyle
3. Discussion
4. Materials and Methods
4.1. Participants
4.2. Data Collection
4.3. Questionnaires and Additional Questions
4.4. Baseline Demographics, Confounders, and General Population Data
4.5. Statistics
5. Conclusions
Author Contributions
Funding
Acknowledgments
Conflicts of Interest
References
- Dameshek, W. Some speculations on the myeloproliferative syndromes. Blood 1951, 118, 372–375. [Google Scholar] [CrossRef] [Green Version]
- Arber, D.A.; Orazi, A.; Hasserjian, R.; Thile, J.; Borowitz, M.j.; Le Beau, M.M.; Bloomfield, C.D.; Cazzola, M.; Vardiman, J.W. The 2016 revision to the World Health Organization classification of myeloid neoplasms and acute leukemia. Blood 2016, 127, 2391–2405. [Google Scholar] [CrossRef] [PubMed]
- Barbui, T.; Barosi, G.; Birgegaard, G.; Cervantes, F.; Finazzi, G.; Grieshammer, M.; Harrison, C.; Hasselbalch, H.C.; Hehlmann, R.; Hoffmann, R.; et al. Philadelphia-negative classical myeloproliferative neoplasms: Critical concepts and management recommendations from European LeukemiaNet. J. Clin. Oncol. 2011, 29, 761–770. [Google Scholar] [CrossRef] [PubMed] [Green Version]
- Campbell, P.J.; Green, A.R. The myeloproliferative disorders. N. Engl. J. Med. 2006, 355, 2452–2466. [Google Scholar] [CrossRef]
- Mesa, R.; Vannucchi, A.M.; Yacoub, A.; Zachee, P.; Garg, M.; Lyons, R.; Koschmieder, S.; Rinaldi, S.C.; Byrne, J.; Hasan, Y.; et al. The efficacy and safety of continued hydroxycarbamide therapy versus switching to ruxolitinib in patients with polycythaemia vera: A randomized, double-blind, double-dummy, symptom study (RELIEF). Br. J. Haemtol. 2017, 176, 76–85. [Google Scholar] [CrossRef] [PubMed]
- Scherber, R.M.; Geyer, H.L.; Dueck, A.C.; Kosiorek, H.E.; Finazzi, G.; Cavazzina, R.; Masciulli, A.; Scarano, M.; Vannucchi, A.M.; Mesa, R.A.; et al. The potential role of hematocrit control on symptom burden among polycythemia vera patients: Insights from the CYTO-PV and MPN-SAF patient cohorts. Leuk. Lymphoma 2017, 58, 1481–1487. [Google Scholar] [CrossRef] [PubMed]
- Geyer, H.L.; Kosiorek, H.; Dueck, A.C.; Scherber, R.; Slot, S.; Zweegman, S.; Boekhorst, P.A.W.T.; Senyak, Z.; Schoten, H.C.; Sackmann, F.; et al. Associations between gender, disease features and symptom burden in patients with myeloproliferative neoplasms: An analysis by the MPN QOL International Working Group. Haematologica 2017, 102, 85–93. [Google Scholar] [CrossRef] [Green Version]
- Mesa, R.; Miller, C.B.; Thyne, M.; Mangan, J.; Goldberger, S.; Fazal, S.; Ma, X.; Wilson, W.; Paranagama, D.C.; Dubinski, D.G.; et al. Myeloproliferative neoplasms (MPNs) have a significant impact on patients´ overall health and productivity: The MPN landmark survey. BMC Cancer 2016, 16, 167. [Google Scholar] [CrossRef] [Green Version]
- Geyer, H.L.; Andreasson, B.; Kosiorek, H.E.; Dueck, A.C.; Scherber, R.M.; Martin, K.A.; Butler, K.A.; Harrison, C.N.; Radia, D.H.; Cervantes, F.; et al. The role of sexuality symptoms in myeloproliferative neoplasm symptom burden and quality of life: An analysis by the MPN QOL international study group. Cancer 2016, 122, 1888–1896. [Google Scholar] [CrossRef] [Green Version]
- Geyer, H.; Scherber, R.; Kosiorek, H.; Dueck, A.C.; Kiladjian, J.-J.; Xiao, Z.; Slot, S.; Zweegman, S.; Sackmann, F.; Fuentes, A.K.; et al. Symptomatic profiles of patients with polycythemia vera: Implications of inadequately controlled disease. J. Clin. Oncol. 2016, 34, 151–159. [Google Scholar] [CrossRef] [Green Version]
- Harrison, C.N.; Vannucchi, A.M.; Kiladjian, J.-J.; Ali, H.K.; Gisslinger, H.; Knoops, L.; Cervantes, F.; Jones, M.M.; Sun, K.; McQuitty, M.; et al. Long-term findings from COMFORT-II, a phase 3 study of ruxolitinib vs best available therapy for myelofibrosis. Leukemia 2016, 30, 1701–1707. [Google Scholar] [CrossRef] [PubMed] [Green Version]
- Mesa, R.; Verstovsek, S.; Kiladjian, J.J.; Grieshammer, M.; Masszi, T.; Durrant, S.; Passamonti, F.; Harrison, C.N.; Pane, F.; Zachee, P.; et al. Changes in quality of life and disease-related symptoms in patients with polycythemia vera receiving ruxolitinib or standard therapy. Eur. J. Haematol. 2016, 97, 192–200. [Google Scholar] [CrossRef] [PubMed]
- Scherber, R.M.; Kosiorek, H.E.; Senyak, Z.; Dueck, A.C.; Clark, M.M.; Boxer, M.A.; Geyer, H.L.; McCallister, A.; Cotter, M.; Van Husen, B.; et al. Comprehensively understanding fatigue in patients with myeloproliferative neoplasms. Cancer 2016, 122, 477–485. [Google Scholar] [CrossRef]
- Anderson, L.A.; James, G.; Duncombe, A.S.; Mesa, R.; Scherber, R.; Dueck, A.C.; de Vocht, F.; Clarke, M.; McMullin, M.F. Myeloproliferative neoplasm patient symptom burden and quality of life: Evidence of significant impairment compared to controls. Am. J. Hematol. 2015, 90, 864–870. [Google Scholar] [CrossRef] [PubMed] [Green Version]
- Mesa, R.; Scherber, R.M.; Geyer, H.L. Reducing symptom burden in patients with myeloproliferative neoplasms in the era of Janus kinase inhibitors. Leuk. Lymphoma 2015, 56, 1989–1999. [Google Scholar] [CrossRef]
- Stein, B.; Oh, S.T.; Berenzon, D.; Hobbs, G.S.; Kremyanskaya, M.; Rampal, R.K.; Abboud, C.N.; Adler, K.; Heaney, M.L.; Jabbour, E.J.; et al. Polycythemia vera: An appraisal of the biology and management 10 years after the discovery of JAK2 V617F. J. Clin. Oncol. 2015, 33, 3953–3960. [Google Scholar] [CrossRef] [Green Version]
- Geyer, H.L.; Scherber, R.M.; Dueck, A.C.; Kiladjian, J.-J.; Xiao, Z.; Slot, S.; Zweegmann, S.; Sackmann, F.; Fuentes, A.K.; Hernández-Maraver, D.; et al. Distinct clustering of symptomatic burden among myeloproliferative neoplasm patient: Retrospective assessment in 1470 patients. Blood 2014, 123, 3803–3810. [Google Scholar] [CrossRef]
- Stein, B.L.; Moliterno, A.R.; Tiu, R.V. Polycythemia vera disease burden: Contributing factors, impact on quality of life, and merging treatment options. Ann. Hematol. 2014, 93, 1965–1976. [Google Scholar] [CrossRef]
- Abelsson, J.; Andréasson, B.; Samuelsson, J.; Hultcrantz, M.; Ejerblad, E.; Johansson, B.; Emanuel, R.; Mesa, R.; Johansson, P. Patients with polycythemia vera have worst impairment of quality of life among patients with newly diagnosed myeloproliferative neoplasms. Leuk. Lymphoma 2013, 54, 2226–2230. [Google Scholar] [CrossRef]
- Mitra, D.; Kaye, J.A.; Piecoro, L.T.; Brown, J.; Reith, K.; Mughal, T.I.; Sarlis, N.J. Symptom burden and splenomegaly in patients with myelofibrosis in the United States: A retrospective medical record review. Cancer Med. 2013, 2, 889–898. [Google Scholar] [CrossRef]
- Siegel, F.P.; Taucher, J.; Petrides, P.E. Aquagenic pruritus in polycythaemia vera: Characteristics and influence on quality of life in 441 patients. Am. J. Hematol. 2013, 88, 665–669. [Google Scholar] [CrossRef] [PubMed]
- Harrison, C.N.; Mesa, R.A.; Kiladjian, J.J.; Al-Ali, H.-K.; Gisslinger, H.; Knoops, L.; Squier, M.; Sirulnik, A.; Mendelson, E.; Zhou, X.; et al. Health-related quality of life and symptoms in patients with myelofibrosis treated with ruxolitinib versus best available therapy. Br. J. Haematol. 2013, 162, 229–239. [Google Scholar] [CrossRef] [PubMed]
- Emanuel, R.M.; Dueck, A.C.; Geyer, H.L.; Kiladjian, J.-J.; Slot, S.; Zweegman, S.; te Boekhorst, P.A.W.; Commandeur, S.; Schouten, H.C.; Sackmann, F.; et al. Myeloproliferative neoplasm (MPN) symptoms assessment form total symptom score: Prospective international assessment of an abbreviated symptom burden scoring system among patients with MPNs. J. Clin. Oncol. 2012, 30, 4098–4103. [Google Scholar] [CrossRef] [PubMed] [Green Version]
- Johansson, P.; Mesa, R.; Scherber, R.; Abelsson, J.; Samuelsson, J.; Birgegaard, G.; Andreasson, B. Association between quality of life and clinical parameters in patients with myeloproliferative neoplasms. Leuk. Lymphoma 2012, 53, 441–444. [Google Scholar] [CrossRef]
- Oliva, E.N.; Piccin, A.; Mazzucconi, M.F.; Morra, E.; Recine, U.; Pogliani, M.; Pane, F.; Gobbi, M.; Gugliotta, L.; Krampera, M.; et al. Quality of life en elderly patients with essential thrombocythemia. An Italian multicentre study. Ann. Hematol. 2012, 91, 527–532. [Google Scholar] [CrossRef]
- Scherber, R.; Dueck, A.C.; Johansson, P.; Barbui, T.; Barosi, G.; Vannucchi, A.M.; Passamonti, F.; Andreasson, B.; Ferrari, M.L.; Rambaldi, A.; et al. The myeloproliferative neoplasm symptom assessment form (MPN-SAF): International prospective validation and reliability trial in 402 patients. Blood 2011, 118, 401–408. [Google Scholar] [CrossRef]
- Mesa, R.; Niblack, J.; Wadleigh, M.; Verstovsek, S.; Camoriano, J.; Barnes, S.; Tan, A.D.; Atherton, P.J.; Sloen, J.A.; Teffari, A. The burden of fatigue and quality of life in myeloproliferative disorders (MPDs). Cancer 2007, 109, 68–76. [Google Scholar] [CrossRef]
- Schmidt, M.; Schmidt, S.A.; Sandegaard, J.L.; Ehrenstein, V.; Pedersen, L.; Soerensen, H.T. The Danish National Patient Registry: A review of content, data quality, and research potential. Clin. Epidemiol. 2015, 7, 449–490. [Google Scholar] [CrossRef] [Green Version]
- Schmidt, M.; Pedersen, L.; Soerensen, H.T. The Danish Civil Registration System as a tool in epidemiology. Eur. J. Epidemiol. 2014, 29, 541–549. [Google Scholar] [CrossRef]
- Brochmann, N.; Flachs, E.M.; Christensen, A.I.; Andersen, C.L.; Juel, K.; Hasselbalch, H.C.; Zwisler, A.-D. A nationwide population-based cross-sectional survey of health-related quality of life in patients with myeloproliferative neoplasms in Denmark (MPNhealthSurvey): Survey design and characteristics of respondents and nonrespondents. Clin. Epidemiol. 2017, 9, 141–150. [Google Scholar] [CrossRef] [Green Version]
- Larsen, R.T.; Tang, L.H.; Brochmann, N.; Flachs, E.M.; Christensen, A.I.; Hasselbalch, H.C.; Zwisler, A.D. Association between fatigue, physical activity, and QoL in patients with myeloproliferative neoplasms. Eur. J. Hematol. 2018, 100, 550–559. [Google Scholar] [CrossRef] [PubMed]
- Brochmann, N.; Flachs, E.M.; Christensen, A.I.; Bak, M.; Andersen, C.L.; Juel, K.; Hasselbalch, H.C.; Zwisler, A.D.; Rottmann, N. Anixiety and depression in patients with Philadelphia-negative myeloproliferative neoplasms: A nationwide population-based survey in Denmark. Clin. Epidemiol. 2019, 11, 23–33. [Google Scholar] [CrossRef] [PubMed] [Green Version]
- Christensen, S.F.; Scherber, R.M.; Brochmann, N.; Goros, M.; Gelfond, J.; Andersen, C.L.; Flachs, E.M.; Mesa, R. Body Mass Index and Total Symptom Burden in Myeloproliferative Neoplasms Discovery of a U-shaped Association. Cancers 2020, 12, 2202. [Google Scholar] [CrossRef] [PubMed]
- Ware, J.E.; Sherbourne, C.D. The MOS 36-item short-form health survey (SF-36). I. Conceptual framework and item selection. Med. Care 1992, 30, 473–483. [Google Scholar] [CrossRef] [PubMed]
- Aaronson, N.K.; Ahmedzai, S.; Bergman, B.; Bullinger, M.; Cull, A.; Duez, N.J.; Filiberti, A.; Flechtner, H.; Fleishman, S.B.; de Haes, J.C. The European Organization for Research and Treatment of Cancer QoL-C30: A quality-of-life instrument for use in international clinical trials in oncology. J. Natl. Cancer Inst. 1993, 85, 365–376. [Google Scholar] [CrossRef] [PubMed]
- Mendoza, T.R.; Wang, X.S.; Cleeland, C.S.; Morrissey, M.; Johnsson, B.A.; Wendt, J.K.; Huber, S.L. The rapid assessment of fatigue severity in cancer patients: Use of the Brief Fatigue Inventory. Cancer 1999, 85, 1186–1196. [Google Scholar] [CrossRef]
- Smets, E.M.A.; Garsson, B.; Bonke, B.; De Haes, J.C. The multidimensional fatigue inventory (MFI); psychometric qualities of an instrument to assess fatigue. J. Psychosom. Res. 1995, 39, 315–325. [Google Scholar] [CrossRef] [Green Version]
- Cocks, K.; King, M.T.; Velikova, G.; St. James, M.M.; Fayers, P.M.; Brown, J.M. Evidence-Based Guidelines for Determination of Sample Size and Interpretation of the European Organisation for the Research and Treatment of Cancer Quality of Life Questionnaire Core 30. J. Clin. Oncol. 2011, 29, 89–96. [CrossRef]
- King, M.T. The interpretation of scores from EORTC quality of life questionnaire QLQ C-30. Qual. Life Res. 1996, 5, 555–567. [Google Scholar] [CrossRef]
- Osoba, D.; Rodrigues, G.; Myles, J.; Zee, B.; Pater, J. Interpreting the significance of changes in health-related quality-of-life scores. J. Clin. Oncol. 1998, 16, 139–144. [Google Scholar] [CrossRef]
- Kroll, M.E.; Murphy, F.; Pirie, K.; Reeves, G.K.; Green, J.; Beral, V. Alcohol drinking, tobacco smoking and subtypes of haematological malignancies in the UK million women study. Br. J. Cancer 2012, 107, 879–887. [Google Scholar] [CrossRef] [PubMed] [Green Version]
- Leal, A.D.; Thompson, C.A.; Wang, A.H.; Vierkant, R.A.; Habermann, T.M.; Ross, J.A.; Mesa, R.A.; Virnig, B.A.; Cerhan, J.R. Anthropometric, medical history and lifestyle risk factors for myeloproliferative neoplasms in the Iowa women´s health study cohort. Int. J. Cancer 2014, 134, 1741–1750. [Google Scholar] [CrossRef] [PubMed] [Green Version]
- Soerensen, A.L.; Hasselbalch, H.C. Smoking and Philadelphia-negative chronic myeloproliferative neoplasms. Eur. J. Haematol. 2016, 97, 63–69. [Google Scholar] [CrossRef] [PubMed]
- Sprangers, M.A.G.; Schwartz, C.E. Integrating response shift into health-related quality of life research: A theoretical model. Soc. Sci. Med. 1999, 48, 1507–1515. [Google Scholar] [CrossRef]
- Mesa, R.; Verstovsek, S.; Cervantes, F.; Barosi, G.; Reilly, J.T.; Dupriez, B.; Levine, R.; Le Bousse-Kerdiles, M.C.; Wadleight, M.; Campbell, P.J. Primary myelofibrosis (PMF), post polycythemia vera myelofibrosis (post-PV MF), post essential thrombocythemia myelofibrosis (post-PV MF), blast phase PMF (PMF-BP): Consensus on terminology by the international working group for myelofibrosis research and treatment (IWG-MRT). Leuk. Res. 2007, 31, 737–740. [Google Scholar] [CrossRef] [PubMed]
- Hasselbalch, H.C.; Bjørn, M.E. MPNs as inflammatory diseases: The evidence, consequences and perspectives. Mediat. Inflamm. 2015, 2015, 102476. [Google Scholar] [CrossRef] [PubMed] [Green Version]
- Skov, V.; Thomassen, M.; Riley, C.H.; Jensen, M.K.; Bjerrum, O.W.; Kruse, T.A.; Hasselbalch, H.C.; Larsen, T.S. Gene expression profiling with principal component analysis depicts the biological continuum from essential thrombocythemia over polycythemia vera to myelofibrosis. Exp. Hematol. 2012, 40, 771–780. [Google Scholar] [CrossRef]
- Wild, D.; Grove, A.; Martin, M.; Eremenco, S.; McElroy, S.; Verjee-Lorenz, A.; Erikson, P.; ISPOR Task Force for Translation and Cultural Adaptation. Principles of good practice for the translation and cultural adaptation process for patient-reported outcomes (PRO) measures: Report of the ISPOR task force for translation and cultural adaptation. Value Health 2005, 8, 94–104. [Google Scholar] [CrossRef] [Green Version]
- Barbui, T.; Teffari, A.; Vannucchi, A.M.; Passamonti, F.; Silver, R.T.; Hoffman, R.; Verstovsek, S.; Mesa, R.; Kiladjian, J.J.; Hehlmann, R. Philadelphia chromosome-negative classical myeloproliferative neoplasms: Revised management recommendations from European LeukemiaNet. Leukemia 2018, 32, 1057–1069. [Google Scholar] [CrossRef] [Green Version]
- Mesa, R.A.; Miller, C.B.; Thyne, M.; Mangan, J.; Goldberger, S.; Fazal, S.; Ma, X.; Wilson, W.; Paranagama, D.C.; Dubinske, D.G. Differences in treatment goals and perception of symptom burden between patients with myeloproliferative neoplasms (MPNs) and hematologists/oncologists in the United States: Findings from the MPN Landmark survey. Cancer 2017, 123, 449–458. [Google Scholar] [CrossRef] [Green Version]
- Statistics Denmark. Available online: www.danmarksstatistik.dk (accessed on 28 June 2020).
- Charlson, M.E.; Pompei, P.; Ales, K.; MacKenzie, C.R. A new method of classifying prognostic comorbidity in longitudinal studies: Development and validation. J. Chronic Dis. 1987, 40, 373–383. [Google Scholar] [CrossRef]
- Thygesen, S.K.; Christiansen, C.F.; Christensen, S.; Lash, T.L.; Soerensen, H.T. The predictive value of ICD-10 diagnostic coding used to assess Charlson comorbidity index conditions in the population-based Danish National Registry of Patients. BMC Med. Res. Methodol. 2011, 11, 83. [Google Scholar] [CrossRef] [PubMed] [Green Version]
- Christensen, A.I.; Ekholm, O.; Glümer, C.; Andreasen, A.H.; Hvidberg, M.F.; Kristensen, P.L.; Larsen, F.B.; Ortiz, B.; Juel, K. The Danish National Health Survey 2010. Study design and respondent characteristics. Scand. J. Public Health 2012, 40, 391–397. [Google Scholar] [CrossRef] [PubMed]
- Juul, T.; Petersen, M.A.; Holzner, B.; Laurberg, S.; Christensen, P.; Grønvold, M. Danish population-based reference data for the EORTC QLQ C-30: Associations with gender, age and morbidity. Qual. Life Res. 2014, 23, 2183–2193. [Google Scholar] [CrossRef] [PubMed]


| Respondents (Participants) | Nonrespondents | p-Value | |
|---|---|---|---|
| ET+PV+MF+MPN-U | ET+PV-MF+MPN-U | ||
| Total (n,%) | 2228 (61%) | 1428 (39%) | |
| Age (mean, SD) | 70.7 (14.6) | 69.2 (12.4) | <0.001 * |
| Sex (n,%) | >0.1 ** | ||
| Female | 1274 (57%) | 819 (57%) | |
| Male | 954 (43%) | 609 (43%) | |
| Female (n,%) | <0.0001 *** | ||
| 20–29 years old | 6 (<1%) | 5 (<1%) | |
| 30–39 | 24 (2%) | 19 (2%) | |
| 40–49 | 75 (6%) | 54 (7%) | |
| 50–59 | 171 (13%) | 87 (11%) | |
| 60–69 | 324 (25%) | 155 (19%) | |
| 70–79 | 403 (32%) | 192 (23%) | |
| 80–89 | 238 (19%) | 226 (28%) | |
| ≥90 | 33 (3%) | 81 (10%) | |
| Male (n,%) | 0.0019 *** | ||
| 20–29 years old | 4 (<1%) | 2 (<1%) | |
| 30–39 | 16 (2%) | 15 (3%) | |
| 40–49 | 46 (5%) | 44 (7%) | |
| 50–59 | 133 (14%) | 100 (16%) | |
| 60–69 | 267 (28%) | 158 (26%) | |
| 70–79 | 323 (34%) | 159 (26%) | |
| 80–89 | 150 (16%) | 107 (18%) | |
| ≥90 | 15 (1%) | 24 (4%) | |
| Living arrangement (n,%) | <0.0001 *** | ||
| Living alone | 737 (33%) | 723 (51%) | |
| Living with someone | 1475 (66%) | 659 (46%) | |
| Missing | 16 (1%) | 46 (3%) | |
| Education (n,%) | <0.0001 *** | ||
| Basic school | 677 (30%) | 610 (43%) | |
| Upper secondary/ | 951 (43%) | 478 (33%) | |
| vocational school | |||
| Higher education | 521 (23%) | 215 (15%) | |
| Missing | 79 (4%) | 125 (9%) | |
| Employment (n,%) | 0.0076 *** | ||
| Employed | 601 (27%) | 319 (22%) | |
| Unemployed | 51 (2%) | 42 (3%) | |
| Retired | 1575 (71%) | 1067 (75%) | |
| Missing | 1 | 0 | |
| Ethnicity (n,%) | <0.0001 *** | ||
| Danish/Western | 2125 (95%) | 1264 (89%) | |
| Non-Western | 87 (4%) | 118 (8%) | |
| Missing | 16 (1%) | 46 (3%) | |
| Duration of disease (n,%) | 0.0259 *** | ||
| <1 year | 157 (7%) | 78 (6%) | |
| 1–4 years | 792 (36%) | 476 (33%) | |
| ≥5 years | 1279 (57%) | 874 (61%) | |
| Comorbidity | |||
| CCI (mean, SD) | 1.5 (2.0) | 1.1 (1.7) | <0.0001 *** |
| CCI score (n,%) | |||
| ET | |||
| 0 | 436 (54%) | 250 (46%) | <0.0001 *** |
| 1–2 | 286 (35%) | 189 (34%) | |
| ≥3 | 92 (11%) | 109 (20%) | |
| PV | |||
| 0 | 435 (48%) | 245 (41%) | 0.0014 *** |
| 1–2 | 336 (37%) | 233 (38%) | |
| ≥3 | 139 (15%) | 125 (21%) | |
| MF | |||
| 0 | 42 (51%) | 9 (23%) | 0.0024 *** |
| 1–2 | 21 (25%) | 12 (31%) | |
| ≥3 | 20 (24%) | 18 (46%) | |
| MPN–U | |||
| 0 | 193 (46%) | 89 (37%) | 0.0009 *** |
| 1–2 | 171 (41%) | 86 (36%) | |
| ≥3 | 57 (13%) | 63 (27%) | |
| MPN subtype (n,%) | 0.06 *** | ||
| ET | 814 (36%) | 548 (38%) | |
| PV | 910 (41%) | 603 (42%) | |
| MF | 83 (4%) | 39 (3%) | |
| MPN-U | 421 (19%) | 238 (17%) |
| Questionnaire Scales | Questionnaire Scores Mean, SD | |||||||||
|---|---|---|---|---|---|---|---|---|---|---|
| General Population | ET | p-Value * | PV | p-Value * | MF | p-Value * | MPN-U | p-Value * | p-Value ** | |
| SF-36 | ||||||||||
| Physical component summary measure | 47.7 (9.9) | 46.5 (9.7) | 45.0 (10.5) | 45.6 (10.0) | <0.001 | |||||
| Mental component summary measure | 51.5 (9.9) | 51.3 (10.0) | 51.9 (9.3) | 50.7 (9.9) | 0.002 | |||||
| EORTC QLQ C-30 | ||||||||||
| Global health status/QoL | 73 (23) | 68.5 (23.9) | <0.001 | 67.1 (24.5) | <0.001 | 67.6 (26.5) | 0.036 | 64.9 (24.6) | <0.001 | 0.002 |
| Functional scales | ||||||||||
| physical functioning | 86 (20) | 77.2 (22.3) | <0.001 | 73.7 (22.6) | <0.001 | 70.0 (24.5) | <0.001 | 71.8 (23.3) | <0.001 | <0.001 |
| role functioning | 84 (27) | 76.5 (28.3) | <0.001 | 75.1 (28.7) | <0.001 | 71.1 (32.7) | <0.001 | 72.4 (29.8) | <0.001 | 0.026 |
| emotional functioning | 84 (19) | 79.8 (21.3) | <0.001 | 79.6 (21.1) | <0.001 | 81.5 (19.5) | 0.091 | 78.4 (21.9) | <0.001 | <0.001 |
| cognitive functioning | 87 (20) | 79.9 (22.8) | <0.001 | 79.4 (22.5) | <0.001 | 77.4 (22.7) | <0.001 | 78.9 (21.8) | <0.001 | 0.067 |
| social functioning | 90 (21) | 83.9 (24.7) | 0.010 | 83.1 (24.1) | <0.001 | 81.9 (24.3) | 0.005 | 82.7 (25.2) | <0.001 | <0.001 |
| Symptoms scales | ||||||||||
| fatigue | 24 (23) | 34.0 (25.8) | <0.001 | 35.9 (25.5) | <0.001 | 38.5 (26.1) | <0.001 | 37.4 (25.0) | <0.001 | 0.009 |
| nausea/vomiting | 3 (10) | 6.2 (13.7) | <0.001 | 6.2 (14.0) | <0.001 | 4.7 (10.9) | 0.106 | 6.0 (13.7) | <0.001 | 0.045 |
| pain | 20 (26) | 22.9 (27.1) | 0.017 | 23.3 (26.5) | 0.005 | 23.0 (25.7) | >0.1 | 24.8 (28.2) | 0.006 | <0.001 |
| dyspnea | 11 (21) | 20.3 (26.8) | <0.001 | 21.1 (27.0) | <0.001 | 25.1 (29.2) | <0.001 | 21.5 (27.8) | <0.001 | <0.001 |
| insomnia | 21 (27) | 29.4 (31.7) | <0.001 | 30.4 (32.4) | <0.001 | 22.5 (26.7) | >0.1 | 31.1 (31.9) | <0.001 | 0.009 |
| appetite loss | 7 (18) | 11.9 (23.5) | <0.001 | 13.7 (25.5) | <0.001 | 21.5 (32.5) | <0.001 | 16.6 (26.5) | <0.001 | 0.004 |
| constipation | 6 (17) | 13.7 (24.6) | <0.001 | 12.3 (23.3) | <0.001 | 14.4 (23.5) | 0.001 | 12.5 (22.7) | <0.001 | >0.1 |
| diarrhea | 7 (17) | 14.4 (24.4) | <0.001 | 14.4 (24.5) | <0.001 | 16.9 (25.3) | <0.001 | 14.4 (25.6) | <0.001 | 0.046 |
| financial difficulties | 6 (18) | 8.1 (19.9) | 0.005 | 10.0 (23.7) | <0.001 | 12.3 (24.4) | 0.016 | 9.6 (22.4) | 0.004 | 0.008 |
| MPN-SAF | Questionnaire Score Mean, SD, Prevalence% | ||||
|---|---|---|---|---|---|
| ET | PV | MF | MPN-U | Difference in Mean Symptom Burden between MPN Subtypes p-Value * | |
| Total symptom score (TSS) | 17.5 (14.9) | 17.8 (15.1) | 16.2 (12.7) | 21.1 (16.1) | <0.001 |
| fatigue (BFI score) | 2.5 (2.3) 82% | 2.6 (2.4) 82% | 2.8 (2.6) 74% | 2.8 (2.3) 87% | <0.001 |
| early satiety | 2.0 (2.4) 56% | 1.7 (2.3) 53% | 2.5 (3.6) 46% | 2.1 (2.5) 56% | <0.001 |
| abdominal pain | 1.2 (2.0) 36% | 0.9 (1.6) 37% | 0.9 (1.1) 55% | 1.0 (1.7) 40% | 0.021 |
| abdominal discomfort | 1.9 (2.4) 53% | 1.4 (2.0) 51% | 1.4 (1.3) 64% | 1.5 (1.9) 54% | 0.004 |
| inactivity | 1.9 (2.3) 54% | 1.9 (2.2) 57% | 2.1 (2.3) 73% | 2.4 (2.4) 62% | <0.001 |
| headaches | 1.6 (2.3) 50% | 1.7 (2.3) 50% | 1.3 (1.8) 46% | 1.8 (2.1) 56% | 0.004 |
| concentration problem | 1.9 (2.6) 49% | 2.1 (2.5) 58% | 2.5 (3.0) 64% | 2.4 (2.7) 58% | 0.011 |
| dizziness | 2.0 (2.3) 60% | 2.2 (2.5) 64% | 2.0 (1.8) 73% | 2.2 (2.2) 72% | 0.002 |
| numbness | 2.1 (2.8) 51% | 2.1 (2.7) 53% | 0.7 (1.2) 46% | 2.0 (2.3) 60% | 0.013 |
| insomnia | 2.5 (2.8) 64% | 2.5 (2.8) 62% | 1.4 (1.7) 55% | 2.6 (2.6) 66% | <0.001 |
| sad mood | 2.0 (2.4) 59% | 2.1 (2.5) 57% | 1.6 (1.7) 73% | 2.4 (2.7) 66% | <0.001 |
| sexuality problems | 3.3 (3.5) 62% | 3.3 (3.3) 64% | 3.8 (3.3) 82% | 3.8 (3.9) 62% | <0.001 |
| cough | 1.4 (2.2) 42% | 1.4 (2.2) 44% | 1.3 (1.8) 46% | 1.9 (2.4) 52% | <0.001 |
| night sweats | 2.4 (2.7) 63% | 2.4 (2.6) 67% | 2.5 (2.5) 64% | 3.6 (3.1) 70% | 0.046 |
| itching | 1.7 (2.4) 50% | 2.4 (2.9) 59% | 0.5 (1.0) 18% | 2.2 (2.7) 52% | <0.001 |
| bone pain | 1.5 (2.6) 39% | 1.8 (2.6) 48% | 0.9 (1.4) 46% | 1.9 (2.5) 54% | <0.001 |
| fever (>100F) | 0.4 (1.4) 17% | 0.3 (0.8) 17% | 0.2 (0.6) 9% | 0.4 (1.0) 18% | <0.001 |
| unintentional weight loss last 6 months | 0.6 (1.8) 17% | 0.7 (1.7) 22% | 1.4 (2.9) 27% | 1.2 (2.4) 28% | <0.001 |
| quality of life | 2.5 (2.3) 74% | 2.4 (2.2) 76% | 2.1 (1.8) 73% | 2.7 (2.2) 78% | <0.001 |
| Questionnaire Scales | Questionnaire Scores Mean, SD | ||||
|---|---|---|---|---|---|
| ET | PV | MF | MPN_U | p-Value * | |
| MFI | |||||
| general fatigue | 11.5 (4.9) | 11.6 (4.9) | 12.4 (5.1) | 12.0 (4.5) | <0.001 |
| physical fatigue | 11.3 (4.9) | 12.0 (4.9) | 12.2 (5.6) | 12.1 (4.6) | <0.001 |
| reduced activity | 10.1 (4.7) | 10.9 (4.9) | 11.1 (5.6) | 11.2 (4.7) | <0.001 |
| reduced motivation | 8.3 (3.6) | 8.8 (3.7) | 8.6 (3.9) | 8.8 (3.6) | <0.001 |
| mental fatigue | 8.6 (4.2) | 8.7 (4.3) | 8.2 (4.5) | 8.9 (4.2) | <0.001 |
| ET | GP | p-Value * | PV | GP | p-Value * | MF | GP | p-Value * | MPN-U | GP | p-Value * | p-Value ** | |
|---|---|---|---|---|---|---|---|---|---|---|---|---|---|
| Comorbidity (n,%) | <0.0001 | ||||||||||||
| CCI = 0 | 436 (54%) | 435 (48%) | 42 (51%) | 193 (46%) | |||||||||
| CCI = 1 or 2 | 286 (35%) | 336 (37%) | 21 (25%) | 171 (41%) | |||||||||
| CCI ≥ 3 | 92 (11%) | 139 (15%) | 20 (24%) | 57 (13%) | |||||||||
| BMI (n,%) | 0.0011 | 0.0004 | >0.1 | 0.029 | >0.1 | ||||||||
| BMI < 18.5 | 19 (2%) | 400 (3%) | 24 (3%) | 383 (2%) | 2 (2%) | 27 (2%) | 14 (3%) | 234 (3%) | |||||
| 18.5 ≤ BMI < 25.0 | 425 (55%) | 7166 (47%) | 446 (51%) | 7580 (45%) | 39 (51%) | 702 (46%) | 208 (52%) | 3545 (45%) | |||||
| 25.0 ≤ BMI < 30.0 | 242 (31%) | 5460 (36%) | 285 (32%) | 6639 (39%) | 27 (35%) | 581 (38%) | 123 (31%) | 2953 (38%) | |||||
| BMI ≥ 30 | 95 (12%) | 2194 (14%) | 124 (14%) | 2421 (14%) | 11 (14%) | 212 (14%) | 57 (14%) | 1127 (14%) | |||||
| Missing | 33 (4%) | 31 (3%) | 4 (5%) | 19 (5%) | |||||||||
| Smoking (n,%) | >0.1 | 0.05 | >0.1 | >0.1 | >0.1 | ||||||||
| Yes | 152 (19%) | 2880 (19%) | 152 (17%) | 3380 (20%) | 12 (15%) | 280 (18%) | 82 (20%) | 1494 (19%) | |||||
| Ex-smoker | 340 (43%) | 6203 (40%) | 409 (47%) | 7378 (42%) | 39 (49%) | 653 (42%) | 179 (44%) | 3340 (42%) | |||||
| No | 301 (38%) | 6394 (41%) | 317 (36%) | 6546 (38%) | 29 (36%) | 612 (40%) | 144 (36%) | 3089 (39%) | |||||
| Missing | 21 (3%) | 32 (4%) | 3 (4%) | 16 (4%) | |||||||||
| Alcohol (n,%) | >0.1 | 0.01 | >0.1 | 0.0017 | 0.0314 | ||||||||
| units ≤ 7 | 461 (64%) | 7328 (61%) | 518 (63%) | 7811 (57%) | 41 (58%) | 691 (58%) | 263 (71%) | 3710 (62%) | |||||
| 8 ≤ units ≤ 14 | 154 (21%) | 2585 (22%) | 161 (20%) | 3130 (23%) | 16 (23%) | 273 (23%) | 53 (15%) | 1292 (21%) | |||||
| 15 ≤ units ≤ 21 | 62 (9%) | 1036 (9%) | 66 (8%) | 1307 (10%) | 4 (5%) | 110 (9%) | 27 (7%) | 527 (9%) | |||||
| 22 ≤ units | 47 (6%) | 983 (8%) | 76 (9%) | 1340 (10%) | 10 (14%) | 118 (10%) | 26 (7%) | 507 (8%) | |||||
| Missing | 90 (11%) | 89 (10%) | 12 (14%) | 52 (12%) | |||||||||
| Physical activity (n,%) | <0.0001 | <0.0001 | 0.004 | <0.0001 | 0.0032 | ||||||||
| Hard training and | 53 (7%) | 187 (1%) | 37 (4%) | 177 (1%) | 0 | 27 (2%) | 16 (4%) | 84 (1%) | |||||
| competitive sports | |||||||||||||
| several times a week | |||||||||||||
| Training, heavy garden work | 168 (21%) | 2230 (15%) | 181 (21%) | 2500 (15%) | 16 (23%) | 219 (14%) | 67 (17%) | 1012 (13%) | |||||
| or similar ≥ 4 times a week | |||||||||||||
| Walk, bicycle, light garden | 377 (49%) | 9251 (61%) | 423 (50%) | 10368 (61%) | 27 (38%) | 882 (58%) | 195 (50%) | 4728 (60%) | |||||
| work or similar≥ 4 times | |||||||||||||
| a week | |||||||||||||
| Read, watch TV, or | 177 (23%) | 3559 (23%) | 210 (25%) | 4031 (23%) | 28 (39%) | 403 (26%) | 114 (29%) | 2006 (26%) | |||||
| other sedentary work | |||||||||||||
| Missing | 39 (5%) | 59 (6%) | 12 (14%) | 29 (7%) |
Publisher’s Note: MDPI stays neutral with regard to jurisdictional claims in published maps and institutional affiliations. |
© 2020 by the authors. Licensee MDPI, Basel, Switzerland. This article is an open access article distributed under the terms and conditions of the Creative Commons Attribution (CC BY) license (http://creativecommons.org/licenses/by/4.0/).
Share and Cite
Brochmann, N.; Flachs, E.M.; Christensen, A.I.; Bak, M.; Andersen, C.L.; Juel, K.; Zwisler, A.-D. Health-Related Quality of Life in Patients with Philadelphia-Negative Myeloproliferative Neoplasms: A Nationwide Population-Based Survey in Denmark. Cancers 2020, 12, 3565. https://doi.org/10.3390/cancers12123565
Brochmann N, Flachs EM, Christensen AI, Bak M, Andersen CL, Juel K, Zwisler A-D. Health-Related Quality of Life in Patients with Philadelphia-Negative Myeloproliferative Neoplasms: A Nationwide Population-Based Survey in Denmark. Cancers. 2020; 12(12):3565. https://doi.org/10.3390/cancers12123565
Chicago/Turabian StyleBrochmann, Nana, Esben Meulengracht Flachs, Anne Illemann Christensen, Marie Bak, Christen Lykkegaard Andersen, Knud Juel, and Ann-Dorthe Zwisler. 2020. "Health-Related Quality of Life in Patients with Philadelphia-Negative Myeloproliferative Neoplasms: A Nationwide Population-Based Survey in Denmark" Cancers 12, no. 12: 3565. https://doi.org/10.3390/cancers12123565