Glioma Grading via Analysis of Digital Pathology Images Using Machine Learning


Abstract
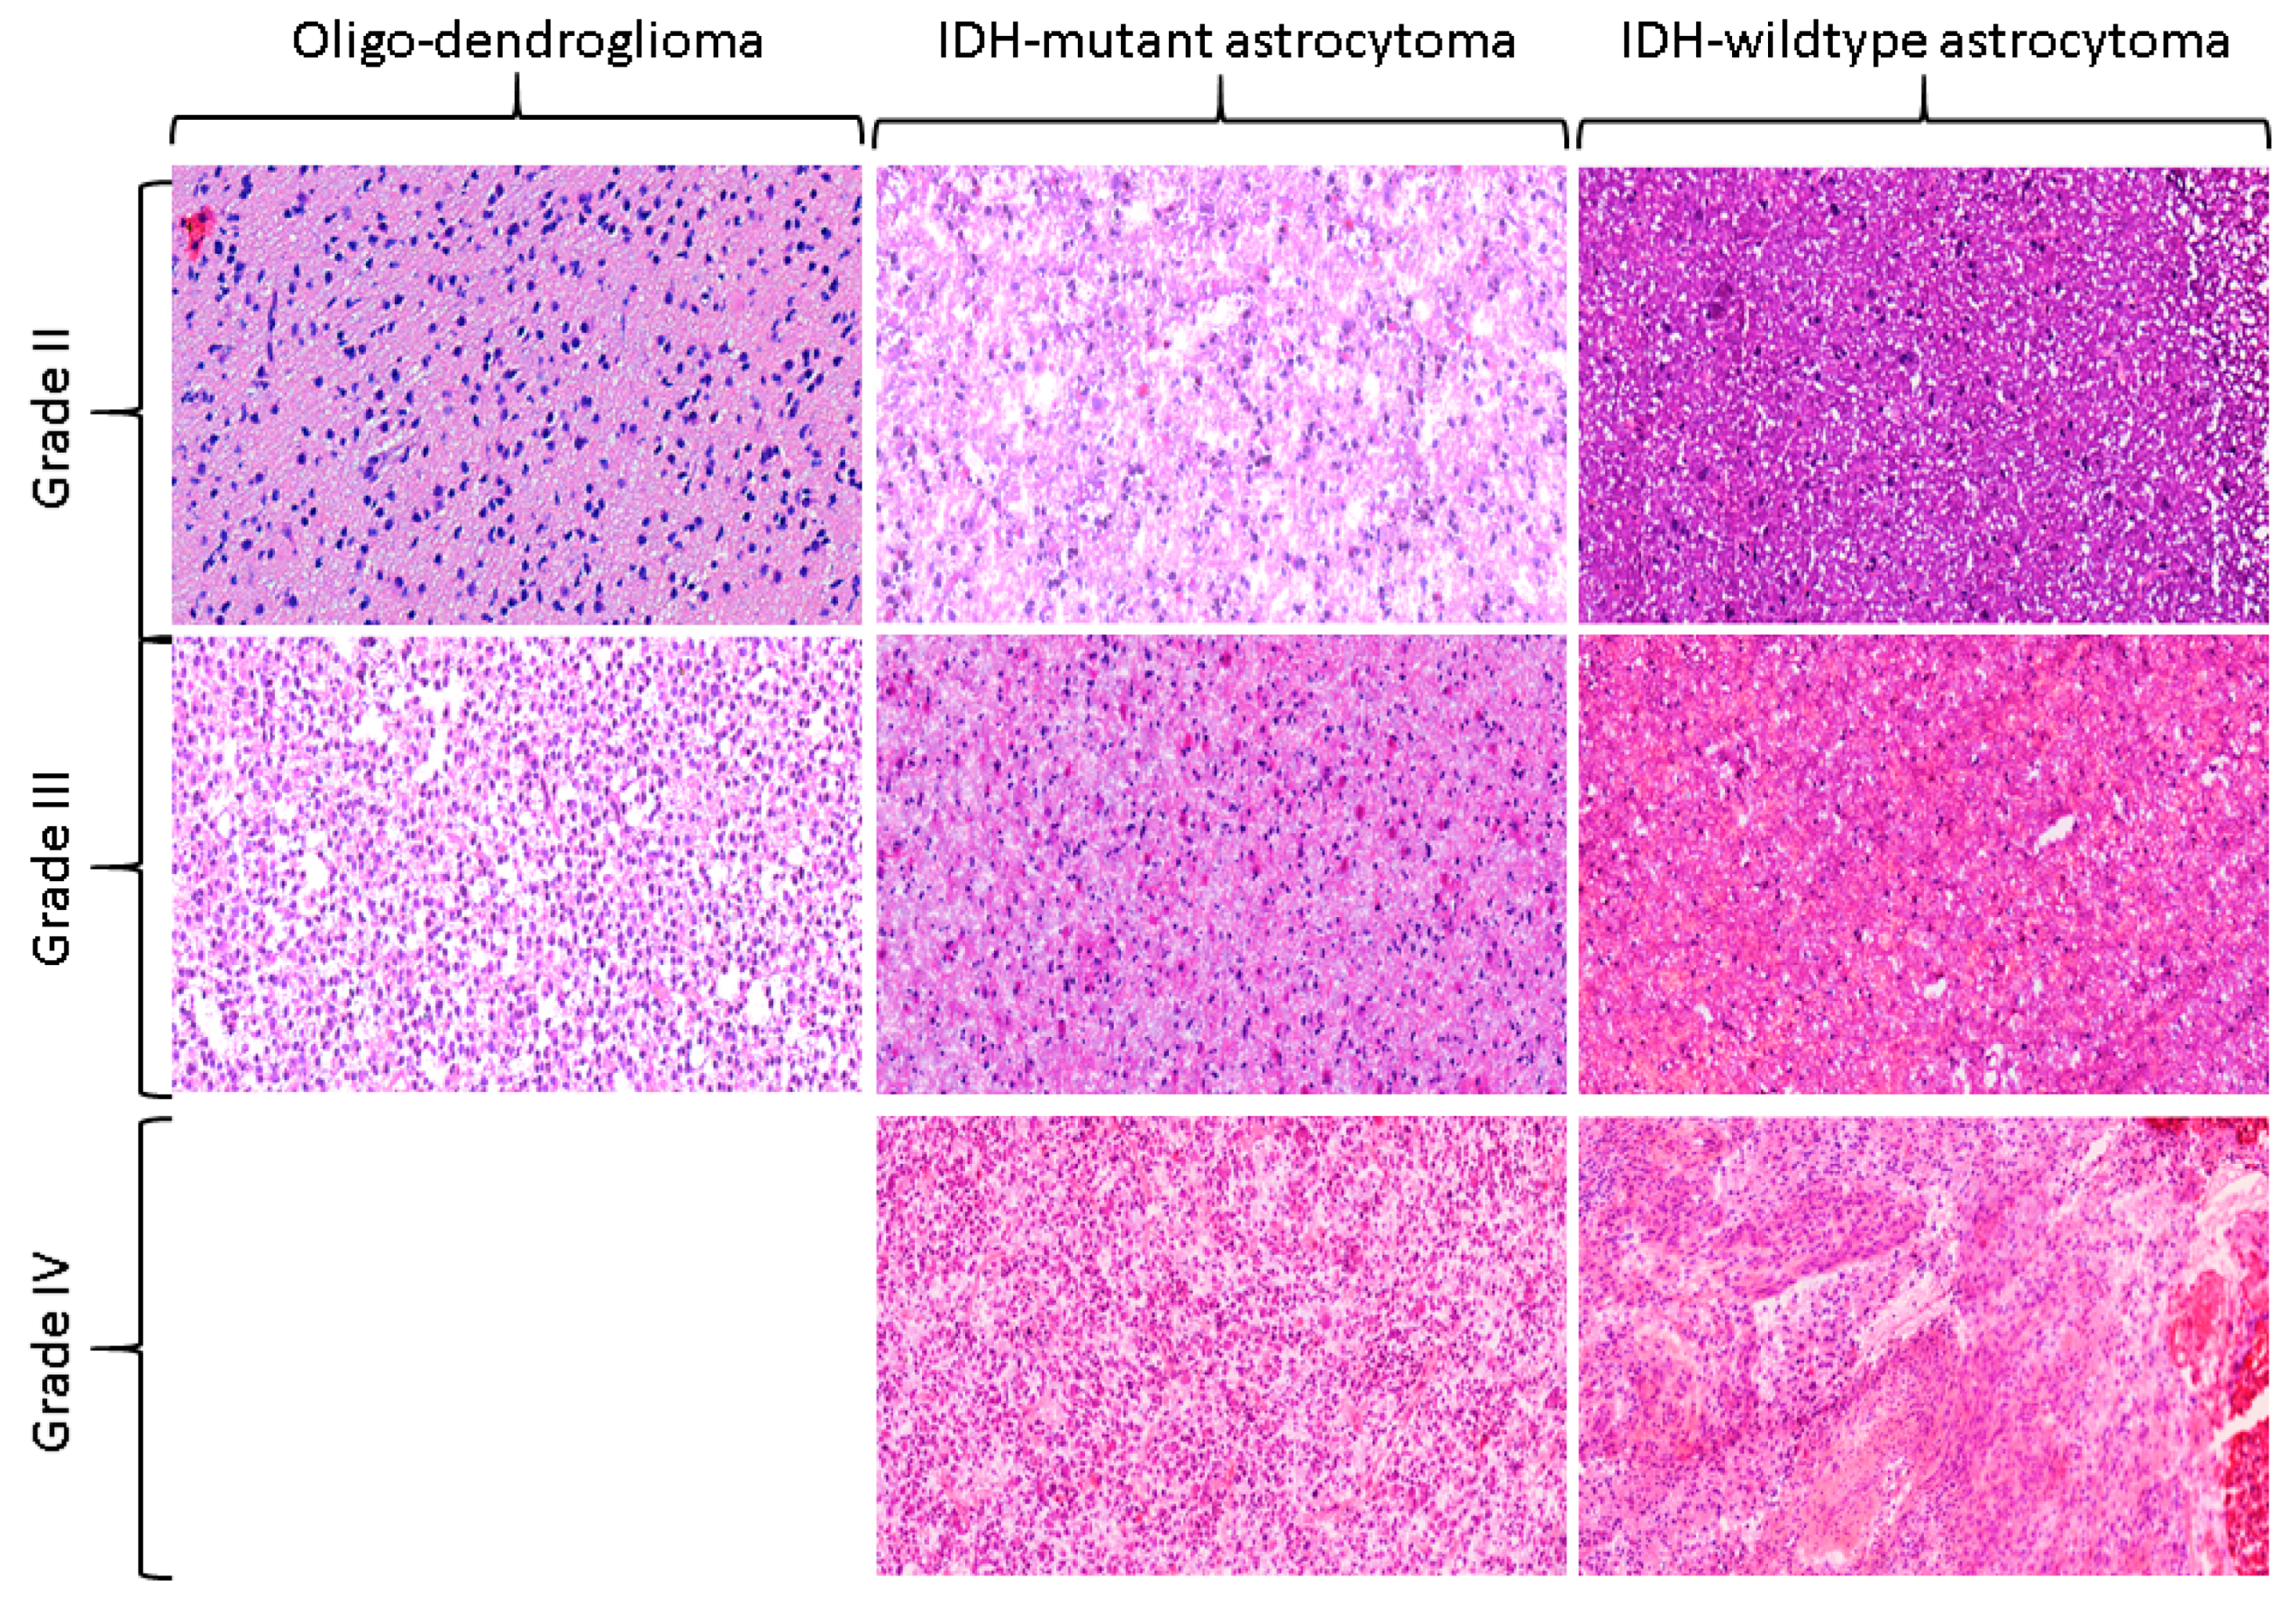
1. Introduction
2. Results
2.1. Distribution of the Study Cohort
2.2. Classification Performance of One-Layer Predictive Models in Detecting Histological Cancer Grade
2.3. Classification Performance of Multi-Layer Predictive Models in Detecting Cancer Grade
2.4. Comparison of the Classification Performance of Different Predictive Models in Detecting Cancer Grade
3. Discussion
4. Methods
4.1. Data Curation
4.2. Image Processing and Feature Extraction
4.3. Machine Learning and Statistical Analysis
5. Conclusions
Supplementary Materials
Author Contributions
Funding
Conflicts of Interest
References
- Aum, D.J.; Kim, D.H.; Beaumont, T.L.; Leuthardt, E.C.; Dunn, G.P.; Kim, A.H. Molecular and cellular heterogeneity: The hallmark of glioblastoma. Neurosurgical Focus 2014, 37, E11. [Google Scholar] [CrossRef] [PubMed]
- Lemée, J.-M.; Clavreul, A.; Menei, P. Intratumoral heterogeneity in glioblastoma: don’t forget the peritumoral brain zone. Neuro-Oncol. 2015, 17, 1322–1332. [Google Scholar]
- Louis, D.N.; Perry, A.; Reifenberger, G.; von Deimling, A.; Figarella-Branger, D.; Cavenee, W.K.; Ohgaki, H.; Wiestler, O.D.; Kleihues, P.; Ellison, D.W. The 2016 World Health Organization Classification of Tumors of the Central Nervous System: A summary. Acta Neuropathol. 2016, 131, 803–820. [Google Scholar] [CrossRef] [PubMed]
- Kros, J.M. Grading of gliomas: The road from eminence to evidence. J. Neuropathol. Exp. Neurol. 2011, 70, 101–109. [Google Scholar] [CrossRef] [PubMed]
- Perry, A.; Wesseling, P. Chapter 5 - Histologic Classification of Gliomas Handbook of Clinical Neurology; Berger, M.S., Weller, M., Eds.; Elsevier: Amsterdam, The Netherlands, 2016; pp. 71–95. [Google Scholar]
- Gurcan, M.N.; Boucheron, L.E.; Can, A.; Madabhushi, A.; Rajpoot, N.M.; Yener, B. Histopathological Image Analysis: A Review. IEEE Rev. Biomed. Eng. 2009, 2, 147–171. [Google Scholar] [CrossRef]
- Janowczyk, A.; Madabhushi, A. Deep learning for digital pathology image analysis: A comprehensive tutorial with selected use cases. J. Pathol. Inf. 2016, 7, 29. [Google Scholar] [CrossRef]
- Bera, K.; Schalper, K.A.; Rimm, D.L.; Velcheti, V.; Madabhushi, A. Artificial intelligence in digital pathology — new tools for diagnosis and precision oncology. Nat. Rev. Clin. Oncol. 2019, 16, 703–715. [Google Scholar] [CrossRef]
- Mobadersany, P.; Yousefi, S.; Amgad, M.; Gutman, D.A.; Barnholtz-Sloan, J.S.; Velazquez Vega, J.E.; Brat, D.J.; Cooper, L.A.D. Predicting cancer outcomes from histology and genomics using convolutional networks. Proc. Natl. Acad Sci. USA 2018, 115, E2970–E2979. [Google Scholar] [CrossRef]
- Iftikhar, M.A.; Rathore, S.; Nasrallah, M. Analysis of microscopic images via deep neural networks can predict outcome and IDH and 1p/19q codeletion status in gliomas. J. Neuropathol. Exp. Neurol. 2019, 78, 553. [Google Scholar]
- Rathore, S.; Iftikhar, M.A.; Nasrallah, M.; Gurcan, M.; Rajpoot, N.; Mourelatos, Z. Prediction of overall survival, and molecular markers in gliomas via analysis of digital pathology images using deep learning. Neuro-oncology 2019, 1909, 09124. [Google Scholar] [CrossRef]
- Rathore, S.; Nasrallah, M.; Mourelatos, Z. Radiopathomics: Integration of radiographic and hsitologic chaacteristics for prognostication in glioblastoma. Neuro-Oncology 2019, 1909, 07581. [Google Scholar] [CrossRef]
- Weinstein, J.N.; Collisson, E.A.; Mills, G.B.; Shaw, K.R.; Ozenberger, B.A.; Ellrott, K.; Shmulevich, I.; Sander, C.; Stuart, J.M. The Cancer Genome Atlas Pan-Cancer analysis project. Nat. Genet. 2013, 45, 1113–1120. [Google Scholar] [CrossRef] [PubMed]
- Van Mieghem, C.A.; Bruining, N.; Schaar, J.A.; McFadden, E.; Mollet, N.; Cademartiri, F.; Mastik, F.; Ligthart, J.M.; Granillo, G.A.; Valgimigli, M.; et al. Rationale and methods of the integrated biomarker and imaging study (IBIS): Combining invasive and non-invasive imaging with biomarkers to detect subclinical atherosclerosis and assess coronary lesion biology. Int. J. Cardiovasc. Imaging 2005, 21, 425–441. [Google Scholar] [CrossRef] [PubMed]
- Chen, H.; Song, Z.; Qian, M.; Bai, C.; Wang, X. Selection of disease-specific biomarkers by integrating inflammatory mediators with clinical informatics in AECOPD patients: A preliminary study. J. Cell Mol. Med. 2012, 16, 1286–1297. [Google Scholar] [CrossRef] [PubMed]
- Macyszyn, L.; Akbari, H.; Pisapia, J.M.; Da, X.; Attiah, M.; Pigrish, V.; Bi, Y.; Pal, S.; Davuluri, R.V.; Roccograndi, L.; et al. Imaging patterns predict patient survival and molecular subtype in glioblastoma via machine learning techniques. Neuro. Oncol. 2016, 18, 417–425. [Google Scholar] [CrossRef]
- Kickingereder, P.; Burth, S.; Wick, A.; Götz, M.; Eidel, O.; Schlemmer, H.-P.; Maier-Hein, K.H.; Wick, W.; Bendszus, M.; Radbruch, A. Radiomic profiling of glioblastoma: Identifying an imaging predictor of patient survival with improved performance over established clinical and radiologic risk models. Radiology 2016, 280, 880–889. [Google Scholar] [CrossRef]
- Kickingereder, P.; Neuberger, U.; Bonekamp, D.; Piechotta, P.L.; Gotz, M.; Wick, A.; Sill, M.; Kratz, A.; Shinohara, R.T.; Jones, D.T.W.; et al. Radiomic subtyping improves disease stratification beyond key molecular, clinical, and standard imaging characteristics in patients with glioblastoma. Neuro. Oncol. 2018, 20, 848–857. [Google Scholar] [CrossRef]
- Bhattacharjee, S.; Kim, C.H.; Park, H.G.; Prakash, D.; Madusanka, N.; Cho, N.H.; Choi, H.K. Multi-Features Classification of Prostate Carcinoma Observed in Histological Sections: Analysis of Wavelet-Based Texture and Colour Features. Cancers (Basel) 2019, 11, 1937. [Google Scholar] [CrossRef]
- Bae, S.; Choi, Y.S.; Ahn, S.S.; Chang, J.H.; Kang, S.G.; Kim, E.H.; Kim, S.H.; Lee, S.K. Radiomic MRI Phenotyping of Glioblastoma: Improving Survival Prediction. Radiology 2018, 289, 797–806. [Google Scholar] [CrossRef]
- Chaddad, A.; Daniel, P.; Sabri, S.; Desrosiers, C.; Abdulkarim, B. Integration of Radiomic and Multi-omic Analyses Predicts Survival of Newly Diagnosed IDH1 Wild-Type Glioblastoma. Cancers (Basel) 2019, 11, 1148. [Google Scholar] [CrossRef]
- Chaddad, A.; Desrosiers, C.; Abdulkarim, B.; Niazi, T. Predicting the Gene Status and Survival Outcome of Lower Grade Glioma Patients With Multimodal MRI Features. IEEE Access 2019, 7, 75976–75984. [Google Scholar] [CrossRef]
- Rathore, S.; Iftikhar, M.A.; Chaddad, A.; Niazi, T.; Karasic, T.; Bilello, M. Segmentation and grade prediction of colon cancer digital pathology images across multiple institutions. Cancers 2019, 11, 1700. [Google Scholar] [CrossRef] [PubMed]
- Chaddad, A.; Daniel, P.; Niazi, T. Radiomics Evaluation of Histological Heterogeneity Using Multiscale Textures Derived From 3D Wavelet Transformation of Multispectral Images. Front. Oncol. 2018, 8, 96. [Google Scholar] [CrossRef] [PubMed]
- Galloway, M.M. Texture analysis using grey level run lengths. Comput. Graph. Image Process. 1975, 4, 172–179. [Google Scholar] [CrossRef]
- Haralick, R.M.; Shanmugam, K.; Dinstein, I.H. Textural features for image classification. IEEE Trans. Syst. Manand Cybern. 1973, 3, 610–621. [Google Scholar] [CrossRef]
- Fujima, N.; Shimizu, Y.; Yoshida, D.; Kano, S.; Mizumachi, T.; Homma, A.; Yasuda, K.; Onimaru, R.; Sakai, O.; Kudo, K.; et al. Machine-Learning-Based Prediction of Treatment Outcomes Using MR Imaging-Derived Quantitative Tumor Information in Patients with Sinonasal Squamous Cell Carcinomas: A Preliminary Study. Cancers (Basel) 2019, 11, 800. [Google Scholar] [CrossRef]
- Chiesa-Estomba, C.M.; Echaniz, O.; Larruscain, E.; Gonzalez-Garcia, J.A.; Sistiaga-Suarez, J.A.; Grana, M. Radiomics and Texture Analysis in Laryngeal Cancer. Looking for New Frontiers in Precision Medicine through Imaging Analysis. Cancers (Basel) 2019, 11, 1409. [Google Scholar] [CrossRef]
- Chang, C.-C.; Lin, C.-J. LIBSVM: A library for support vector machines. ACM Trans. Intell. Syst. Technol. (TIST) 2011, 2, 1–27. [Google Scholar] [CrossRef]


| Characteristics | Complete Dataset | LGGs | HGGs | |
|---|---|---|---|---|
| Grade-II | Grade-III | Grade-IV | ||
| No. of patients | 735 | 181 (24.63%) | 205 (27.89%) | 349 (47.48%) |
| Median overall survival | 761.26 | 1128 | 842.23 | 532.45 |
| No. of deaths | 385 (52.38%) | 24 (13.26%) | 59 (28.78%) | 302 (86.53%) |
| Age | 49.65 | 40.37 | 45.687 | 56.79 |
| Gender | ||||
| Male | 427 (58.10%) | 99(54.70) | 116 (56.59%) | 212 (60.74%) |
| Female | 308 (41.90%) | 82 (45.30%) | 89 (43.41%) | 137 (39.26%) |
| IDH mutation | ||||
| Wildtype | 333 (52.61%) | 14 (7.82%) | 57 (27.80%) | 262 (93.91%) |
| Mutant | 330 (52.13%) | 165 (92.18%) | 148 (72.20%) | 17 (6.09%) |
| NA | 72 | 2 | 0 | 70 |
| 1p19q mutation | ||||
| Wildtype | 201 (60.91%) | 96 (53.04) | 88 (42.93%) | 17 (100%) |
| Mutant | 129 (39.09) | 69 (38.12) | 60 (29.27%) | 0 |
| Classification Models | Accuracy | Sensitivity | Specificity | AUC (95% CI) |
|---|---|---|---|---|
| One-Layer-Models | ||||
| Model-Ia: Imaging | 73.14 | 72.84 | 74.05 | 0.669 (0.477, 0.868) |
| Model-Ib: Texture | 75.12 | 75.30 | 74.53 | 0.653 (0.465, 0.858) |
| Model-Ic: Clinical | 69.54 | 67.19 | 76.72 | 0.610 (0.407, 0.869) |
| Two-Layer-Models | ||||
| Model-IIa: Imaging+Texture | 82.51 | 84.27 | 77.10 | 0.806 (0.671, 0.937) |
| Model-IIb: Imaging+Clinical | 79.86 | 81.27 | 75.57 | 0.782 (0.642, 0.937) |
| Model-IIc: Texture+Clinical | 80.90 | 82.47 | 76.08 | 0.710 (0.479, 0.936) |
| Three-Layer-Models | ||||
| Model-IIIa: Imaging+Texture+Clinical | 91.48 | 93.47 | 85.36 | 0.927 (0.872, 0.981) |
| Classification models | Ia: Imaging | Ib: Texture | Ic: Clinical | IIa: Imaging+Texture | IIb: Imaging+Clinical | IIc: Texture+Clinical |
|---|---|---|---|---|---|---|
| Ia:Imaging | --- | 0.530, −0.01 (−0.27, 0.25) | 0.636, −0.05 (−0.34,0.25) | --- | --- | --- |
| Ib:Texture | --- | --- | 0.598, −0.05 (−0.31,0.25) | --- | --- | --- |
| IIa:Imaging+Texture | 0.045, 0.09 (−0.08,0.34) | 0.048, 0.10 (−0.06,0.35) | 0.032, 0.20 (−0.06,0.42) | --- | 0.606, −0.02 (−0.19,0.15) | 0.562, −0.01 (−0.17,0.15) |
| IIb:Imaging+Clinical | 0.173, 0.12 (−0.11,0.34) | 0.123, 0.13 (−0.09,0.34) | 0.109, 0.17 (−0.09,0.41) | --- | --- | 0.457, 0.01 (−0.17,0.19) |
| IIc:Texture+Clinical | 0.146, 0.13 (−0.09,0.34) | 0.117, 0.14 (−0.09,0.33) | 0.102, 0.18 (−0.08,0.41) | --- | --- | --- |
| IIIa:Imaging+Texture+Clinical | 0.002, 0.26 (0.07,0.43) | 0.001, 0.27 (0.09,0.44) | 0.001, 0.32 (0.08,0.50) | 0.004, 0.12 (0.01,0.23) | 0.009, 0.14 (0.02,0.27) | 0.010, 0.13 (0.02,0.27) |
© 2020 by the authors. Licensee MDPI, Basel, Switzerland. This article is an open access article distributed under the terms and conditions of the Creative Commons Attribution (CC BY) license (http://creativecommons.org/licenses/by/4.0/).
Share and Cite
Rathore, S.; Niazi, T.; Iftikhar, M.A.; Chaddad, A. Glioma Grading via Analysis of Digital Pathology Images Using Machine Learning. Cancers 2020, 12, 578. https://doi.org/10.3390/cancers12030578
Rathore S, Niazi T, Iftikhar MA, Chaddad A. Glioma Grading via Analysis of Digital Pathology Images Using Machine Learning. Cancers. 2020; 12(3):578. https://doi.org/10.3390/cancers12030578
Chicago/Turabian StyleRathore, Saima, Tamim Niazi, Muhammad Aksam Iftikhar, and Ahmad Chaddad. 2020. "Glioma Grading via Analysis of Digital Pathology Images Using Machine Learning" Cancers 12, no. 3: 578. https://doi.org/10.3390/cancers12030578
APA StyleRathore, S., Niazi, T., Iftikhar, M. A., & Chaddad, A. (2020). Glioma Grading via Analysis of Digital Pathology Images Using Machine Learning. Cancers, 12(3), 578. https://doi.org/10.3390/cancers12030578