FIGO 2018 Staging for Cervical Cancer: Influence on Stage Distribution and Outcomes in the 3D-Image-Guided Brachytherapy Era

 ,
,
Abstract
:1. Introduction
2. Results
3. Discussion
4. Materials and Methods
4.1. Study Design
4.2. Diagnostic Modality for Staging
4.3. Treatment
4.4. Follow-Up
4.5. Statistics
5. Conclusions
Supplementary Materials
Author Contributions
Funding
Acknowledgments
Conflicts of Interest
References
- Bray, F.; Ferlay, J.; Soerjomataram, I.; Siegel, R.L.; Torre, L.A.; Jemal, A. Global cancer statistics 2018: GLOBOCAN estimates of incidence and mortality worldwide for 36 cancers in 185 countries. CA Cancer J. Clin. 2018, 68, 394–424. [Google Scholar] [CrossRef] [PubMed] [Green Version]
- Marth, C.; Landoni, F.; Mahner, S.; McCormack, M.; Gonzalez-Martin, A.; Colombo, N.; ESMO Guidelines Committee. Cervical cancer: ESMO Clinical Practice Guidelines for diagnosis, treatment and follow-up. Ann. Oncol. 2017, 28, iv72–iv83. [Google Scholar] [CrossRef] [PubMed]
- Monk, B.J.; Tewari, K.S.; Koh, W.J. Multimodality therapy for locally advanced cervical carcinoma: state of the art and future directions. J. Clin. Oncol. 2007, 25, 2952–2965. [Google Scholar] [CrossRef] [PubMed]
- Grover, S.; Longo, J.; Einck, J.; Puri, P.; Brown, D.; Chino, J.; Mahantshetty, U.; Yashar, C.; Erickson, B. The Unique issues with brachytherapy in low- and middle-income countries. Semin. Radiat. Oncol. 2017, 27, 136142. [Google Scholar] [CrossRef]
- Tan, L.T. Implementation of image-guided brachytherapy for cervix cancer in the UK: progress update. Clin. Oncol. 2011, 23, 681–684. [Google Scholar] [CrossRef]
- Sturdza, A.; Pötter, R.; Fokdal, L.U.; Haie-Meder, C.; Tan, L.T.; Mazeron, R.; Petric, P.; Šegedin, B.; Jurgenliemk-Schulz, I.M.; Nomden, C.; et al. Image guided brachytherapy in locally advanced cervical cancer: Improved pelvic control and survival in RetroEMBRACE, a multicenter cohort study. Radiother. Oncol. 2016, 120, 428–433. [Google Scholar] [CrossRef]
- Ohno, T.; Noda, S.E.; Okonogi, N.; Murata, K.; Shibuya, K.; Kiyohara, H.; Tamaki, T.; Ando, K.; Oike, T.; Ohkubo, Y.; et al. In-room computed tomography-based brachytherapy for uterine cervical cancer: results of a 5-year retrospective study. J. Radiat. Res. 2017, 58, 543–551. [Google Scholar] [CrossRef] [PubMed] [Green Version]
- FIGO Committee on Gynecologic Oncology. FIGO staging for carcinoma of the vulva, cervix, and corpus uteri. Int. J. Gynaecol. Obstet. 2014, 125, 97–98. [Google Scholar] [CrossRef] [PubMed]
- Pecorelli, S. Revised FIGO staging for carcinoma of the vulva, cervix, and endometrium. Int. J. Gynaecol. Obstet. 2009, 105, 103–104. [Google Scholar] [CrossRef] [PubMed]
- Wright, J.D.; Matsuo, K.; Huang, Y.; Tergas, A.I.; Hou, J.Y.; Khoury-Collado, F.; St Clair, C.M.; Ananth, C.V.; Neugut, A.I.; Hershman, D.L. Prognostic performance of the 2018 International Federation of Gynecology and Obstetrics cervical cancer staging guidelines. Obstet. Gynecol. 2019, 134, 49–57. [Google Scholar] [CrossRef] [PubMed]
- Bhatla, N.; Aoki, D.; Sharma, D.N.; Sankaranarayanan, R. Cancer of the cervix uteri. Int. J. Gynaecol. Obstet. 2018, 143, 22–36. [Google Scholar] [CrossRef] [PubMed]
- Matsuo, K.; Machida, H.; Mandelbaum, R.S.; Konishi, I.; Mikami, M. Validation of the 2018 FIGO cervical cancer staging system. Gynecol. Oncol. 2019, 152, 87–93. [Google Scholar] [CrossRef] [PubMed]
- Grigsby, P.W.; Massad, L.S.; Mutch, D.G.; Powell, M.A.; Thaker, P.H.; McCourt, C.; Hagemann, A.; Fuh, K.; Kuroki, L.; Schwarz, J.K.; et al. FIGO 2018 staging criteria for cervical cancer: Impact on stage migration and survival. Gynecol. Oncol. 2020. In press. [Google Scholar] [CrossRef] [PubMed]
- Gien, L.T.; Beauchemin, M.C.; Thomas, G. Adenocarcinoma: A unique cervical cancer. Gynecol. Oncol. 2010, 116, 140–146. [Google Scholar] [CrossRef] [PubMed]
- Hopkins, M.P.; Morley, G.W. A comparison of adenocarcinoma and squamous cell carcinoma of the cervix. Obstet. Gynecol. 1991, 77, 912–917. [Google Scholar] [CrossRef]
- Chen, R.J.; Lin, Y.H.; Chen, C.A.; Huang, S.C.; Chow, S.N.; Hsieh, C.Y. Influence of histologic type and age on survival rates for invasive cervical carcinoma in Taiwan. Gynecol. Oncol. 1999, 73, 184–190. [Google Scholar] [CrossRef] [PubMed]
- Miyasaka, Y.; Yoshimoto, Y.; Murata, K.; Noda, S.E.; Ando, K.; Ebara, T.; Okonogi, N.; Kaminuma, T.; Yamada, S.; Ikota, H.; et al. Treatment outcomes of patients with adenocarcinoma of the uterine cervix after definitive radiotherapy and the prognostic impact of tumor-infiltrating CD8+ lymphocytes in pre-treatment biopsy specimens: A multi-institutional retrospective study. J. Radiat. Res. 2020, 61, 275–284. [Google Scholar] [CrossRef] [PubMed] [Green Version]


| Characteristics | n (%) |
|---|---|
| Age (years) | |
| <39 | 14 (6.3) |
| 40–59 | 91 (41.2) |
| 60–79 | 103 (46.6) |
| ≥80 | 13 (5.9) |
| Treatment | |
| RT | 84 (38.0) |
| CCRT | 137 (62.0) |
| CT course | |
| 1 or 2 | 7 (5.3) |
| 3 | 22 (16.5) |
| 4 | 42 (31.6) |
| 5 | 52 (39.1) |
| 6+ | 10 (7.5) |
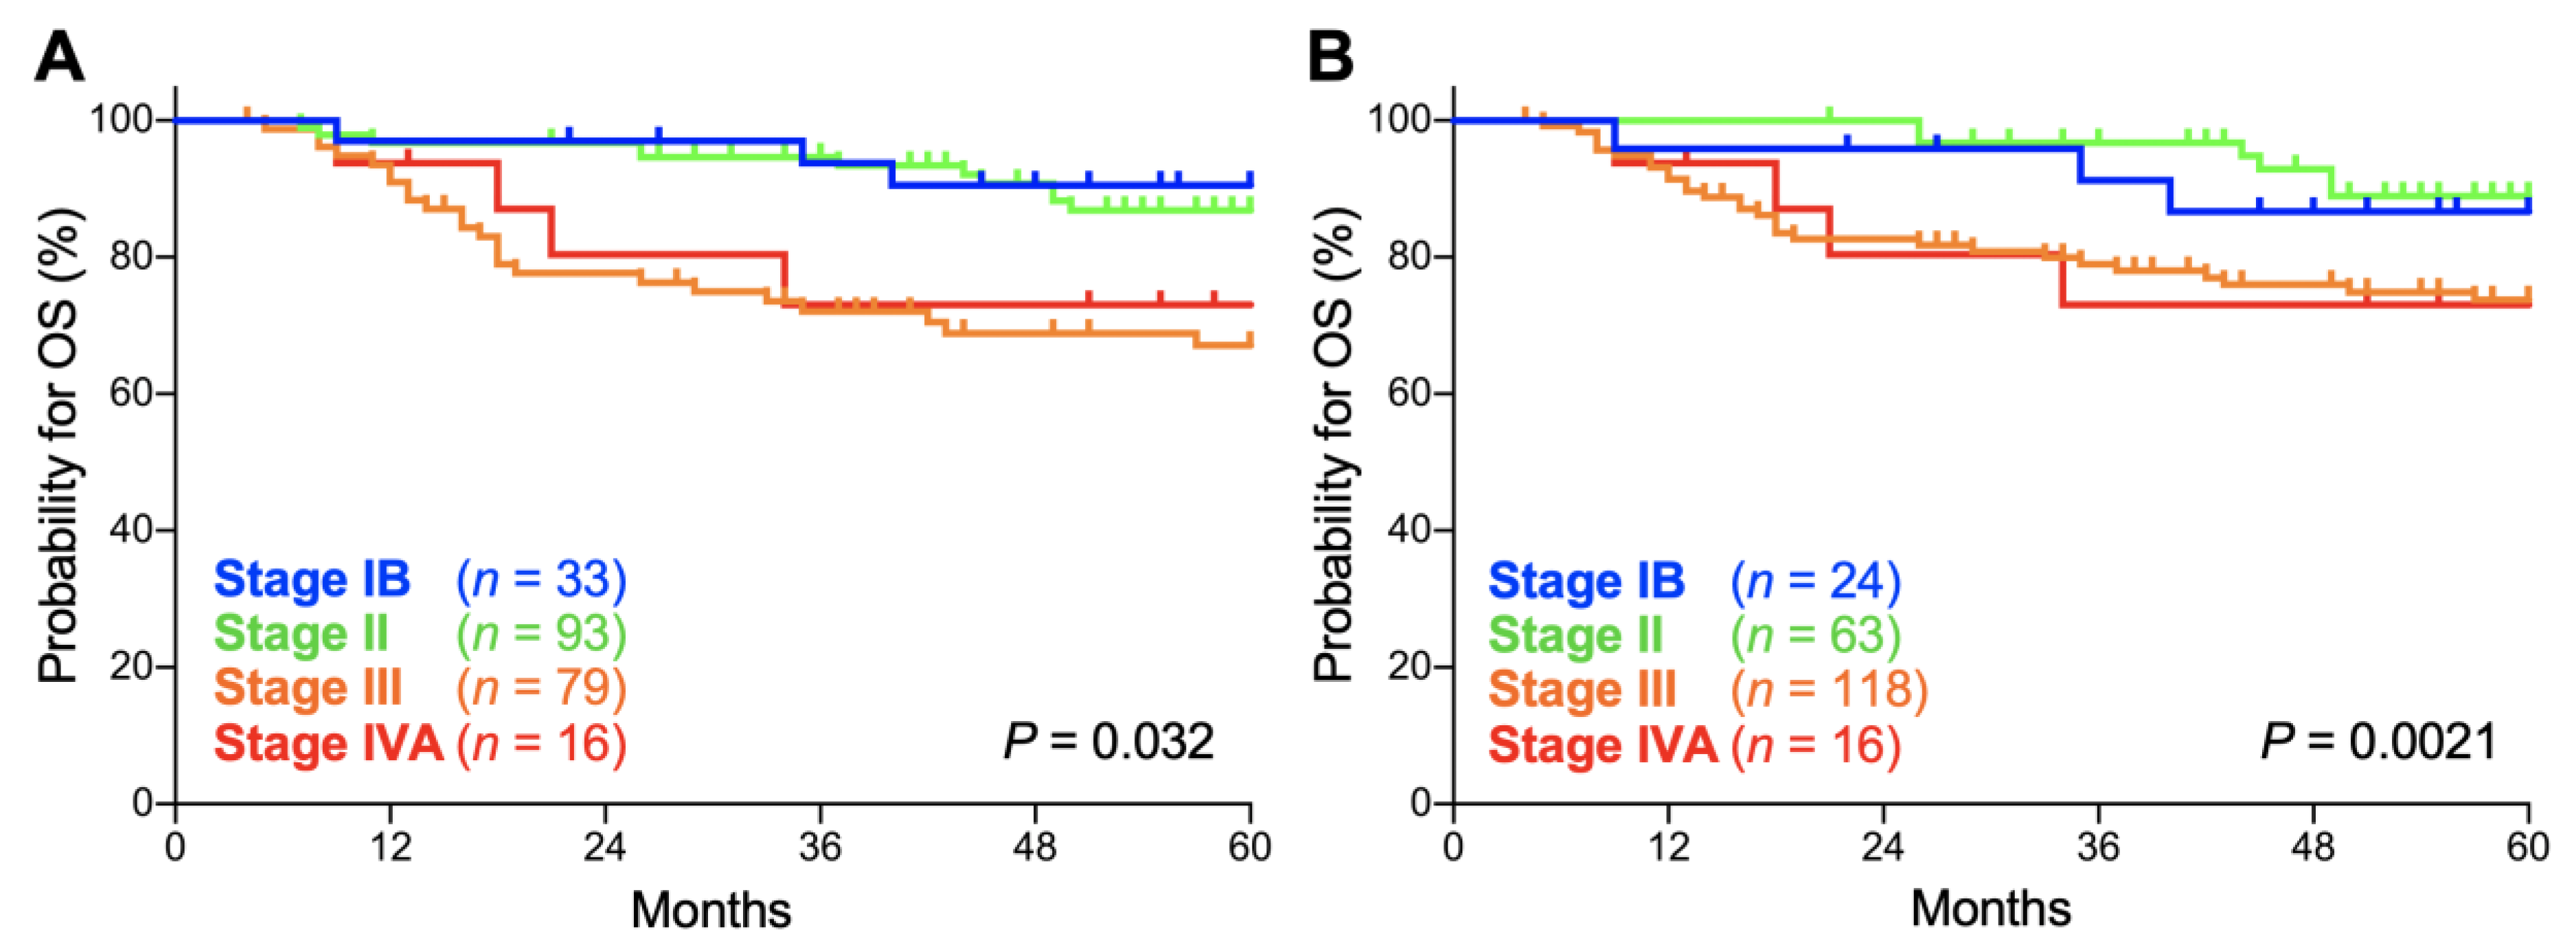
| Stage | FIGO 2009 | FIGO 2018 | p Values |
|---|---|---|---|
| IB | 90.5 (73.3–96.8) | 86.7 (64.1–95.5) | 0.65 |
| II | 86.8 (77.4–92.5) | 88.9 (76.9–94.9) | 0.60 |
| III | 67.0 (54.8–76.6) | 73.7 (64.3–81.0) | 0.34 |
| IVA | 73.0 (42.9–88.9) | 73.0 (42.9–88.9) | 1.0 |
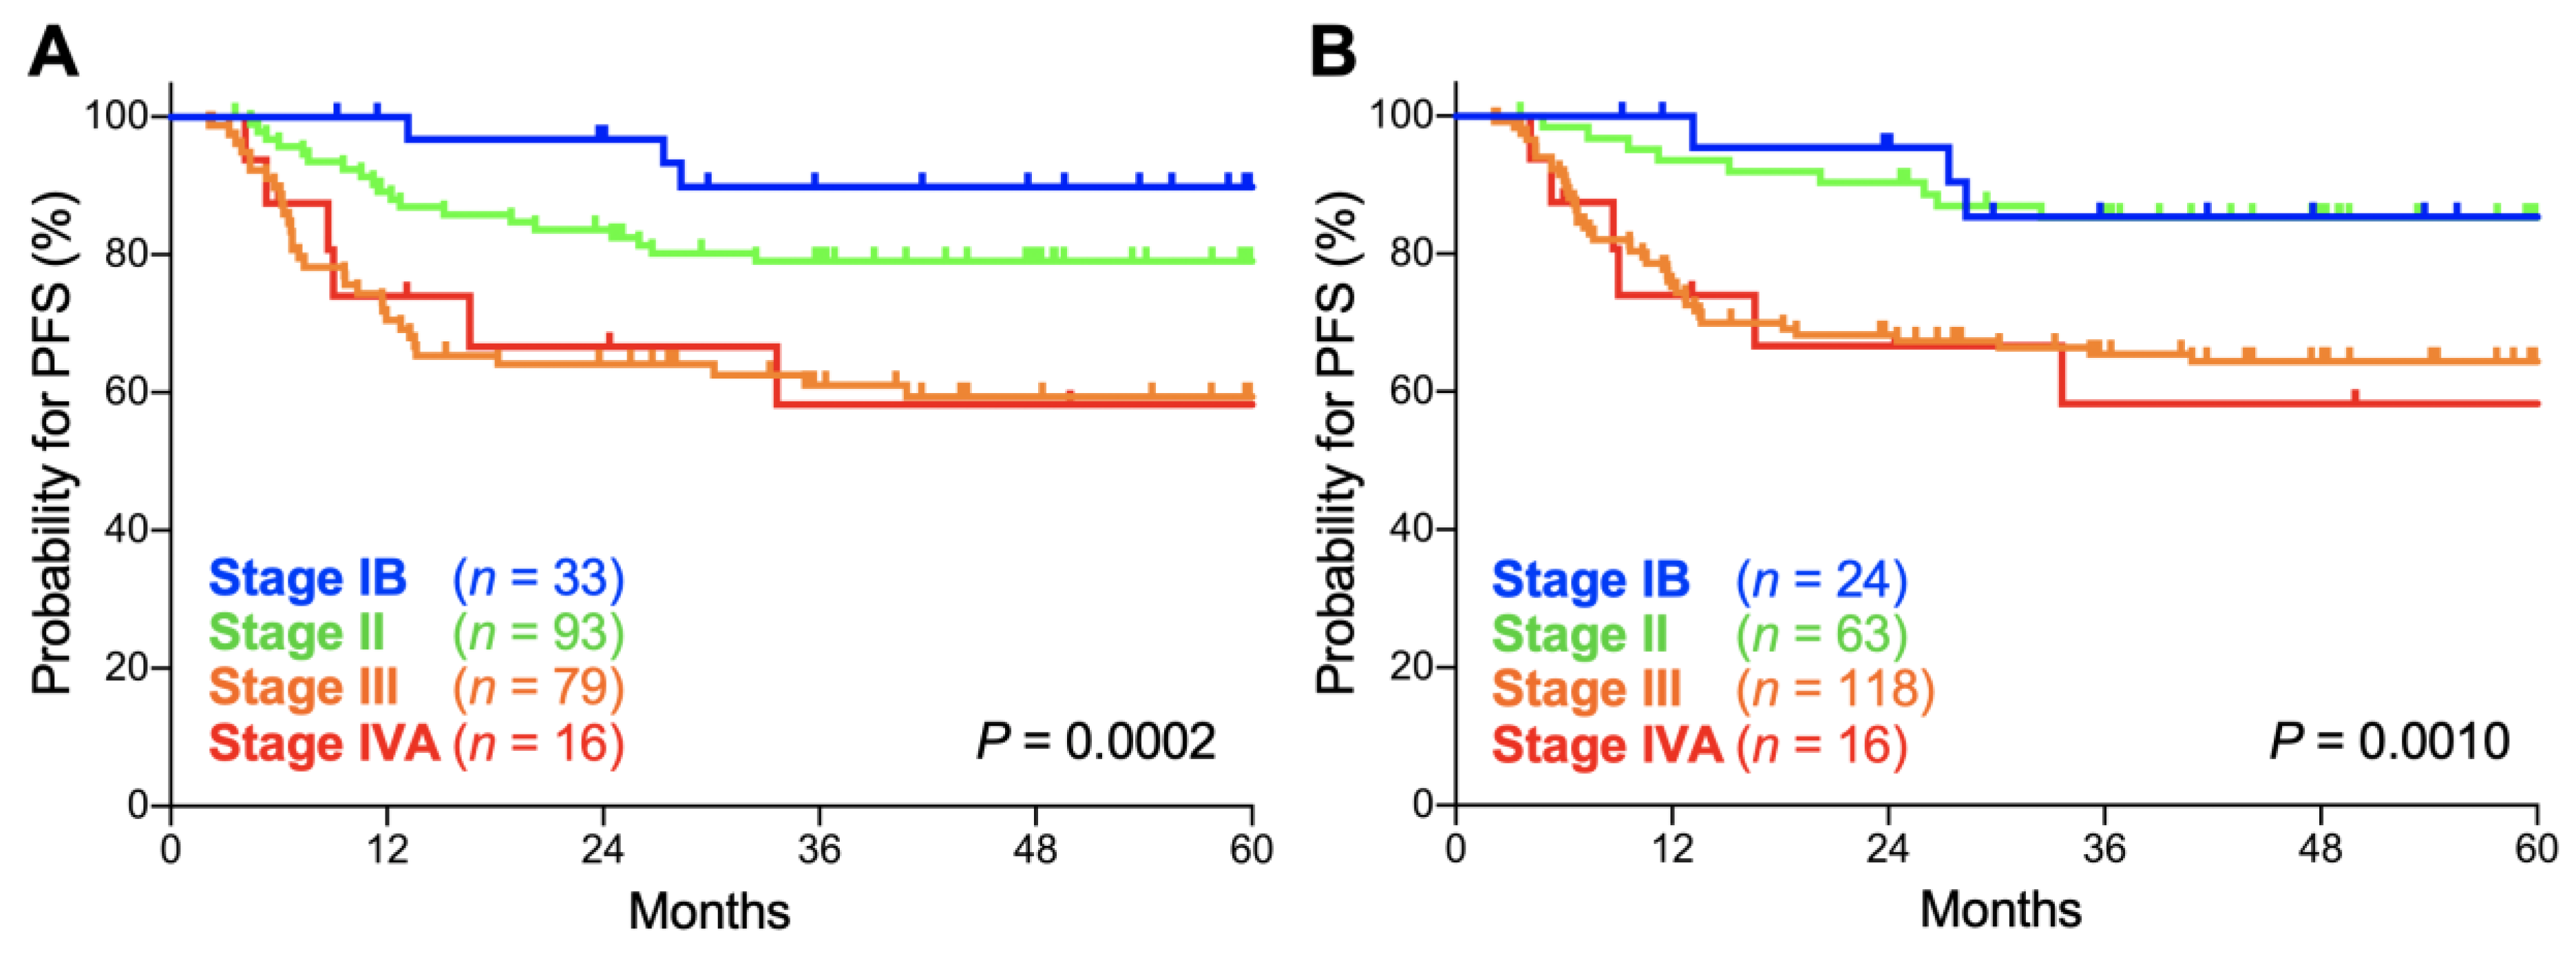
| Stage | FIGO 2009 | FIGO 2018 | p Values |
|---|---|---|---|
| IB | 89.8 (71.7–96.6) | 85.4 (61.1–95.0) | 0.63 |
| II | 79.0 (69.1–86.1) | 85.2 (73.5–92.0) | 0.34 |
| III | 59.3 (47.3–69.4) | 64.3 (54.8–72.3) | 0.48 |
| IVA | 58.3 (29.1–78.9) | 58.3 (29.1–78.9) | 1.0 |
| Stage | 5-Year OS | 5-Year PFS |
|---|---|---|
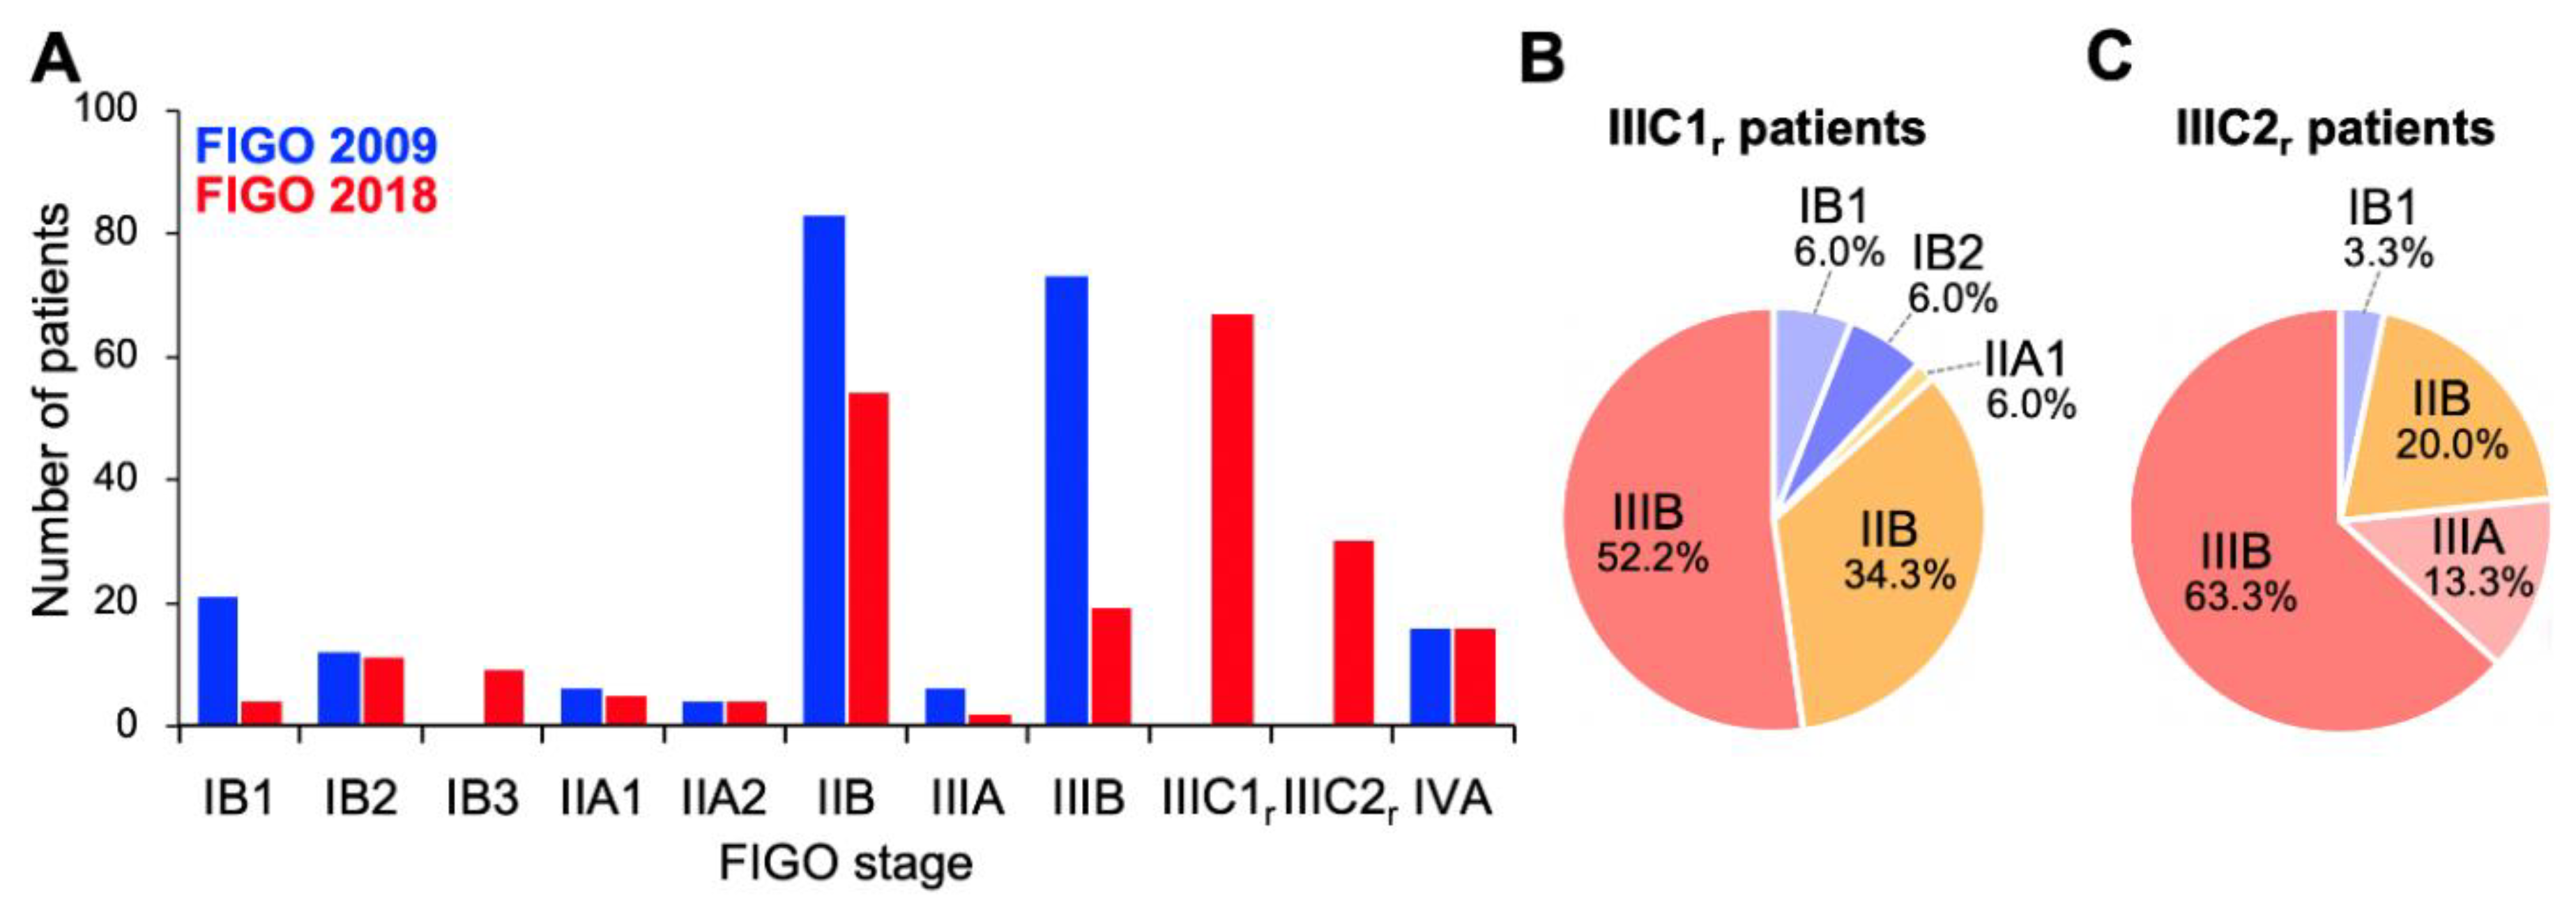
| IIIA–B | 85.2 (60.8–94.9) | 80.9 (56.8–92.3) |
| IIIC1r | 75.9 (63.1–84.8) | 64.6 (51.6–74.9) |
| IIIC2r | 60.8 (40.3–76.1) | 51.7 (32.5–67.9) |
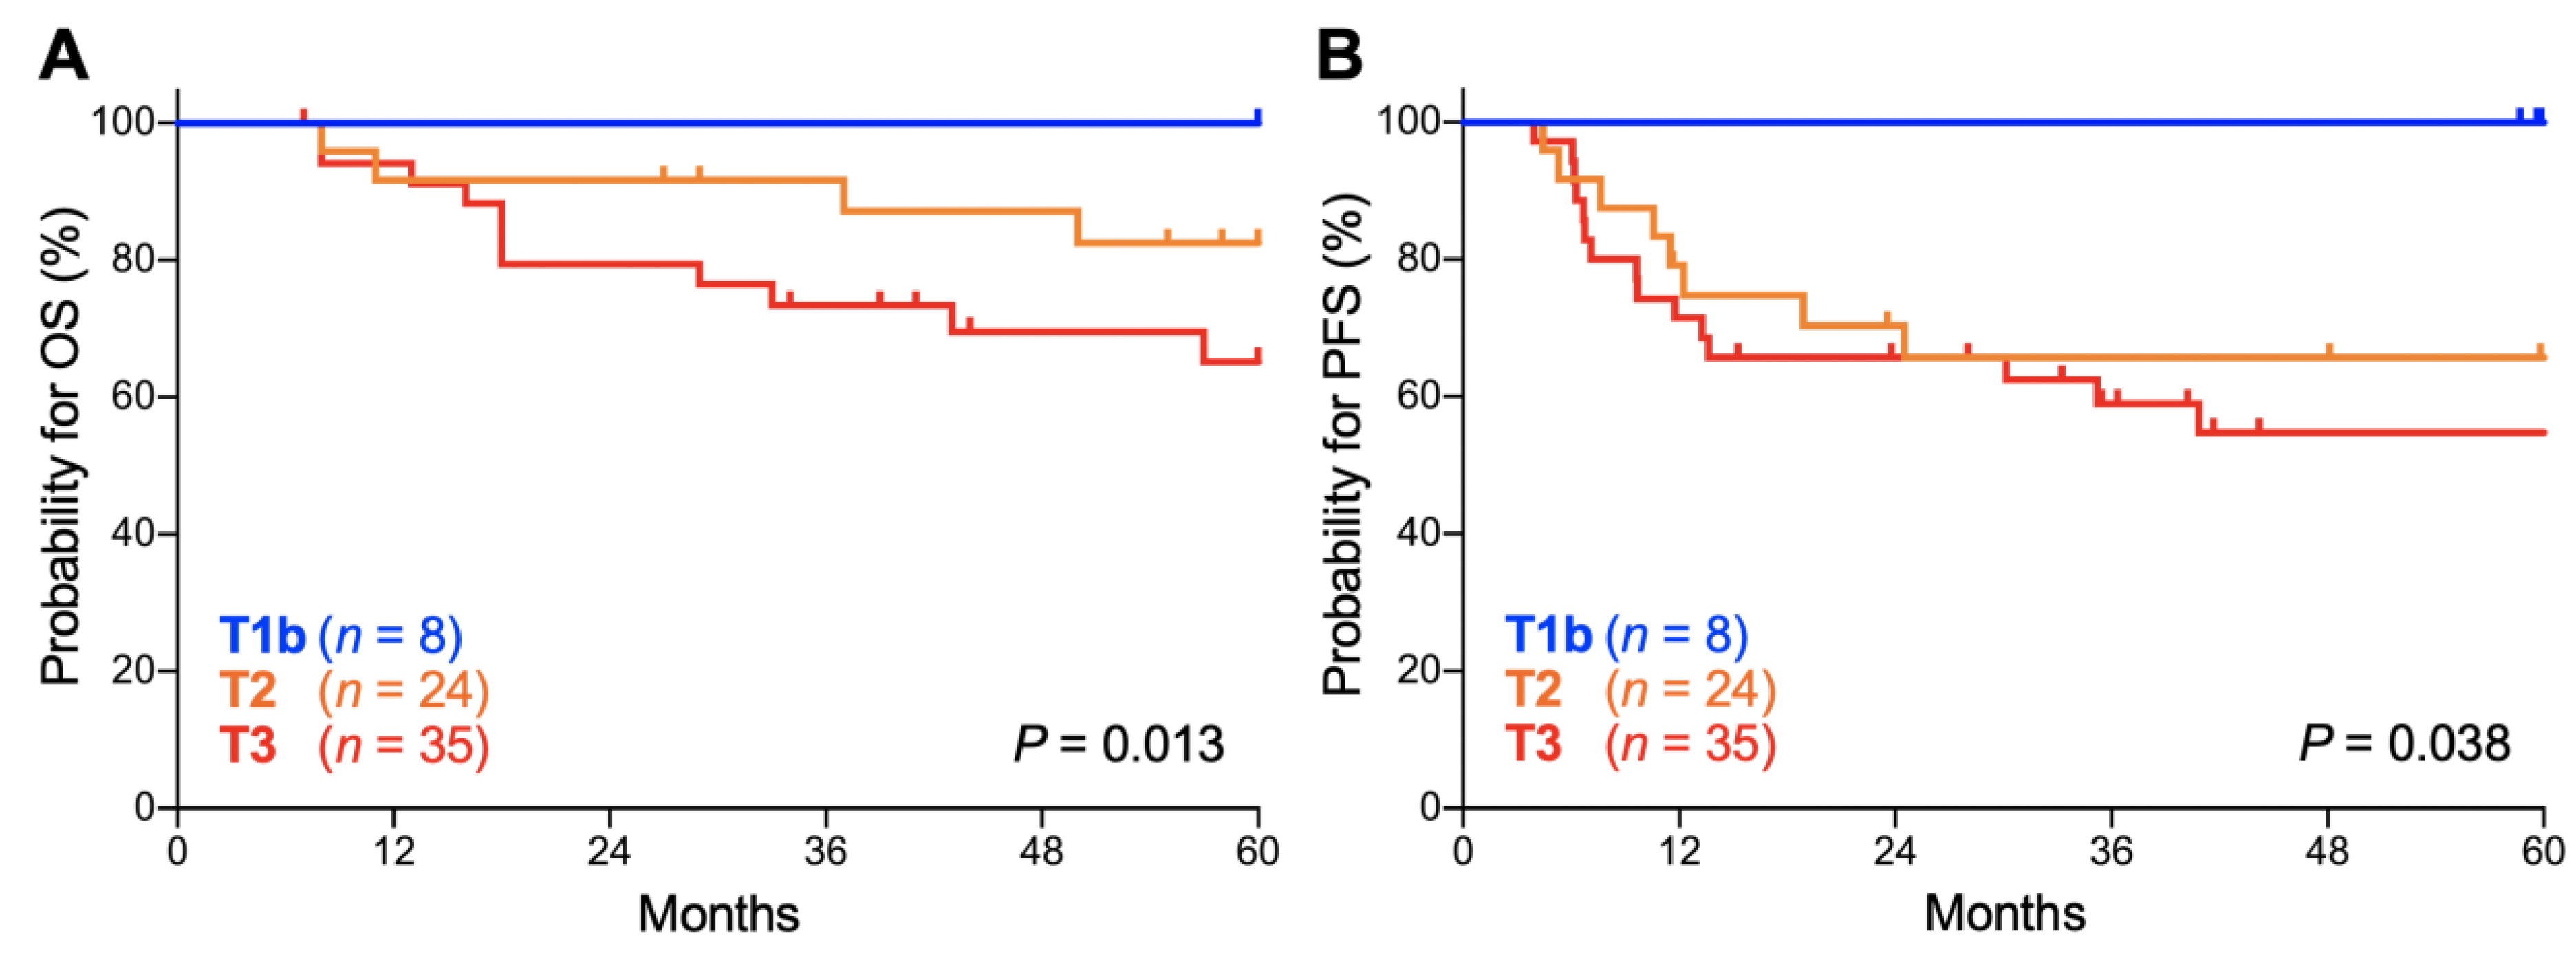
| T Stage | 5-Year OS | 5-Year PFS |
|---|---|---|
| T1b | 100.0 (NA–NA) | 100.0 (NA–NA) |
| T2 | 82.5 (59.7–93.0) | 65.6 (42.8–81.1) |
| T3 | 65.2 (45.4–79.2) | 54.7 (36.0–70.0) |
© 2020 by the authors. Licensee MDPI, Basel, Switzerland. This article is an open access article distributed under the terms and conditions of the Creative Commons Attribution (CC BY) license (http://creativecommons.org/licenses/by/4.0/).
Share and Cite
Tomizawa, K.; Kaminuma, T.; Murata, K.; Noda, S.-e.; Irie, D.; Kumazawa, T.; Oike, T.; Ohno, T. FIGO 2018 Staging for Cervical Cancer: Influence on Stage Distribution and Outcomes in the 3D-Image-Guided Brachytherapy Era. Cancers 2020, 12, 1770. https://doi.org/10.3390/cancers12071770
Tomizawa K, Kaminuma T, Murata K, Noda S-e, Irie D, Kumazawa T, Oike T, Ohno T. FIGO 2018 Staging for Cervical Cancer: Influence on Stage Distribution and Outcomes in the 3D-Image-Guided Brachytherapy Era. Cancers. 2020; 12(7):1770. https://doi.org/10.3390/cancers12071770
Chicago/Turabian StyleTomizawa, Kento, Takuya Kaminuma, Kazutoshi Murata, Shin-ei Noda, Daisuke Irie, Takuya Kumazawa, Takahiro Oike, and Tatsuya Ohno. 2020. "FIGO 2018 Staging for Cervical Cancer: Influence on Stage Distribution and Outcomes in the 3D-Image-Guided Brachytherapy Era" Cancers 12, no. 7: 1770. https://doi.org/10.3390/cancers12071770
APA StyleTomizawa, K., Kaminuma, T., Murata, K., Noda, S.-e., Irie, D., Kumazawa, T., Oike, T., & Ohno, T. (2020). FIGO 2018 Staging for Cervical Cancer: Influence on Stage Distribution and Outcomes in the 3D-Image-Guided Brachytherapy Era. Cancers, 12(7), 1770. https://doi.org/10.3390/cancers12071770