Article

Expression Profiling of Extracellular Matrix Genes Reveals Global and Entity-Specific Characteristics in Adenoid Cystic, Mucoepidermoid and Salivary Duct Carcinomas

by
Christoph Arolt
1,*,
Moritz Meyer
2,3,
Franziska Hoffmann
4,
Svenja Wagener-Ryczek
1,
David Schwarz
2,
Lisa Nachtsheim
2,
Dirk Beutner
5,
Margarete Odenthal
1,
Orlando Guntinas-Lichius
6,
Reinhard Buettner
1,
Ferdinand von Eggeling
7,
Jens Peter Klußmann
2,† and
Alexander Quaas
1,†
1
Institute of Pathology, Medical Faculty, University of Cologne, 50937 Cologne, Germany
2
Department of Otorhinolaryngology, Head and Neck Surgery, Medical Faculty, University of Cologne, 50937 Cologne, Germany
3
Department of Otorhinolaryngology, Head and Neck Surgery, University Hospital Essen, University Duisburg-Essen, 45147 Essen, Germany
4
Department of Otorhinolaryngology, MALDI Imaging and Innovative Biophotonics, Jena University Hospital, 07747 Jena, Germany
5
Department of Otorhinolaryngology, Head and Neck Surgery, University Medical Center Göttingen, 37075 Göttingen, Germany
6
Department of Otorhinolaryngology, Head and Neck Surgery, Jena University Hospital, 07747 Jena, Germany
7
Department of Otorhinolaryngology, MALDI Imaging, Core Unit Proteome Analysis, DFG Core Unit Jena Biophotonic and Imaging Laboratory (JBIL), Jena University Hospital, 07747 Jena, Germany
*
Author to whom correspondence should be addressed.
Authors contributed equally to this work.
Cancers 2020, 12(9), 2466; https://doi.org/10.3390/cancers12092466
Submission received: 11 July 2020 / Revised: 25 August 2020 / Accepted: 25 August 2020 / Published: 31 August 2020
(This article belongs to the Section Tumor Microenvironment)

Abstract

:

Simple Summary

The extracellular matrix (ECM), an important factor in tumour metastasis and therapy resistance, has not been studied in salivary gland carcinomas (SGC), so far. In this retrospective study, we profiled the RNA expression of 28 ECM-related genes in 11 adenoid cystic (AdCy), 14 mucoepidermoid (MuEp) and 9 salivary duct carcinomas (SaDu). Also, we validated our results in a multimodal approach. MuEp and SaDu shared a common gene signature involving an overexpression of COL11A1. In contrast, nonhierarchical clustering revealed a more specific gene expression pattern for AdCy, characterized by overexpression of COL27A1. In situ studies at RNA level indicated that in AdCy, ECM production results from tumour cells and not from cancer-associated fibroblasts as is the case in MuEp and SaDu. For the first time, we characterized the ECM composition in SGC and identified several differentially expressed genes, which are potential therapeutic targets.

Abstract

The composition of the extracellular matrix (ECM) plays a pivotal role in tumour initiation, metastasis and therapy resistance. Until now, the ECM composition of salivary gland carcinomas (SGC) has not been studied. We quantitatively analysed the mRNA of 28 ECM-related genes of 34 adenoid cystic (AdCy; n = 11), mucoepidermoid (MuEp; n = 14) and salivary duct carcinomas (SaDu; n = 9). An incremental overexpression of six collagens (including COL11A1) and four glycoproteins from MuEp and SaDu suggested a common ECM alteration. Conversely, AdCy and MuEp displayed a distinct overexpression of COL27A1 and LAMB3, respectively. Nonhierarchical clustering and principal component analysis revealed a more specific pattern for AdCy with low expression of the common gene signature. In situ studies at the RNA and protein level confirmed these results and indicated that, in contrast to MuEp and SaDu, ECM production in AdCy results from tumour cells and not from cancer-associated fibroblasts (CAFs). Our findings reveal different modes of ECM production leading to common and distinct RNA signatures in SGC. Of note, an overexpression of COL27A1, as in AdCy, has not been linked to any other neoplasm so far. Here, we contribute to the dissection of the ECM composition in SGC and identified a panel of deferentially expressed genes, which could be putative targets for SGC therapy and overcoming therapeutic resistance.

1. Introduction

The extracellular matrix (ECM) is an integral part of the tumour microenvironment (TME). It is composed of collagens, glycoproteins and matricellular proteins that modulate its composition or mediate the tumour cell–matrix interaction [1,2]. All matrix proteins have recently been termed “the matrisome” [3]. This organ- and context-specific network [4] is gradually altered throughout tumour initiation [5,6,7,8], progression and metastasis [9,10] as it provides a niche for tumour cell survival [4,11]. It is considered to be mainly secreted by cancer-associated fibroblasts (CAF) but tumour cells also seem to produce ECM molecules [12,13]. High ratios of the resulting peritumoural stroma have been associated with an adverse outcome in a multitude of primaries [14]. This effect can be partially attributed to ECM-stiffening through collagen cross-linking and ECM-deposition, which leads to augmented invasive capacities [15], epithelial-to-mesenchymal transition [16] and the reduced bioavailability of antineoplastic agents [17,18]. Moreover, individual ECM components can specifically enhance cancer cell dissemination and metastasis [2]. Although transcriptomic studies have recently demonstrated that certain ECM-signatures are prognostic of patient survival in several other primaries [19,20,21,22], the ECM composition of salivary gland carcinomas (SGC) remains largely unknown [23,24,25].
SGCs are a group of rare tumours with a wide range of growth patterns. Some carcinoma entities are multiphasic and, among others, consist of luminal, squamoid or myoepithelial cells [26]. This spectrum of different tumour cell features offers a valuable opportunity to study carcinoma-induced ECM changes as a function of cellular differentiation. Mucoepidermoid carcinomas (MuEp) are considered the most prevalent SGC subtype. They have a characteristic triphasic growth pattern (mucinous, squamoid and intermediate cells) and harbour gene fusions involving the MAML2 gene [27]. Their architecture ranges from predominantly cystic (low grade) to solid (high grade) [28]. One of the histomorphological hallmarks of MuEp is a prominent fibrous stroma, which is considered a reactive change secondary to a leakage of intracystic mucus. Adenoid cystic carcinomas (AdCy) are defined as biphasic tumours with a luminal and at least a focal myoepithelial/basal differentiation. They have a well-defined genotype with a MYB-NFIB or MYBL1-NFIB translocation [29,30,31] and usually display an enigmatic cribriform or tubular growth pattern [26]. Conversely, salivary duct carcinomas (SaDu) are one of the few remaining salivary gland carcinoma subtypes without any known recurrent gene translocations [32,33]. As with other aggressive high-grade carcinomas, SaDu harbour sporadic mutations in well-recognised driver pathways [32,33] and are characterised by an overtly invasive growth and a prominent surrounding, desmoplastic stroma [34]. In contrast to the other two carcinoma types, they are monophasic. Although some SaDu exhibit a targetable androgen receptor expression [35] or ERBB2 amplification [36], there is no specific therapy for most other SGC subtypes. Hence, new therapeutic approaches are required.
For the first time, we determined the expression of 28 ECM components in AdCy, MuEp and SaDu. These three entities cover the typical histomorphological and genetic features of SGC. Our results are a first step towards an entity-specific profiling of the matrisome in SGC. Knowledge of the ECM components of SGC will be crucial to reach the future goal of effectively targeting their TME.

2. Results

2.1. Patient Characteristics

The clinicopathological features of all 34 patients are displayed in Table 1. Specifically, 11 patients with AdCy, 14 with MuEp and 9 with SaDu were enrolled in the study. Overall, 63% of all cases were resected at a tumour stage pT3 or higher. Although most AdCy and SaDu had reached pT3 (72% and 88%), only 38% of all MuEp were resected at this or a higher stage. Nodal metastases were more frequent in SaDu (89%) than in AdCy (36%) or MuEp (31%). A female predilection was observed for AdCy and MuEp, whereas most SaDu cases occurred in males. At the time of diagnosis, patients with SaDu histology were older than patients with AdCy or MuEp (63 vs. 42 and 40 years, respectively).

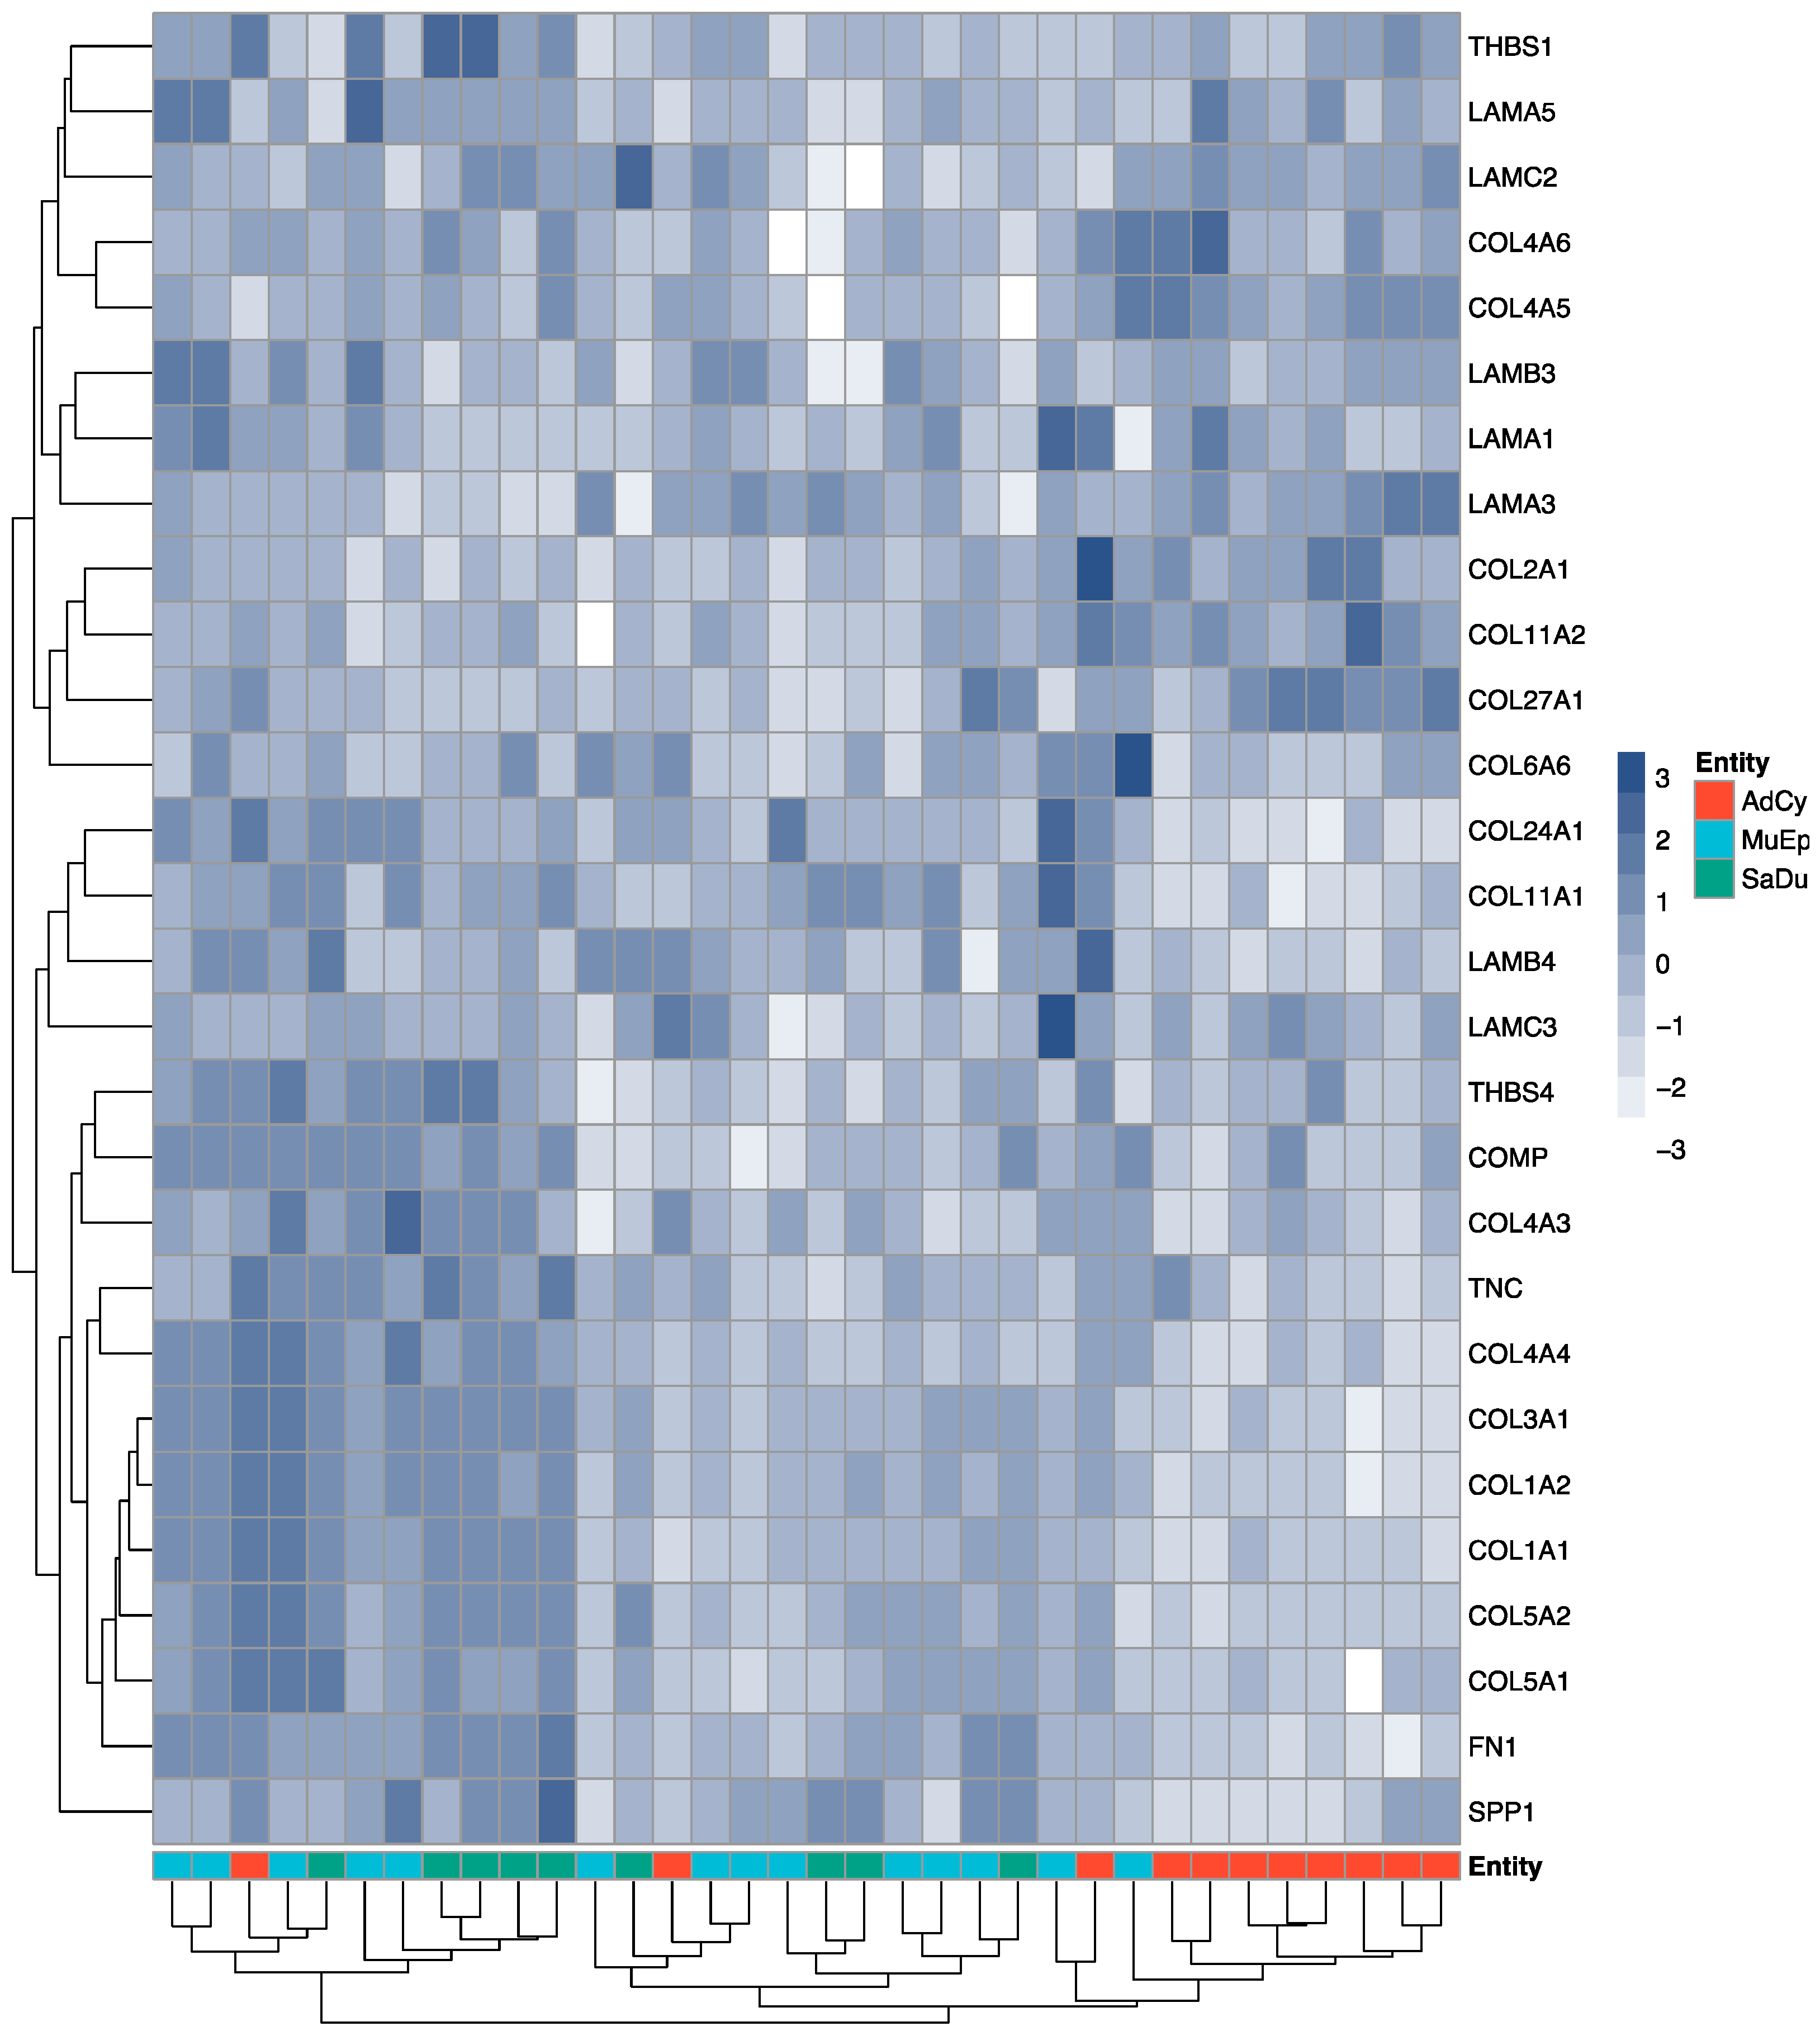
2.2. Exploratory Data Analysis Revealed a Distinct ECM Profile of Adenoid Cystic Carcinomas

For this retrospective study, we extracted the expression counts for all available collagens, laminins and other ECM-related glycoproteins from the Nanostring PanCancer gene set (n = 28). Using normalised log2-fold values (tumour/normal tissue), the gene expression patterns were plotted as a heatmap with an adjacent dendrogram (Figure 1). Unsupervised hierarchical clustering revealed a cluster, which grouped 9 out of 11 AdCy together with two other non-AdCy cases. Cases with SaDu and MuEp histology as well as the remaining AdCy were not grouped according to their histological subtype. Furthermore, the heatmap revealed an overexpression of several genes, including COL27A1 in the AdCy group, which formed a cluster.
This multidimensional dataset was further explored using principal component analysis (PCA). Principal components (PC) 1 and 2 accounted for 49.1% of the dataset’s variance. A first PCA plot was drawn to test if an age bias could have affected the expression patterns (Figure S1). All cases were split into two equally sized categories according to the date of sampling. This analysis demonstrated that both categories were largely overlapping, indicating that a different sample age did not lead to a shift in the overall gene expression. Next, we labelled all cases according to their histological diagnosis. The biplot in Figure S2 illustrates both the samples’ positions and the different genes. Here, the different histological groups were separated by PC1 with a partially overlapping expression profile and MuEp was located between SaDu and AdCy. Again, expression of COL27A1 separated AdCy from the other entities. Conversely, samples of SaDu were characterised by an expression of COL1A1, COL1A2, COL5A1, COL3A1 and FN1.

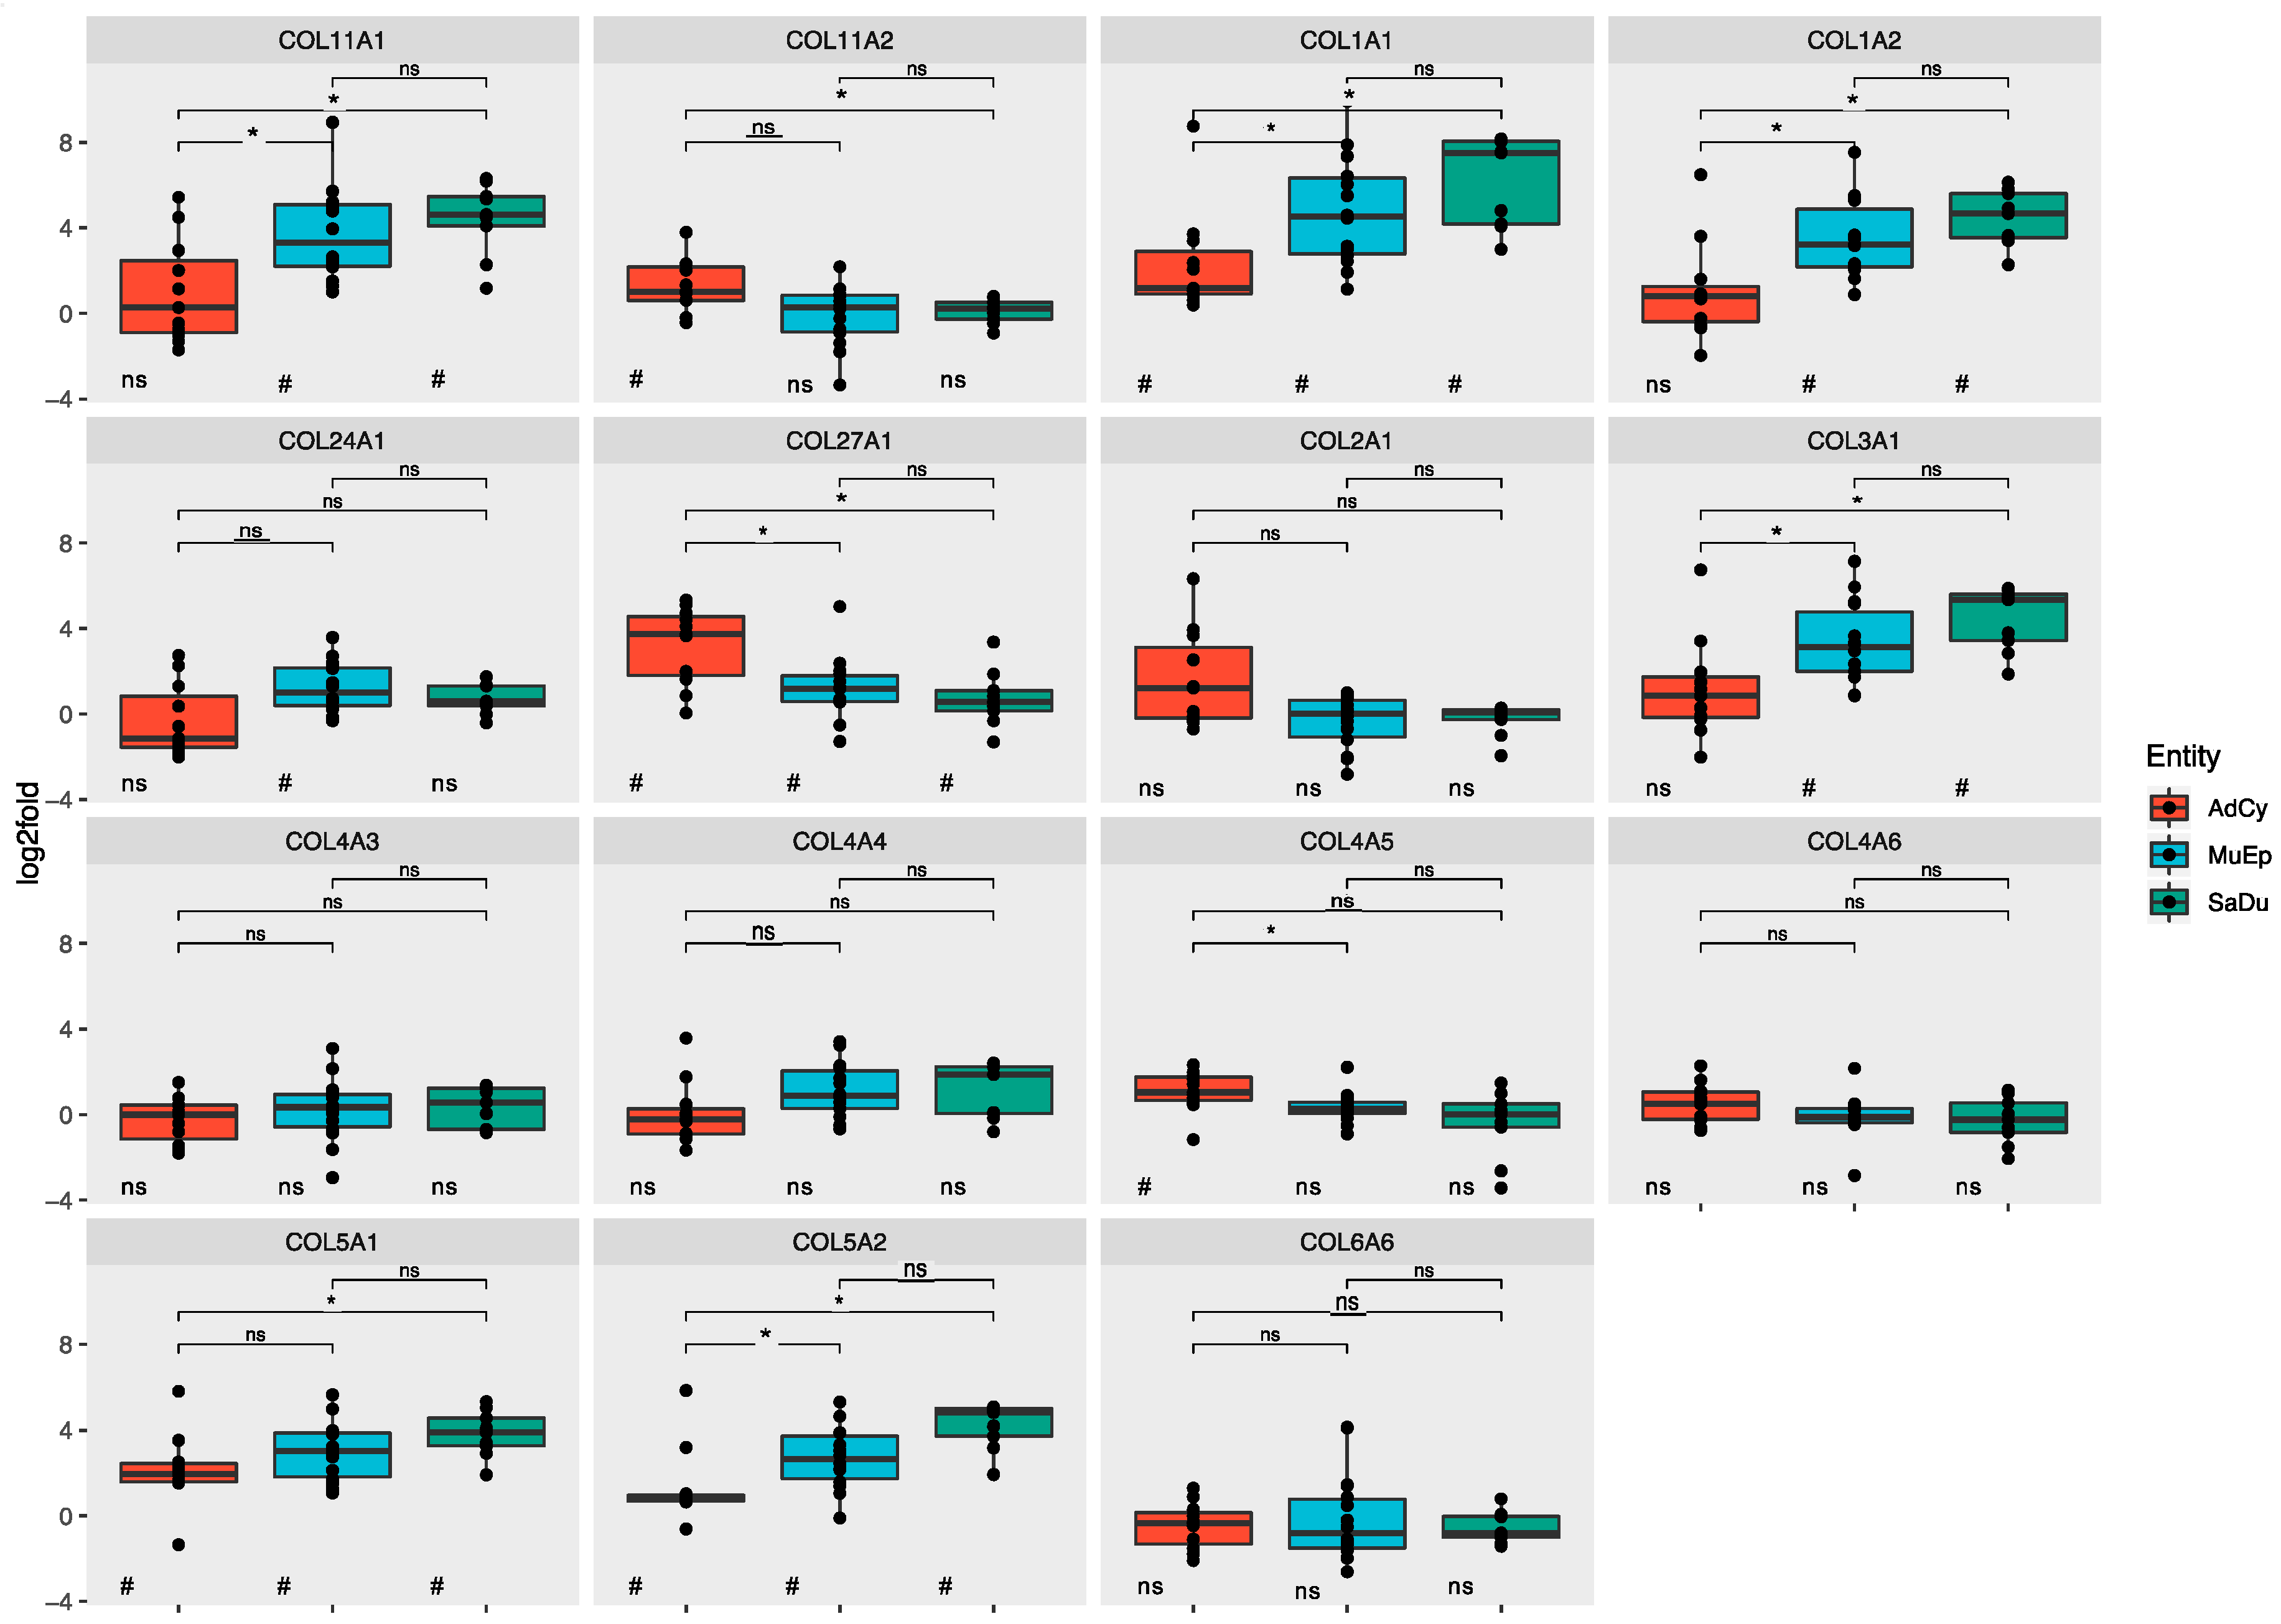
2.3. The ECM of Salivary Duct and Mucoepidermoid Carcinomas Shared a Set of Mutually Overexpressed Genes

Our approaches revealed a number of genes that separated the histological groups by RNA expression. To investigate these relationships in detail, the log2-fold values of individual genes were compared. The 10 most overexpressed genes are displayed in Table S1, whereas the p-values for all analysed genes can be observed in Table S2. Boxplots for all collagens are displayed in Figure 2, whereas laminins and other ECM-related glycoproteins are shown in Figures S3 and S4, respectively.
Six genes (COL1A1, COL27A1, COL5A1, COL5A2, COMP and LAMA5) were significantly overexpressed in all three entities. No common downregulated genes were observed.

2.3.1. Salivary Duct Carcinoma

In particular, 14 out of 28 genes (50%) were significantly overexpressed in the SaDu group compared to corresponding normal tissue (10 genes with log2-fold > 2). Precisely, 10 of these genes (36% of all genes) displayed a strikingly similar pattern of overexpression with an incremental increase from AdCy to MuEp and SaDu and at least a significant overexpression within the SaDu group. Among these, there were 6 collagens (COL11A1, COL1A1, COL1A2, COL3A1, COL5A1 and COL5A2) and 4 glycoproteins (COMP, FN1, SPP1 and TNC). In this context, significant differences between AdCy and SaDu were observed for 8 genes (COL11A1, COL1A1, COL1A2, COL3A1, COL5A1, COL5A2, FN1 and SPP1). The incremental increase was most prominent in the case of fibronectin (FN1), with significant differences between all three entities.
Conversely, LAMA1, LAMA3 and LAMC3 were significantly downregulated in the group of SaDu compared to normal tissue (log2-fold > −2). Among these genes, the expression of laminin A1 was also significantly reduced compared to AdCy and MuEp.

2.3.2. Mucoepidermoid Carcinoma

MuEp revealed an overexpression of 15 out of 28 genes (54%; 10 genes with log2-fold > 2). In particular, 9 of these genes (32%) shared the above-mentioned stepwise expression pattern, whereas only 6 genes were significantly upregulated compared to AdCy. In contrast, RNA expression of COL24A1, LAMA1 and LAMB3 was highest in MuEp.
The only significantly downregulated gene in MuEp was LAMC3 (log2-fold > −2).

2.3.3. Adenoid Cystic Carcinoma

In the AdCy group, only 11 of 28 genes (39%) were significantly overexpressed (5 genes with log2-fold > 2). Among these, only 4 genes (14%; COL1A1, COL5A1 COL5A2 and COMP) followed the above-mentioned incremental gene expression pattern shared by SaDu and MuEp. Three collagens (COL11A2, COL27A1 and COL4A5) were upregulated and showed higher values in AdCy than in the two other histological groups. In the case of COL27A1, the differences in expression between AdCy and the other two entities were statistically significant.
No genes were significantly downregulated in the AdCy group.

2.4. In Situ Validations Revealed ECM Production by Adenoid Cystic Tumour Cells

In order to validate the expression results of single relevant matrix-associated genes, we additionally performed in situ analyses (RNA and protein). This validation also allowed us to precisely determine in which cells, matrix genes (or proteins) are formed within the tumour. The in situ validations were performed for three exemplary cases of AdCy and two cases of each of MuEp and SaDu from the initial cohort. Additionally, we included 5 supplementary carcinomas of each tumour entity that were not analysed with the Nanostring method. As ECM production by tumour cells has also been reported [11,13], we used RNA in situ hybridisation (RNA-ISH) for COL11A1 and COL27A1 (Figure 3).
We chose COL11A1 as a proxy for the mutual, incremental ECM expression pattern. It is a marker for cancer-associated fibroblasts (CAFs) and a component of general ECM signatures found in many epithelial neoplasms [37,38]. In keeping with our precedent results, COL11A1 RNA-ISH stained numerous stromal cells in MuEp and SaDu. In the latter, we observed confluent RNA signals in cells compatible with CAFs (Figure 3). In contrast, we observed only few COL11A1 positive CAFs in AdCy. The expression of COL11A1 in AdCy could be almost exclusively attributed to the tumour cells (Figure 3). Fitting with the RNA-ISH results, the collagen 11A1 protein revealed a strong stromal staining in SaDu and MuEp and a very weak staining in the AdCy tumour matrix in a few cases (Figure S5).
As COL27A1 expression was significantly higher in AdCy than in the other two entities, we further investigated its RNA expression in situ. For AdCy, we noted a consistent, intense staining in >95% of tumour cells, with confluent signals in the RNA-ISH. In normal peritumoural salivary gland tissue, single signals were frequently noted in the ductal epithelium and lymphatic tissue. MuEp and SaDu both had focal areas with single signals in most tumour cells, whereas a few SaDu cases revealed a more prominent staining.
LAMB3 protein was diffusely expressed in the tumour cells of most MuEp cases. Staining of peripheral cells was noted in SaDu specimens. A few SaDu cases also revealed a diffuse staining in areas where a growth pattern with small solid tumour clusters was observed. Peripheral cells of tumour cell groups were also stained in some AdCy cases. In peritumoural salivary tissues, no staining of LAMB3 protein was detected.

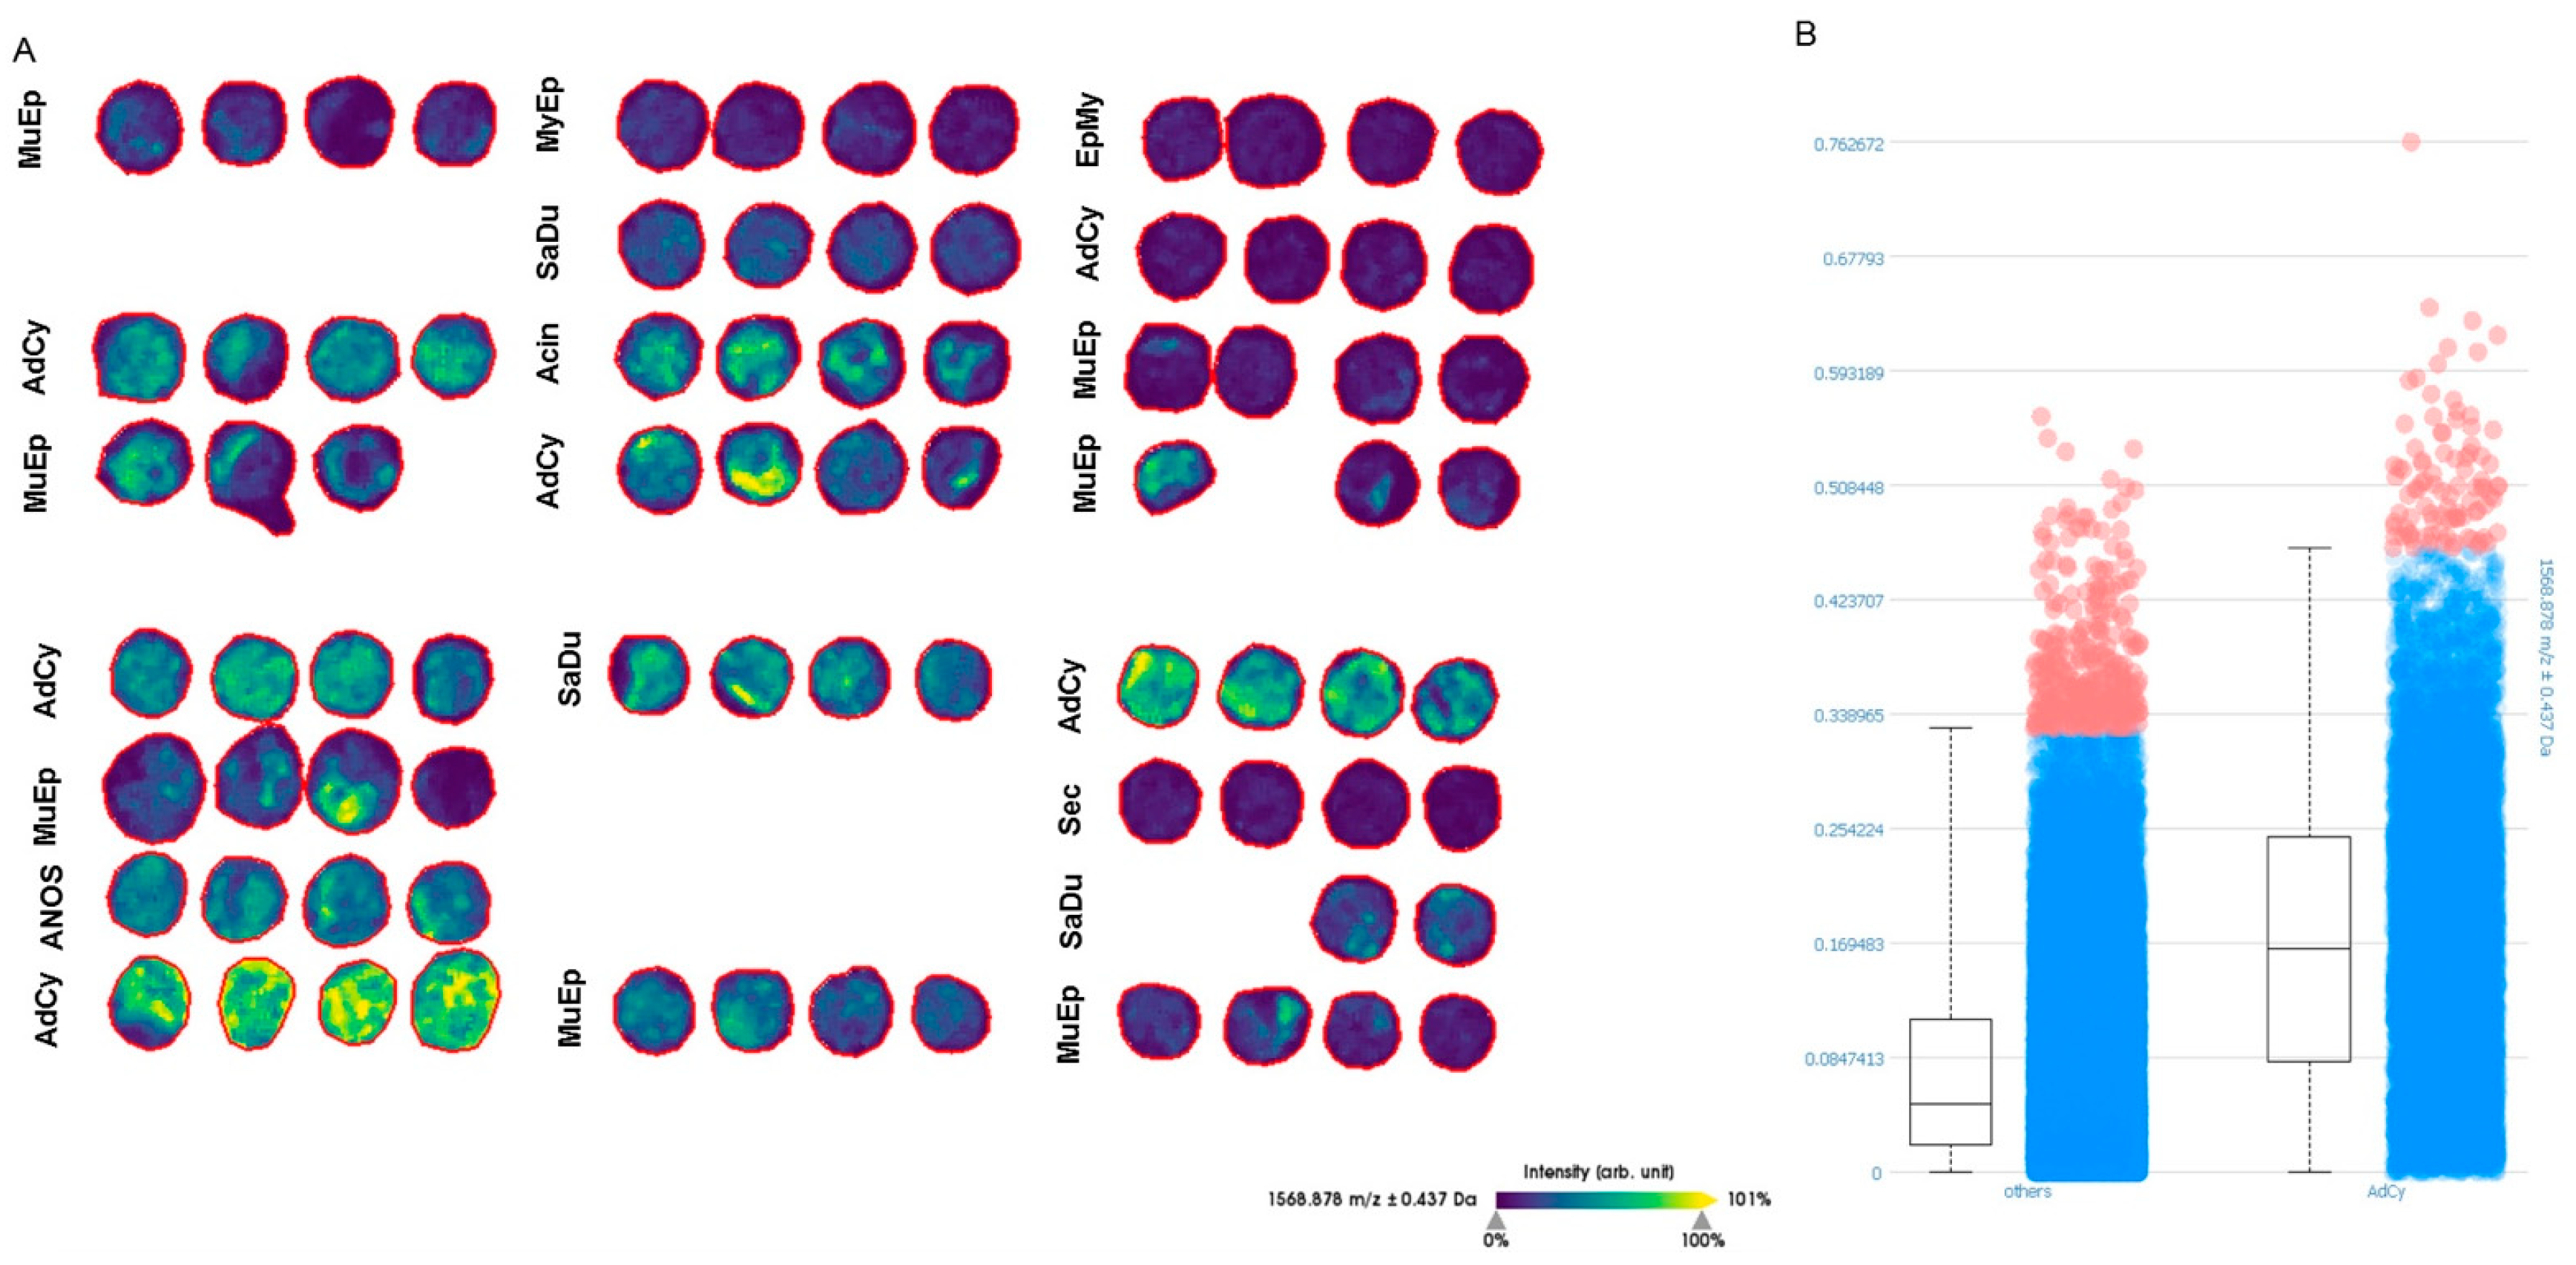
2.5. MALDI-TOF-MS-Imaging (MSI) Confirmed Specific Upregulation of COL27A1 in AdCy at the Protein Level

Our RNA-expression results demonstrated a specific upregulation of COL27A1 in AdCy. To confirm this differential expression at the protein level in an unbiased, quantitative manner, we performed MSI on two representative tissue microarray (TMA) slides that contained AdCy and various other SGC subtypes. As indicated in Figure 4, we were able to demonstrate the expression of COL27A1 protein, predominantly in AdCy. The in silico digestion of COL27A1 produced 531 peptides. Out of this list, 262 m/z values were identified in the TMA sample cohort (Table S3). These m/z values could be correlated with 88 peptides from COL27A1 due to the fact that with MALDI several adducts from the same peptide can arise (e.g., H+, Na+ and NH4+). We detected a significantly higher expression of COL27A1 in AdCy than in the other carcinoma entities (p-value < 0.001). This allowed a confident discrimination between AdCy and the other entities by COL27A1 protein detection and largely confirmed our results from the RNA expression analysis.

3. Discussion

Here, for the first time, we describe the differential matrisome of three prototypic carcinoma entities of the salivary gland. We used a panel of 28 genes, including collagens, laminins and glycoproteins, to describe mutual and exclusive features of their respective ECM. A common, desmoplastic stromal reaction, with overexpression of 10 genes (36%) was detected in SaDu and MuEp. Conversely, AdCy displayed a more distinct ECM pattern.
Incremental increase in expression from AdCy over MuEp and SaDu samples was observed for 6 out of 11 collagens and for 4 out of 6 nonlaminin glycoproteins. This upregulation in MuEp and SaDu is unlikely to correspond to specific neoplastic features as both entities bear contrasting immunohistochemical phenotypes and have profound pathogenetic differences. Hence, these genes might be part of a mutual, desmoplastic stromal reaction, which differs only quantitatively in MuEp and SaDu. Such converging changes in the ECM are observed in multiple carcinoma types. Lim et al. developed an ECM-related gene set, which had prognostic value for some of the most prevalent carcinoma types, including lung, colon and breast carcinomas. Among these, there were three genes, which also appeared in our mutually overexpressed set of 10 genes (COL11A1, SPP1 and TNC), indicating that SGC might partially share common carcinoma-induced ECM changes [19,20]
We observed abundant COL11A1+ stromal cells in SaDu samples and to a lesser extent in MuEp. Jia et al. demonstrated that COL11A1+ stromal cells in carcinomas are COL11A1+ CAFs [38]. The expression of collagen 11A1 (COL11A1) by CAFs in several carcinoma types, including breast [39], kidney [40], ovarian [41,42,43] and colon adenocarcinoma [44,45], has been associated with an adverse outcome. This might be explained by the evidence that COL11A1 promotes the invasion and migration ability of carcinoma cells and is involved in the formation of metastases [46].
As part of a positive feedback loop, deposition of ECM components leads to a stiffened matrix, resulting in decreased perfusion and tissue hypoxia [47,48]. We demonstrated that several genes which are involved in widespread desmoplastic signatures [20,38] are also overexpressed in SaDu and MuEp. Furthermore, we observed a high density of COL11A1+ CAFs along with a strong COL11A1 upregulation in these two histological groups. Thus, agents that target CAFs or modulate stromal stiffness and hypoperfusion might also be applicable for these two carcinoma types [18,49].
MuEp, which displayed a partial squamoid differentiation, revealed the highest expression of the laminin subunit B3 (LAMB3). Furthermore, we also observed an overexpression of laminin subunit C2 (LAMC2) in MuEp, as well as in AdCy. Physiologically, LAMB3 is part of the heterotrimer laminin 332 (laminins A3, B3 and C2) and plays a pivotal role in the context of cell adhesion. Among several other carcinomas, it is expressed in head and neck squamous carcinomas [50] and promotes tumour growth [51,52,53]. In addition, the overexpression of subunits of Laminin 332 has been associated with an adverse outcome in several primaries [54,55,56,57]. Interestingly, we could not detect an overexpression of LAMC2 in MuEp. To our knowledge, such an isolated overexpression of LAMC2 and LAMB3 has not been described in any carcinoma type.
Exploratory data analysis revealed that AdCy cases form a distinct cluster. The gene expression pattern which was shared by SaDu and MuEp was expressed to a much lesser extent in AdCy, and collagen 27A1 (COL27A1) was upregulated in AdCy, with significantly lower expression levels in the other salivary gland carcinomas. This notion was further supported by the complementary MSI analyses that we performed to detect collagen 27A1 protein on two representative TMA slides. COL27A1 plays a role in the development of murine and human cartilage and bone [58,59]. More recently, mutations in the COL27A1 gene have been associated with Steel syndrome, a genetic disorder leading to bone malformation [60,61]. To our knowledge, we describe for the first time an upregulation of COL27A1 in a human cancer. Future studies should address its functional role in AdCy. The abundant expression of COL27A1 RNA and protein in AdCy as well as the highly restricted physiological expression of this collagen might provide a rationale to explore COL27A1 as a potential target.
Matrix protein production by tumour cells has been noted in other primaries [12,13,62]. Recently, ECM protein expression in pancreatic ductal carcinoma cells, rather than in stromal cells, has been shown to correlate with poor prognosis [13]. Surprisingly, in case of AdCy, we hardly noticed any COL11A1+ CAFs in the TME, which is in contrast to the abundance of CAFs in the other two entities. Conversely, RNA expression of the two exemplary collagens (COl27A1 and COL11A1) was nearly restricted to tumour cells in AdCy. This might explain the very low expression of the mutual ECM pattern found in MuEp and SaDu. Furthermore, our results are in keeping with other reports of ECM production by adenoid cystic carcinoma cells [63] and myoepithelial cells in general [64]. AdCy tumour cells might be the main source for ECM proteins instead of CAFs, which marks a profound difference to the other tumour entities. Considering the complex interplay of CAFs and tumour cells, this finding emphasises that future studies should determine whether the production of targetable ECM components is attributed to stromal or tumour cells.
Several ECM components such as fibronectin (FN1) [65], tenascin C (TNC) [66], thrombospondin 1 (THBS1) [67] and osteopontin (SPP1) [68], which were highly overexpressed in our dataset, are associated with an adverse prognosis and represent potential therapeutic targets [2,65,66,67,68]. Unfortunately, many ECM-related proteins are not exclusively expressed in cancer tissues, making direct targeting difficult. On the other hand, their abundant expression in carcinomas makes them a promising tool to direct established agents to the tumour, which may decrease otherwise severe side effects [69]. FN1 was among the 10 most overexpressed genes in the group of SaDu and MuEp. Several studies have assessed the therapeutic potential of the fusion protein L19-IL2, which consists of an interleukin 2 (IL2) coupled to a monoclonal antibody directed against FN1. Promising experimental and clinical results have been reported in case of metastatic melanoma [65] and renal cell carcinoma [70]. SaDu tumours with a high tumour mutational burden and a high amount of immune infiltration might be eligible for therapy with L19-IL2 due to their high immunogenicity [34,71].
The deposition of several ECM components, such as collagens, laminin 332 and FN1, can lead to a resistance against chemotherapy [72]. A well-established concept is that a deposition and cross-linking of ECM components such as collagen 1 lead to increased matrix stiffness, which in turn reduces perfusion with antineoplastic agents. These mechanisms can be therapeutically addressed by molecules that target the renin–angiotensin system [18,73,74]. COL1A1 and COL1A2 were significantly overexpressed in MuEp and SaDu. Future studies should address a possible targeting of collagen 1 in SGC to overcome stiffness-induced chemoresistance. Another example of collagen-induced chemoresistance is the upregulation of fatty acid oxidation (FAO) through CAF-derived COL11A1, leading to cisplatin resistance [75]. As we observed a prominent upregulation of COL11A1 in MuEp and SaDu, COL11A1-induced FAO could be another future therapeutic target for SGC.
Our retrospective study has some limitations which are due to its exploratory character. First, we analysed only 28 ECM-related genes, which are included in the Nanostring PanCancer gene set. Further studies should address all genes that are part of the matrisome. Second, instead of including all different histological entities in this study, we focused on three enigmatic carcinoma types that cover the histological and genetic hallmarks of salivary gland tumours. Third, the relatively small number of cases per entity does not allow for prognostic analyses or subgrouping with regard to clinicopathological parameters. Subsequent study designs should include a larger number of cases and correlate the different ECM components with clinical outcomes. Fourth, although we included normal salivary gland tissue from each patient as a reference, we did not analyse tissue from normal controls. Thus, we cannot exclude that underlying mechanisms of the disease might have had an impact on the control tissue (e.g., germline mutations).
In summary, we revealed an overexpression of ECM components, which are associated with enhanced migratory capacities of tumour cells (TNC [76,77], FN1 [78]), resistance to chemotherapy (COL11A1 [43,75], SPP1 [79]) and adverse outcome (COL11A1 [42], TNC [80], FN1 [78]) in other primaries. The functional role of these molecules and their potential as therapeutic targets are currently under intense investigation [65,66,75,79,81,82]. Hence, as new therapeutic approaches for SGC are needed, our findings are of high translational relevance. Future studies should address the functional role of COL1A1, COL11A1, FN1, TNC, THBS1 and SPP1 in SGC to evaluate a potential clinical targeting.
We used a wide spectrum of salivary gland carcinomas to gain insights into the differential matrisome of carcinomas with varying cellular differentiation. Our findings provide a strong rationale to study the matrisome of carcinomas based on their histomorphological classification. Furthermore, our results encourage a detailed profiling of ECM components at a cellular level in situ to gain further insights into the tumour matrisome.

4. Materials and Methods

4.1. Patient Characteristics

We searched the archives of the Institute of Pathology, University of Cologne for AdCy, MuEP and SaDu resection specimens. Cases for which there was sufficient FFPE material and informed consent had been given were passed on to histopathological revision. Here, inclusion criteria were defined as follows: salivary gland carcinoma of the parotid gland; unequivocal histopathological diagnosis of either AdCy, MuEp or SaDu and sufficient FFPE material of tumour and normal tissue as defined by the manufacturer’s requirements. All histological diagnoses were reviewed by two pathologists with special expertise in the field (C.A. and A.Q.) using a panel of the following antibodies: CK7, p63, S100, androgen receptor, HER2 and NOR-1. In addition, in cases of remaining diagnostic uncertainty, only cases with either MYB/MYBL1 or MAML2 translocation, as indicated by break apart FISH, were designated as AdCy or MuEp, respectively. After this workup, all cases with an ambiguous diagnosis were strictly excluded from the study. TNM classifications were corrected according to the latest WHO classification of head and neck tumours (8th edition, 2020). All 34 SGC patients included in the study underwent primary surgery at the Department of Otorhinolaryngology, Head and Neck Surgery, University Hospital of Cologne, Germany between 1990 and 2014. The investigation was conducted according to the Declaration of Helsinki on biomedical research involving human subjects. The study was approved by the Ethics Committee of the University of Cologne (13-265).

4.2. Immunohistochemistry

Briefly, tissue slides were stained with antibodies against COL11A1 (rabbit polyclonal, 1:200, Biozol, Eching, Germany) and LAMB3 (mouse monoclonal, clone OTI2D11, 1:1000, OriGene, Rockville, MD, USA). All IHC stainings were performed using a Leica BOND-MAX stainer (Leica Biosystems, Wetzlar, Germany) in accordance with the manufacturer’s protocol. Counterstaining was carried out with haematoxylin and bluing reagent.

4.3. RNA In Situ Hybridisation (RNA-ISH)

The RNAscope assay was carried out in accordance with manufacturer’s instruction, as previously described [83]. In brief, 5 μm sections were cut from FFPE blocks, pretreated according to an extended protocol (30 min for pretreatment 2 and 3), digested and hybridised at 40 °C with human COL11A1 or COL27A1 mRNA probes (both ready to use, Advanced Cell Diagnostics, Bio-Techne, Minneapolis, MN, USA) using a Ventana Discovery system (Roche, Switzerland). Afterwards, the slides were incubated for 10 s in haematoxylin.

4.4. RNA Processing

Tumour areas with at least 70% tumour cell count as well as corresponding normal tissue were marked on H&E slides. After scraping off the respective tissue of the FFPE blocks, RNA isolation was carried out using the RNA FFPE Kit from Promega on the Maxwell® 16 LEV (Promega AS1260, Heidelberg, Germany), according to the manufacturer’s instructions. RNA concentrations were quantified by the QuantiFluor® RNA System as recommended by the supplier (Promega, E6090) and adjusted to 30 ng/µL. The nCounter Nanostring analysis was carried out with 150 ng RNA according to the manufacturer’s instructions. The PanCancer Pathways Panel (Nanostring, Seattle, WA, USA) was used following the manufacturer’s recommendations. In brief, the RNA was denatured at 85 °C, followed by incubation with both probes (reporter and capture probe) for 12 h at 65 °C. Afterwards, the barcoded hybrids were purified with the Prepstation platform and quantified using the Digital Analyzer (both Nanostring, Seattle, WA, USA).

4.5. Data Processing

Raw expression counts of tumour samples and normal tissue were imported into the nSolver 4.0 Software (Nanostring, Seattle, WA, USA) for quality control and normalisation procedures. All but one sample passed the in-build quality controls and were passed on to further processing (n = 34). Normalisation was done using the geometric mean of the CodeSet Content housekeeping genes and positive controls. The background noise threshold was set to the maximum of all negative controls. All values below a background noise threshold were floored to this value. After an extensive literature research of ECM molecules, we selected all collagens, laminins and other ECM-related glycoproteins from the PanCancer gene set for further analysis (COL11A1, COL11A2, COL1A1, COL1A2, COL24A1, COL27A1, COL2A1, COL3A1, COL4A3, COL4A4, COL4A5, COL4A6, COL5A1, COL5A2, COL6A6, LAMA1, LAMA3, LAMA5, LAMB3, LAMB4, LAMC2, LAMC3, COMP, FN1, SPP1, TNC, THBS1 and THBS4).

4.6. Statistical Analysis

The statistical analyses were performed with R Studio (version 1.2.5033, RStudio, Boston, MA, USA). First, normalised counts of all cancer samples and normal tissue probes were each pooled entity wise and tested for differential expression using Wilcoxon tests (rstatix package), and the p-values were adjusted for multiple testing with the Benjamini-Hochberg procedure (FDR < 0.05). Second, the normalised counts for cancer and normal tissue of each patient were used to build log2-fold ratios for each gene and patient. These ratios were then tested for interentity differences and visualised as boxplots (ggplot2 package). Symbols of significance levels were manually pasted in Figure 2, Figures S3 and S4 using Microsoft PowerPoint for Mac (version 16.35, Microsoft Corporation, Seattle, WA, USA). For the exploratory analyses (cluster analysis, PCA), all log2 were scaled and centred. The cluster analysis was carried out and illustrated with the hclust (stats package) and pheatmap function (pheatmap package). Clustering was performed with the “ward.d2” method, which uses Ward’s hierarchical clustering method (agglomerative hierarchical clustering). The functions prcomp (stats package) and ggbiplot (ggbiplot package) were used to carry out and visualise the PCA as biplot.

4.7. MALDI-TOF-MS-Imaging (MSI)

TMA sections were mounted on indium tin oxide (ITO)-coated glass slides. Sample preparation was performed according to previously published protocols [84]. In brief, the following steps were done: deparaffinisation, washing with xylene and ethanol, pH conditioning and antigen retrieval. For on-tissue enzyme digestion, a trypsin solution of 2 µg/µL trypsin (Promega Gold) in 50 mM AMBIC buffer and 10% ACN was used. As spraying device, the SunCollect System (SunChrom, Friedrichsdorf, Germany) was used. Digestion was performed with the SunDigest chamber (SunChrom, Friedrichsdorf, Germany) in basic mode. The matrix used for the experiments consisted of 10 mg/mL CHCA in 60% ACN and 0.2% TFA and was applied with the SunCollect.
MSI data acquisition was performed using the UltrafleXtreme mass spectrometer (Bruker Daltonik, Bremen, Germany) with the following parameters: spatial resolution of 50 µm, medium laser spot size, 200 shots, mass range from 500 to 4000 m/z and in positive ion reflector mode. The Bruker peptide standard was spotted separately on the ITO slide as external calibration. After MSI measurements, the sections were washed and stained with haematoxylin and eosin. The slides were scanned using the NanoZoomer-SQ slide scanner (Hamamatsu Photonics, Hamamatsu, Japan).
For data and imaging analysis, the SCiLS Lab software (Bruker Daltonik, Bremen, Germany), version 2020b Premium 3D, was used. All data were TIC normalised. A baseline removal algorithm convolution with peak width 20 was used. For detection of m/z values, which could be correlated to COL27A1, in silico digestion was performed using the ProteinProspector MS-Digest tool. For the database search, UniProtKB.2017.11.01 was used with Q8IZC6 as the UniProt-ID. The segmentation pipeline in SCiLS was performed with the in silico digestion m/z list. For statistical analysis, the Wilcoxon test was carried out.

4.8. Data Availability

p-values and log2-fold values for differential expression analyses are listed in Table S2. Normalised counts for all genes that were addressed in the manuscript can be accessed at https://www.ncbi.nlm.nih.gov/geo/info/linking.html (record: GSE153283). All detected peptides from MSI analyses are listed in Table S3.

5. Conclusions

The ECM of carcinomas is vital for cancer progression and therapy resistance. The heterogenic group of SGCs exhibits a diverse cellular and stromal differentiation, thus representing an ideal model to study differential ECM expression and secretion. For the first time, we depicted the ECM composition of the three most enigmatic salivary gland carcinomas in a quantitative and multidimensional manner at the RNA level. We revealed that MuEp and SaDu share a common CAF-derived stromal signature, in contrast to AdCy, which displays a distinct, tumour cell-derived ECM, possibly due to its partial myoepithelial differentiation. Our results lead to the following main conclusions: (1) The ECM of SGC is highly diverse and provides several potential therapeutic targets and (2) Although carcinomas with monophasic luminal differentiation (MuEp, SaDu) seem to share common stromal signatures with other primaries, myoepithelial differentiation, as in AdCy, might confer a distinct, tumour cell-based ECM.
Our findings contribute to the elucidation of ECM alterations in SGC, a process that will be crucial to achieve the future goal of overcoming therapy resistance. Together, we provide a rationale to address the ECM as a function of cellular differentiation.

Supplementary Materials

The following are available online at https://www.mdpi.com/2072-6694/12/9/2466/s1, Figure S1: Principal component analysis labelled according to sample age and based on log2-fold values from the RNA expression analysis; Figure S2: Principal component analysis labelled according to tumour type and based on log2-fold values from the RNA expression analysis; Figure S3: Boxplot depicting entity-wise RNA expression of all analysed laminins as log2-fold values; Figure S4: Boxplot depicting entity-wise RNA expression of all other analysed glycoproteins as log2-fold values; Figure S5: In situ staining of COL11A1 protein; Table S1: Overview of the 10 most differentially expressed genes per histological group; Table S2: Overview of p-values (tumour versus normal and interentity analysis) and log2-fold ratios (tumour versus normal) of all addressed genes and Table S3: List of all COL27A1 peptides detected with MSI.

Author Contributions

Conceptualisation, A.Q. and C.A.; methodology, C.A., A.Q., M.O., F.H., F.v.E., S.W.-R. and M.M.; software, C.A. and F.H.; validation, C.A., F.H. and A.Q.; formal analysis, C.A. and F.H.; investigation, C.A., A.Q., F.H., S.W.-R. and M.O.; resources, J.P.K., M.O., F.v.E., O.G.-L. and R.B.; data curation, J.P.K., M.O., M.M. and D.B.; writing—original draft preparation, C.A.; writing—review and editing, A.Q., J.P.K., M.M., F.H., O.G.-L., F.v.E., M.O., D.S., D.B., L.N. and R.B.; visualisation, C.A. and F.H.; supervision, A.Q.; project administration, J.P.K. and M.O.; funding acquisition, J.P.K., M.M., M.O. and D.B. All authors have read and agreed to the published version of the manuscript.

Funding

This research was supported by a grant of the Marga und Walter Boll-Stiftung to D.B. (project number: DB210-04.00-15).

Acknowledgments

We acknowledge Wiebke Jeske’s excellent technical support.

Conflicts of Interest

The authors declare no conflict of interest.

Congress Presentation

This work has been presented at the 2020 digital DGP conference (Deutsche Gesellschaft für Pathologie).

References

  1. Kessenbrock, K.; Plaks, V.; Werb, Z. Matrix Metalloproteinases: Regulators of the Tumor Microenvironment. Cell 2010, 141, 52–67. [Google Scholar] [CrossRef] [PubMed] [Green Version]
  2. Gerarduzzi, C.; Hartmann, U.; Leask, A.; Drobetsky, E. The Matrix Revolution: Matricellular Proteins and Restructuring of the Cancer Microenvironment. Cancer Res. 2020. [Google Scholar] [CrossRef] [PubMed] [Green Version]
  3. Hynes, R.O.; Naba, A. Overview of the Matrisome—An Inventory of Extracellular Matrix Constituents and Functions. Cold Spring Harb. Perspect. Biol. 2012, 4. [Google Scholar] [CrossRef] [PubMed] [Green Version]
  4. Rafaeva, M.; Erler, J.T. Framing cancer progression: Influence of the organ- and tumour-specific matrisome. FEBS J. 2020, 287, 1454–1477. [Google Scholar] [CrossRef] [PubMed] [Green Version]
  5. Toss, M.S.; Miligy, I.M.; Gorringe, K.L.; Aleskandarany, M.A.; Alkawaz, A.; Mittal, K.; Aneja, R.; Ellis, I.O.; Green, A.R.; Rakha, E.A. Collagen (XI) alpha-1 chain is an independent prognostic factor in breast ductal carcinoma in situ. Mod. Pathol. 2019, 32, 1460–1472. [Google Scholar] [CrossRef]
  6. Leppänen, J.; Bogdanoff, S.; Lehenkari, P.P.; Saarnio, J.; Kauppila, J.H.; Karttunen, T.J.; Huhta, H.; Helminen, O. Tenascin-C and fibronectin in normal esophageal mucosa, Barrett’s esophagus, dysplasia and adenocarcinoma. Oncotarget 2017, 8, 66865–66877. [Google Scholar] [CrossRef] [Green Version]
  7. DeFilippis, R.A.; Chang, H.; Dumont, N.; Rabban, J.T.; Chen, Y.-Y.; Fontenay, G.V.; Berman, H.K.; Gauthier, M.L.; Zhao, J.; Hu, D.; et al. CD36 Repression Activates a Multicellular Stromal Program Shared by High Mammographic Density and Tumor Tissues. Cancer Discov. 2012, 2, 826–839. [Google Scholar] [CrossRef] [Green Version]
  8. Fordyce, C.A.; Patten, K.T.; Fessenden, T.B.; DeFilippis, R.; Hwang, E.S.; Zhao, J.; Tlsty, T.D. Cell-extrinsic consequences of epithelial stress: Activation of protumorigenic tissue phenotypes. Breast Cancer Res. BCR 2012, 14, R155. [Google Scholar] [CrossRef] [Green Version]
  9. Feng, Y.; Sun, B.; Li, X.; Zhang, L.; Niu, Y.; Xiao, C.; Ning, L.; Fang, Z.; Wang, Y.; Zhang, L.; et al. Differentially expressed genes between primary cancer and paired lymph node metastases predict clinical outcome of node-positive breast cancer patients. Breast Cancer Res. Treat. 2007, 103, 319–329. [Google Scholar] [CrossRef]
  10. Brechbuhl, H.M.; Barrett, A.S.; Kopin, E.; Hagen, J.C.; Han, A.L.; Gillen, A.E.; Finlay-Schultz, J.; Cittelly, D.M.; Owens, P.; Horwitz, K.B.; et al. Fibroblast subtypes define a metastatic matrisome in breast cancer. JCI Insight 5 2020. [Google Scholar] [CrossRef] [Green Version]
  11. Oskarsson, T.; Acharyya, S.; Zhang, X.H.-F.; Vanharanta, S.; Tavazoie, S.F.; Morris, P.G.; Downey, R.J.; Manova-Todorova, K.; Brogi, E.; Massagué, J. Breast cancer cells produce tenascin C as a metastatic niche component to colonize the lungs. Nat. Med. 2011, 17, 867–874. [Google Scholar] [CrossRef] [PubMed] [Green Version]
  12. Naba, A.; Clauser, K.R.; Lamar, J.M.; Carr, S.A.; Hynes, R.O. Extracellular matrix signatures of human mammary carcinoma identify novel metastasis promoters. eLife 2014, 3. [Google Scholar] [CrossRef] [PubMed] [Green Version]
  13. Tian, C.; Öhlund, D.; Rickelt, S.; Lidström, T.; Huang, Y.; Hao, L.; Zhao, R.T.; Franklin, O.; Bhatia, S.N.; Tuveson, D.A.; et al. Cancer Cell–Derived Matrisome Proteins Promote Metastasis in Pancreatic Ductal Adenocarcinoma. Cancer Res. 2020, 80, 1461–1474. [Google Scholar] [CrossRef] [Green Version]
  14. Wu, J.; Liang, C.; Chen, M.; Su, W. Association between tumor-stroma ratio and prognosis in solid tumor patients: A systematic review and meta-analysis. Oncotarget 2016, 7, 68954–68965. [Google Scholar] [CrossRef] [PubMed] [Green Version]
  15. Levental, K.R.; Yu, H.; Kass, L.; Lakins, J.N.; Egeblad, M.; Erler, J.T.; Fong, S.F.T.; Csiszar, K.; Giaccia, A.; Weninger, W.; et al. Matrix crosslinking forces tumor progression by enhancing integrin signaling. Cell 2009, 139, 891–906. [Google Scholar] [CrossRef] [PubMed] [Green Version]
  16. Fiori, M.E.; Di Franco, S.; Villanova, L.; Bianca, P.; Stassi, G.; De Maria, R. Cancer-associated fibroblasts as abettors of tumor progression at the crossroads of EMT and therapy resistance. Mol. Cancer 2019, 18, 70. [Google Scholar] [CrossRef] [PubMed] [Green Version]
  17. Rice, A.J.; Cortes, E.; Lachowski, D.; Cheung, B.C.H.; Karim, S.A.; Morton, J.P.; Del Río Hernández, A. Matrix stiffness induces epithelial-mesenchymal transition and promotes chemoresistance in pancreatic cancer cells. Oncogenesis 2017, 6, e352. [Google Scholar] [CrossRef] [Green Version]
  18. Diop-Frimpong, B.; Chauhan, V.P.; Krane, S.; Boucher, Y.; Jain, R.K. Losartan inhibits collagen I synthesis and improves the distribution and efficacy of nanotherapeutics in tumors. Proc. Natl. Acad. Sci. USA 2011, 108, 2909–2914. [Google Scholar] [CrossRef] [Green Version]
  19. LIM, S.B.; TAN, S.J.; LIM, W.-T.; LIM, C.T. An extracellular matrix-related prognostic and predictive indicator for early-stage non-small cell lung cancer. Nat. Commun. 2017, 8. [Google Scholar] [CrossRef]
  20. Lim, S.B.; Chua, M.L.K.; Yeong, J.P.S.; Tan, S.J.; Lim, W.-T.; Lim, C.T. Pan-cancer analysis connects tumor matrisome to immune response. NPJ Precis. Oncol. 2019, 3. [Google Scholar] [CrossRef] [Green Version]
  21. Pearce, O.M.T.; Delaine-Smith, R.; Maniati, E.; Nichols, S.; Wang, J.; Böhm, S.; Rajeeve, V.; Ullah, D.; Chakravarty, P.; Jones, R.R.; et al. Deconstruction of a metastatic tumor microenvironment reveals a common matrix response in human cancers. Cancer Discov. 2018, 8, 304–319. [Google Scholar] [CrossRef] [PubMed] [Green Version]
  22. Yuzhalin, A.E.; Urbonas, T.; Silva, M.A.; Muschel, R.J.; Gordon-Weeks, A.N. A core matrisome gene signature predicts cancer outcome. Br. J. Cancer 2018, 118, 435–440. [Google Scholar] [CrossRef] [Green Version]
  23. Luukkaa, H.; Klemi, P.; Hirsimäki, P.; Vahlberg, T.; Kivisaari, A.; Kähäri, V.-M.; Grénman, R. Matrix metalloproteinase (MMP)-7 in salivary gland cancer. Acta Oncol. 2010, 49, 85–90. [Google Scholar] [CrossRef]
  24. Souza Freitas, V.; Dos Santos, J.N.; de Andrade Santos, P.P.; Nonaka, C.F.W.; Pereira Pinto, L.; de Souza, L.B. Expression of matrix metalloproteinases (MMPs-2, -7, -9, and -26) and tissue inhibitors of metalloproteinases (TIMPs-1 and -2) in pleomorphic adenomas and adenoid cystic carcinomas. Eur. Arch. Oto-Rhino-Laryngol. 2018, 275, 3075–3082. [Google Scholar] [CrossRef] [PubMed]
  25. Raitz, R.; Martins, M.D.; Araújo, V.C. A study of the extracellular matrix in salivary gland tumors. J. Oral Pathol. Med. 2003, 32, 290–296. [Google Scholar] [CrossRef]
  26. El-Naggar, A.K.; Chan, J.K.C.; Grandis, J.R.; Takata, T.; Slootweg, P.J. WHO Classification of Head and Neck Tumours; WHO: Geneva, Switzerland, 2017; ISBN 978-92-832-2438-9. [Google Scholar]
  27. Birkeland, A.C.; Foltin, S.K.; Michmerhuizen, N.L.; Hoesli, R.C.; Rosko, A.J.; Byrd, S.; Yanik, M.; Nor, J.E.; Bradford, C.R.; Prince, M.E.; et al. Correlation of crtc1/3-maml2 fusion status, grade and survival in mucoepidermoid carcinoma. Oral Oncol. 2017, 68, 5–8. [Google Scholar] [CrossRef] [Green Version]
  28. Seethala, R.R. An Update on Grading of Salivary Gland Carcinomas. Head Neck Pathol. 2009, 3, 69–77. [Google Scholar] [CrossRef] [Green Version]
  29. Brayer, K.J.; Frerich, C.A.; Kang, H.; Ness, S.A. Recurrent Fusions in MYB and MYBL1 Define a Common, Transcription Factor-Driven Oncogenic Pathway in Salivary Gland Adenoid Cystic Carcinoma. Cancer Discov. 2016, 6, 176. [Google Scholar] [CrossRef] [Green Version]
  30. Fujii, K.; Murase, T.; Beppu, S.; Saida, K.; Takino, H.; Masaki, A.; Ijichi, K.; Kusafuka, K.; Iida, Y.; Onitsuka, T.; et al. MYB, MYBL1, MYBL2 and NFIB gene alterations and MYC overexpression in salivary gland adenoid cystic carcinoma. Histopathology 2017, 71, 823–834. [Google Scholar] [CrossRef]
  31. Togashi, Y.; Dobashi, A.; Sakata, S.; Sato, Y.; Baba, S.; Seto, A.; Mitani, H.; Kawabata, K.; Takeuchi, K. MYB and MYBL1 in adenoid cystic carcinoma: Diversity in the mode of genomic rearrangement and transcripts. Mod. Pathol. 2018, 31, 934–946. [Google Scholar] [CrossRef]
  32. Wang, K.; Russell, J.S.; McDermott, J.D.; Elvin, J.A.; Khaira, D.; Johnson, A.; Jennings, T.A.; Ali, S.M.; Murray, M.; Marshall, C.; et al. Profiling of 149 Salivary Duct Carcinomas, Carcinoma Ex Pleomorphic Adenomas, and Adenocarcinomas, Not Otherwise Specified Reveals Actionable Genomic Alterations. Clin. Cancer Res. 2016. [Google Scholar] [CrossRef] [PubMed] [Green Version]
  33. Dalin, M.G.; Desrichard, A.; Katabi, N.; Makarov, V.; Walsh, L.A.; Lee, K.-W.; Wang, Q.; Armenia, J.; West, L.; Dogan, S.; et al. Comprehensive Molecular Characterization of Salivary Duct Carcinoma Reveals Actionable Targets and Similarity to Apocrine Breast Cancer. Clin. Cancer Res. 2016. [Google Scholar] [CrossRef] [PubMed] [Green Version]
  34. Alame, M.; Cornillot, E.; Cacheux, V.; Tosato, G.; Four, M.; Oliveira, L.D.; Gofflot, S.; Delvenne, P.; Turtoi, E.; Cabello-Aguilar, S.; et al. The molecular landscape and microenvironment of salivary duct carcinoma reveal new therapeutic opportunities. bioRxiv 2019, 810028. [Google Scholar] [CrossRef] [PubMed]
  35. Locati, L.D.; Perrone, F.; Cortelazzi, B.; Lo Vullo, S.; Bossi, P.; Dagrada, G.; Quattrone, P.; Bergamini, C.; Potepan, P.; Civelli, E.; et al. Clinical activity of androgen deprivation therapy in patients with metastatic/relapsed androgen receptor-positive salivary gland cancers. Head Neck 2016, 38, 724–731. [Google Scholar] [CrossRef]
  36. Takahashi, H.; Tada, Y.; Saotome, T.; Akazawa, K.; Ojiri, H.; Fushimi, C.; Masubuchi, T.; Matsuki, T.; Tani, K.; Osamura, R.Y.; et al. Phase II Trial of Trastuzumab and Docetaxel in Patients With Human Epidermal Growth Factor Receptor 2-Positive Salivary Duct Carcinoma. J. Clin. Oncol. 2019, 37, 125–134. [Google Scholar] [CrossRef] [PubMed]
  37. García-Pravia, C.; Galván, J.A.; Gutiérrez-Corral, N.; Solar-García, L.; García-Pérez, E.; García-Ocaña, M.; Amo-Iribarren, J.D.; Menéndez-Rodríguez, P.; García-García, J.; de los Toyos, J.R.; et al. Overexpression of COL11A1 by Cancer-Associated Fibroblasts: Clinical Relevance of a Stromal Marker in Pancreatic Cancer. PLoS ONE 2013, 8, e78327. [Google Scholar] [CrossRef]
  38. Jia, D.; Liu, Z.; Deng, N.; Tan, T.Z.; Huang, R.Y.-J.; Taylor-Harding, B.; Cheon, D.-J.; Lawrenson, K.; Wiedemeyer, W.R.; Walts, A.E.; et al. A COL11A1-correlated pan-cancer gene signature of activated fibroblasts for the prioritization of therapeutic targets. Cancer Lett. 2016, 382, 203–214. [Google Scholar] [CrossRef] [Green Version]
  39. Farmer, P.; Bonnefoi, H.; Anderle, P.; Cameron, D.; Wirapati, P.; Wirapati, P.; Becette, V.; André, S.; Piccart, M.; Campone, M.; et al. A stroma-related gene signature predicts resistance to neoadjuvant chemotherapy in breast cancer. Nat. Med. 2009, 15, 68–74. [Google Scholar] [CrossRef]
  40. Boguslawska, J.; Kedzierska, H.; Poplawski, P.; Rybicka, B.; Tanski, Z.; Piekielko-Witkowska, A. Expression of Genes Involved in Cellular Adhesion and Extracellular Matrix Remodeling Correlates with Poor Survival of Patients with Renal Cancer. J. Urol. 2016, 195, 1892–1902. [Google Scholar] [CrossRef]
  41. Cheon, D.-J.; Tong, Y.; Sim, M.-S.; Dering, J.; Berel, D.; Cui, X.; Lester, J.; Beach, J.A.; Tighiouart, M.; Walts, A.E.; et al. A collagen-remodeling gene signature regulated by TGF-β signaling is associated with metastasis and poor survival in serous ovarian cancer. Clin. Cancer Res. 2014, 20, 711–723. [Google Scholar] [CrossRef] [Green Version]
  42. Wu, Y.-H.; Chang, T.-H.; Huang, Y.-F.; Huang, H.-D.; Chou, C.-Y. COL11A1 promotes tumor progression and predicts poor clinical outcome in ovarian cancer. Oncogene 2014, 33, 3432–3440. [Google Scholar] [CrossRef] [PubMed]
  43. Wu, Y.-H.; Chang, T.-H.; Huang, Y.-F.; Chen, C.-C.; Chou, C.-Y. COL11A1 confers chemoresistance on ovarian cancer cells through the activation of Akt/c/EBPβ pathway and PDK1 stabilization. Oncotarget 2015, 6, 23748–23763. [Google Scholar] [CrossRef] [PubMed] [Green Version]
  44. Yang, H.; Wu, J.; Zhang, J.; Yang, Z.; Jin, W.; Li, Y.; Jin, L.; Yin, L.; Liu, H.; Wang, Z. Integrated bioinformatics analysis of key genes involved in progress of colon cancer. Mol. Genet. Genom. Med. 2019, 7, e00588. [Google Scholar] [CrossRef] [PubMed] [Green Version]
  45. Jiang, H.; Du, J.; Gu, J.; Jin, L.; Pu, Y.; Fei, B. A 65-gene signature for prognostic prediction in colon adenocarcinoma. Int. J. Mol. Med. 2018, 41, 2021–2027. [Google Scholar] [CrossRef] [PubMed] [Green Version]
  46. Raglow, Z.; Thomas, S.M. Tumor matrix protein collagen XIα1 in cancer. Cancer Lett. 2015, 357, 448–453. [Google Scholar] [CrossRef] [PubMed] [Green Version]
  47. Gilkes, D.M.; Semenza, G.L.; Wirtz, D. Hypoxia and the extracellular matrix: Drivers of tumour metastasis. Nat. Rev. Cancer 2014, 14, 430–439. [Google Scholar] [CrossRef] [Green Version]
  48. Spivak-Kroizman, T.R.; Hostetter, G.; Posner, R.; Aziz, M.; Hu, C.; Demeure, M.J.; Von Hoff, D.; Hingorani, S.R.; Palculict, T.B.; Izzo, J.; et al. Hypoxia triggers Hedgehog-mediated tumor stromal interactions in pancreatic cancer. Cancer Res. 2013, 73, 3235–3247. [Google Scholar] [CrossRef] [Green Version]
  49. Lampi, M.C.; Reinhart-King, C.A. Targeting extracellular matrix stiffness to attenuate disease: From molecular mechanisms to clinical trials. Sci. Transl. Med. 2018, 10. [Google Scholar] [CrossRef] [Green Version]
  50. Mizushima, H.; Miyagi, Y.; Kikkawa, Y.; Yamanaka, N.; Yasumitsu, H.; Misugi, K.; Miyazaki, K. Differential Expression of Laminin-5/Ladsin Subunits in Human Tissues and Cancer Cell Lines and Their Induction by Tumor Promoter and Growth Factors. J. Biochem. (Tokyo) 1996, 120, 1196–1202. [Google Scholar] [CrossRef]
  51. Waterman, E.A.; Sakai, N.; Nguyen, N.T.; Horst, B.A.J.; Veitch, D.P.; Dey, C.N.; Ortiz-Urda, S.; Khavari, P.A.; Marinkovich, M.P. A Laminin-Collagen Complex Drives Human Epidermal Carcinogenesis through Phosphoinositol-3-Kinase Activation. Cancer Res. 2007, 67, 4264–4270. [Google Scholar] [CrossRef] [Green Version]
  52. Yasuda, A.; Sawai, H.; Takahashi, H.; Ochi, N.; Matsuo, Y.; Funahashi, H.; Sato, M.; Okada, Y.; Takeyama, H.; Manabe, T. Stem Cell Factor/c-kit Receptor Signaling Enhances the Proliferation and Invasion of Colorectal Cancer Cells Through the PI3K/Akt Pathway. Dig. Dis. Sci. 2007, 52, 2292–2300. [Google Scholar] [CrossRef] [PubMed]
  53. Baba, Y.; Iyama, K.I.; Hirashima, K.; Nagai, Y.; Yoshida, N.; Hayashi, N.; Miyanari, N.; Baba, H. Laminin-332 promotes the invasion of oesophageal squamous cell carcinoma via PI3K activation. Br. J. Cancer 2008, 98, 974–980. [Google Scholar] [CrossRef] [PubMed] [Green Version]
  54. Carpenter, P.M.; Ziogas, A.; Markham, E.M.; Cantillep, A.S.; Yan, R.; Anton-Culver, H. Laminin 332 expression and prognosis in breast cancer. Hum. Pathol. 2018, 82, 289–296. [Google Scholar] [CrossRef] [PubMed]
  55. Chen, J.; Wang, W.; Wei, J.; Zhou, D.; Zhao, X.; Song, W.; Sun, Q.; Huang, P.; Zheng, S. Overexpression of β3 Chains of Laminin-332 is Associated With Clinicopathologic Features and Decreased Survival in Patients With Pancreatic Adenocarcinoma. Appl. Immunohistochem. Mol. Morphol. 2015, 23, 516–521. [Google Scholar] [CrossRef] [Green Version]
  56. Giannelli, G.; Fransvea, E.; Bergamini, C.; Marinosci, F.; Antonaci, S. Laminin-5 Chains Are Expressed Differentially in Metastatic and Nonmetastatic Hepatocellular Carcinoma. Clin. Cancer Res. 2003, 9, 3684–3691. [Google Scholar]
  57. Takahashi, S.; Hasebe, T.; Oda, T.; Sasaki, S.; Kinoshita, T.; Konishi, M.; Ochiai, T.; Ochiai, A. Cytoplasmic expression of laminin γ2 chain correlates with postoperative hepatic metastasis and poor prognosis in patients with pancreatic ductal adenocarcinoma. Cancer 2002, 94, 1894–1901. [Google Scholar] [CrossRef]
  58. Plumb, D.A.; Dhir, V.; Mironov, A.; Poulsom, R.; Kadler, K.E.; Thornton, D.J.; Briggs, M.D.; Boot-Handford, R.P. Collagen XXVII is developmentally-regulated and forms thin fibrillar structures distinct from those of classical vertebrate fibrillar collagens. J. Biol. Chem. 2007, 282, 12791–12795. [Google Scholar] [CrossRef] [Green Version]
  59. Hjorten, R.; Hansen, U.; Underwood, R.A.; Telfer, H.E.; Fernandes, R.J.; Krakow, D.; Sebald, E.; Wachsmann-Hogiu, S.; Bruckner, P.; Jacquet, R.; et al. Type XXVII collagen at the transition of cartilage to bone during skeletogenesis. Bone 2007, 41, 535–542. [Google Scholar] [CrossRef] [Green Version]
  60. Gariballa, N.; Ben-Mahmoud, A.; Komara, M.; Al-Shamsi, A.M.; John, A.; Ali, B.R.; Al-Gazali, L. A novel aberrant splice site mutation in COL27A1 is responsible for Steel syndrome and extension of the phenotype to include hearing loss. Am. J. Med. Genet. A 2017, 173, 1257–1263. [Google Scholar] [CrossRef]
  61. Gonzaga-Jauregui, C.; Gamble, C.N.; Yuan, B.; Penney, S.; Jhangiani, S.; Muzny, D.M.; Gibbs, R.A.; Lupski, J.R.; Hecht, J.T. Mutations in COL27A1 cause Steel syndrome and suggest a founder mutation effect in the Puerto Rican population. Eur. J. Hum. Genet. 2015, 23, 342–346. [Google Scholar] [CrossRef] [Green Version]
  62. Vargas, A.C.; McCart Reed, A.E.; Waddell, N.; Lane, A.; Reid, L.E.; Smart, C.E.; Cocciardi, S.; da Silva, L.; Song, S.; Chenevix-Trench, G.; et al. Gene expression profiling of tumour epithelial and stromal compartments during breast cancer progression. Breast Cancer Res. Treat. 2012, 135, 153–165. [Google Scholar] [CrossRef] [PubMed] [Green Version]
  63. Shirasuna, K.; Saka, M.; Hayashido, Y.; Yoshioka, H.; Sugiura, T.; Matsuya, T. Extracellular Matrix Production and Degradation by Adenoid Cystic Carcinoma Cells: Participation of Plasminogen Activator and Its Inhibitor in Matrix Degradation. Cancer Res. 1993, 53, 147–152. [Google Scholar] [PubMed]
  64. Sternlicht, M.D.; Safarians, S.; Rivera, S.P.; Barsky, S.H. Characterizations of the extracellular matrix and proteinase inhibitor content of human myoepithelial tumors. Lab. Investig. J. Tech. Methods Pathol. 1996, 74, 781–796. [Google Scholar]
  65. Weide, B.; Eigentler, T.; Catania, C.; Ascierto, P.A.; Cascinu, S.; Becker, J.C.; Hauschild, A.; Romanini, A.; Danielli, R.; Dummer, R.; et al. A phase II study of the L19IL2 immunocytokine in combination with dacarbazine in advanced metastatic melanoma patients. Cancer Immunol. Immunother. CII 2019, 68, 1547–1559. [Google Scholar] [CrossRef] [PubMed]
  66. Lingasamy, P.; Tobi, A.; Kurm, K.; Kopanchuk, S.; Sudakov, A.; Salumäe, M.; Rätsep, T.; Asser, T.; Bjerkvig, R.; Teesalu, T. Tumor-penetrating peptide for systemic targeting of Tenascin-C. Sci. Rep. 2020, 10, 5809. [Google Scholar] [CrossRef] [PubMed] [Green Version]
  67. Daubon, T.; Léon, C.; Clarke, K.; Andrique, L.; Salabert, L.; Darbo, E.; Pineau, R.; Guérit, S.; Maitre, M.; Dedieu, S.; et al. Deciphering the complex role of thrombospondin-1 in glioblastoma development. Nat. Commun. 2019, 10, 1146. [Google Scholar] [CrossRef] [Green Version]
  68. Wei, R.; Wong, J.P.C.; Kwok, H.F. Osteopontin—a promising biomarker for cancer therapy. J. Cancer 2017, 8, 2173–2183. [Google Scholar] [CrossRef] [Green Version]
  69. Liu, T.; Zhou, L.; Li, D.; Andl, T.; Zhang, Y. Cancer-Associated Fibroblasts Build and Secure the Tumor Microenvironment. Front. Cell Dev. Biol. 2019, 7, 60. [Google Scholar] [CrossRef] [Green Version]
  70. Johannsen, M.; Spitaleri, G.; Curigliano, G.; Roigas, J.; Weikert, S.; Kempkensteffen, C.; Roemer, A.; Kloeters, C.; Rogalla, P.; Pecher, G.; et al. The tumour-targeting human L19-IL2 immunocytokine: Preclinical safety studies, phase I clinical trial in patients with solid tumours and expansion into patients with advanced renal cell carcinoma. Eur. J. Cancer 2010, 46, 2926–2935. [Google Scholar] [CrossRef]
  71. Ross, J.S.; Gay, L.M.; Wang, K.; Vergilio, J.-A.; Suh, J.; Ramkissoon, S.; Somerset, H.; Johnson, J.M.; Russell, J.; Ali, S.; et al. Comprehensive genomic profiles of metastatic and relapsed salivary gland carcinomas are associated with tumor type and reveal new routes to targeted therapies. Ann. Oncol. 2017, 28, 2539–2546. [Google Scholar] [CrossRef]
  72. Senthebane, D.A.; Rowe, A.; Thomford, N.E.; Shipanga, H.; Munro, D.; Al Mazeedi, M.A.M.; Almazyadi, H.A.M.; Kallmeyer, K.; Dandara, C.; Pepper, M.S.; et al. The Role of Tumor Microenvironment in Chemoresistance: To Survive, Keep Your Enemies Closer. Int. J. Mol. Sci. 2017, 18, 1586. [Google Scholar] [CrossRef] [PubMed]
  73. Murphy, J.E.; Wo, J.Y.; Ryan, D.P.; Clark, J.W.; Jiang, W.; Yeap, B.Y.; Drapek, L.C.; Ly, L.; Baglini, C.V.; Blaszkowsky, L.S.; et al. Total Neoadjuvant Therapy With FOLFIRINOX in Combination With Losartan Followed by Chemoradiotherapy for Locally Advanced Pancreatic Cancer: A Phase 2 Clinical Trial. JAMA Oncol. 2019, 5, 1020–1027. [Google Scholar] [CrossRef] [PubMed]
  74. Shen, Y.; Wang, X.; Lu, J.; Salfenmoser, M.; Wirsik, N.M.; Schleussner, N.; Imle, A.; Valls, A.F.; Radhakrishnan, P.; Liang, J.; et al. Reduction of Liver Metastasis Stiffness Improves Response to Bevacizumab in Metastatic Colorectal Cancer. Cancer Cell 2020, 37, 800–817.e7. [Google Scholar] [CrossRef] [PubMed]
  75. Nallanthighal, S.; Rada, M.; Heiserman, J.P.; Cha, J.; Sage, J.; Zhou, B.; Yang, W.; Hu, Y.; Korgaonkar, C.; Hanos, C.T.; et al. Inhibition of collagen XI alpha 1-induced fatty acid oxidation triggers apoptotic cell death in cisplatin-resistant ovarian cancer. Cell Death Dis. 2020, 11. [Google Scholar] [CrossRef] [PubMed] [Green Version]
  76. Midwood, K.S.; Chiquet, M.; Tucker, R.P.; Orend, G. Tenascin-C at a glance. J. Cell Sci. 2016, 129, 4321–4327. [Google Scholar] [CrossRef] [Green Version]
  77. Sun, Z.; Velázquez-Quesada, I.; Murdamoothoo, D.; Ahowesso, C.; Yilmaz, A.; Spenlé, C.; Averous, G.; Erne, W.; Oberndorfer, F.; Oszwald, A.; et al. Tenascin-C increases lung metastasis by impacting blood vessel invasions. Matrix Biol. J. Int. Soc. Matrix Biol. 2019, 83, 26–47. [Google Scholar] [CrossRef]
  78. Gopal, S.; Veracini, L.; Grall, D.; Butori, C.; Schaub, S.; Audebert, S.; Camoin, L.; Baudelet, E.; Radwanska, A.; Beghelli-de la Forest Divonne, S.; et al. Fibronectin-guided migration of carcinoma collectives. Nat. Commun. 2017, 8, 14105. [Google Scholar] [CrossRef]
  79. Zhao, H.; Chen, Q.; Alam, A.; Cui, J.; Suen, K.C.; Soo, A.P.; Eguchi, S.; Gu, J.; Ma, D. The role of osteopontin in the progression of solid organ tumour. Cell Death Dis. 2018, 9, 1–15. [Google Scholar] [CrossRef]
  80. Yang, Z.; Zhang, C.; Feng, Y.; Quan, M.; Cui, Y.; Xuan, Y. Tenascin-C predicts poor outcomes for patients with colorectal cancer and drives cancer stemness via Hedgehog signaling pathway. Cancer Cell Int. 2020, 20, 122. [Google Scholar] [CrossRef] [Green Version]
  81. Gong, Z.; Chen, M.; Ren, Q.; Yue, X.; Dai, Z. Fibronectin-targeted dual-acting micelles for combination therapy of metastatic breast cancer. Signal Transduct. Target. Ther. 2020, 5, 1–11. [Google Scholar] [CrossRef]
  82. Henke, E.; Nandigama, R.; Ergün, S. Extracellular Matrix in the Tumor Microenvironment and Its Impact on Cancer Therapy. Front. Mol. Biosci. 2020, 6. [Google Scholar] [CrossRef] [PubMed] [Green Version]
  83. Wang, F.; Flanagan, J.; Su, N.; Wang, L.-C.; Bui, S.; Nielson, A.; Wu, X.; Vo, H.-T.; Ma, X.-J.; Luo, Y. RNAscope. J. Mol. Diagn. JMD 2012, 14, 22–29. [Google Scholar] [CrossRef] [PubMed] [Green Version]
  84. Hoffmann, F.; Umbreit, C.; Krüger, T.; Pelzel, D.; Ernst, G.; Kniemeyer, O.; Guntinas-Lichius, O.; Berndt, A.; von Eggeling, F. Identification of Proteomic Markers in Head and Neck Cancer Using MALDI-MS Imaging, LC-MS/MS, and Immunohistochemistry. Proteom. Clin. Appl. 2019, 13, e1700173. [Google Scholar] [CrossRef] [PubMed] [Green Version]
Figure 1. Gene expression heatmap. RNA expression log2-fold values for each patient (x-axis) and each gene (y-axis) are displayed from +3 (dark blue) to −3 (white). At the bottom row, the respective histologic groups are shown. Hierarchical clustering of samples and genes (dendrogram) was performed using Ward’s method. AdCy: adenoid cystic carcinoma; MuEp: mucoepidermoid carcinoma; SaDu: salivary duct carcinoma.
Cancers 12 02466 g001
Figure 2. Boxplot depicting entity-wise RNA expression of all analysed collagens s log2 fold values. Individual cases are displayed as points. Significant differences for comparisons between two individual histologic groups are given as asterisks above the boxplots (adjusted p-values; *: p < 0.05; ns: not significant). Significance levels for comparisons between tumour and normal tissue are given as number symbols below the boxplots (adjusted p-values; #: p < 0.05; ##: p < 0.01; ###: p < 0.001; ns: not significant). AdCy: adenoid cystic carcinoma; MuEp: mucoepidermoid carcinoma; SaDu: salivary duct carcinoma.
Cancers 12 02466 g002
Figure 3. In situ validation of selected extracellular matrix (ECM) gene expressions by in situ hybridisation (ISH) and immunohistochemistry (IHC). Crosstab demonstrating the expression of COL11A1 RNA (top row), COL27A1 RNA (middle row) and laminin subunit B3 (LAMB3) protein (bottom row) for salivary duct, mucoepidermoid and adenoid cystic carcinoma (columns, from left to right); magnification: 100× (inset 200×).
Cancers 12 02466 g003
Figure 4. Distribution of one COL27A1 peptide in representative tissue microarray (TMA) sections. (A) Colour-coded intensity map of 1586.878 m/z measured with MALDI MS-imaging (MSI), corresponding to m/z 1545.8166 [M+ Na+] with the peptide sequence (K)MDRGDGLKTGVQLR(K) and two trypsin miss cleavages from in silico digestion. In five out of six patients with AdCy, an expression of COL27A1 peptide was detected. (B) Intensity box plot comparing the intensity of the m/z value of AdCy and all other carcinoma entities. Wilcoxon rank-sum corrected p-value < 0.001. AdCy: adenoid cystic carcinoma; MuEp: mucoepidermoid carcinoma; SaDu: salivary duct carcinoma; MyEp: myoepithelial carcinoma; EpMy: epithelial-myoepithelial carcinoma; Acin: acinic cell carcinoma; Sec: secretory carcinoma, ANOS: adenocarcinoma not-otherwise-specified.
Cancers 12 02466 g004
Table 1. Overview of all included samples organised by histologic group. Percentages per entity are given in brackets.
Clinicopathological Parameter AdCy (n = 11)MuEp (n = 14)SaDu (n = 9)Total (n = 34)
Grade
11 (9)8 (57)5 (56)14 (41)
25 (46)2 (14)4 (44)11 (32)
33 (27)4 (29)0 (0)7 (21)
NA2 (18)0 (0)0 (0)2 (6)
pT
12 (18)2 (15)0 (0)4 (12)
21 (9)6 (46)1 (11)8 (24)
32 (18)2 (15)4 (44)8 (24)
4a3 (27)1 (8)3 (33)7 (21)
4b1 (9)2 (15)1 (11)4 (12)
NA2 (18)0 (0)0 (0)2 (6)
pN
06 (55)9 (69)1 (11)16 (49)
13 (27)0 (0)1 (11)4 (12)
21 (9)4 (31)7 (78)12 (36)
NA1 (9)0 (0)0 (0)1 (3)
L
L07 (70)9 (82)6 (67)22 (73)
L10 (0)2 (18)3 (33)5 (17)
NA3 (30)0 (0)0 (0)3 (10)
V
V07 (70)8 (73)8 (89)23 (77)
V10 (0)3 (27)1 (11)4 (13)
NA3 (30)0 (0)0 (0)3 (10)
Pn
Pn05 (46)6 (50)4 (44)15 (47)
Pn13 (27)6 (50)5 (56)14 (44)
NA3 (27)0 (0)0 (0)3 (9)
Sex
f8 (73)10 (71)4 (44)22 (65)
m3 (27)4 (29)5 (56)12 (35)
Age, years
Median (range) 42 (30–73)40 (16–68)63 (37–78)46 (16–78)
AdCy: adenoid cystic carcinoma; MuEp: mucoepidermoid carcinoma; SaDu: salivary duct carcinoma; NA: information not available; L: lymphatic invasion; V: vascular invasion; Pn: perineural invasion; f: female; m: male.

