Article

FANCD2 Confers a Malignant Phenotype in Esophageal Squamous Cell Carcinoma by Regulating Cell Cycle Progression

Department of Clinical Oncology, University of Hong Kong, Hong Kong (SAR), China
*
Author to whom correspondence should be addressed.
Cancers 2020, 12(9), 2545; https://doi.org/10.3390/cancers12092545
Submission received: 17 July 2020 / Revised: 30 August 2020 / Accepted: 31 August 2020 / Published: 7 September 2020

Abstract

:

Simple Summary

Fanconi anemia patients with germline FANCD2 defects are susceptible to cancers. In order to understand FANCD2 function in esophageal cancers, we used cell line, animal model, and sequencing approaches. We knocked out the FANCD2 gene and examined the functional impact of its loss on tumor growth and metastasis and performed assays for cell growth, cell cycle, and cellular localization. FANCD2 promotes tumorigenesis in this cancer. FANCD2 is significantly upregulated in tumors. Depletion of FANCD2 protein expression significantly suppresses the cancer cell proliferation and tumor colony formation and metastasis potential, as well as cell cycle progression, by involving specific cell signaling pathways. FANCD2 is moved out of the nucleus to the cytoplasm during cell cycle progression. We provide evidence of a novel role of FANCD2 in esophageal cancer progression and its potential value as a biomarker for disease management.

Abstract

Fanconi anemia patients with germline genetic defects in FANCD2 are highly susceptible to cancers. Esophageal squamous cell carcinoma (ESCC) is a deadly cancer. Little is known about the function of FANCD2 in ESCC. For detailed molecular and mechanistic insights on the functional role of FANCD2 in ESCC, in vivo and in vitro assays and RNA sequencing approaches were used. Utilizing Clustered Regularly Interspaced Short Palindromic Repeat (CRISPR) technology, FANCD2 knockout models were established to examine the functional impact in mouse models for tumor growth and metastasis and in vitro assays for cell growth, cell cycle, and cellular localization. Our RNA sequence analyses were integrated with public datasets. FANCD2 confers a malignant phenotype in ESCC. FANCD2 is significantly upregulated in ESCC tumors, as compared to normal counterparts. Depletion of FANCD2 protein expression significantly suppresses the cancer cell proliferation and tumor colony formation and metastasis potential, as well as cell cycle progression, by involving cyclin-CDK and ATR/ATM signaling. FANCD2 translocates from the nucleus to the cytoplasm during cell cycle progression. We provide evidence of a novel role of FANCD2 in ESCC tumor progression and its potential usefulness as a biomarker for ESCC disease management.

1. Introduction

Esophageal carcinoma (EC) ranks seventh in terms of incidence and was the sixth most lethal cancer worldwide in 2018 [1]. Esophageal squamous cell carcinoma (ESCC) arises from epithelial cells and is the major histologic form, comprising 60–70%, of all EC cases [2], while EC adenocarcinomas are the second major histological subtype. Despite the poor prognosis of ESCC, little is known about the drivers and targets for molecular therapy of this deadly cancer.
Fanconi anemia complementation group D2 (FANCD2) encodes a protein required for the Fanconi anemia (FA) pathway, which is mono-ubiquitinated in response to DNA damage and essential for repairing DNA inter-strand crosslinks (ICLs). FANCD2 deficiency in mice confers cancer susceptibility for acute myeloid leukemia and squamous cell carcinomas [3,4]. Published targeted next-generation sequencing (NGS) analyses show that germline FANCD2 variants are associated with breast cancer [5,6] and head and neck squamous cell carcinoma (HNSCC) susceptibility [7]. These results suggest that germline FANCD2 mutations increase cancer susceptibility. However, less is known about the wild-type (WT) FANCD2 functional role in tumorigenesis. Overexpression of FANCD2 is positively associated with tumor size and poor prognosis in breast cancer [8,9,10], ovarian cancer [11,12], nasopharyngeal carcinoma [13], glioblastoma [14], and endometrial carcinoma [15]. Little is known about its function in ESCC.
The aim of the current study is to evaluate the functional impact of FANCD2 protein expression in ESCC development using in vivo and in vitro functional assays, as well as to identify putative mechanisms. We examined the RNA expression of FANCD2 in normal/ESCC paired tissue samples and found that FANCD2 is significantly upregulated in tumors as compared to normal tissues. Consistently, FANCD2 protein is also overexpressed in ESCC cell lines. We demonstrated that FANCD2 plays roles in ESCC development by regulating cell cycle progression. FANCD2 promotes cell cycle progression by modulating cyclin proteins and checkpoint proteins, independent of its role in DNA damage repair. FANCD2 localizes to and is only mono-ubiquitinated in the nucleus. These results suggest that FANCD2 confers a malignant phenotype in ESCC and may serve as a biomarker for ESCC therapeutics.

2. Materials and Methods

2.1. Clinical Specimens

Four pairs of ESCC patient tissues were collected from Queen Mary Hospital between 2001 and 2003, as previously reported [16]. Approval for this study was obtained from the Hospital Institutional Review Board at the University of Hong Kong (IRB UW-14-457).

2.2. RNA Sequence Analysis

We sequenced the RNA of four pairs of patient tissues using the Illumina HiSeq 2000 (2 × 100 bp paired reads). Three sets of public RNA sequencing (RNA-seq) data (SRP007169, SRP008496, SRP064894) were downloaded from the SRA database. All RNA-seq reads were aligned to reference genome hg19 using TopHat (version 2.0.14, bowtie version 2.2.4) [17]. The gene expression levels were calculated using Cufflinks (version 2.2.1) [18].

2.3. Cell Lines

An immortalized human esophageal epithelial cell line NE1 (Research resource identifier: CVCL_E306) and ESCC cell lines including KYSE30 (CVCL_1351), KYSE150 (CVCL_1348), and KYSE450 (CVCL_1353) were cultured as previously described [19]. KYSE30TSI was derived from a subcutaneous tumor established with KYSE30 [19]. KYSE150Luc is the KYSE150 labeled with firefly luciferase [20]. Cell line authentication by STR DNA profiling and mycoplasma test by PCR amplification of mycoplasma DNA were performed for all cell lines used.

2.4. Plasmids and Lentivirus Preparation and Infection

Clustered Regularly Interspaced Short Palindromic Repeat (CRISPR) systems were used with FANCD2-targeted sgRNA (sequence: AGAAGCTCTTTCAGACCCTG) to generate FANCD2 knockout (KO) cell lines [11]. Non-targeting sgRNA (sequence: GTTCCGCGTTACATAACTTA) was used as a negative control [12]. The Renilla luciferase-POLIRES-Firefly luciferase cassette was cloned into pLVXEF1a [11]. Lentivirus preparation and infection were performed as described [19].

2.5. Western Blot Analysis

Cell protein lysates were electrophoresed on 4% SDS-PAGE gels for FANCD2 analysis and 12% SDS-PAGE gels for cell-cycle markers. Proteins were transferred to PVDF membrane, blocked, and incubated with primary antibodies as previously described [19]. Table 1 summarizes detailed information for the antibodies used against FANCD2, nuclear matrix protein p84, and all antibodies for cell cycle analysis from cyclin antibody sampler kit (#9869, Cell Signaling, MA, USA) and cell cycle regulation antibody sampler kit (#9932, Cell Signaling).

2.6. In Vivo Tumorigenicity Assay

Twelve female BALB/c athymic nude mice (6–8 weeks old) per group were used in subcutaneous injections and 16 mice per group were used in tail-vein injections. Subcutaneous injection was performed as previously described [19], with 1.25 × 10⁶ cells/site for KYSE30TSI, 2 × 10⁶ cells/site for KYSE150, and 5 × 10⁶ cells/site for KYSE450. Tail-vein injection was performed with 1 × 10⁶ of KYSE150Luc cells per mouse.
Mice were monitored for lung metastasis at 3, 4 and 5 weeks after tail-vein injection by bioluminescence live animal imaging using the PE IVIS Spectrum Image System (PerkinElmer, Waltham, MA, USA). Mice were anesthetized with fluanisone/fentanyl during imaging. Images were captured 15 min after mouse intraperitoneal injection of D-Luciferin potassium salt (Synchem, Felsberg-Altenburg, Germany) at 150 mg/kg.
For the survival study, mice were sacrificed when weights decreased to 16.0 g. All experimentation in the animals was performed in compliance with the protocols approved by the Committee on the Use of Live Animals in Teaching and Research of the University of Hong Kong (CULATR #3631-15).

2.7. MTT Assay

Cells were plated at a concentration of 2 × 10³ cells per well in 96-well plates for cell proliferation assays. The proliferation and viability of cells were determined by the 3-(4,5-dimethylthiazol-2-yl)-2,5-diphenyltetrazolium bromide (MTT) assay as previously described [9].

2.8. Colony Formation Assay

Cells were seeded in 6-well plates at a density of 2000 cells/well. After two-week culture, cells were fixed in 4% paraformaldehyde followed by 1 × Giemsa stain (Sigma Aldrich, St Louis, MO, USA). Excess Giemsa was removed by running water. Images were captured and cell colonies were counted using the Gel Doc XR system (Bio-Rad Laboratories, Hercules, CA, USA).

2.9. Synchronization and Flow Cytometry Analysis

For synchronization in G1/S phase, cells were seeded in 100 mm plates to reach ~10–20% confluence and treated with thymidine as previous published [13]. After release from blocks, cells were harvested by trypsinization and fixed in 70% (v/v) ethanol at 4 °C overnight. The fixed cells were rinsed with PBS and incubated in PBS containing 50 µg/mL propidium iodide (PI) and 0.1 mg/mL RNase A for 30 min at 37 °C in the dark. Cells were immediately analyzed on a BD FACSCantoII flow cytometer (Becton Dickinson, Franklin Lakes, NJ, USA). The cell cycle graph was analyzed using the Flowjo software (Becton Dickinson; version 10.6.2; https://www.flowjo.com/solutions/flowjo).

2.10. In Vitro Chemotherapy Treatment

Cells were seeded in 6-well plates at 2 × 10⁵ per well and treated with culture medium containing 2 µM cisplatin (Sigma Aldrich). Protein expression levels were assessed using Western blotting analysis after 24-h incubation.
Cells were seeded in 96-well plates at 6000 per well in culture medium containing cisplatin (0, 2.5, 5, 10, 20 µM) or mitomycin C (MMC; 0, 0.625, 1.25, 2.5, 5 µM; Sigma). Cisplatin/MMC sensitivity was assessed using the MTT assay after 72-h incubation.

2.11. Subcellular Fractionation

Subcellular fractionation was performed using the Subcellular Protein Fractionation Kit for Cultured Cells (Thermo Fisher Scientific, Buffalo, NY, USA) according to manufacturer’s protocol.

2.12. Statistical Analysis

Data are presented as the mean ± SD. Two-sided Student t test was applied unless indicated otherwise. The results were considered as statistically significant when the p value was less than 0.05.

3. Results

3.1. Upregulation of FANCD2 Gene Expression in ESCC Tissues and Cell Lines

To determine the clinical significance of FANCD2 in ESCC, FANCD2 expression was examined in paired ESCC tumor and adjacent normal tissues by RNA-seq. FANCD2 expression was upregulated in all four pairs of ESCC tumors as compared to adjacent normal esophageal epithelial tissues from our transcriptomic profiling analysis. In addition, FANCD2 upregulation was also observed in three public datasets. The combination of all data together showed a significant upregulation of FANCD2 RNA expression in ESCC tumor tissues (p = 0.01) (Figure 1a).
Consistently, FANCD2 protein expression was upregulated (>3-fold) in three ESCC cell lines (KYSE30TSI, KYSE150 and KYSE450) compared with the non-tumorigenic immortalized esophageal epithelial cell line NE1, as shown by Western blotting (Figure 1b and Figure S1). These data collectively are consistent with a role of FANCD2 conferring a malignant phenotype in ESCC development.

3.2. Depletion of FANCD2 Protein Expression Inhibits In Vivo Tumor Growth and Metastasis

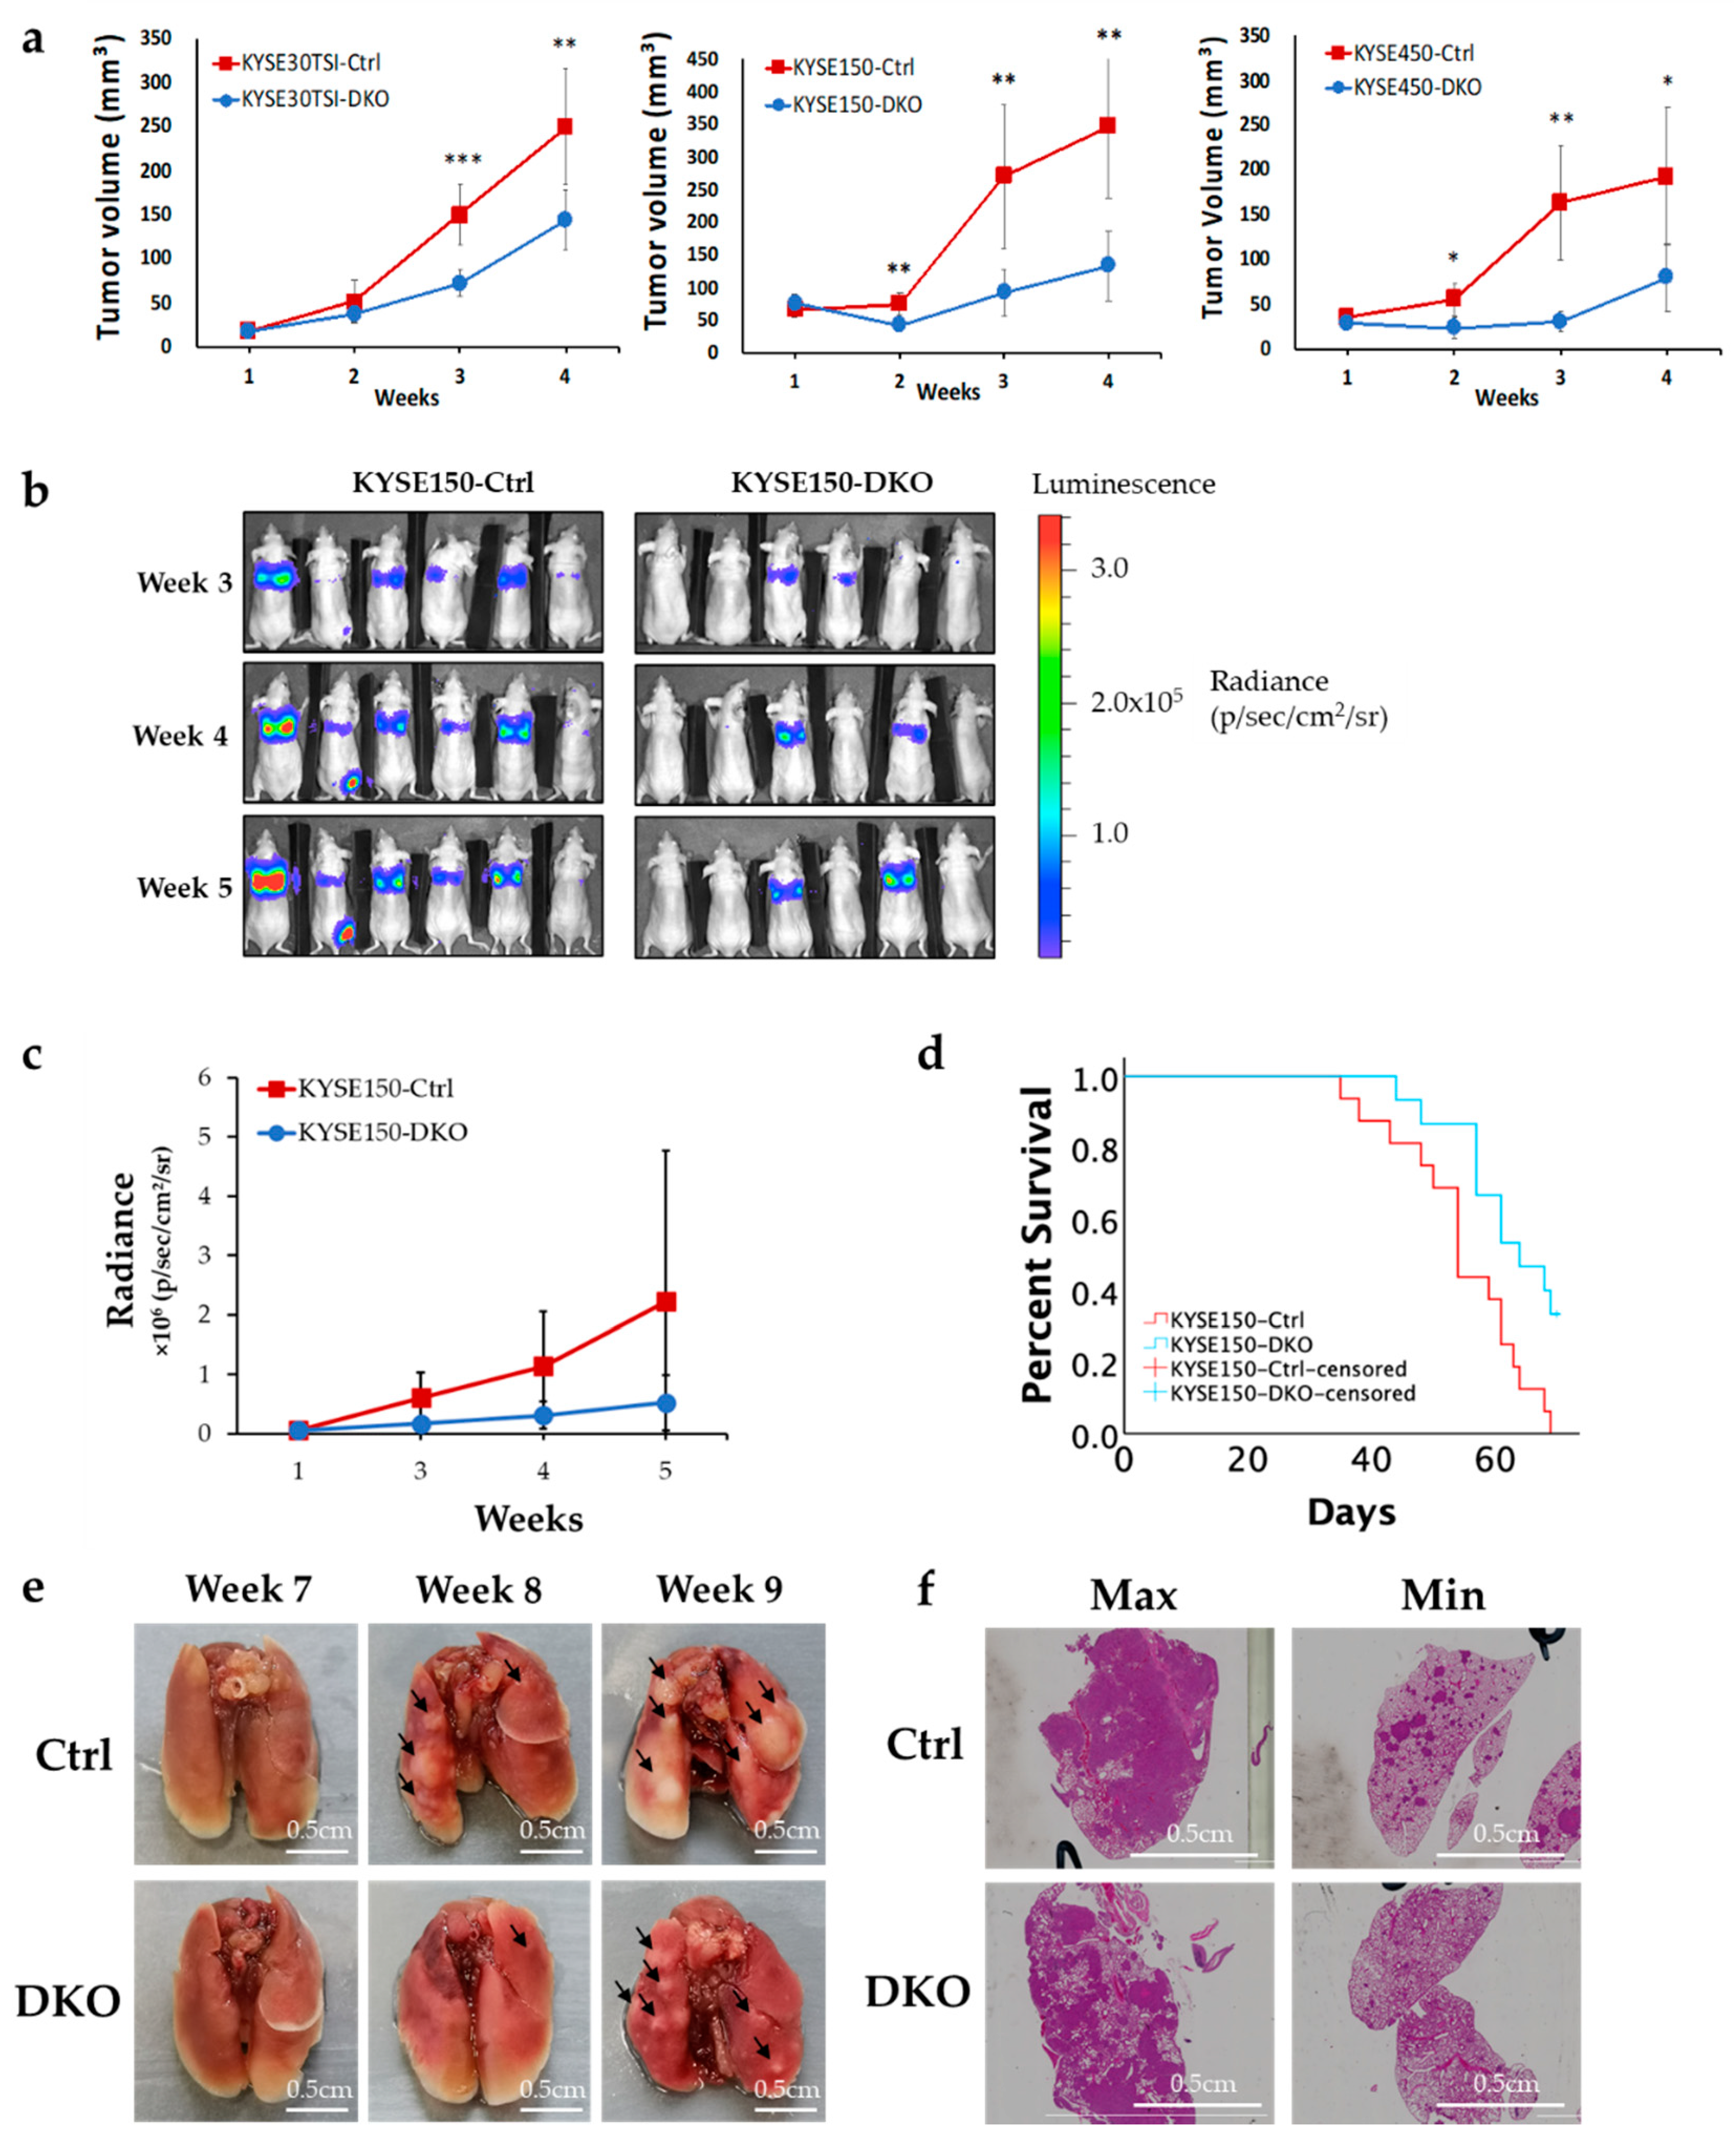
CRISPR-mediated FANCD2 protein expression depletion was performed in three ESCC cell lines resulting in almost complete knockout of FANCD2 (FANCD2-KO) protein expression (Figure 1c and Figure S2). To determine the role of FANCD2 on ESCC primary tumor growth, the subcutaneous tumorigenicity nude mouse model was utilized. Significant suppression of tumor growth was observed in FANCD2-KO cells, as compared to control cells in all three cell lines tested (Figure 2a).
To determine the role of FANCD2 on ESCC tumor metastasis, the tail-vein experimental metastasis model in nude mice was utilized using KYSE150Luc cells. An obvious reduction in lung metastasis formation was observed after three weeks in the FANCD2-KO group in contrast to the control group (Figure 2b,c). Mice bearing FANCD2-KO cells showed significantly better survival than the mice bearing control cells (Figure 2d; Log Rank p = 0.007). In addition, fewer and smaller metastases were observed in the lung sections of mice bearing FANCD2-KO cells (Figure 2e,f). These findings strongly indicate a role of FANCD2 in supporting ESCC tumor development.

3.3. FANCD2-KO Suppresses In Vitro Cell Proliferation and Colony Formation in ESCC Cells

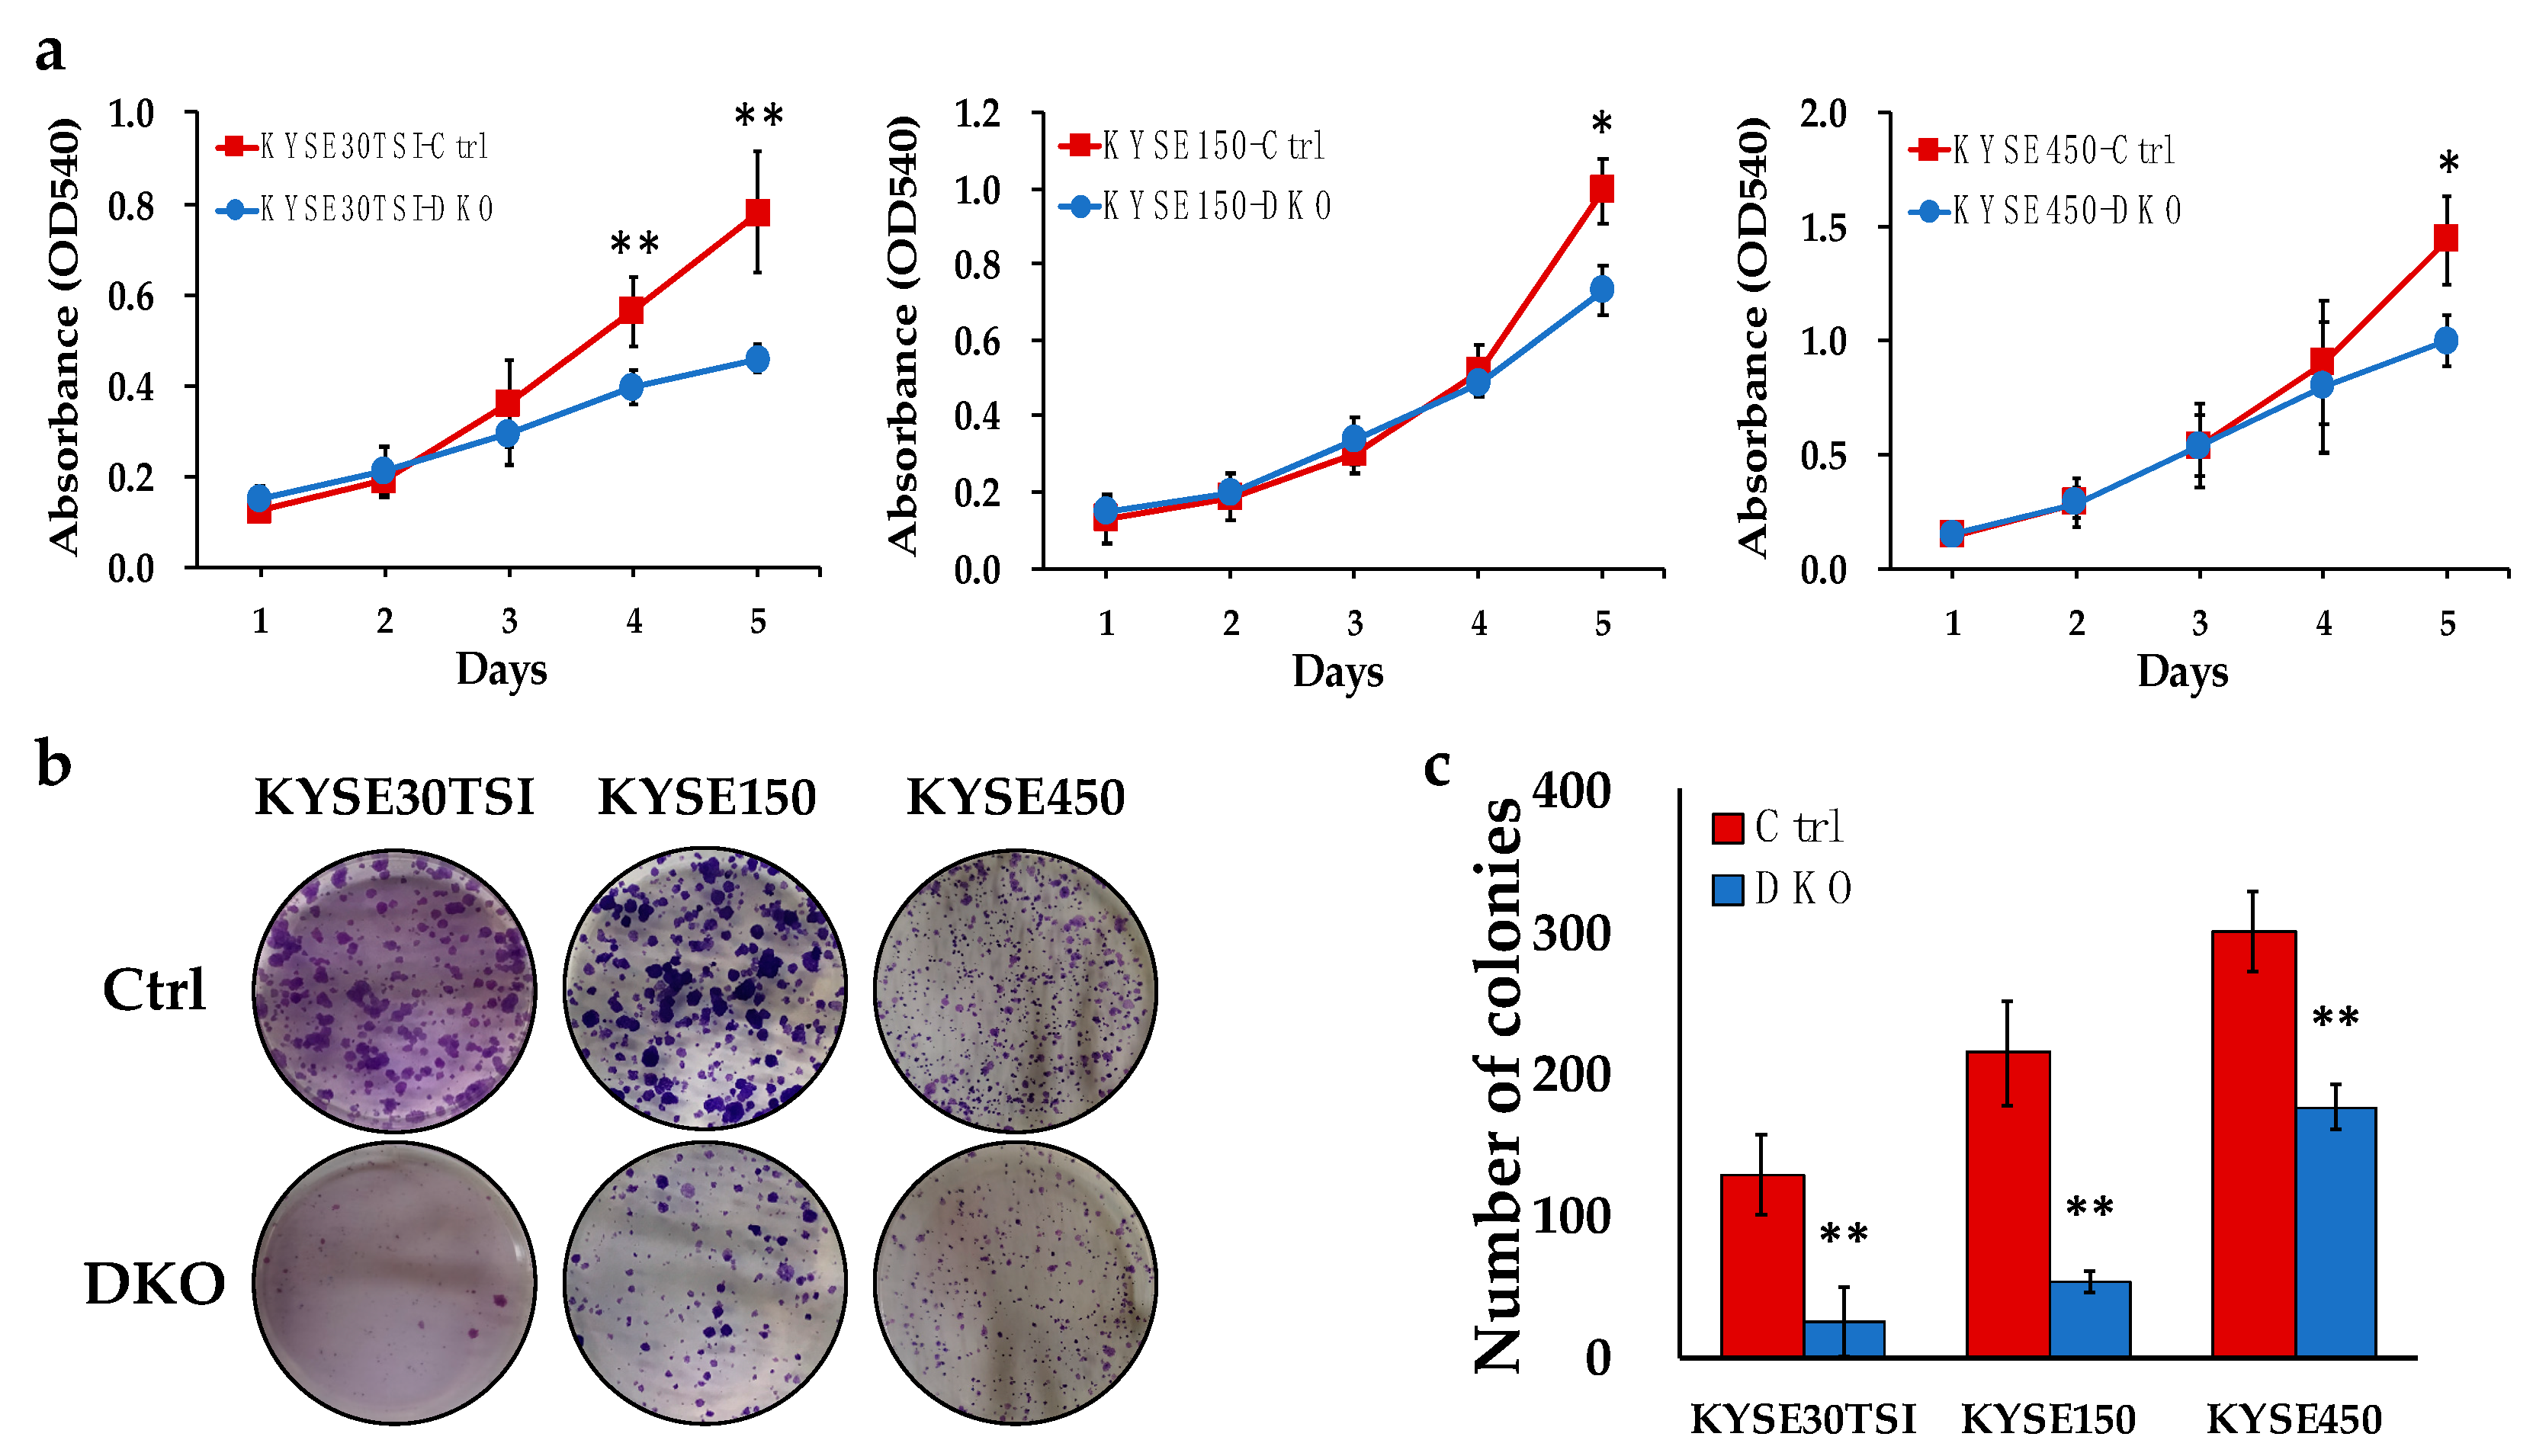
To dissect the functional impact of FANCD2-KO, in vitro cell proliferation assays were performed. Consistent with the in vivo data, FANCD2-KO cells showed suppressed cell proliferation in all three ESCC cell lines (Figure 3a). To investigate the role of FANCD2 on single cell-derived colony formation potential, an important factor for tumor metastasis, the clonogenic assay was performed. Consistently with the experimental metastasis data, FANCD2-KO cells formed significantly fewer and smaller colonies as compared to control cells (Figure 3b,c). These data verified the malignant phenotype of FANCD2 on cell proliferation and colony formation in ESCC cell lines.

3.4. FANCD2-KO Suppresses Cell Cycle Progression in ESCC Cells

Cell cycle profiles of FANCD2-KO cells were used to measure cellular DNA content. The percentage of cells in the G1 phase decreased and cells in G2/M phases slightly but constantly increased in all three unsynchronized ESCC cell lines (Figure 4a,b). After synchronization of the cells at early S phase before cell cycle profiling, FANCD2-KO cells progressed through the cell cycle more slowly than controls in three cell lines tested (Figure 4c,d). The disruption and delay of cell cycle progression suggest that FANCD2-KO suppresses ESCC cell proliferation by cell cycle regulation.

3.5. FANCD2-KO Affects G1/S Transition and Delays Entry to Mitosis in ESCC Cells

To investigate the molecular regulation of cell cycle progression, cells were synchronized at early S phase followed by examining expression of cell cycle regulators by Western blotting. The delayed degradation of cyclin E2 in FANCD2-KO cells suggests partial G1/S arrest (Figure 5a, Figures S3–S6). Subsequently, the delayed degradation of cyclin A2 and the lack of upregulation of cyclin B1 indicate delayed entry and exit of mitosis for FANCD2-KO cells (Figure 5a, Figures S3–S6). As cells further progressed through the cell cycle, FANCD2-KO cells showed inactivation of cyclin D1 and cyclin D2, which indicates delayed initiation of a new cell cycle round. Furthermore, Chk1 was upregulated and Chk2 was downregulated in FANCD2-KO cells, indicating that ATR and ATM pathways are involved in FANCD2-KO-induced suppression of cell cycle progression. These results are concordant with the flow cytometry analysis and suggests that FANCD2 is necessary for accurate cell cycle progression in ESCC cells.

3.6. Ubiquitinated FANCD2 Localizes to the Nucleus to Regulate Cell Cycle Progression in ESCC Cells

The Western blotting analysis of synchronized cells shows that FANCD2 ubiquitination in the S phase and de-ubiquitination during G2/M phases (Figure 5a). Subcellular localization of FANCD2 was examined by cellular fractionation. The mono-ubiquitinated FANCD2 solely localized to the nucleus in an unsynchronized population of ESCC cells (Figure 5b and Figure S7). The upregulation of FANCD2 protein was shown in the nuclear fraction at first, and then in the membrane fraction, and finally in the cytoplasmic fraction (Figure 5c and Figure S8). The sole nuclear localization was also confirmed during the S phase in the synchronized ESCC cells (Figure 5c and Figure S8). This translocation and ubiquitination of FANCD2 protein indicate that it plays important roles in regulation of the ESCC cell cycle.

3.7. FANCD2 Is Likely Dispensable for DNA Damage Repair in ESCC Cells

Cells were treated with cisplatin or MMC to further investigate how FANCD2 functions in DNA damage repair in ESCC. Cisplatin treatment increased FANCD2 mono-ubiquitination and phosphorylation of ATR (p-ATR), ATM (p-ATM), Chk1 (p-Chk1), Chk2 (p-Chk2) and BRCA1 (p-BRCA1) (Figure 6a, Figures S9 and S10), while FANCD2-KO suppressed p-ATR and p-Chk2 in response to DNA damage (Figure 6a, Figures S9 and S10). The FANCD2 expression level does not affect chemosensitivity to cisplatin and MMC in ESCC cells (Figure 6b). These results indicate that FANCD2 is likely dispensable in the DNA damage repair response to cisplatin or MMC in ESCC cells.

4. Discussion

FANCD2 has been well-studied in regards to cancer susceptibility and initiation. FANCD2, the pivotal player in the FA/BRCA repair pathway, is important for maintaining genome stability in response to a variety of genotoxic stresses [14,15]. Mono-ubiquitinated FANCD2 is often portrayed as the functional representative of activated FA signaling [16,17]. Biallelic germline mutations in FANCD2 increase cancer susceptibility [18]. However, less is known about its functional influence in tumorigenesis. Tissue microarray analysis showed that upregulation of FANCD2 is positively associated with tumor size and adverse prognosis in breast cancer [8,9,10], ovarian cancer [11,12], nasopharyngeal carcinoma [13], glioblastoma [14], and endometrial carcinoma [15]. Our analysis of in-house and publicly available ESCC transcriptome datasets showed that FANCD2 is significantly upregulated in ESCC tumors. We also showed that FANCD2 protein expression is consistently upregulated in ESCC cells. Given the low frequency of somatic FANCD2 mutations in ESCC, the majority of upregulated FANCD2 possesses WT sequences and are expected to exert WT functions [19,20]. The current study suggests that function of WT FANCD2 is favored in ESCC; we further provide functional evidence for this using various in vivo and in vitro assays, which are consistent in showing that high-FANCD2 expression is associated with increased risk of metastasis and poor prognosis in ESCC. Our study is the first functional analysis suggesting that FANCD2 confers a malignant phenotype and may be used as a novel prognostic marker for ESCC. However, future overexpression experiments in normal esophageal epithelial cell lines are needed to clarify whether the malignant phenotype of FANCD2 overexpression is only present in transformed cells and, therefore, reflects a late step in cancer evolution of ESCC.
We showed by cell cycle analysis that the tumor-suppressive effect of FANCD2-KO in ESCC was mediated by suppression of cell proliferation through suppression of cell cycle progression. FANCD2 plays roles in nearly all phases of cell cycle regulation. In the G1/S phases, FANCD2 is required for the full activation of DNA replication by participating in initiation of DNA replication [21] and prevention of replication forks together with RAD51-BRCA1/2 [22]. The intra-S phase ATR-Chk1 checkpoint promotes FANCD2 mono-ubiquitination and subnuclear foci assemble in response to DNA damage [23], whereas FANCD2 deficiency leads to a Chk1-dependent G2 accumulation [24,25]. Subsequently, USP1 deubiquitinates FANCD2 to recycle FANCD2 and promote S phase exit [26]. In the G2/M phases, the FANCD2/FANCI protein dimers interlinking with sister chromatids through BLM-associated ultra-fine DNA bridges (UFBs) are responsible for proper chromosome segregation independent of the downstream FA pathway and ATM/ATR checkpoint [27,28]. FANCD2 is also required for proper phosphorylation of H2AX and, hence, activation of the ATM-Chk2 checkpoint [25,29]. Considering the abnormal expression of Chk1 and Chk2 in FANCD2-KO ESCC cells and their crucial roles in cell cycle regulation, FANCD2 likely regulates cell cycle progression by modulating checkpoint signaling.
Despite our data suggesting that FANCD2 plays roles in repair of cisplatin-induced DNA damage, FANCD2-KO cells did not show enhanced chemosensitivity to cisplatin and MMC treatments. The FA/BRCA2 pathway is critical for the orchestration of the cellular response to cisplatin and MMC, two DNA cross-linking agents, while FANCD2 deficiency increased chemosensitivity to cisplatin and MMC treatments in HeLa cells [23,30]. However, this was not observed in our study, implying that FANCD2 is dispensable for repairing cisplatin/MMC-induced DNA damage. It is likely that DNA repair proceeds through alternate pathways in ESCC. Further in-depth study is needed to elucidate the mechanism behind this.
Our studies identified FANCD2 subcellular localization in synchronized ESCC cells to better understand its function in cell cycle regulation. Reports indicate that nuclear concentration and mono-ubiquitination of FANCD2 to form FANCD2/FANCI nuclear foci and co-localization with BRCA1 are required for the activation of the FA pathway in cellular response to both intra- and extra-cellular DNA damage in the S phase [31,32]. After DNA repair is completed, a subset of FANCD2 proteins is excluded from the chromosomes and relocates to the cytoplasm at the onset of mitosis [33]. The remaining nuclear FANCD2 on the sister chromatids in G2/early mitosis (prophase and metaphase) and subsequent resolution at anaphase are critical for proper chromosome segregation and prevention of micro-nucleation [27,33]. Our subcellular location study clearly shows the nuclear localization of mono-ubiquitinated FANCD2 in S/G2/early M phases and cytoplasm translocation during mitosis, supporting the multiple roles FANCD2 plays in cell cycle regulation in ESCC cells. The membrane localization of FANCD2 is possibly associated with its functions in mitochondria and regulation of ATP metabolism [34,35]. The cellular ATP concentration varies through the cell cycle, reaching a peak at G2/M- and a minimum at late G1/early S phase [36], which is consistent with our observed FANCD2 expression levels in membrane fractions.

5. Conclusions

In summary, the current study is the first functional study exploring a FANCD2 malignant phenotype in ESCC development, through regulating cell cycle progression (Figure 6c), suggesting that FANCD2 may serve as a prognostic biomarker and potential drug target in ESCC management. These observations also provide new evidence for an interplay between cancer-associated signaling pathways and cell cycle regulation.

Supplementary Materials

The following are available online at https://www.mdpi.com/2072-6694/12/9/2545/s1, Figure S1: Supplements for Figure 1b, Figure S2: Supplements for Figure 1c, Figure S3: Whole length western blots of western blots shown in Figure 5a, Figure S4: Fold change of densitometry readings/intensity ratios of western blots shown in Figure 5a, Figure S5: Whole length western blots of western blots shown in Figure 5a (continued), Figure S6: Fold change of densitometry readings/intensity ratios western blots shown in Figure 5a (continued), Figure S7: Supplements for Figure 5b, Figure S8: Supplement for Figure 5c, Figure S9: Supplements for Figure 6a, Figure S10: Supplements for Figure 6a (continued).

Author Contributions

Conceptualization, L.C.L., V.Z.Y., J.M.Y.K. and M.L.L.; Data curation, L.C.L.; Funding acquisition, M.L.L.; Investigation, L.C.L. and L.N.; Methodology, L.C.L. and V.Z.Y.; Project administration, L.C.L., V.Z.Y. and M.L.L.; Supervision, M.L.L.; Validation, L.C.L.; Visualization, L.C.L.; Writing—original draft, L.C.L.; Writing—review & editing, V.Z.Y. and M.L.L. All authors have read and agreed to the published version of the manuscript.

Funding

This research was funded by the Hong Kong Research Grants Council Collaborative Research Fund grant (C7031.15G) to MLL.

Acknowledgments

We thank Lihua Tao for technical support. We thank DSMZ (German Collection of Microorganisms and Cell Culture) for the KYSE cell lines. We thank the University of Hong Kong Faculty of Medicine Core Facility for providing facilities for flow cytometry and live-animal bioluminescence imaging.

Conflicts of Interest

The authors declare that there is no conflict of interest regarding the publication of this article.

References

  1. Bray, F.; Ferlay, J.; Soerjomataram, I.; Siegel, R.L.; Torre, L.A.; Jemal, A. Global cancer statistics 2018: GLOBOCAN estimates of incidence and mortality worldwide for 36 cancers in 185 countries. CA Cancer J. Clin. 2018, 68, 394–424. [Google Scholar] [CrossRef] [PubMed] [Green Version]
  2. Conteduca, V.; Sansonno, D.E.; Ingravallo, G.; Marangi, S.; Russi, S.; Lauletta, G.; Dammacco, F. Barrett’s esophagus and esophageal cancer: An overview. Int. J. Oncol. 2012, 41, 414–424. [Google Scholar] [CrossRef] [PubMed] [Green Version]
  3. Houghtaling, S.; Timmers, C.; Noll, M.; Finegold, M.J.; Jones, S.N.; Meyn, M.S.; Grompe, M. Epithelial cancer in Fanconi anemia knockout mice. Genes Dev. 2003, 2, 2021–2035. [Google Scholar] [CrossRef] [Green Version]
  4. Parmar, K.; D’Andrea, A.; Niedernhofer, L.J. Mouse models of Fanconi anemia. Mutat. Res. Mol. Mech. Mutagen. 2009, 668, 133–140. [Google Scholar] [CrossRef] [PubMed] [Green Version]
  5. Barroso, E.; Milne, R.; Zamora, P.; Arias, J.; Fernández, L.; Benitez, J.; Ribas, G. FANCD2 associated with sporadic breast cancer risk. Carcinogenesis 2006, 27, 1930–1937. [Google Scholar] [CrossRef]
  6. Mantere, T.; Tervasmäki, A.; Nurmi, A.; Rapakko, K.; Kauppila, S.; Tang, J.; Schleutker, J.; Kallioniemi, A.; Hartikainen, J.M.; Mannermaa, A.; et al. Case-control analysis of truncating mutations in DNA damage response genes connects TEX15 and FANCD2 with hereditary breast cancer susceptibility. Sci. Rep. 2017, 7, 681. [Google Scholar] [CrossRef] [PubMed]
  7. Chandrasekharappa, S.C.; Chinn, S.B.; Donovan, F.X.; Chowdhury, N.I.; Kamat, A.; Adeyemo, A.A.; Thomas, J.W.; Vemulapalli, M.; Hussey, C.S.; Reid, H.H.; et al. Assessing the spectrum of germline variation in Fanconi anemia genes among patients with head and neck carcinoma before age 50. Cancer 2017, 123, 3943–3954. [Google Scholar] [CrossRef] [PubMed]
  8. Feng, L.; Jin, F. Expression and prognostic significance of Fanconi anemia group D2 protein and breast cancer type 1 susceptibility protein in familial and sporadic breast cancer. Oncol. Lett. 2019, 17, 3687–3700. [Google Scholar] [CrossRef] [Green Version]
  9. Fagerholm, R.; Sprott, K.; Heikkinen, T.; Bartkova, J.; Heikkilä, P.; Aittomäki, K.; Bartek, J.; Weaver, D.; Blomqvist, C.; Nevanlinna, H. Overabundant FANCD2, alone and combined with NQO1, is a sensitive marker of adverse prognosis in breast cancer. Ann. Oncol. 2013, 24, 2780–2785. [Google Scholar] [CrossRef]
  10. Rudland, P.S.; Platt-Higgins, A.M.; Davies, L.M.; Rudland, S.D.S.; Wilson, J.B.; Aladwani, A.; Winstanley, J.H.; Barraclough, D.L.; Barraclough, R.; West, C.R.; et al. Significance of the Fanconi Anemia FANCD2 Protein in Sporadic and Metastatic Human Breast Cancer. Am. J. Pathol. 2010, 176, 2935–2947. [Google Scholar] [CrossRef]
  11. Wysham, W.Z.; Mhawech-Fauceglia, P.; Li, H.; Hays, L.; Syriac, S.; Skrepnik, T.; Wright, J.; Pande, N.; Hoatlin, M.; Pejovic, T. BRCAness profile of sporadic ovarian cancer predicts disease recurrence. PLoS ONE 2012, 7, e30042. [Google Scholar] [CrossRef] [PubMed] [Green Version]
  12. Pejovic, T.; Yates, J.E.; Liu, H.Y.; Hays, L.E.; Akkari, Y.; Torimaru, Y.; Keeble, W.; Rathbun, R.K.; Rodgers, W.H.; Bale, A.E.; et al. Cytogenetic instability in ovarian epithelial cells from women at risk of ovarian cancer. Cancer Res. 2006, 66, 9017–9025. [Google Scholar] [CrossRef] [PubMed] [Green Version]
  13. Xu, S.; Zhao, F.; Liang, Z.; Feng, H.; Bao, Y.; Xu, W.; Zhao, C.; Qin, G. Expression of FANCD2 is associated with progosis in patients with nasopharyngeal carcinoma. Int. J. Clin. Exp. Pathol. 2019, 12, 3465–3473. [Google Scholar] [PubMed]
  14. Patil, A.A.; Sayal, P.; Depondt, M.L.; Beveridge, R.D.; Roylance, A.; Kriplani, D.H.; Myers, K.N.; Cox, A.; Jellinek, D.; Fernando, M.; et al. FANCD2 re-expression is associated with glioma grade and chemical inhibition of the Fanconi Anaemia pathway sensitises gliomas to chemotherapeutic agents. Oncotarget 2014, 5, 6414–6424. [Google Scholar] [CrossRef] [Green Version]
  15. Mhawech-Fauceglia, P.; Wang, D.; Kim, G.; Sharifian, M.; Chen, X.; Liu, Q.; Lin, Y.G.; Liu, S.; Pejovic, T. Expression of DNA repair proteins in endometrial cancer predicts disease outcome. Gynecol. Oncol. 2014, 132, 593–598. [Google Scholar] [CrossRef]
  16. Leung, A.C.C.; Wong, V.C.L.; Li, C.Y.; Pui, L.C.; Daigo, Y.; Nakamura, Y.; Qi, R.Z.; Miller, L.D.; Liu, E.T.; Wang, L.D.; et al. Frequent decreased expression of candidate tumor suppressor gene, DEC1, and its anchorage-independent growth properties and impact on global gene expression in esophageal carcinoma. Int. J. Cancer 2008, 122, 587–594. [Google Scholar] [CrossRef]
  17. Kim, D.; Pertea, G.; Trapnell, C.; Pimentel, H.; Kelley, R.; Salzberg, S.L. TopHat2: Accurate alignment of transcriptomes in the presence of insertions, deletions and gene fusions. Genome Biol. 2013, 14, R36. [Google Scholar] [CrossRef] [Green Version]
  18. Yu, Y.; Cao, J.; Wu, W.; Zhu, Q.; Tang, Y.; Zhu, C.; Dai, J.; Li, Z.; Wang, J.; Xue, L.; et al. Genome-wide copy number variation analysis identified ANO1 as a novel oncogene and prognostic biomarker in esophageal squamous cell cancer. Carcinogenesis 2019, 20, 1–11. [Google Scholar] [CrossRef]
  19. Yu, V.Z.; Wong, V.C.-L.; Dai, W.; Ko, J.M.-Y.; Lam, A.K.-Y.; Chan, K.W.; Samant, R.S.; Lung, H.L.; Shuen, W.H.; Law, S.; et al. Nuclear localization of DNAJB6 is associated with survival of patients with esophageal cancer and reduces AKT signaling and proliferation of cancer cells. Gastroenterology 2015, 149, 1825–1836. [Google Scholar] [CrossRef] [Green Version]
  20. Li, B.; Tsao, S.W.; Chan, K.W.; Ludwig, D.L.; Novosyadlyy, R.; Li, Y.Y.; He, Q.Y.; Cheung, A.L. Id1-induced IGF-II and its autocrine/endocrine promotion of esophageal cancer progression and chemoresistance-implications for IGF-II and IGF-IR-targeted therapy. Clin. Cancer Res. 2014, 20, 2651–2662. [Google Scholar] [CrossRef] [Green Version]
  21. Song, I.Y.; Barkley, L.R.; Day, T.A.; Weiss, R.S.; Vaziri, C. A novel role for fanconi anemia (FA) pathway effector protein FANCD2 in cell cycle progression of untransformed primary human cells. Cell Cycle 2010, 9, 2375–2388. [Google Scholar] [CrossRef] [PubMed]
  22. Schlacher, K.; Wu, H.; Jasin, M. A distinct replication fork protection pathway connects Fanconi anemia tumor suppressors to RAD51-BRCA1/2. Cancer Cell 2012, 22, 106–116. [Google Scholar] [CrossRef] [PubMed] [Green Version]
  23. Andreassen, P.R.; D’Andrea, A.D.; Taniguchi, T. ATR couples FANCD2 monoubiquitination to the DNA-damage responsey. Genes Dev. 2004, 18, 1958–1963. [Google Scholar] [CrossRef] [PubMed] [Green Version]
  24. Guervilly, J.-H.; Macé-Aimé, G.; Rosselli, F. Loss of CHK1 function impedes DNA damage-induced FANCD2 monoubiquitination but normalizes the abnormal G2 arrest in Fanconi anemia. Hum. Mol. Genet. 2007, 17, 679–689. [Google Scholar] [CrossRef]
  25. Shen, C.; Oswald, D.; Phelps, D.; Çam, H.; Pelloski, C.E.; Pang, Q.; Houghton, P.J. Abstract 4437: Regulation of FANCD2 by the mTOR pathway contributes to the resistance of cancer cells to DNA double strand breaks. Exper. Mol. Ther. 2013, 73. [Google Scholar] [CrossRef]
  26. Nijman, S.M.; Huang, T.T.; Dirac, A.M.; Brummelkamp, T.R.; Kerkhoven, R.M.; D’Andrea, A.; Bernards, R. The Deubiquitinating Enzyme USP1 Regulates the Fanconi Anemia Pathway. Mol. Cell 2005, 17, 331–339. [Google Scholar] [CrossRef] [Green Version]
  27. Chan, K.-L.; Palmai-Pallag, T.; Ying, S.; Hickson, I.D. Replication stress induces sister-chromatid bridging at fragile site loci in mitosis. Nature 2009, 11, 753–760. [Google Scholar] [CrossRef]
  28. Nalepa, G.; Enzor, R.; Sun, Z.; Marchal, C.; Park, S.-J.; Yang, Y.; Tedeschi, L.; Kelich, S.; Hanenberg, H.; Clapp, D.W. Fanconi anemia signaling network regulates the spindle assembly checkpoint. J. Clin. Investig. 2013, 123, 3839–3847. [Google Scholar] [CrossRef] [Green Version]
  29. Knipscheer, P.; Räschle, M.; Smogorzewska, A.; Enoiu, M.; Ho, T.V.; Schärer, O.D.; Elledge, S.J.; Walter, J.C. The Fanconi Anemia Pathway Promotes Replication-Dependent DNA Interstrand Cross-Link Repair. Science 2009, 326, 1698–1701. [Google Scholar] [CrossRef] [Green Version]
  30. Chirnomas, D.; Taniguchi, T.; De La Vega, M.; Vaidya, A.P.; Vasserman, M.; Hartman, A.-R.; Kennedy, R.; Foster, R.; Mahoney, J.; Seiden, M.V.; et al. Chemosensitization to cisplatin by inhibitors of the Fanconi anemia/BRCA pathway. Mol. Cancer Ther. 2006, 5, 952–961. [Google Scholar] [CrossRef] [Green Version]
  31. Garcia-Higuera, I.; Taniguchi, T.; Ganesan, S.; Meyn, M.; Timmers, C.; Hejna, J.; Grompe, M.; D’Andrea, A.D. Interaction of the Fanconi Anemia Proteins and BRCA1 in a Common Pathway. Mol. Cell 2001, 7, 249–262. [Google Scholar] [CrossRef]
  32. Pace, P.; Johnson, M.; Tan, W.M.; Mosedale, G.; Sng, C.; Hoatlin, M.; De Winter, J.; Joenje, H.; Gergely, F.; Patel, K.J. FANCE: The link between Fanconi anaemia complex assembly and activity. EMBO J. 2002, 21, 3414–3423. [Google Scholar] [CrossRef] [PubMed] [Green Version]
  33. Naim, V.; Rosselli, F. The FANC pathway and BLM collaborate during mitosis to prevent micro-nucleation and chromosome abnormalities. Nature 2009, 11, 761–768. [Google Scholar] [CrossRef] [PubMed]
  34. Zhang, T.; Du, W.; Wilson, A.F.; Namekawa, S.H.; Andreassen, P.R.; Meetei, A.R.; Pang, Q. Fancd2 in vivo interaction network reveals a non-canonical role in mitochondrial function. Sci. Rep. 2017, 7, 45626. [Google Scholar] [CrossRef] [Green Version]
  35. Jayabal, P.; Ma, C.; Nepal, M.; Shen, Y.; Che, R.; Turkson, J.; Fei, P. Involvement of FANCD2 in Energy Metabolism via ATP5α. Sci. Rep. 2017, 7, 4921. [Google Scholar] [CrossRef]
  36. Marcussen, M.; Larsen, P.J. Cell cycle-dependent regulation of cellular ATP concentration, and depolymerization of the interphase microtubular network induced by elevated cellular ATP concentration in whole fibroblasts. Cell Motil. Cytoskelet. 1996, 35, 94–99. [Google Scholar] [CrossRef]
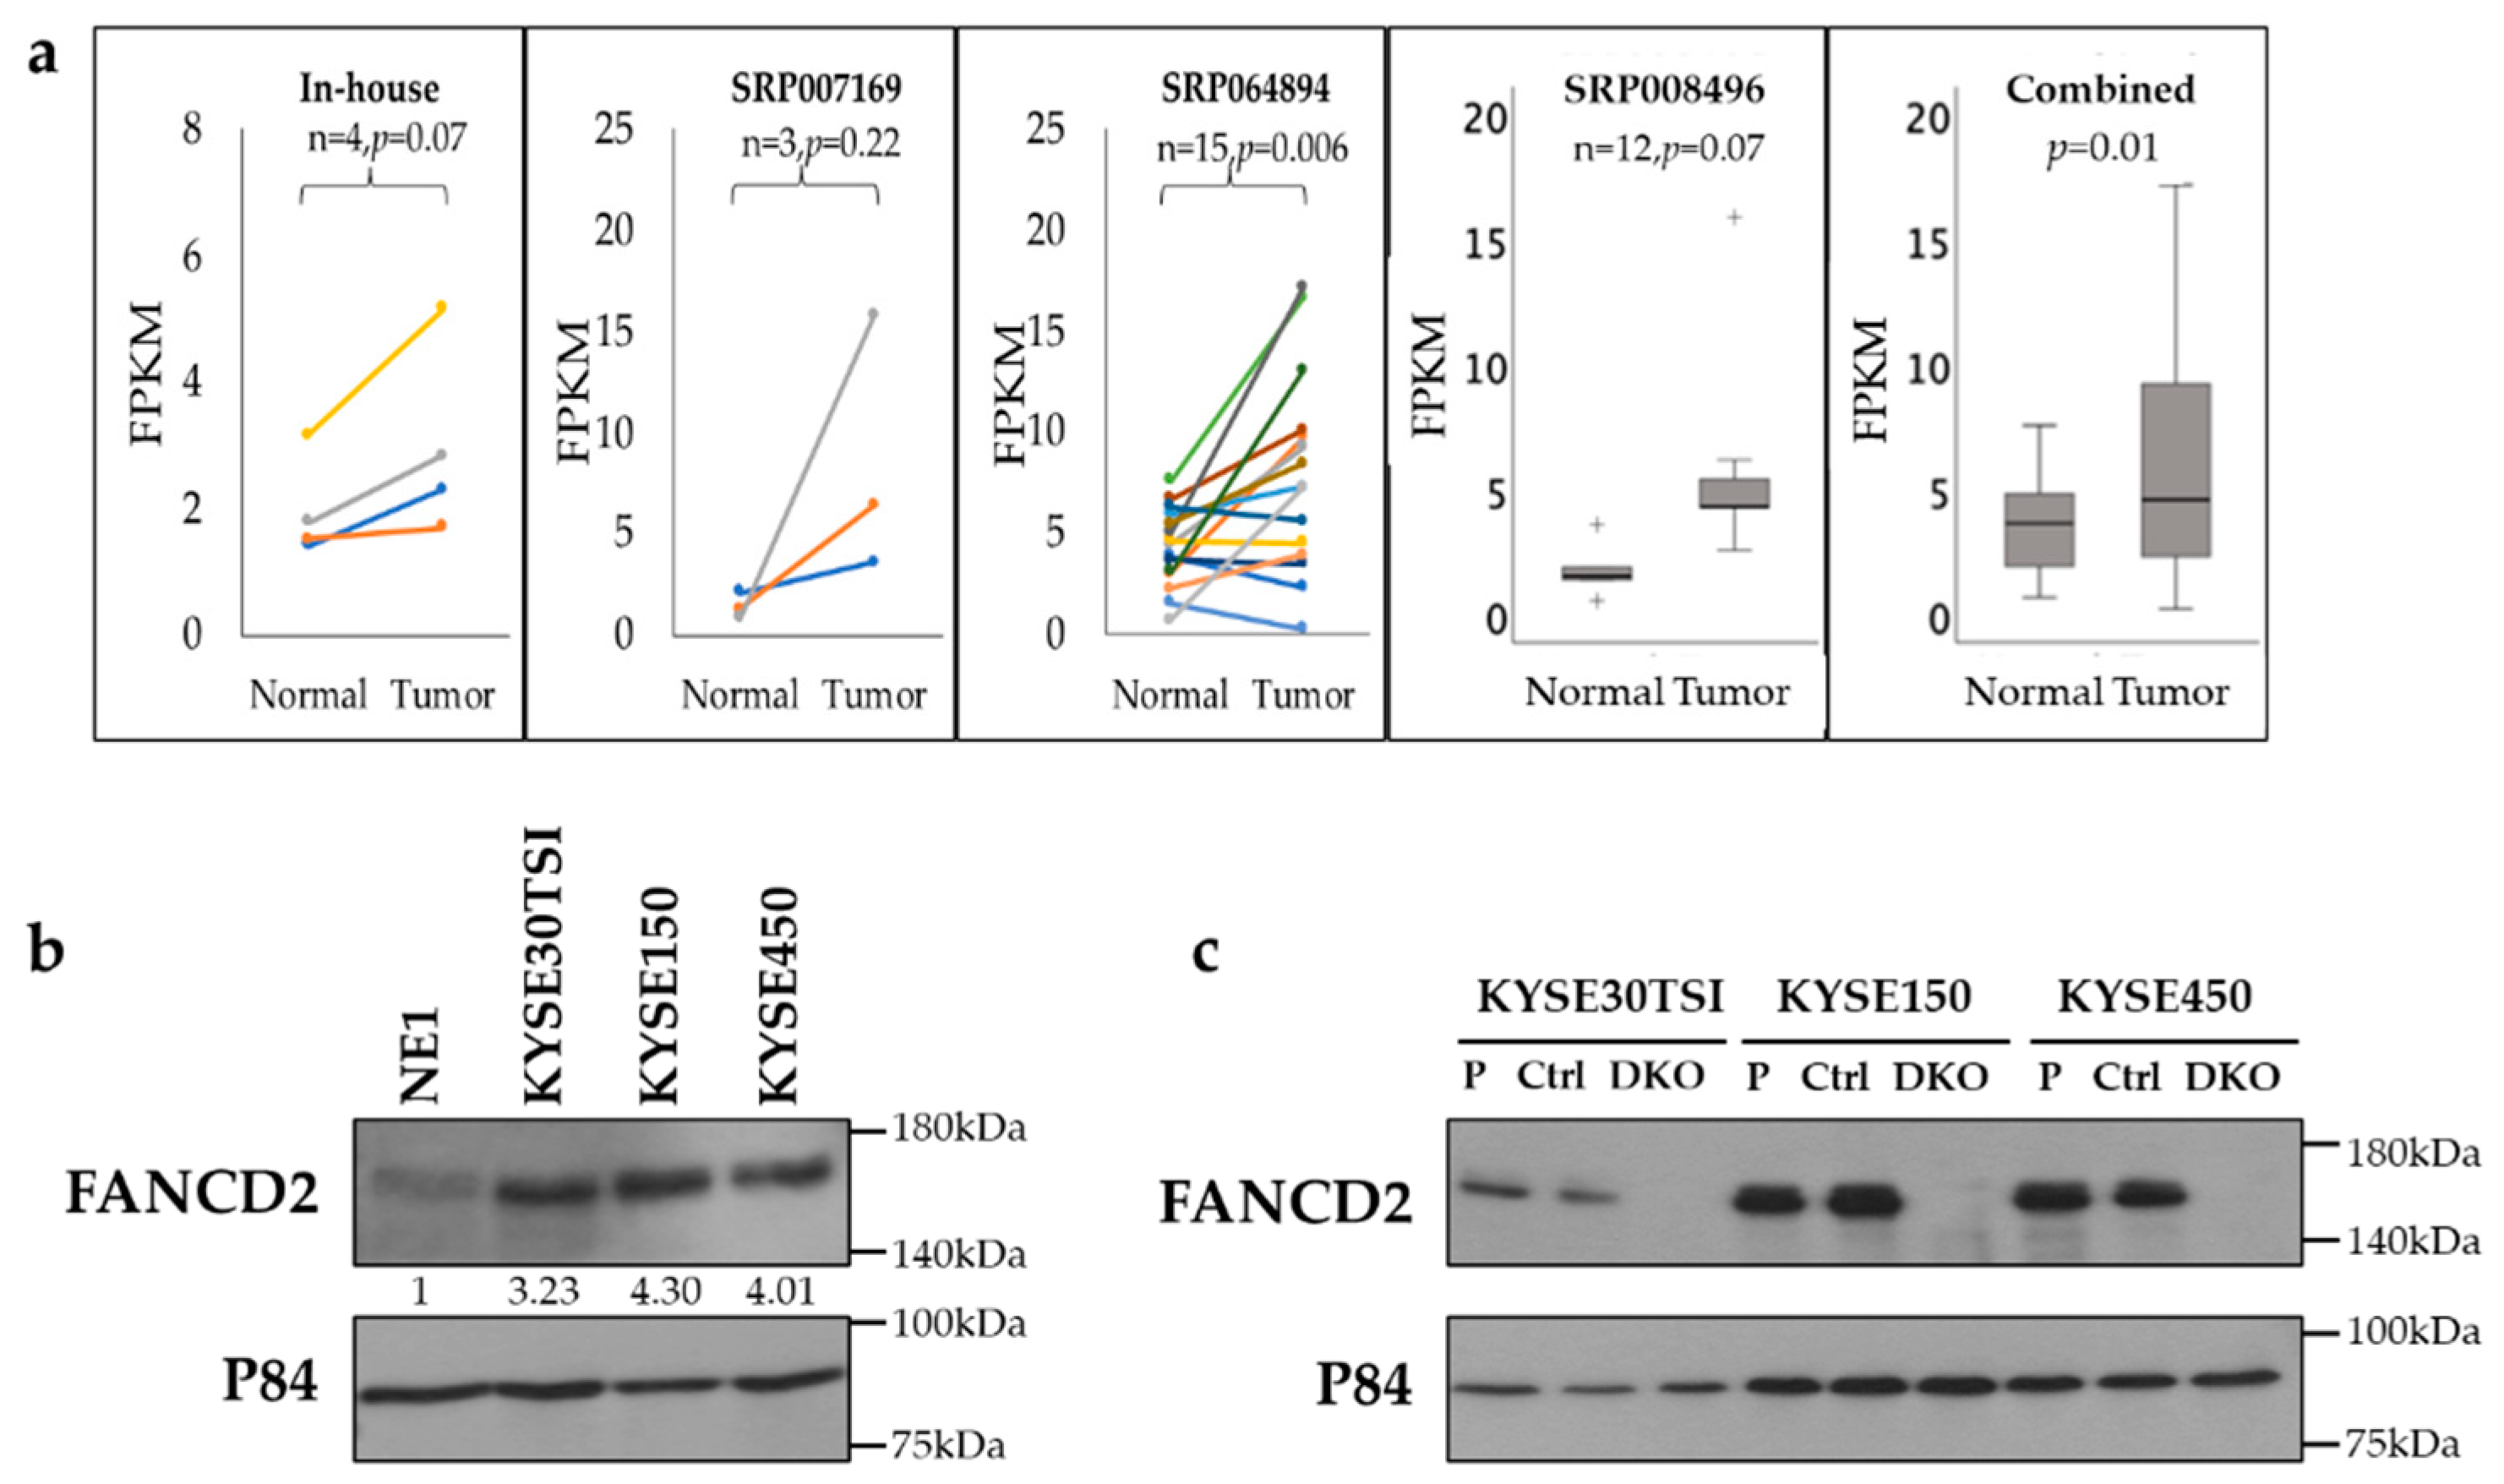
Figure 1. FANCD2 expression in ESCC tissues and cell lines. (a) FANCD2 RNA expression was significantly upregulated in ESCC compared to the normal tissues using RNA sequencing and is presented as Fragments Per Kilobase Million (FPKM). +, outlier data. (b) FANCD2 protein expression was upregulated in three ESCC cell lines compared with the NE1 cell line. The numbers show the ratios of FANCD2 band intensity in ESCC cell lines relative to that in the NE1 cell line, normalized to the p84 loading. (c) Confirmation of endogenous FANCD2-KO in ESCC cell lines by Western blotting. P, parental; Ctrl, control; DKO, FANCD2 knockout; p84, loading control.
Cancers 12 02545 g001
Figure 2. FANCD2 expression regulates in vivo tumor growth and metastasis. (a) Subcutaneous tumor growth is suppressed in FANCD2-KO ESCC cells. The data are shown as the mean ± 95% confidence interval (n = 12). (b) Representative images showing weaker and fewer bioluminescence signals in FANCD2-KO mice by live animal imaging. (c) Metastasis tumor volume was assessed at 3, 4 and 5 weeks after tail-vein injection. Using ROI analysis, tumor light intensity was calculated, which corresponds with the number of live cells in vivo. Lower bioluminescence signal was measured in FANCD2-KO mice compared with control mice. The data are shown as the mean ± 95% confidence interval (n = 16). (d) FANCD2-KO significantly increases the overall survival rate (Log Rank p = 0.007). (e) Representative lung images showing less and smaller tumor masses (arrow) in FANCD2-KO mice compared to the controls. (f) Representative lung sections showing fewer and smaller metastatic foci in FANCD2-KO mice under microscopy. Ctrl, control; DKO, FANCD2 knockout; * p < 0.05; ** p < 0.01; *** p < 0.005.
Cancers 12 02545 g002
Figure 3. FANCD2 expression regulates in vitro cell proliferation and colony formation. (a) Cell proliferation was suppressed as assessed by MTT assay in FANCD2-KO ESCC cell lines. The data are shown as the mean ± 95% confidence interval (n = 3). (b) Representative images of colony formation assays are shown. (c) Colony formation ability was suppressed in FANCD2-KO ESCC cell lines. Data are representative of three independent experiments done in triplicates and expressed as the mean ± 95% confidence interval (n = 3). Ctrl, control; DKO, FANCD2 knockout; * p < 0.05; ** p < 0.01.
Cancers 12 02545 g003
Figure 4. Analysis of cell cycle distribution and cell cycle progression in FANCD2-KO cells. (a) The proportion of cells in G1/S and G2/M phases changed in unsynchronized FANCD2-KO ESCC cell lines. Representative results are shown here. (b) Cell cycle profile analysis of three independent triplicate experiments expressed as the mean ± 95% confidence interval (n = 3). (c) FANCD2-KO postponed cell cycle progression after the release from the G1/S double-thymidine block. Cell cycle progression was determined by flow cytometric analysis of propidium iodide stained cells collected at the indicated time points (left). (d) Cell cycle profile analysis of the most significant different timepoints (highlighted with a red circle in Figure 4c) for three ESCC cell lines separately. Experiments were done in triplicates and expressed as the mean ± 95% confidence interval (n = 3). Ctrl, control; DKO, FANCD2 knockout; * p < 0.05; ** p < 0.01; n.s. p < 0.05.
Cancers 12 02545 g004
Figure 5. Analysis of cell cycle markers and FANCD2 subcellular localization. (a) FANCD2-KO induced alterations in the expression of cyclin proteins that are essential for cell cycle progression. The protein lysates were collected at the indicated time points after double-thymidine block and analyzed by Western blotting. (b) Western blotting analysis showed mono-ubiquitination of FANCD2 only in the nucleus. (c) Western blotting analysis of FANCD2 protein in various cellular fractions at the indicated time points after double-thymidine block. N, nuclear fractions; M, membrane fractions; C, cytoplasmic fractions; Ctrl, control; DKO, FANCD2 knockout; p84, loading control; Vinculin, loading control; ⍺-Tubulin, loading control.
Cancers 12 02545 g005
Figure 6. Analysis and schematic diagram of FANCD2 functions. (a) Western blotting analysis of checkpoint proteins in response to 2µM cisplatin treatment. (b) MTT assay on cells treated with cisplatin or MMC for 72 h. The data are shown as the mean ± 95% confidence interval (n = 3). (c) Schematic diagram of FANCD2 conferring a malignant phenotype in ESCC. Ctrl, control; DKO, FANCD2 knockout; n.s., p < 0.05.
Cancers 12 02545 g006
Table 1. Antibody information Used for Western Blots.
AntibodyCompanyCatalog NumberDilutionAntibodyCompanyCatalog NumberDilution
FANCD2Santa Cruzsc200221:1000CDK4Cell Signaling12,7901:1000
p84GeneTexGTX702201:2000CDK7Cell Signaling20901:1000
Cyclin A2Cell Signaling46561:1000CDK9Cell Signaling23161:1000
Cyclin B1Cell Signaling41381:1000p-ATRCell Signaling28531:1000
Cyclin D1Cell Signaling29781:1000p-ATMCell Signaling13,0501:1000
Cyclin D2Cell Signaling37411:1000p-Chk1Cell Signaling12,3021:1000
Cyclin E2Cell Signaling41321:1000p-Chk2Cell Signaling26611:1000
Chk1Cell Signaling23451:500p-BRCA1Cell Signaling90091:1000
Chk2Cell Signaling34401:1000VinculinCell Signaling13,9011:2000
cdc2Cell Signaling28,4391:1000⍺-TubulinCell Signaling21251:2000
CDK2Cell Signaling25461:1000