Simple Summary
The prediction of pathologic complete response (pCR) to neo-adjuvant systemic therapy (NST) based on radiological assessment of pretreatment MRI exams in breast cancer patients is not possible to date. In this study, we investigated the value of pretreatment MRI-based radiomics analysis for the prediction of pCR to NST. Radiomics, clinical, and combined models were developed and validated based on MRI exams containing 320 tumors collected from two hospitals. The clinical models significantly outperformed the radiomics models for the prediction of pCR to NST and were of similar or better performance than the combined models. This indicates poor performance of the radiomics features and that in these scenarios the radiomic features did not have an added value for the clinical models developed. Due to previous and current work, we tentatively attribute the lack of significant improvement in clinical models following the addition of radiomics features to the effects of variations in acquisition and reconstruction parameters. The lack of reproducibility data meant this effect could not be analyzed. These results indicate the need for reproducibility studies to preselect reproducible features in order to properly assess the potential of radiomics.
Abstract
This retrospective study investigated the value of pretreatment contrast-enhanced Magnetic Resonance Imaging (MRI)-based radiomics for the prediction of pathologic complete tumor response to neoadjuvant systemic therapy in breast cancer patients. A total of 292 breast cancer patients, with 320 tumors, who were treated with neo-adjuvant systemic therapy and underwent a pretreatment MRI exam were enrolled. As the data were collected in two different hospitals with five different MRI scanners and varying acquisition protocols, three different strategies to split training and validation datasets were used. Radiomics, clinical, and combined models were developed using random forest classifiers in each strategy. The analysis of radiomics features had no added value in predicting pathologic complete tumor response to neoadjuvant systemic therapy in breast cancer patients compared with the clinical models, nor did the combined models perform significantly better than the clinical models. Further, the radiomics features selected for the models and their performance differed with and within the different strategies. Due to previous and current work, we tentatively attribute the lack of improvement in clinical models following the addition of radiomics to the effects of variations in acquisition and reconstruction parameters. The lack of reproducibility data (i.e., test-retest or similar) meant that this effect could not be analyzed. These results indicate the need for reproducibility studies to preselect reproducible features in order to properly assess the potential of radiomics.
1. Introduction
Neoadjuvant systemic therapy (NST) is increasingly administered in the treatment of breast cancer. The number of breast cancer patients receiving NST varies between 17% and 70% and depends mainly on breast cancer subtype and tumor size [1,2]. NST allows monitoring of in vivo tumor response, potentially decreasing tumor size and thus enabling breast-conserving surgery [1,3,4]. Unfortunately, not all patients respond well to NST, with tumor response ranging from pathologic complete tumor response (pCR) to non-response and sometimes even progression of disease. Predicting which patients will respond well to NST and achieve tumor pCR could lead to modifications of treatment plans. In current clinical practice, magnetic resonance imaging (MRI) assessment combined with clinical (tumor) characteristics is used to determine tumor response to NST [5,6,7]. However, the diagnostic accuracy of the MRI with regard to tumor response evaluation is insufficiently accurate (76.1%) to adapt clinical treatment plans [8]. Furthermore, two studies investigated the use of ultrasound-guided biopsies to identify pCR after NST [9,10]. Unfortunately, the results showed that these biopsies are not accurate enough to identify pCR that surgery can be omitted [11].
Radiomics, a quantitative image analysis technique, could play a role predicting pCR from pretreatment dynamic contrast-enhanced (DCE)-MRI exams. Radiomics extracts large amounts of quantitative features from medical imaging, including MRI. These features capture information on the underlying heterogeneous structure of the region of interest (ROI), describing volume and shape, intensities and textures [12]. Radiomics’ non-invasive ability to characterize the three-dimensional ROI, combined with the availability of ever-growing amounts of (longitudinal) imaging data and its cost-effectiveness, all contribute to the potential use of radiomics in personalized medicine [13,14,15,16]. The emergence of radiomics has so far mainly been applied in the field of clinical oncology and has also permeated breast cancer research.
Several MRI-based radiomics studies have reported promising results regarding the prediction of pCR to NST in breast cancer patients based on pretreatment scans [17,18,19,20,21]. However, the evidence from these studies is limited due to the relatively small sample sizes ranging from 29 to 100 patients and the lack of external validation datasets. Despite the promising potential of radiomics, several hurdles that impede the clinical implementation of radiomics models have been identified. One of these is the sensitivity of radiomics features to the variations in acquisition and reconstruction parameters across different imaging modalities [22,23,24,25,26], and some features were found not to be reproducible even in test-retest scenarios [27,28,29].
This study aimed to investigate the potential of pretreatment contrast-enhanced MRI-based radiomics for the prediction of pCR to NST in breast cancer patients. We hypothesized that radiomics models trained and validated on data from two independent cohorts could add information to the prediction of tumor response to NST and that combined with clinical models can improve prediction accuracy. During our analysis, the sensitivity of radiomics features to the variations in acquisition and reconstruction parameters was established.
2. Materials and Methods
2.1. Study Population
In this multicenter study, imaging, and clinical data from consecutive women with histopathologically confirmed invasive breast cancer were retrospectively collected from two hospitals in the Netherlands (MUMC+—Maastricht University Medical Center and ZMC—Zuyderland Medical Center) between January 2011 and December 2018. The inclusion criteria were as follows: (i) treated with NST, (ii) have undergone pretreatment DCE-MRI in one of the two participating hospitals, and (iii) breast surgery after NST with histopathological outcome. Exclusion criteria were as follows: (i) histopathologically confirmed inflammatory breast cancer without the possibility of unequivocal tumor segmentation, (ii) MRI exam artefacts, if also rejected for visual assessment by the breast radiologist, (iii) non-standard chemotherapy regimens, deviating from the Dutch breast cancer guidelines, (iv) unfinished NST, and (v) no access to the patient’s medical record. In the case of multifocal breast cancer, all histopathologically confirmed invasive tumors were included in the study. The institutional research board of both hospitals approved the study and waived the requirement for informed consent.
2.2. Study Strategy
As different MRI scanners with varying acquisition and reconstruction parameters were used in the two hospitals, it was decided to develop separate prediction models (radiomics, clinical, and a combination of the two) for both cohorts and to validate them on each other (strategies 1 and 2). Therefore, all feature reduction, selection, and modeling procedures were performed on both data cohorts. A third modelling strategy was based on a mixture of both datasets divided into 70% training and 30% validation cohort. Feature selection and model building was performed on 70% of the training data and tested on the remaining 30% of the training data. The process of splitting the data into training and testing was iterated 100 times, maintaining class imbalance and ensuring that tumors from one patient were selected either in the training data or in the testing data. Figure 1A shows an overview of the selected data per strategy.
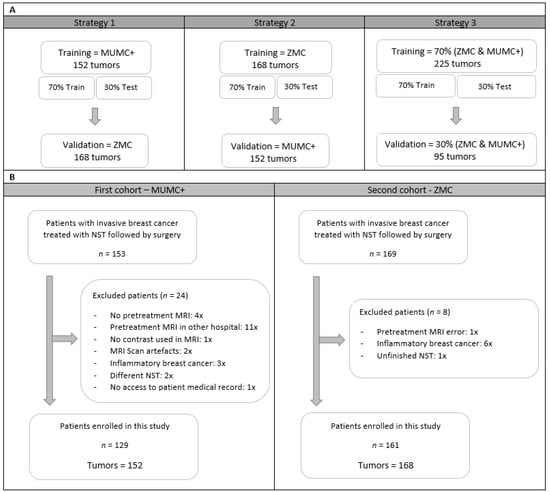
Figure 1.
An overview of training, test, and validation data cohorts for the three strategies (A) and a flowchart from patient selection for the two different hospitals (B). Abbreviations, MUMC+ = Maastricht University Medical Center+, ZMC = Zuyderland Medical Center, NST = Neoadjuvant Systemic Therapy, MRI = Magnetic Resonance Imaging.
2.3. Clinical and Pathological Data
Clinical and pathological data were retrieved from patients’ medical records and included age, clinical and pathological tumor, nodes, and metastases (TNM) stage, tumor grade, tumor histology, breast cancer subtype, and NST regimen. The majority of patients were treated with an anthracycline- and taxane-based NST regimen; the remaining received a taxane-based only NST regimen. Human epidermal growth factor receptor 2 (HER2) positive tumors received additional treatment with trastuzumab and/or pertuzumab. After completion of NST, all patients underwent breast surgery. The surgical specimens of all patients were evaluated via standard histopathological analysis by breast pathologists in the two participating hospitals. The breast tumor response was assessed by the Miller–Payne or Pinder grading systems [30,31]. In this study, tumors were defined as pCR when classified as grade 5 using the Miller–Payne classification or classified as 1i and 1ii using the Pinder classification (pCR; ductal carcinoma in situ may be present).
2.4. Imaging Data
For all patients, pretreatment MRI exams were collected containing fat-suppressed 3D THRIVE DCE T1-weigthed (T1W), T2-weighted in the MUMC and fat-suppressed T2-weighted in the ZMC, and diffusion weighted imaging sequences. It was decided to only use the peak-enhanced phase of the DCE-T1W images for the radiomics analysis as tumors are best visible on this sequence [32,33]. The DCE-T1W images were obtained before and after intravenous injection of gadolinium-based contrast Gadobutrol (GadovistTM (EU)) with a volume of 15 mL and a flow rate of 2 mL/s. A 105 s temporal resolution protocol was used in the MUMC+ and a 20 s temporal resolution protocol in the ZMC, resulting in five and nineteen post-contrast images for each patient in the MUMC+ and ZMC, respectively. Images were acquired using 1.5T (Ingenia, Intera, and Achieva by Philips Medical system, Best, The Netherlands and Avanto Fit by Siemens, Minhen, Germany) and 3.0T (Skyra by Siemens, Minhen, Germany) MRI scanners. All patients were scanned in prone-position using a dedicated breast-coil. DCE-T1W MRI acquisition protocols from both hospitals can be found in Table 1. Sequence parameters varied per MRI scanner and hospital, reflecting the heterogeneity in medical images used in daily clinical practice.

Table 1.
Scanning Parameters.
2.5. Tumor Segmentation
The images acquired at tumor peak enhancement, at approximately two minutes’ post-contrast administration, were used for the 3D ROI segmentation and further radiomics analysis, as tumors are best assessed on these images. All histologically confirmed invasive tumors were segmented manually using Mirada Medical’s DBx 1.2.0.59 (64-bit, Oxford, UK) software by a medical researcher with three years of experience (RG), supervised by a dedicated breast radiologist with 14 years of experience (ML). During segmentation, the radiology reports were accessible, and adjustment of image grayscale was allowed to optimize the visualization of the tumor. To gauge any bias introduced by inter-observer segmentation variability, 129 tumors from 102 patients acquired at MUMC+ were segmented by four observers independently with different degrees of experience in breast MR imaging (RG, ML, resident with three years of MRI experience (TvN), and a medical student with no experience (NV)) [34].
2.6. Image Pre-Processing and Feature Selection
Image pre-processing of the two-minute postcontrast-T1W images was performed after tumor segmentation using an in-house developed pipeline and using a widely used proposed pre-processing method by Pyradiomics [35,36]. The in-house developed pipeline started first by applying bias field correction to every image using MIM software (version 6.9.4, Cleveland, OH, USA) to correct for nonuniform grayscale intensities in the MRI caused by field inhomogeneities. Second, in order to minimize acquisition-related radiomics variability, voxel dimensions were standardized across the cohorts to arrive at an isotropic voxel resolution of 1 mm3 by means of cubic interpolation [37]. Third, to homogenize arbitrary MRI units and clip image intensities to a certain range, a histogram matching technique was applied, adjusting the pixel values of the MR image such that its histogram matched that of the target MR image from the training data cohort [38,39,40]. Further gray value filtering was applied to generate MRIs with comparable gray value range and to enhance the contrast of the image using the following filtering parameters: window level (WL: 3050) and window width (WW: 2950). Filtering parameters were found when exploring the images after the histogram matching step. Fourth, to reduce high frequency noise and optimize handling of the image, grayscale values were resampled using a fixed bin width of 24, which reduced both image noise and computation times when extracting radiomics features from the ROI [41]. The pre-processing method proposed by Pyradiomics was applied after images’ bias field correction and consisted of z-score normalization, resampling to isotropic voxel resolution of 1 mm3, and image discretization using a bin width of 100 to reach an ideal number of bins between 16 and 128 [12].
For each ROI, 833 features were extracted using the Pyradiomics software (version 3.0). The extracted radiomics features included first-order statistics features (18), shape-based features (14), gray-level co-occurrence matrix features (GLCM) (22), gray-level run length matrix features (GLRLM) (16), gray-level size zone matrix features (GLSZM) (16), neighboring gray tone difference matrix features (NGTDM) (5), and gray-level dependence matrix features (GLDM) (14) from both unfiltered and filtered (eight wavelet decompositions) images.
2.7. Feature Selection and Radiomics Model Development
All feature selection steps followed by model development were performed on the 70% training data for each iteration. First, features sensitive to interobserver segmentation variabilities were removed using an intraclass correlation coefficient (ICC) cut-off value >0.75 (29). Consecutively, features with zero or small variance (with the frequency ratio between the most common value and the second most common value larger than 95/5) were removed. This was followed by the removal of highly correlated features using pairwise Spearman correlation (|r| > 0.90), where from any two highly correlated features, the feature with the highest mean correlation with the rest of the features was removed. Finally, the Boruta algorithm, a random forest feature selection method, was used to select important predictive features [42,43]. The Boruta algorithm duplicated all features and shuffled the values in the so-called shadow features. Random forest classifiers were trained on the real and shadow features, and the algorithm subsequently compared the importance score of each feature and selected only those features where the importance of the real feature was higher compared with the shadow’s feature importance [44]. Random forest classification models were trained on the 70% of the training data and tested on the remaining 30% of the training data. The best performing radiomics models according to the summation of AUC and sensitivity value based on the test data in all strategies were selected and validated on the external validation data. All random forest parameters were set at default (Table S1) values. Figure 2 shows the radiomics workflow used in this study. Additionally, the range of the AUC values in the training data set is presented.
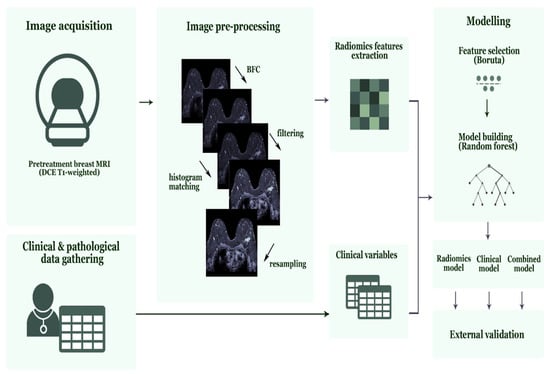
Figure 2.
Radiomics workflow used in this study. Abbreviations, MRI = Magnetic Resonance Imaging, DCE = Dynamic Contrast-Enhanced, BFC = Bias Field Correction.
2.8. Clinical and Combined Model Development
Clinical and combined (based on radiomics features and clinical variables) random forest models were trained, tested, and validated using the same strategy used to develop the radiomics models as described above. Clinical models were based on the available clinical characteristics, including age, clinical tumor stage (cT), clinical nodal stage (cN), clinical tumor grade, tumor histology, and breast cancer subtype. The best performing clinical and combined models according to the summation of AUC and sensitivity value based on the test data in all strategies were selected and validated on the external validation data. All random forest parameters were set as default. Additionally, the range of the AUC values in the training data set was presented.
2.9. Statistical Analysis
Image pre-processing steps were performed in Python (version 3.7) using an in-house developed pipeline based on the computer vision packages opencv (version 4.1.0), SimpleITK (version 1.2.0), and numpy (version 1.16.2) procedure. The remaining statistical analysis, feature selection, model development, and model evaluation were performed in R (version 3.6.3) using R studio (version 1.2.1335, Vienna, Austria) [45] and the R packages Boruta (version 7.0.0), Caret (version 6.0–85), Smotefamily (version 1.3.1), RandomForest (version 4.6–14), and pROC, (version 1.3.1) [46]. The difference between cohorts was assessed using independent samples t-test for continuous normally distributed variables, and Pearson chi-squared test for categorical variables. Statistical significance was based on p-values < 0.05 for both tests. The models developed were evaluated using the AUC and the 95% confidence interval (CI). DeLong’s test was used to compare AUC values. In addition, the sensitivity and specificity and the negative predicted value (NPV) and positive predictive value (PPV) were derived from the confusion matrix. The radiomics quality score (RQS) was used to assess the radiomics workflow [14]. This study checked the Transparent Reporting of a multivariable prediction model for Individual Prognosis or Diagnoses (TRIPOD) guidelines [47,48].
3. Results
3.1. Patients Demographics
A total of 322 women with invasive breast cancer and treated with NST were considered for inclusion, of whom 32 were excluded (Figure 1B). A total of 290 women with 320 breast tumors met the inclusion criteria, of whom 129 women with 152 breast tumors were collected at the MUMC+ and 161 women with 168 breast tumors at the ZMC. Table 2 summarizes the patient and tumor characteristics of both datasets. The pCR rate of the included tumors was 34.9% (53/152) and 29.2% (49/168) in the MUMC+ and ZMC cohorts, respectively, showing no significant difference. There were significant cohort differences in clinical tumor stage, clinical nodal stage, clinical tumor grade, and tumor histology (Table 3). Clinical tumor stage, clinical tumor grade, and breast cancer subtype showed significant differences between pCR and non-pCR tumors within the individual cohorts (Table 3).
Table 2.
Clinical patient and tumor characteristics of patients in both complete data from the Maastricht University Medical Center+ (MUMC+) and Zuyderland Medical Center (ZMC) hospital.
Table 3.
Clinical patient and tumor characteristics of patients in both complete data cohorts on pCR and non-pCR tumors from the Maastricht University Medical Center (MUMC+) and Zuyderland Medical Center (ZMC) hospitals.
The results reported in the manuscript are based on the in-house developed image preprocessing pipeline, whereas the results based on the image pre-processing proposed by Pyradiomics are reported in the Supplementary Materials (Tables S2 and S3 and Figure S1). In both the radiomics and combined models, no significant differences were found (Table S4).
3.2. Radiomics Models—Feature Selection and Model Performance
Of the 833 features extracted per ROI, 87 features were removed, as they were reported to be significantly affected by inter-observer segmentation variability (Table S5). In the best performing radiomics models in all strategies, one feature (firstorder_maximum) was removed, as it showed near zero variance. This was followed by the removal of: 574, 568, and 568 highly correlated features in strategy 1, 2, and 3, respectively, leaving 172, 178, and 178 features in the respective cohorts. The Boruta algorithm selected 5, 1, and 6 features in the best performing radiomics models for strategy 1, 2, and 3, respectively (Table 4A).
Table 4.
Selected features in best performing radiomics, clinical, and combined models for the three strategies.
The results of the best performing radiomics models developed in the three strategies are shown in Table 5A. The AUC values in the validation cohorts were 0.55 (95% CI: 0.46–0.65), 0.52 (95%CI: 0.42–0.62), and 0.50 (95%CI: 0.37–0.64) for the respective strategies 1, 2, and 3. The sensitivity values ranged between 24% and 73% in the validation cohorts. The 100 radiomics models developed in the three strategies resulted in a range of AUC values in the training cohorts between 0.46 and 0.86 (Table S6).
Table 5.
Performance of best performing random forest radiomics (5A), clinical (5B), and combined (5C) models for the three strategies.
3.3. Clinical Models—Feature Selection and Model Performance
The clinical variables available were patient age, cT, cN, clinical tumor grade, tumor histology, and breast cancer subtype. None of the clinical variables were highly correlated. The Boruta algorithm selected four features in the best performing clinical models for all strategies (Table 4B). The results of the clinical models performed in the three settings are shown in Table 5B. The AUC values in the validation cohorts were 0.71 (95% CI: 0.62–0.79), 0.77 (95% CI: 0.70–0.85), and 0.72 (95% CI: 0.61–0.83) for strategy 1, 2, and 3, respectively. The clinical models performed significantly better compared with the radiomics models (Figure 3). The sensitivity values ranged between 41% and 47% in the validation cohorts. The 100 radiomics models developed in the three strategies resulted in a range of AUC values in the training cohorts between 0.68 and 0.88 (Table S6).
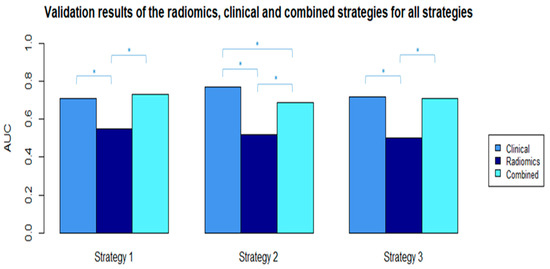
Figure 3.
AUC values from the selected radiomics, clinical, and combined validation models in all strategies. * Significant difference between AUC values with p-value < 0.05 (p-values were calculated using the ROC test by Delong method).
3.4. Combined Models—Feature Selection and Model Performance
Of the 833 features extracted per ROI, 87 features were removed, as they were reported to be significantly affected by inter-observer segmentation variability. In the best performing combined models in all strategies, one feature (firstorder_maximum) was removed, as it showed near zero variance. This was followed by the removal of 580, 563, and 577 highly correlated features in strategy 1, 2 and 3, respectively, leaving 172, 189, and 175 features in the respective cohorts. The Boruta algorithm selected 7, 4, and 6 features in the best performing radiomics models for strategy 1, 2, and 3, respectively (Table 4C). The three models all contained the same clinical features, clinical tumor grade, and clinical breast cancer subtype. The results of the best performing combined models developed in the three strategies are shown in Table 5C. The AUC values in the validation cohorts were 0.73 (95% CI: 0.65–0.81), 0.69 (95%CI: 0.61–0.78), and 0.71 (95%CI: 0.60–0.81) for the respective strategies 1, 2, and 3. The sensitivity values ranged between 38% and 51% in the validation cohorts. The 100 radiomics models developed in the three strategies resulted in a range of AUC values in the training cohorts between 0.59 and 0.91 (Table S6).
3.5. RQS and TRIPOD Results
4. Discussion
In this multicenter study, we investigated the value of pretreatment contrast-enhanced MRI-based radiomics for the prediction of pCR to NST in breast cancer patients using radiomics, clinical, and combined models in three different data-mixing strategies. The AUC values of the radiomics, clinical, and combined models in the validation datasets of the three strategies had ranges of 0.50–0.55, 0.71–0.77, and 0.69–0.73, respectively. Different radiomics features were selected for the radiomics and combined models in the three strategies, while the selected clinical features were mostly the same in all scenarios, with comparable performances. These results indicate poor performance of the radiomics features and that the radiomic features had no added value to the clinical models developed for the prediction of pCR to NST in breast cancer patients.
The clinical models significantly outperformed the radiomics models for the prediction of pCR to NST in all strategies. This indicates that radiomics features in these scenarios did not have an added value to the clinical model we developed. Furthermore, the variation in the features selected and model performance was greater in the radiomics models compared with the clinical models. However, based on current knowledge in the radiomics field, we cannot say that radiomics features do not have an added value unless the variations in acquisition and reconstruction parameters are properly addressed. Due to the lack of reproducibility data, this study could not analyze the effects of different acquisition and reconstruction parameters on radiomics feature values. Furthermore, the significant differences in population characteristics between the two cohorts could have led to the low performance of the radiomics models. While there was overlap in breast cancer phenotypes, the proportions at which these phenotypes occur may have differed so that the differences in prevalence resulted in differences in overall classification performances.
The results of this study indicate that even extensive MRI pre-processing and homogenization of the MR images do not sufficiently address the variations in acquisition and reconstruction parameters. This is in line with studies published in recent years that investigated the reproducibility of MRI radiomics features in test-retest phantom data as well as in patient data of varying disease sites, and showed that, among others, the variations in acquisition and reconstruction parameters strongly influence the values (concordance) of radiomics features [24,27,28,29,49,50,51,52]. Shur et al. [29] performed a test-retest 1.5T MRI phantom study using the same imaging protocol and showed that 20% of the examined features were not repeatable. A study on repeatability and reproducibility using a T2W pelvic phantom showed that radiomics features values are not only affected by varying acquisition parameters but also by the use of different MRI vendors and magnetic field strengths, wherein the reproducibility of the radiomic features is more affected by difference in MRI vendor than by difference in magnetic field strength [49]. Overall, they reported that only 3.3% (31/944) of the examined features showed excellent robustness (ICC and CCC > 0.9). The radiomics community is currently trying to address these major hurdles.
Investigating comparable published work, we found a number of studies using only univariate predictive features without an external validation data cohort [18,19,20,21,53,54] and more recent published papers that were focusing on multivariate prediction models [32,33,55,56]. Hope Cain et al. [55] achieved an AUC value of 0.71 (95% CI: 0.58–0.83) for predicting pCR to NST in TN/HER2+ breast cancer patients; however, the model was not externally validated. Therefore, we anticipate that the results could not be generalized to scans acquired with different vendors/parameters than those used in the study. The study by Liu et al. [57] was the only study performing external radiomics model validation for the prediction of pCR to NST in breast cancer patients. The study differed from our research by the use of multiparametric (T2-weighted, diffusion-weighted images, and contrast-enhanced T1-weighted) MRI. However, the use of multiple MRI sequences for pCR prediction achieved better outcome with validation AUC values between 0.71 and 0.80. However, it is remarkable that their external validation results were obtained with MRI images that were much less extensively pre-processed compared to our images.
Our study also has its limitations. First, selection bias in retrospective studies is inevitable and so are the biases introduced by clinical protocols, such as HER2+ tumors receiving additional treatment compared to other tumors. Second, since the effect of different MRI scanners and acquisition and reconstruction parameters on radiomics features in breast imaging is not determined, we could not adjust our model for the potential variance induced by these factors in the radiomics feature values. Therefore, since data were collected from two hospitals using five MRI scanners with different acquisition and reconstruction parameters, noise may have been introduced into the models by incorporating radiomics features not robust to these variations. Third, while we believe that MRI preprocessing is a necessary step toward comparable images with intensity values having similar tissue meaning, it is possible that with our choice of preprocessing steps, consistent with current literature, we may have inadvertently removed quantitative information. However, the results obtained with the widely used pre-processing method proposed by Pyradiomics showed no significant differences from the result reported here. Fourth, the number of patients included in this study did not allow us to perform a subanalysis for the different breast cancer subtypes. Fifth, the data were collected over a relatively long period of time during which optimization of MRI acquisitions protocols occurred, which may have introduced variations as well. Last, for these analyses it was specifically chosen to use the peak-enhanced (2 min) post-contrast T1W images, as breast tumors are most visible on them and because some of the tumors included cannot be seen on other sequences; for example, mucinous tumors and some of the invasive lobular tumors are not or only weakly visible on the subtraction images. In our opinion, performing the analysis using the subtraction images instead of the peak-enhanced images would have resulted in a significant decrement in the number of patients that could be analyzed. Furthermore, as the effects of the different breast MRI sequences on the radiomics features is not yet understood, future radiomics research in the field of breast cancer could focus on the use of the different MRI sequences, as well as on multiparametric and delta radiomics approaches.
5. Conclusions
In conclusion, this study showed no contribution of pretreatment contrast-enhanced MRI-based radiomics for the prediction of tumor pCR on NST in breast cancer patients, as neither the radiomics nor the combined models performed significantly better than the clinical models. However, without analysis of the effects of variations in acquisition and reconstruction parameters, it is currently not possible to conclude that pretreatment contrast-enhanced MRI-based radiomic features have no value in the prediction of pCR to NST. The effects of different acquisition and reconstruction parameters on radiomics feature values in breast imaging should be explored in future MRI-breast reproducibility studies to investigate whether further research into pretreatment MRI-based radiomics for the prediction of pCR to NST in breast cancer patients is useful.
Supplementary Materials
The following are available online at https://www.mdpi.com/article/10.3390/cancers13102447/s1, Supplementary Materials include Table S1: Default random forest parameters, Table S2: Selected features using the proposed image pre-processing method by Pyradiomics, Table S3: Results of the best performing models using the proposed image pre-processing method by Pyradiomics, Figure S1: Comparisons of the validation AUC values using the proposed image pre-processing method by Pyradiomics, Table S4: Comparison of the validation results of both pre-processing methods, Table S5: List of excluded features affected by inter-observer segmentation variability, Table S6: Ranked AUC values of the 100 radiomics, clinical, and combined trainings models for the three strategies, Table S7: Radiomics Quality Score, and Table S8: TRIPOD Checklist.
Author Contributions
Conceptualization, R.W.Y.G.; methodology, R.W.Y.G. and A.I.; software, S.P.P.; validation, R.W.Y.G., and A.I.; formal analysis, R.W.Y.G., A.I., and H.C.W.; investigation, R.W.Y.G.; resources, R.W.Y.G., S.S. and T.J.A.v.N.; data curation, R.W.Y.G., T.J.A.v.N., and M.B.I.L.; writing—original draft preparation, R.W.Y.G. and A.I.; writing—review and editing, all authors; visualization, R.W.Y.G. and S.P.P.; supervision, M.L.S. and H.C.W.; project administration, R.W.Y.G.; funding acquisition, M.L.S. All authors have read and agreed to the published version of the manuscript.
Funding
Renée W.Y. received a salary from Kankeronderzoekfonds Limburg. Authors acknowledge financial support from an ERC advanced grant (ERC-ADG-2015 n° 694812–Hypoximmuno). Authors also acknowledge financial support from the European Union’s Horizon 2020 research and innovation programme under grant agreement: MSCA-ITN-PREDICT n° 766276, CHAIMELEON n° 952172 and EuCanImage n° 952103.
Institutional Review Board Statement
The study was conducted according to the guidelines of the Declaration of Helsinki and was approved by the Institutional Review Board (or Ethics Committee) of the University Hospital Maastricht and Maastricht University (METC azM/UM) (Ethic code: 2017-0152 with date of approval 12 October 2017).
Informed Consent Statement
Patient consent was waived due to the retrospective design of the study.
Data Availability Statement
The data presented in this study are available on reasonable request from the corresponding author. Due to privacy restrictions the data are not publicly available.
Conflicts of Interest
P.L. reports, within the submitted work, grants/sponsored research agreements from radiomics SA, ptTheragnostic/DNAmito, Health Innovation Ventures. He received an advisor/presenter fee and/or reimbursement of travel costs/consultancy fee and/or in-kind manpower contribution from radiomics SA, BHV, Varian, Elekta, ptTheragnostic, BMS. Dr Lambin has minority shares in the company radiomics SA, MedC2; he is co-inventor of two issued patents with royalties on radiomics (PCT/NL2014/050248, PCT/NL2014/050728) licensed to Radiomics SA; three non-patented invention (software) licensed to ptTheragnostic/DNAmito, Radiomics SA, and Health Innovation Ventures; and non-licensed patents on a Lymphocytes Sparing radiotherapy (P126537PC00), Radiomics hypoxia: P125078US00, Image preprocessing for AI (P124711PC00). He confirms that none of the above entities or funding was involved in the preparation of this paper. The other authors declare no conflict of interest.
References
- Vugts, G.; Maaskant-Braat, A.J.; Nieuwenhuijzen, G.A.; Roumen, R.M.; Luiten, E.J.; Voogd, A.C. Patterns of Care in the Administration of Neo-adjuvant Chemotherapy for Breast Cancer. A Population-Based Study. Breast J. 2016, 22, 316–321. [Google Scholar] [CrossRef] [PubMed]
- Murphy, B.L.; Day, C.N.; Hoskin, T.L.; Habermann, E.B.; Boughey, J.C. Neoadjuvant Chemotherapy Use in Breast Cancer is Greatest in Excellent Responders: Triple-Negative and HER2+ Subtypes. Ann. Surg. Oncol. 2018, 25, 2241–2248. [Google Scholar] [CrossRef] [PubMed]
- Spronk, P.E.R.; de Ligt, K.M.; van Bommel, A.C.M.; Vrancken Peeters, M.T.F.D.; Siesling, S.; Smorenburg, C.H. Current decisions on neoadjuvant chemotherapy for early breast cancer: Experts’ experiences in the Netherlands. Patient Educ. Couns. 2018, 101, 2111–2115. [Google Scholar] [CrossRef]
- Loibl, S.; Denkert, C.; von Minckwitz, G. Neoadjuvant treatment of breast cancer—Clinical and research perspective. Breast 2015, 24, S73–S77. [Google Scholar] [CrossRef] [PubMed]
- Prevos, R.; Smidt, M.L.; Tjan-Heijnen, V.C.; van Goethem, M.; Beets-Tan, R.G.; Wildberger, J.E.; Lobbes, M.B.I. Pre-treatment differences and early response monitoring of neoadjuvant chemotherapy in breast cancer patients using magnetic resonance imaging: A systematic review. Eur. Radiol. 2012, 22, 2607–2616. [Google Scholar] [CrossRef] [PubMed]
- Lobbes, M.B.; Prevos, R.; Smidt, M.; Tjan-Heijnen, V.C.G.; van Goethem, M.; R Schipper, R.; Beets-Tan, R.G.; Wildberger, J.E. The role of magnetic resonance imaging in assessing residual disease and pathologic complete response in breast cancer patients receiving neoadjuvant chemotherapy: A systematic review. Insights Imaging 2013, 4, 163–175. [Google Scholar] [CrossRef] [PubMed]
- Weber, J.J.; Jochelson, M.S.; Eaton, A.; Zabor, E.C.; Barrio, A.V.; Gemignani, M.L.; Pilewskie, M.; Van Zee, K.J.; Morrow, M.; El-Tamer, M. MRI and Prediction of Pathologic Complete Response in the Breast and Axilla after Neoadjuvant Chemotherapy for Breast Cancer: MRI and Pathologic Complete Response. J. Am. Coll. Surg. 2017, 225, 740–746. [Google Scholar] [CrossRef] [PubMed]
- Bouzon, A.; Acea, B.; Soler, R.; Iglesias, A.; Santiago, P.; Mosquera, J.; Calvo, L.; Seoane-Pillado, T.; García, A. Diagnostic accuracy of MRI to evaluate tumour response and residual tumour size after neoadjuvant chemotherapy in breast cancer patients. Radiol. Oncol. 2016, 50, 73–79. [Google Scholar] [CrossRef] [PubMed]
- van der Noordaa, M.E.M.; van Duijnhoven, F.H.; Loo, C.E.; van Werkhoven, E.; van de Vijver, K.K.; Wiersma, T.; Winter-Warnars, H.A.O.; Sonke, G.S.; Vrancken Peeters, M.T.F.D. Identifying pathologic complete response of the breast after neoadjuvant systemic therapy with ultrasound guided biopsy to eventually omit surgery: Study design and feasibility of the MICRA trial (Minimally Invasive Complete Response Assessment). Breast 2018, 40, 76–81. [Google Scholar] [CrossRef] [PubMed]
- Heil, J.; Sinn, P.; Richter, H.; Pfob, A.; Schaefgen, B.; Hennigs, A.; Riedel, F.; Thomas, B.; Thill, M.; Hahn, M.; et al. RESPONDER—Diagnosis of pathological complete response by vacuum-assisted biopsy after neoadjuvant chemotherapy in breast Cancer—A multicenter, confirmative, one-armed, intra-individually-controlled, open, diagnostic trial. BMC Cancer 2018, 18, 851. [Google Scholar] [CrossRef] [PubMed]
- van Loevezijn, A.A.; van der Noordaa, M.E.; van Werkhoven, E.D.; Loo, C.E.; Winter-Warnars, G.A.; Wiersma, T.; van de Vijver, K.K.; Groen, E.J.; Blanken-Peeters, C.F.; Zonneveld, B.J.; et al. Minimally Invasive Complete Response Assessment of the Breast After Neoadjuvant Systemic Therapy for Early Breast Cancer (MICRA trial): Interim Analysis of a Multicenter Observational Cohort Study. Ann. Surg. Oncol. 2020. [Google Scholar] [CrossRef]
- van Griethuysen, J.J.M.; Fedorov, A.; Parmar, C.; Hosny, A.; Aucoin, N.; Narayan, V.; Beets-Tan, R.G.H.; Fillion-Robin, J.-C.; Pieper, S.; Aerts, H.J.W.L. Computational Radiomics System to Decode the Radiographic Phenotype. Cancer Res. 2017, 77, e104–e107. [Google Scholar] [CrossRef] [PubMed]
- Ibrahim, A.; Primakov, S.; Beuque, M.; Woodruff, H.C.; Halilaj, I.; Wu, G.; Refaee, T.; Granzier, R.; Widaatalla, Y.; Hustinx, R.; et al. Radiomics for precision medicine: Current challenges, future prospects, and the proposal of a new framework. Methods 2021, 188, 20–29. [Google Scholar] [CrossRef] [PubMed]
- Lambin, P.; Leijenaar, R.T.H.; Deist, T.M.; Peerlings, J.; de Jong, E.E.C.; van Timmeren, J.; Sanduleanu, S.; Larue, R.T.H.M.; Even, A.J.G.; Jochems, J.; et al. Radiomics: The bridge between medical imaging and personalized medicine. Nat. Rev. Clin. Oncol. 2017, 14, 749–762. [Google Scholar] [CrossRef]
- Larue, R.T.; Defraene, G.; De Ruysscher, D.; Lambin, P.; van Elmpt, W. Quantitative radiomics studies for tissue characterization: A review of technology and methodological procedures. Br. J. Radiol. 2017, 90, 20160665. [Google Scholar] [CrossRef]
- Wu, G.; Ibrahim, A.; Halilaj, I.; Leijenaar, R.T.; Rogers, W.; Gietema, H.A.; Hendriks, L.E.; Lambin, P.; Woodruff, H.C. The Emerging Role of Radiomics in COPD and Lung Cancer. Respiration 2020, 99, 99–107. [Google Scholar]
- Ahmed, A.; Gibbs, P.; Pickles, M.; Turnbull, L. Texture analysis in assessment and prediction of chemotherapy response in breast cancer. J. Magn. Reson. Imaging 2013, 38, 89–101. [Google Scholar] [CrossRef]
- Parikh, J.; Selmi, M.; Charles-Edwards, G.; Glendenning, J.; Ganeshan, B.; Verma, H.; Mansi, J.; Harries, M.; Tutt, A.; Goh, V. Changes in primary breast cancer heterogeneity may augment midtreatment MR imaging assessment of response to neoadjuvant chemotherapy. Radiology 2014, 272, 100–112. [Google Scholar] [CrossRef]
- Teruel, J.R.; Heldahl, M.G.; Goa, P.E.; Pickles, M.; Lundgren, S.; Bathen, T.F.; Gibbs, P. Dynamic contrast-enhanced MRI texture analysis for pretreatment prediction of clinical and pathological response to neoadjuvant chemotherapy in patients with locally advanced breast cancer. NMR Biomed. 2014, 27, 887–896. [Google Scholar] [CrossRef]
- Chamming’s, F.; Ueno, Y.; Ferre, R.; Kao, E.; Jannot, A.-S.; Chong, J.; Omeroglu, A.; Mesurolle, B.; Reinhold, C.; Gallix, B. Features from Computerized Texture Analysis of Breast Cancers at Pretreatment MR Imaging Are Associated with Response to Neoadjuvant Chemotherapy. Radiology 2018, 286, 412–420. [Google Scholar] [CrossRef]
- Yoon, H.J.; Kim, Y.; Chung, J.; Kim, B.S. Predicting neo-adjuvant chemotherapy response and progression-free survival of locally advanced breast cancer using textural features of intratumoral heterogeneity on F-18 FDG PET/CT and diffusion-weighted MR imaging. Breast J. 2019, 25, 373–380. [Google Scholar] [CrossRef] [PubMed]
- Baessler, B.; Weiss, K.; Pinto Dos Santos, D. Robustness and Reproducibility of Radiomics in Magnetic Resonance Imaging: A Phantom Study. Investig. Radiol. 2019, 54, 221–228. [Google Scholar] [CrossRef] [PubMed]
- Mackin, D.; Fave, X.; Zhang, L.; Fried, D.; Yang, J.; Taylor, B.; Rodriguez-Rivera, E.; Dodge, C.; Jones, A.K.; Court, L. Measuring CT scanner variability of radiomics features. Investig. Radiol. 2015, 50, 757. [Google Scholar] [CrossRef]
- Rai, R.; Holloway, L.C.; Brink, C.; Field, M.; Christiansen, R.L.; Sun, Y.; Barton, M.B.; Liney, G.P. Multicenter evaluation of MRI-based radiomic features: A phantom study. Med. Phys. 2020, 47, 3054–3063. [Google Scholar] [CrossRef] [PubMed]
- Ibrahim, A.; Refaee, T.; Primakov, S.; Barufaldi, B.; Acciavatti, R.J.; Granzier, R.W.Y.; Hustinx, R.; Mottaghy, F.M.; Woodruff, H.C.; Wildberger, J.E.; et al. The Effects of In-Plane Spatial Resolution on CT-Based Radiomic Features’ Stability with and without ComBat Harmonization. Cancers 2021, 13, 1848. [Google Scholar] [CrossRef] [PubMed]
- Ibrahim, A.; Refaee, T.; Leijenaar, R.T.H.; Primakov, S.; Hustinx, R.; Mottaghy, F.M.; Woodruff, H.C.; Maidment, A.D.A.; Lambin, P. The application of a workflow integrating the variable reproducibility and harmonizability of radiomic features on a phantom dataset. PLoS ONE 2021, 16, e0251147. [Google Scholar] [CrossRef] [PubMed]
- Dreher, C.; Kuder, T.A.; Konig, F.; Mlynarska-Bujny, A.; Tenconi, C.; Paech, D.; Schlemmer, H.-P.; Ladd, M.E.; Bickelhaupt, S. Radiomics in diffusion data: A test-retest, inter- and intra-reader DWI phantom study. Clin. Radiol. 2020, 75, 798.e13–798.e22. [Google Scholar] [CrossRef]
- Peerlings, J.; Woodruff, H.C.; Winfield, J.M.; Ibrahim, A.; Van Beers, B.E.; Heerschap, A.; Jackson, A.; Wildberger, J.E.; Mottaghy, F.M.; DeSouza, N.M.; et al. Stability of radiomics features in apparent diffusion coefficient maps from a multi-centre test-retest trial. Sci. Rep. 2019, 9, 4800. [Google Scholar] [CrossRef]
- Shur, J.; Blackledge, M.; D′Arcy, J.; Collins, D.J.; O’Leach, M.; Koh, D.-M. MRI texture feature repeatability and image acquisition factor robustness, a phantom study and in silico study. Eur. Radiol. Exp. 2021, 5, 1–11. [Google Scholar] [CrossRef]
- Ogston, K.N.; Miller, I.D.; Payne, S.; Hutcheon, A.W.; Sarkar, T.K.; Smith, I.; Schofield, A.; Heys, S.D. A new histological grading system to assess response of breast cancers to primary chemotherapy: Prognostic significance and survival. Breast 2003, 12, 320–327. [Google Scholar] [CrossRef]
- Pinder, S.E.; Provenzano, E.; Earl, H.; Ellis, I.O. Laboratory handling and histology reporting of breast specimens from patients who have received neoadjuvant chemotherapy. Histopathology 2007, 50, 409–417. [Google Scholar] [CrossRef] [PubMed]
- Fan, M.; Wu, G.; Cheng, H.; Zhang, J.; Shao, G.; Li, L. Radiomic analysis of DCE-MRI for prediction of response to neoadjuvant chemotherapy in breast cancer patients. Eur. J. Radiol. 2017, 94, 140–147. [Google Scholar] [CrossRef] [PubMed]
- Braman, N.; Etesami, M.; Prasanna, P.; Dubchuk, C.; Gilmore, H.; Tiwari, P.; Plecha, D.; Madabhushi, A. Intratumoral and peritumoral radiomics for the pretreatment prediction of pathological complete response to neoadjuvant chemotherapy based on breast DCE-MRI. Breast Cancer Res. 2017, 19, 57. [Google Scholar] [CrossRef] [PubMed]
- Granzier, R.W.Y.; Verbakel, N.M.H.; Ibrahim, A.; van Timmermen, J.E.; van Nijnatten, T.J.A.; Leijenaar, R.T.H.; Lobbes, M.B.I.; Smidt, M.L.; Woodruff, H.C. MRI-based radiomics in breast cancer: Feature robustness with respect to inter-observer segmentation variability. Sci. Rep. 2020, 10, 14163. [Google Scholar] [CrossRef]
- Nyul, L.G.; Udupa, J.K.; Zhang, X. New variants of a method of MRI scale standardization. IEEE Trans. Med. Imaging 2000, 19, 143–150. [Google Scholar] [CrossRef]
- Hoebel, K.V.; Patel, J.B.; Beers, A.L.; Chang, K.; Singh, P.; Brown, J.M.; Pinho, M.C.; Batchelor, T.T.; Gerstner, E.R.; Rosen, B.R.; et al. Radiomics Repeatability Pitfalls in a Scan-Rescan MRI Study of Glioblastoma. Radiol. Artif. Intell. 2021, 3, e190199. [Google Scholar] [CrossRef] [PubMed]
- Ligero, M.; Jordi-Ollero, O.; Bernatowicz, K.; Garcia-Ruiz, A.; Delgado-Muñoz, E.; Leiva, D.; Mast, R.; Suarez, C.; Sala-Llonch, R.; Calvo, N.; et al. Minimizing acquisition-related radiomics variability by image resampling and batch effect correction to allow for large-scale data analysis. Eur. Radiol. 2021, 31, 1460–1470. [Google Scholar] [CrossRef]
- Moradmand, H.; Aghamiri, S.M.R.; Ghaderi, R. Impact of image preprocessing methods on reproducibility of radiomic features in multimodal magnetic resonance imaging in glioblastoma. J. Appl. Clin. Med. Phys. 2020, 21, 179–190. [Google Scholar] [CrossRef]
- Sun, X.; Shi, L.; Luo, Y.; Yang, W.; Li, H.; Liang, P.; Li, K.; Mok, V.C.T.; Chu, W.C.W.; Wang, D. Histogram-based normalization technique on human brain magnetic resonance images from different acquisitions. Biomed. Eng. Online 2015, 14, 73. [Google Scholar] [CrossRef]
- Senthilkumaran, N.; Thimmiaraja, J. Histogram Equalization for Image Enhancement Using MRI Brain Images. In Proceedings of the 2014 World Congress on Computing and Communication Technologies, Trichirappalli, India, 27 February–1 March 2014; pp. 80–83. [Google Scholar]
- Duron, L.; Balvay, D.; Vande Perre, S.; Bouchouicha, A.; Savatovsky, J.; Sadik, J.-C.; Thomassin-Naggara, I.; Fournier, L.; Lecler, A. Gray-level discretization impacts reproducible MRI radiomics texture features. PLoS ONE 2019, 14, e0213459. [Google Scholar]
- Kursa, M.B.; Rudnicki, W.R. Feature Selection with the Boruta Package. J. Stat. Softw. 2010, 36, 1–13. [Google Scholar] [CrossRef]
- Kursa, M.B.; Jankowski, A.; Rudnicki, W.R. Boruta—A System for Feature Selection. Fund. Inform. 2010, 101, 271–286. [Google Scholar] [CrossRef]
- Svetnik, V.; Liaw, A.; Tong, C.; Culberson, J.C.; Sheridan, R.P.; Feuston, B.P. Random forest: A classification and regression tool for compound classification and QSAR modeling. J. Chem. Inf. Comput. Sci. 2003, 43, 1947–1958. [Google Scholar] [CrossRef]
- Racine, J.S. RStudio: A platform-independent IDE for R and Sweave. J. Appl. Econom. 2012, 27, 167–172. [Google Scholar] [CrossRef]
- Robin, X.; Turck, N.; Hainard, A.; Tiberti, N.; Lisacek, F.; Sanchez, J.-C.; Müller, M. pROC: An open-source package for R and S+ to analyze and compare ROC curves. BMC Bioinform. 2011, 12, 77. [Google Scholar] [CrossRef] [PubMed]
- Moons, K.G.; Altman, D.G.; Reitsma, J.B.; Ioannidis, J.P.A.; Macaskill, P.; Steyerberg, E.W.; Vickers, A.J.; Ransohoff, D.F.; Collins, G.S. Transparent Reporting of a multivariable prediction model for Individual Prognosis or Diagnosis (TRIPOD): Explanation and elaboration. Ann. Intern. Med. 2015, 162, W1–W73. [Google Scholar] [CrossRef]
- Collins, G.S.; Reitsma, J.B.; Altman, D.G.; Moons, K.G. Transparent reporting of a multivariable prediction model for individual prognosis or diagnosis (TRIPOD): The TRIPOD Statement. BMC Med. 2015, 13, 1. [Google Scholar] [CrossRef]
- Bianchini, L.; Botta, F.; Origgi, D.; Rizzo, S.; Mariani, M.; Summers, P.; García-Polo, P.; Cremonesi, M.; Lascialfari, A. PETER PHAN: An MRI phantom for the optimisation of radiomic studies of the female pelvis. Phys. Med. 2020, 71, 71–81. [Google Scholar] [CrossRef]
- Schwier, M.; van Griethuysen, J.; Vangel, M.G.; Pieper, S.; Peled, S.; Tempany, C.; Aerts, H.J.W.L.; Kikinis, R.; Fennessy, F.M.; Fedorov, A. Repeatability of Multiparametric Prostate MRI Radiomics Features. Sci. Rep. 2019, 9, 9441. [Google Scholar] [CrossRef]
- Fiset, S.; Welch, M.L.; Weiss, J.; Pintilie, M.; Conway, J.L.; Milosevic, M.; Fyles, A.; Traverso, A.; Jaffray, D.; Metser, U.; et al. Repeatability and reproducibility of MRI-based radiomic features in cervical cancer. Radiother. Oncol. 2019, 135, 107–114. [Google Scholar] [CrossRef]
- Scalco, E.; Belfatto, A.; Mastropietro, A.; Rancati, T.; Avuzzi, B.; Messina, A.; Valdagni, R.; Rizzo, G. T2w-MRI signal normalization affects radiomics features reproducibility. Med. Phys. 2020, 47, 1680–1691. [Google Scholar] [CrossRef] [PubMed]
- Choudhery, S.; Gomez-Cardona, D.; Favazza, C.P.; Hoskin, T.L.; Haddad, T.C.; Goetz, M.P.; Boughey, J.C. MRI Radiomics for Assessment of Molecular Subtype, Pathological Complete Response, and Residual Cancer Burden in Breast Cancer Patients Treated With Neoadjuvant Chemotherapy. Acad. Radiol. 2020, in press. [Google Scholar] [CrossRef] [PubMed]
- Henderson, S.; Purdie, C.; Michie, C.; Evans, A.; Lerski, R.; Johnston, M.; Vinnicombe, S.; Thompson, A.M. Interim heterogeneity changes measured using entropy texture features on T2-weighted MRI at 3.0 T are associated with pathological response to neoadjuvant chemotherapy in primary breast cancer. Eur. Radiol. 2017, 27, 4602–4611. [Google Scholar] [CrossRef] [PubMed]
- Cain, E.H.; Saha, A.; Harowicz, M.R.; Marks, J.R.; Marcom, P.K.; Mazurowski, M.A. Multivariate machine learning models for prediction of pathologic response to neoadjuvant therapy in breast cancer using MRI features: A study using an independent validation set. Breast Cancer Res. Treat. 2019, 173, 455–463. [Google Scholar] [CrossRef] [PubMed]
- Xiong, Q.; Zhou, X.; Liu, Z.; Lei, C.; Yang, C.; Zhang, L.; Zhu, T.; Zhuang, X.; Liang, C.; Tian, L.; et al. Multiparametric MRI-based radiomics analysis for prediction of breast cancers insensitive to neoadjuvant chemotherapy. Clin. Transl. Oncol. 2020, 22, 50–59. [Google Scholar] [CrossRef]
- Liu, Z.; Li, Z.; Qu, J.; Zhang, R.; Zhou, X.; Li, L.; Sun, K.; Tang, Z.; Jiang, H.; Li, H.; et al. Radiomics of multi-parametric MRI for pretreatment prediction of pathological complete response to neoadjuvant chemotherapy in breast cancer: A multicenter study. Clin. Cancer Res. 2019, 25, 3538–3547. [Google Scholar] [CrossRef]
Publisher’s Note: MDPI stays neutral with regard to jurisdictional claims in published maps and institutional affiliations. |
© 2021 by the authors. Licensee MDPI, Basel, Switzerland. This article is an open access article distributed under the terms and conditions of the Creative Commons Attribution (CC BY) license (https://creativecommons.org/licenses/by/4.0/).