
Response Prediction and Evaluation Using PET in Patients with Solid Tumors Treated with Immunotherapy

Abstract
:Simple Summary
Abstract
1. Introduction
2. Prediction of Response with PET Using Various Tracers
2.1. 18F-FDG-PET-CT
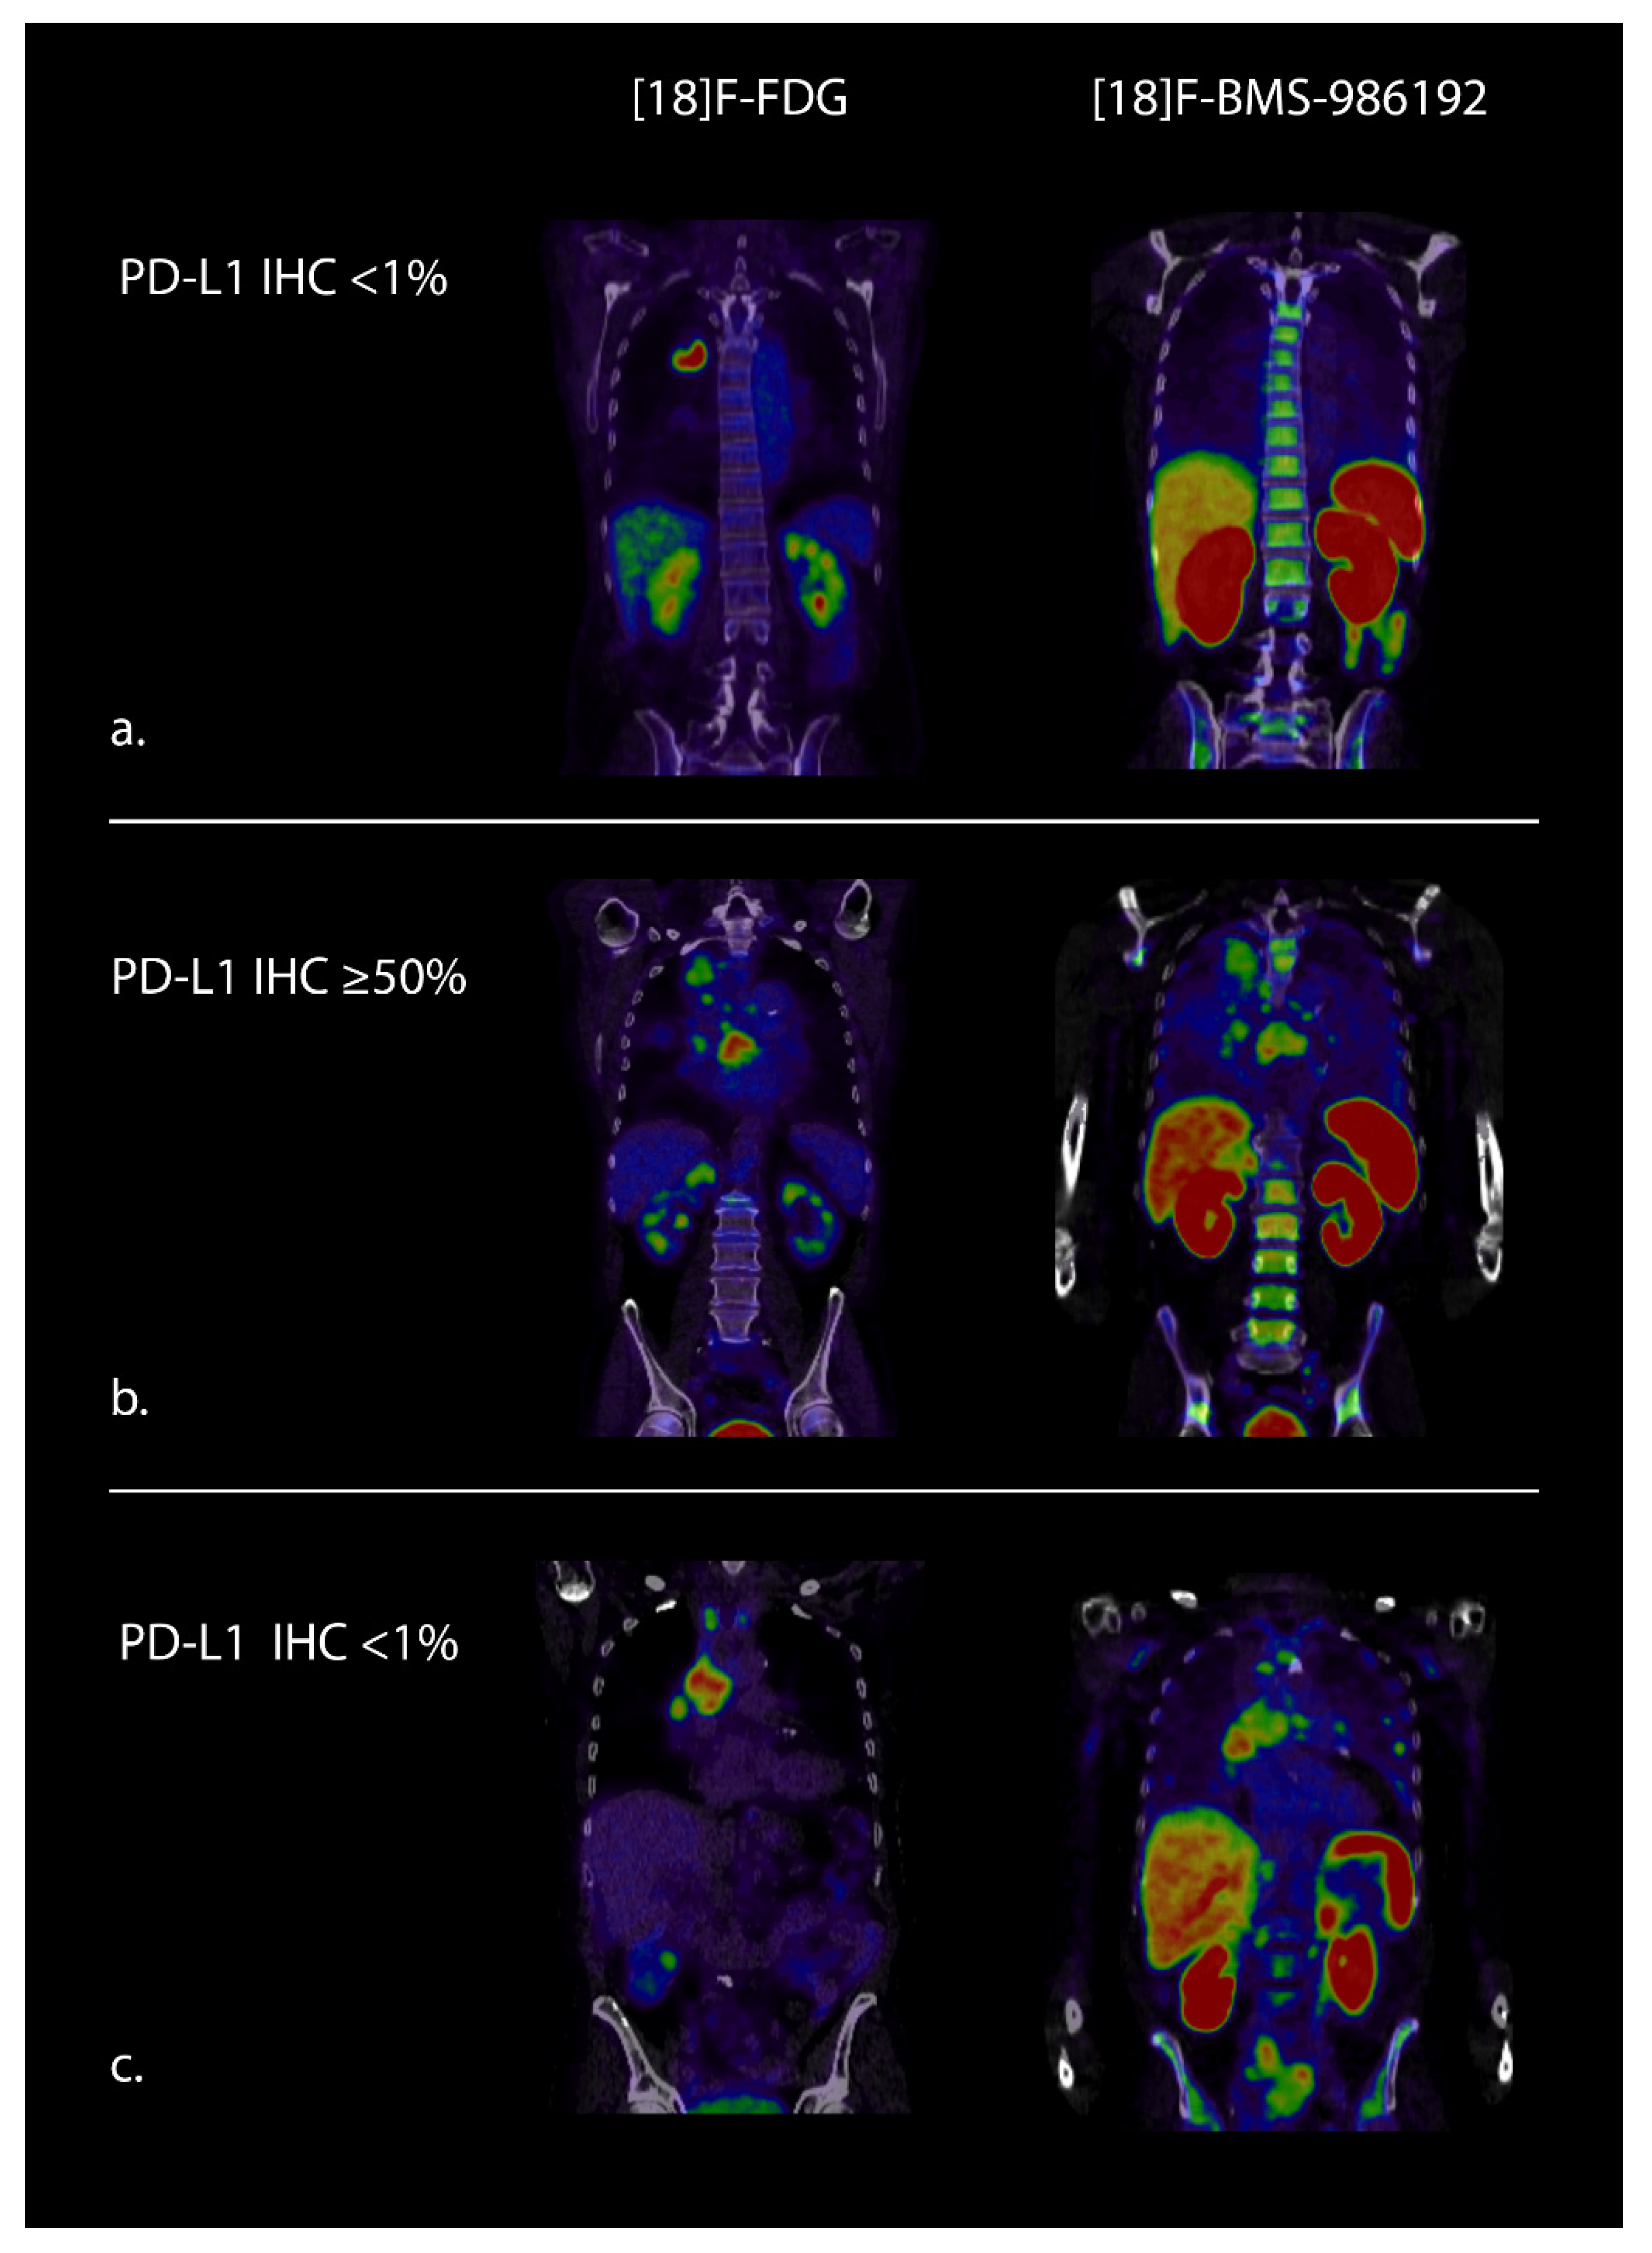
2.2. PD-(L)1 PET
2.3. CD8-PET
3. Early Response Evaluation with PET during Treatment with Checkpoint Inhibitors
4. Value of 18F-FDG-PET in Late Response /Residual Disease Evaluation
- SUV max of the five most intense metastatic lesions was measured at baseline and on the 1-year PET;
- CMR is similar or lower radiotracer uptake than the mediastinal blood pool;
- Bilateral lymphadenopathy with radiotracer uptake on PET was considered a benign sarcoid-like pattern.
5. Radiomics
6. Discussion
7. Conclusions
Author Contributions
Funding
Conflicts of Interest
References
- Reck, M.; Rodríguez-Abreu, D.; Robinson, A.G.; Hui, R.; Csőszi, T.; Fülöp, A.; Gottfried, M.; Peled, N.; Tafreshi, A.; Cuffe, S.; et al. Pembrolizumab versus chemotherapy for PD-L1–positive non–small-cell lung cancer. N. Engl. J. Med. 2016, 375, 1823–1833. [Google Scholar] [CrossRef] [Green Version]
- Gandhi, L.; Rodríguez-Abreu, D.; Gadgeel, S.; Esteban, E.; Felip, E.; De Angelis, F.; Domine, M.; Clingan, P.; Hochmair, M.J.; Powell, S.F.; et al. Pembrolizumab plus chemotherapy in metastatic non–small-cell lung cancer. N. Engl. J. Med. 2018, 378, 2078–2092. [Google Scholar] [CrossRef] [PubMed]
- Paz-Ares, L.; Luft, A.; Vicente, D.; Tafreshi, A.; Gümüş, M.; Mazières, J.; Hermes, B.; Şenler, F. Çay; Csőszi, T.; Fülöp, A.; et al. Pembrolizumab plus chemotherapy for squamous non–small-cell lung cancer. N. Engl. J. Med. 2018, 379, 2040–2051. [Google Scholar] [CrossRef] [PubMed]
- Larkin, J.; Chiarion-Sileni, V.; Gonzalez, R.; Grob, J.J.; Cowey, C.L.; Lao, C.D.; Schadendorf, D.; Dummer, R.; Smylie, M.; Rutkowski, P.; et al. Combined nivolumab and ipilimumab or monotherapy in untreated melanoma. N. Engl. J. Med. 2015, 373, 23–24. [Google Scholar] [CrossRef] [PubMed] [Green Version]
- Robert, C.; Schachter, J.; Long, G.V.; Arance, A.; Grob, J.J.; Mortier, L.; Daud, A.; Carlino, M.S.; McNeil, C.; Lotem, M.; et al. Pembrolizumab versus ipilimumab in advanced melanoma. N. Engl. J. Med. 2015, 372, 2521–2532. [Google Scholar] [CrossRef] [PubMed]
- Borghaei, H.; Paz-Ares, L.; Horn, L.; Spigel, D.R.; Steins, M.; Ready, N.E.; Chow, L.Q.; Vokes, E.E.; Felip, E.; Holgado, E.; et al. Nivolumab versus docetaxel in advanced nonsquamous non–small-cell lung cancer. N. Engl. J. Med. 2015, 373, 1627–1639. [Google Scholar] [CrossRef] [PubMed]
- Brahmer, J.; Reckamp, K.L.; Baas, P.; Crinò, L.; Eberhardt, W.E.; Poddubskaya, E.; Antonia, S.; Pluzanski, A.; Vokes, E.E.; Holgado, E.; et al. Nivolumab versus docetaxel in advanced squamous-cell non–small-cell lung cancer. N. Engl. J. Med. 2015, 373, 123–135. [Google Scholar] [CrossRef] [Green Version]
- Ferris, R.L.; Blumenschein, G., Jr.; Fayette, J.; Guigay, J.; Colevas, A.D.; Licitra, L.; Harrington, K.; Kasper, S.; Vokes, E.E.; Even, C.; et al. Nivolumab for Recurrent Squamous-Cell Carcinoma of the Head and Neck. N. Engl. J. Med. 2016, 375, 1856–1867. [Google Scholar] [CrossRef]
- Cohen, E.E.W.; Soulières, D.; Le Tourneau, C.; Dinis, J.; Licitra, L.; Ahn, M.-J.; Soria, A.; Machiels, J.-P.; Mach, N.; Mehra, R.; et al. Pembrolizumab versus methotrexate, docetaxel, or cetuximab for recurrent or metastatic head-and-neck squamous cell carcinoma (KEYNOTE-040): A randomised, open-label, phase 3 study. Lancet 2019, 393, 156–167. [Google Scholar] [CrossRef]
- Bellmunt, J.; De Wit, R.; Vaughn, D.J.; Fradet, Y.; Lee, J.-L.; Fong, L.; Vogelzang, N.J.; Climent, M.A.; Petrylak, D.P.; Choueiri, T.K.; et al. Pembrolizumab as second-line therapy for advanced urothelial carcinoma. N. Engl. J. Med. 2017, 376, 1015–1026. [Google Scholar] [CrossRef] [Green Version]
- Motzer, R.J.; Escudier, B.; McDermott, D.F.; George, S.; Hammers, H.J.; Srinivas, S.; Tykodi, S.S.; Sosman, J.A.; Procopio, G.; Plimack, E.R.; et al. Nivolumab versus everolimus in advanced renal-cell carcinoma. N. Engl. J. Med. 2015, 373, 1803–1813. [Google Scholar] [CrossRef]
- Sharma, P.; Siefker-Radtke, A.; De Braud, F.; Basso, U.; Calvo, E.; Bono, P.; Morse, M.A.; Ascierto, P.A.; Lopez-Martin, J.; Brossart, P.; et al. Nivolumab alone and with ipilimumab in previously treated metastatic urothelial carcinoma: CheckMate 032 nivolumab 1 mg/kg plus ipilimumab 3 mg/kg expansion cohort results. J. Clin. Oncol. 2019, 37, 1608–1616. [Google Scholar] [CrossRef] [PubMed] [Green Version]
- Haragan, A.; Field, J.K.; Davies, M.P.; Escriu, C.; Gruver, A.; Gosney, J.R. Heterogeneity of PD-L1 expression in non-small cell lung cancer: Implications for specimen sampling in predicting treatment response. Lung Cancer 2019, 134, 79–84. [Google Scholar] [CrossRef] [PubMed] [Green Version]
- McLaughlin, J.K.; Han, G.; Schalper, K.A.; Carvajal-Hausdorf, D.; Pelekanou, V.; Rehman, J.; Velcheti, V.; Herbst, R.S.; Lorusso, P.M.; Rimm, D.L. Quantitative assessment of the heterogeneity of PD-L1 expression in non–small-cell lung cancer. JAMA Oncol. 2016, 2, 46–54. [Google Scholar] [CrossRef] [PubMed]
- Ilié, M.; Long-Mira, E.; Bence, C.; Butori, C.; Lassalle, S.; Bouhlel, L.; Fazzalari, L.; Zahaf, K.; Lalvée, S.; Washetine, K.; et al. Comparative study of the PD-L1 status between surgically resected specimens and matched biopsies of NSCLC patients reveal major discordances: A potential issue for anti-PD-L1 therapeutic strategies. Ann. Oncol. 2016, 27, 147–153. [Google Scholar] [CrossRef] [PubMed]
- Hellmann, M.D.; Ciuleanu, T.-E.; Pluzanski, A.; Lee, J.S.; Otterson, G.A.; Audigier-Valette, C.; Minenza, E.; Linardou, H.; Burgers, S.; Salman, P.; et al. Nivolumab plus ipilimumab in lung cancer with a high tumor mutational burden. N. Engl. J. Med. 2018, 378, 2093–2104. [Google Scholar] [CrossRef]
- Gandara, D.R.; Paul, S.M.; Kowanetz, M.; Schleifman, E.; Zou, W.; Li, Y.; Rittmeyer, A.; Fehrenbacher, L.; Otto, G.; Malboeuf, C.; et al. Blood-based tumor mutational burden as a predictor of clinical benefit in non-small-cell lung cancer patients treated with atezolizumab. Nat. Med. 2018, 24, 1441–1448. [Google Scholar] [CrossRef]
- Wei, W.; Ni, D.; Ehlerding, E.B.; Luo, Q.-Y.; Cai, W. PET Imaging of receptor tyrosine kinases in cancer. Mol. Cancer Ther. 2018, 17, 1625–1636. [Google Scholar] [CrossRef] [Green Version]
- Bensch, F.; Van Der Veen, E.L.; Lub-de Hooge, M.N.; Jorritsma-Smit, A.; Boellaard, R.; Kok, I.C.; Oosting, S.F.; Schröder, C.P.; Hiltermann, T.J.N.; Van Der Wekken, A.J.; et al. 89Zr-atezolizumab imaging as a non-invasive approach to assess clinical response to PD-L1 blockade in cancer. Nat. Med. 2018, 24, 1852–1858. [Google Scholar] [CrossRef]
- Eisenhauer, E.A.; Therasse, P.; Bogaerts, J.; Schwartz, L.H.; Sargent, D.; Ford, R.; Dancey, J.; Arbuck, S.; Gwyther, S.; Mooney, M.; et al. New response evaluation criteria in solid tumours: Revised RECIST guideline (version 1.1). Eur. J. Cancer 2009, 45, 228–247. [Google Scholar] [CrossRef]
- Tazdait, M.; Mezquita, L.; Lahmar, J.; Ferrara, R.; Bidault, F.; Ammari, S.; Balleyguier, C.; Planchard, D.; Gazzah, A.; Soria, J.; et al. Patterns of responses in metastatic NSCLC during PD-1 or PDL-1 inhibitor therapy: Comparison of RECIST 1.1, irRECIST and iRECIST criteria. Eur. J. Cancer 2018, 88, 38–47. [Google Scholar] [CrossRef] [PubMed]
- Wang, G.X.; Kurra, V.; Gainor, J.F.; Sullivan, R.J.; Flaherty, K.T.; Lee, S.I.; Fintelmann, F.J. Immune checkpoint inhibitor cancer therapy: Spectrum of imaging findings. Radiographics 2017, 37, 2132–2144. [Google Scholar] [CrossRef] [PubMed] [Green Version]
- Hodi, F.S.; Hwu, W.-J.; Kefford, R.; Weber, J.S.; Daud, A.; Hamid, O.; Patnaik, A.; Ribas, A.; Robert, C.; Gangadhar, T.C.; et al. Evaluation of immune-related response criteria and RECIST v1.1 in patients with advanced melanoma treated with pembrolizumab. J. Clin. Oncol. 2016, 34, 1510–1517. [Google Scholar] [CrossRef] [PubMed]
- Nishino, M.; Ramaiya, N.H.; Chambers, E.S.; Adeni, A.E.; Hatabu, H.; Jänne, P.A.; Hodi, F.S.; Awad, M.M. Immune-related response assessment during PD-1 inhibitor therapy in advanced non-small-cell lung cancer patients. J. Immunother. Cancer 2016, 4, 84. [Google Scholar] [CrossRef] [Green Version]
- Hammer, M.; Bagley, S.; Aggarwal, C.; Bauml, J.; Nachiappan, A.C.; Simone, C.B., II; Langer, C.; Katz, S.I. Thoracic imaging of non-small cell lung cancer treated with anti-programmed death receptor-1 therapy. Curr. Probl. Diagn. Radiol. 2019, 48, 142–147. [Google Scholar] [CrossRef]
- Seymour, L.; Bogaerts, J.; Perrone, A.; Ford, R.; Schwartz, L.H.; Mandrekar, S.; Lin, N.U.; Litière, S.; Dancey, J.; Chen, A.; et al. iRECIST: Guidelines for response criteria for use in trials testing immunotherapeutics. Lancet Oncol. 2017, 18, e143–e152. [Google Scholar] [CrossRef] [Green Version]
- Takada, K.; Toyokawa, G.; Okamoto, T.; Baba, S.; Kozuma, Y.; Matsubara, T.; Haratake, N.; Akamine, T.; Takamori, S.; Katsura, M.; et al. Metabolic characteristics of programmed cell death-ligand 1-expressing lung cancer on 18 F-fluorodeoxyglucose positron emission tomography/computed tomography. Cancer Med. 2017, 6, 2552–2561. [Google Scholar] [CrossRef]
- Kaira, K.; Shimizu, K.; Kitahara, S.; Yajima, T.; Atsumi, J.; Kosaka, T.; Ohtaki, Y.; Higuchi, T.; Oyama, T.; Asao, T.; et al. 2-Deoxy-2-[fluorine-18] fluoro-d-glucose uptake on positron emission tomography is associated with programmed death ligand-1 expression in patients with pulmonary adenocarcinoma. Eur. J. Cancer 2018, 101, 181–190. [Google Scholar] [CrossRef]
- Lopci, E.; Toschi, L.; Grizzi, F.; Rahal, D.; Olivari, L.; Castino, G.F.; Marchetti, S.; Cortese, N.; Qehajaj, D.; Pistillo, D.; et al. Correlation of metabolic information on FDG-PET with tissue expression of immune markers in patients with non-small cell lung cancer (NSCLC) who are candidates for upfront surgery. Eur. J. Nucl. Med. Mol. Imaging 2016, 43, 1954–1961. [Google Scholar] [CrossRef]
- Wang, Y.; Zhao, N.; Wu, Z.; Pan, N.; Shen, X.; Liu, T.; Wei, F.; You, J.; Xu, W.; Ren, X. New insight on the correlation of metabolic status on 18F-FDG PET/CT with immune marker expression in patients with non-small cell lung cancer. Eur. J. Nucl. Med. Mol. Imaging 2019, 47, 1127–1136. [Google Scholar] [CrossRef]
- Kubota, R.; Yamada, S.; Kubota, K.; Ishiwata, K.; Tamahashi, N.; Ido, T. Intratumoral distribution of fluorine-18-fluorodeoxyglucose in vivo: High accumulation in macrophages and granulation tissues studied by microautoradiography. J. Nucl. Med. 1992, 33, 1972–1980. [Google Scholar]
- Grizzi, F.; Castello, A.; Lopci, E. Is it time to change our vision of tumor metabolism prior to immunotherapy? Eur. J. Nucl. Med. Mol. Imaging 2018, 45, 1072–1075. [Google Scholar] [CrossRef]
- Jreige, M.; Letovanec, I.; Chaba, K.; Renaud, S.; Rusakiewicz, S.; Cristina, V.; Peters, S.; Krueger, T.; De Leval, L.; Kandalaft, L.E.; et al. 18F-FDG PET metabolic-to-morphological volume ratio predicts PD-L1 tumour expression and response to PD-1 blockade in non-small-cell lung cancer. Eur. J. Nucl. Med. Mol. Imaging 2019, 46, 1859–1868. [Google Scholar] [CrossRef] [PubMed]
- Seban, R.-D.; Mezquita, L.; Berenbaum, A.; Dercle, L.; Botticella, A.; Le Pechoux, C.; Caramella, C.; Deutsch, E.; Grimaldi, S.; Adam, J.; et al. Baseline metabolic tumor burden on FDG PET/CT scans predicts outcome in advanced NSCLC patients treated with immune checkpoint inhibitors. Eur. J. Nucl. Med. Mol. Imaging 2019, 47, 1147–1157. [Google Scholar] [CrossRef] [PubMed]
- Evangelista, L.; Cuppari, L.; Menis, J.; Bonanno, L.; Reccia, P.; Frega, S.; Pasello, G. 18f-Fdg Pet/Ct in non-small-cell lung cancer patients: A potential predictive biomarker of response to immunotherapy. Nucl. Med. Commun. 2019, 40, 802–807. [Google Scholar] [CrossRef] [PubMed]
- Ito, K.; Teng, R.; Schoder, H.; Weber, W. Prognostic value of total lesion glycolysis on pretreatment F-18 FDG PET/CT in patients with advanced NSCLC treated with nivolumab. J. Nucl. Med. 2018, 59 (Suppl. 1), 206. [Google Scholar]
- Hashimoto, K.; Kaira, K.; Yamaguchi, O.; Mouri, A.; Shiono, A.; Miura, Y.; Murayama, Y.; Kobayashi, K.; Kagamu, H.; Kuji, I. Potential of FDG-PET as prognostic significance after anti-pd-1 antibody against patients with previously treated non-small Cell Lung Cancer. J. Clin. Med. 2020, 9, 725. [Google Scholar] [CrossRef] [PubMed] [Green Version]
- Takada, K.; Toyokawa, G.; Yoneshima, Y.; Tanaka, K.; Okamoto, I.; Shimokawa, M.; Wakasu, S.; Haro, A.; Osoegawa, A.; Tagawa, T.; et al. 18F-FDG uptake in PET/CT is a potential predictive biomarker of response to anti-PD-1 antibody therapy in non-small cell lung cancer. Sci. Rep. 2019, 9, 1–7. [Google Scholar] [CrossRef] [Green Version]
- Na, F.; Wang, J.; Li, C.; Deng, L.; Xue, J.; Lu, Y. Primary tumor standardized uptake value measured on F18-fluorodeoxyglucose positron emission tomography is of prediction value for survival and local control in non–small-cell lung cancer receiving radiotherapy: Meta-analysis. J. Thorac. Oncol. 2014, 9, 834–842. [Google Scholar] [CrossRef] [Green Version]
- Paesmans, M.; Berghmans, T.; Dusart, M.; Garcia, C.; Hossein-Foucher, C.; Lafitte, J.J.; Mascaux, C.; Meert, A.P.; Roelandts, M.; Scherpereel, A.; et al. Primary tumor standardized uptake value measured on fluorodeoxyglucose positron emission tomography is of prognostic value for survival in non-small cell lung cancer: Update of a systematic review and meta-analysis by the european lung cancer working party for the international association for the study of lung cancer staging project. J. Thorac. Oncol. 2010, 5, 612–619. [Google Scholar]
- Liao, S.; Penney, B.C.; Zhang, H.; Suzuki, K.; Pu, Y. Prognostic value of the quantitative metabolic volumetric measurement on 18F-FDG PET/CT in Stage IV nonsurgical small-cell lung cancer. Acad. Radiol. 2012, 19, 69–77. [Google Scholar] [CrossRef] [PubMed]
- Yan, H.; Wang, R.; Zhao, F.; Zhu, K.; Jiang, S.; Zhao, W.; Feng, R. Measurement of tumor volume by PET to evaluate prognosis in patients with advanced non-small cell lung cancer treated by non-surgical therapy. Acta Radiol. 2011, 52, 646–650. [Google Scholar] [CrossRef] [PubMed]
- Im, H.-J.; Pak, K.; Cheon, G.J.; Kang, K.W.; Kim, S.-J.; Kim, I.-J.; Chung, J.-K.; Kim, E.E.; Lee, D.S. Prognostic value of volumetric parameters of 18F-FDG PET in non-small-cell lung cancer: A meta-analysis. Eur. J. Nucl. Med. Mol. Imaging 2014, 42, 241–251. [Google Scholar] [CrossRef] [PubMed]
- Chae, S.Y.; Ahn, S.H.; Kim, S.B.; Han, S.; Lee, S.H.; Oh, S.J.; Lee, S.J.; Kim, H.J.; Ko, B.S.; Lee, J.W. Diagnostic Accuracy and safety of 16alpha-[(18)F]fluoro-17beta-oestradiol Pet-Ct for the assessment of oestrogen receptor status in recurrent or metastatic lesions in patients with breast cancer: A prospective cohort study. Lancet Oncol. 2019, 20, 546–555. [Google Scholar] [CrossRef]
- van Es, S.C.; Brouwers, A.H.; Mahesh, S.V.K.; Leliveld-Kors, A.M.; de Jong, I.J.; Lub-de Hooge, M.N.; de Vries, E.G.E.; Gietema, J.A.; Oosting, S.F. (89)Zr-Bevacizumab pet: Potential early indicator of everolimus efficacy in patients with metastatic renal cell carcinoma. J. Nucl. Med. 2017, 58, 905–910. [Google Scholar] [CrossRef] [Green Version]
- Donnelly, D.J.; Smith, R.A.; Morin, P.; Lipovsek, D.; Gokemeijer, J.; Cohen, D.; Lafont, V.; Tran, T.; Cole, E.L.; Wright, M.; et al. Synthesis and biologic evaluation of a novel (18)F-labeled adnectin as a pet radioligand for imaging Pd-L1 expression. J. Nucl. Med. 2018, 59, 529–535. [Google Scholar] [CrossRef] [Green Version]
- Cole, E.L.; Kim, J.; Donnelly, D.J.; Smith, R.A.; Cohen, D.; Lafont, V.; Morin, P.E.; Huang, R.; Chow, P.L.; Hayes, W.; et al. Radiosynthesis and preclinical PET evaluation of 89Zr-nivolumab (BMS-936558) in healthy non-human primates. Bioorganic Med. Chem. 2017, 25, 5407–5414. [Google Scholar] [CrossRef]
- Niemeijer, A.N.; Leung, D.; Huisman, M.C.; Bahce, I.; Hoekstra, O.S.; Van Dongen, G.A.M.S.; Boellaard, R.; Du, S.; Hayes, W.; Smith, R.; et al. Whole body PD-1 and PD-L1 positron emission tomography in patients with non-small-cell lung cancer. Nat. Commun. 2018, 9, 1–5. [Google Scholar] [CrossRef]
- Xing, Y.; Chand, G.; Liu, C.; Cook, G.; O’Doherty, J.; Zhao, L.; Wong, N.C.; Meszaros, L.K.; Ting, H.H.; Zhao, J. Early Phase I study of a 99mTc-labeled anti–programmed death ligand-1 (PD-L1) single-domain antibody in SPECT/CT assessment of PD-L1 expression in non–small cell lung cancer. J. Nucl. Med. 2019, 60, 1213–1220. [Google Scholar] [CrossRef] [Green Version]
- Pandit-Taskar, N.; Postow, M.A.; Hellmann, M.D.; Harding, J.J.; Barker, C.A.; O’Donoghue, J.A.; Ziolkowska, M.; Ruan, S.; Lyashchenko, S.K.; Tsai, F.; et al. First-in-humans imaging with 89Zr-Df-IAB22M2C anti-CD8 minibody in patients with solid malignancies: Preliminary pharmacokinetics, biodistribution, and lesion targeting. J. Nucl. Med. 2020, 61, 512–519. [Google Scholar] [CrossRef]
- Gajewski, T.F. The next hurdle in cancer immunotherapy: Overcoming the non–T-cell–inflamed tumor microenvironment. In Seminars in Oncology; WB Saunders: Philadelphia, PA, USA, 2015; pp. 663–671. [Google Scholar]
- Seo, J.W.; Tavaré, R.; Mahakian, L.M.; Silvestrini, M.T.; Tam, S.; Ingham, E.S.; Salazar, F.B.; Borowsky, A.D.; Wu, A.M.; Ferrara, K.W. CD8+ T-Cell density imaging with 64Cu-labeled cys-diabody informs immunotherapy protocols. Clin. Cancer Res. 2018, 24, 4976–4987. [Google Scholar] [CrossRef] [PubMed] [Green Version]
- Tavaré, R.; Escuin-Ordinas, H.; Mok, S.; McCracken, M.N.; Zettlitz, K.A.; Salazar, F.B.; Witte, O.N.; Ribas, A.; Wu, A.M. An effective immuno-pet imaging method to monitor CD8-dependent responses to immunotherapy. Cancer Res. 2016, 76, 73–82. [Google Scholar] [CrossRef] [Green Version]
- Wolchok, J.D.; Hoos, A.; O’Day, S.; Weber, J.S.; Hamid, O.; Lebbé, C.; Maio, M.; Binder, M.; Bohnsack, O.; Nichol, G.; et al. Guidelines for the evaluation of immune therapy activity in solid tumors: Immune-related response criteria. Clin. Cancer Res. 2009, 15, 7412–7420. [Google Scholar] [CrossRef] [Green Version]
- Young, H.; Baum, R.; Cremerius, U.; Herholz, K.; Hoekstra, O.; Lammertsma, A.; Pruim, J.; Price, P. Measurement of clinical and subclinical tumour response using [18F]-fluorodeoxyglucose and positron emission tomography: Review and 1999 EORTC recommendations. Eur. J. Cancer 1999, 35, 1773–1782. [Google Scholar] [CrossRef]
- Wahl, R.L.; Jacene, H.; Kasamon, Y.; Lodge, M.A. From RECIST to PERCIST: Evolving considerations for PET response criteria in solid tumors. J. Nucl. Med. 2009, 50, 122S–150S. [Google Scholar] [CrossRef] [Green Version]
- Cho, S.Y.; Lipson, E.J.; Im, H.J.; Rowe, S.P.; Gonzalez, E.M.; Blackford, A.; Chirindel, A.; Pardoll, D.M.; Topalian, S.L.; Wahl, R.L. Prediction of response to immune checkpoint inhibitor therapy using early-time-point 18F-FDG PET/CT imaging in patients with advanced melanoma. J. Nucl. Med. 2017, 58, 1421–1428. [Google Scholar] [CrossRef] [PubMed] [Green Version]
- Anwar, H.; Sachpekidis, C.; Winkler, J.; Kopp-Schneider, A.; Haberkorn, U.; Hassel, J.C.; Dimitrakopoulou-Strauss, A. Absolute number of new lesions on (18)F-Fdg Pet/Ct is more predictive of clinical response than suv changes in metastatic melanoma patients receiving ipilimumab. Eur. J. Nucl. Med. Mol. Imaging 2018, 45, 376–383. [Google Scholar] [CrossRef] [PubMed]
- Sachpekidis, C.; Larribere, L.; Pan, L.; Haberkorn, U.; Dimitrakopoulou-Strauss, A.; Hassel, J.C. Predictive value of early 18F-FDG PET/CT studies for treatment response evaluation to ipilimumab in metastatic melanoma: Preliminary results of an ongoing study. Eur. J. Nucl. Med. Mol. Imaging 2014, 42, 386–396. [Google Scholar] [CrossRef]
- Seith, F.; Forschner, A.; Schmidt, H.; Pfannenberg, C.; Gückel, B.; Nikolaou, K.; La Fougère, C.; Garbe, C.; Schwenzer, N. 18F-FDG-PET detects complete response to PD1-therapy in melanoma patients two weeks after therapy start. Eur. J. Nucl. Med. Mol. Imaging 2018, 45, 95–101. [Google Scholar] [CrossRef] [PubMed]
- Kaira, K.; Higuchi, T.; Naruse, I.; Arisaka, Y.; Tokue, A.; Altan, B.; Suda, S.; Mogi, A.; Shimizu, K.; Sunaga, N.; et al. Metabolic activity by 18F–FDG-PET/CT is predictive of early response after nivolumab in previously treated NSCLC. Eur. J. Nucl. Med. Mol. Imaging 2018, 45, 56–66. [Google Scholar] [CrossRef]
- Humbert, O.; Cadour, N.; Paquet, M.; Schiappa, R.; Poudenx, M.; Chardin, D.; Borchiellini, D.; Benisvy, D.; Ouvrier, M.J.; Zwarthoed, C.; et al. 18FDG PET/CT in the early assessment of non-small cell lung cancer response to immunotherapy: Frequency and clinical significance of atypical evolutive patterns. Eur. J. Nucl. Med. Mol. Imaging 2019, 47, 1158–1167. [Google Scholar] [CrossRef]
- Ito, K.; Teng, R.; Schöder, H.; Humm, J.L.; Ni, A.; Michaud, L.; Nakajima, R.; Yamashita, R.; Wolchok, J.D.; Weber, W.A. 18F-FDG PET/CT for monitoring of ipilimumab therapy in patients with metastatic melanoma. J. Nucl. Med. 2018, 60, 335–341. [Google Scholar] [CrossRef] [PubMed] [Green Version]
- Castello, A.; Rossi, S.; Toschi, L.; Lopci, E. Comparison of metabolic and morphological response criteria for early prediction of response and survival in nsclc patients treated with anti-PD-1/PD-L1. Front. Oncol. 2020, 10, 1090. [Google Scholar] [CrossRef] [PubMed]
- Waterhouse, D.M.; Garon, E.B.; Chandler, J.; McCleod, M.; Hussein, M.; Jotte, R.; Horn, L.; Daniel, D.B.; Keogh, G.; Creelan, B.; et al. Continuous versus 1-year fixed-duration nivolumab in previously treated advanced non–small-cell lung cancer: CheckMate 153. J. Clin. Oncol. 2020, 38, 3863–3873. [Google Scholar] [CrossRef] [PubMed]
- Geier, M.; Descourt, R.; Corre, R.; Léveiller, G.; Lamy, R.; Goarant, É.; Bizec, J.L.; Bernier, C.; Quéré, G.; Amrane, K.; et al. Duration of nivolumab for pretreated, advanced non-small-cell lung cancer. Cancer Med. 2020, 9, 6923–6932. [Google Scholar] [CrossRef] [PubMed]
- Schadendorf, D.; Wolchok, J.D.; Hodi, F.S.; Chiarion-Sileni, V.; Gonzalez, R.; Rutkowski, P.; Grob, J.-J.; Cowey, C.L.; Lao, C.D.; Chesney, J.; et al. Efficacy and safety outcomes in patients with advanced melanoma who discontinued treatment with nivolumab and ipilimumab because of adverse events: A pooled analysis of randomized phase II and III trials. J. Clin. Oncol. 2017, 35, 3807–3814. [Google Scholar] [CrossRef] [PubMed] [Green Version]
- Jansen, Y.; Rozeman, E.; Mason, R.; Goldinger, S.; Foppen, M.G.; Hoejberg, L.; Schmidt, H.; van Thienen, J.; Haanen, J.; Tiainen, L.; et al. Discontinuation of anti-PD-1 antibody therapy in the absence of disease progression or treatment limiting toxicity: Clinical outcomes in advanced melanoma. Ann. Oncol. 2019, 30, 1154–1161. [Google Scholar] [CrossRef] [Green Version]
- Iivanainen, S.; Koivunen, J.P. Early PD-1 therapy discontinuation in responding metastatic cancer patients. Oncology 2019, 96, 125–131. [Google Scholar] [CrossRef]
- Tan, A.C.; Emmett, L.; Lo, S.; Liu, V.; Kapoor, R.; Carlino, M.S.; Guminski, A.D.; Long, G.V.; Menzies, A.M. FDG-PET response and outcome from anti-PD-1 therapy in metastatic melanoma. Ann. Oncol. 2018, 29, 2115–2120. [Google Scholar] [CrossRef]
- Kong, B.Y.; Menzies, A.M.; Saunders, C.A.B.; Liniker, E.; Ramanujam, S.; Guminski, A.; Kefford, R.; Long, G.V.; Carlino, M.S. Residual FDG-PET metabolic activity in metastatic melanoma patients with prolonged response to anti-PD-1 therapy. Pigment. Cell Melanoma Res. 2016, 29, 572–577. [Google Scholar] [CrossRef]
- Aerts, H.J.W.L.; Velazquez, E.R.; Leijenaar, R.T.H.; Parmar, C.; Grossmann, P.; Carvalho, S.; Bussink, J.; Monshouwer, R.; Haibe-Kains, B.; Rietveld, D.; et al. Decoding tumour phenotype by noninvasive imaging using a quantitative radiomics approach. Nat. Commun. 2014, 5, 4006. [Google Scholar] [CrossRef]
- Trebeschi, S.; Drago, S.G.; Birkbak, N.J.; Kurilova, I.; Calin, A.M.; Pizzi, A.D.; Lalezari, F.; Lambregts, D.M.J.; Rohaan, M.; Parmar, C. Predicting response to cancer immunotherapy using non-invasive radiomic biomarkers. Ann. Oncol. 2019, 30, 998–1004. [Google Scholar] [CrossRef] [Green Version]
- Mu, W.; Tunali, I.; Gray, J.E.; Qi, J.; Schabath, M.; Gillies, R.J. Radiomics of 18F-FDG PET/CT images predicts clinical benefit of advanced NSCLC patients to checkpoint blockade immunotherapy. Eur. J. Nucl. Med. Mol. Imaging 2020, 47, 1168–1182. [Google Scholar] [CrossRef] [PubMed]
- Valentinuzzi, D.; Vrankar, M.; Boc, N.; Ahac, V.; Zupancic, Z.; Unk, M.; Skalic, K.; Zagar, I.; Studen, A.; Simoncic, U.; et al. [18F]FDG PET immunotherapy radiomics signature (iRADIOMICS) predicts response of non-small-cell lung cancer patients treated with pembrolizumab. Radiol. Oncol. 2020, 54, 285–294. [Google Scholar] [CrossRef] [PubMed]
- Polverari, G.; Ceci, F.; Bertaglia, V.; Reale, M.L.; Rampado, O.; Gallio, E.; Passera, R.; Liberini, V.; Scapoli, P.; Arena, V.; et al. 18F-FDG Pet parameters and radiomics features analysis in advanced nsclc treated with immunotherapy as predictors of therapy response and survival. Cancers 2020, 12, 1163. [Google Scholar] [CrossRef] [PubMed]
- García-Figueiras, R.; Baleato-González, S.; Luna, A.; Muñoz-Iglesias, J.; Oleaga, L.; Vallejo Casas, J.A.; Vilanova, J.C. Assessing immunotherapy with functional and molecular imaging and radiomics. RadioGraphics 2020, 40, 1987–2010. [Google Scholar] [CrossRef] [PubMed]
- Hatt, M.; Tixier, F.; Pierce, L.; Kinahan, P.E.; Le Rest, C.C.; Visvikis, D. Characterization of PET/CT images using texture analysis: The past, the present… Any future? Eur. J. Nucl Med. Mol. Imaging 2017, 44, 151–165. [Google Scholar] [CrossRef]
- Blank, C.U.; Haanen, J.B.; Ribas, A.; Schumacher, T.N. The cancer immunology. The cancer immunogram. Science 2016, 352, 658–660. [Google Scholar] [CrossRef]
- Stutvoet, T.S.; van der Veen, E.L.; Kol, A.; Antunes, I.F.; de Vries, E.F.; Hospers, G.A.; de Vries, E.G.E.; de Jong, S.; Lub-de Hooge, M.N. Molecular imaging of Pd-L1 expression and dynamics with the adnectin-based pet tracer (18)F-Bms-986192. J. Nucl Med. 2020, 61, 1839–1844. [Google Scholar] [CrossRef]
- Jauw, Y.W.S.; Heijtel, D.F.; Zijlstra, J.M.; Hoekstra, O.S.; De Vet, H.C.W.; Vugts, D.J.; Verheul, H.; Boellaard, R.; Zweegman, S.; Van Dongen, G.A.M.S.; et al. Noise-induced variability of immuno-PET with zirconium-89-labeled antibodies: An analysis based on count-reduced clinical images. Mol. Imaging Biol. 2018, 20, 1025–1034. [Google Scholar] [CrossRef] [PubMed] [Green Version]
- Messenheimer, D.J.; Jensen, S.M.; Afentoulis, M.E.; Wegmann, K.W.; Feng, Z.; Friedman, D.J.; Gough, M.; Urba, W.J.; Fox, B.A. Timing of PD-1 blockade is critical to effective combination immunotherapy with anti-OX40. Clin. Cancer Res. 2017, 23, 6165–6177. [Google Scholar] [CrossRef] [PubMed] [Green Version]

| Tracer (Target) | Injected Dose | Timing Image Acquisition 1 | Study Population | Main Results |
|---|---|---|---|---|
| 18F-BMS-986192 (PD-L1) [48] | Tracer uptake correlates with PD-L1 expression by IHC | |||
| 3 MBq/kg ±10% | 1 h post-injection | NSCLC 13 patients | ||
| Lesional tracer uptake is related to response | ||||
| 89Zr-nivolumab (PD-1) [48] | 37 MBq ± 10% | 7 days post-injection | NSCLC 13 patients | Tracer uptake correlates with aggregates of PD-1 determined by IHCLesional tracer uptake is related to response |
| 99mTc-NM-01 (PD-L1) [49] | Group 1 (3.8–8.4 MBq/kg) Group 2 (9.1–10.4 MBq/Kg) | 2 h post-injection | NSCLC 16 patients | Tracer uptake correlates with PD-L1 expression by IHC |
| 89Zr-atezolizumab (PD-L1) [19] | 37 MBq | 7 days post-injection | NSCLC 9 patients Bladder cancer 9 patients Breast cancer 4 patients | Tracer showed a stronger correlation with clinical response compared to PD-L1 IHC |
| 89Zr-IAB22M2C (CD8+ T-cell) [50] | Mean 108 (range 92–120) MBq | 1–2 days post-injection | NSCLC 4 patients Melanoma 1 patientHepatocellular cancer 1 patient | Biodistribution suggests successful targeting of CD8+ T cells |
| Imaging Characteristics | CT | 18F-FDG-PET(-CT) | |||||
|---|---|---|---|---|---|---|---|
| RECIST 1.1 [20] | iRECIST [21,26] | EORTC [55] | PERCIST [56] | PERCRIT [57] | PERCIMT [58] | imPERCIST [36] | |
| Target lesion at baseline | Maximum two lesions per organ and five lesions total | Per RECIST 1.1 | All FDG-avid lesions | Hottest lesion(s). Maximum two per organ | Per RECIST 1.1 | Per PERCIST | Per PERCIST |
| Non-target lesion | Contribute to the CR, PR, SD, and PD | Contribute to the iCR, iPR, iSD, and iPD | - | Contribute to the CMR, PMR, SMD, and PMD | Contribute to the CR, PR, SD and PD | Contribute to the CMR, PMR, SMD, and PMD | Contribute to the CMR, PMR, SMD, and PMD |
| New lesion | Always represent PD | iUPD, require a next imaging assessment to confirm | Always represent PMD | Always represent PMD | Always represent PD | Number and size of lesions define CR/PR/SD or PD | Does not represent PMD |
| CR/CMR | Disappearance of all target and non-target lesions | iCR: per RECIST 1.1 at first or at the next assessment within 4–8 weeks after iUPD | Complete resolution of FDG uptake within tumor volume | Complete resolution of FDG uptake and disappearance of all other lesions | Per RECIST 1.1 | Per PERCIST | Per PERCIST |
| PR/PMR | ≥30% decrease in the sum of diameters of target lesions. Persistence of one or more non-target lesion(s) | iPR: per RECIST 1.1 at first or at the next assessment within 4–8 weeks after iUPD | Reduction of 15–25% in tumor SUV after 1 cycle of therapy an d > 25% after more than 1 cycle of therapy | >30% relative decrease and >0.8 absolute decrease in SULpeak of hottest lesion | Per RECIST 1.1 | If the sum of SULpeak decreased by at least 30% and >0.8 absolute decrease in SULpeak of hottest lesion. | If the sum of SULpeak decreased by at least 30% and >0.8 absolute decrease in SULpeak of hottest lesion |
| SD/SMD | Neither sufficient shrinkage to qualify for PR nor sufficient increase to qualify for PD | iSD: per RECIST 1.1 at first or at the next assessment within 4–8 weeks after iUPD | Not meeting criteria for CMR, PMR, or PMD | Not meeting criteria for CMR, PMR, or PMD | Not meeting criteria for CR/PR or PD | Not meeting criteria for CMR, PMR, or PMD. | Not meeting criteria for CMR, PMR, or PMD |
| PD/PMD | ≥20% increase in sum of diameters of target lesion(s) or unequivocal progression of non-target lesion(s) or appearance of new lesion(s) | iUPD: per RECIST 1.1. iCPD: iUPD and confirmed 4–8 weeks later | >25% increase within tumor region, visible increase in extent of FDG uptake (20% in longest dimension), or appearance of new FDG positive lesions | >30% relative increase and >0.8 absolute increase in SULpeak of hottest lesion (s) or unequivocal progression of FDG-avid non-target lesion or appearance of new FDG-avid lesion(s) | Per RECIST 1.1 | ≥4 new lesions of less than 1.0 cm in functional diameter; or ≥3 new lesions of more than 1.0 cm in functional diameter; or ≥2 new lesions of more than 1.5 cm in functional diameter. | >30% increase and >0.8 absolute increase in SULpeak, from baseline scan in a pattern typical of tumor and not of infection/treatment effect |
Publisher’s Note: MDPI stays neutral with regard to jurisdictional claims in published maps and institutional affiliations. |
© 2021 by the authors. Licensee MDPI, Basel, Switzerland. This article is an open access article distributed under the terms and conditions of the Creative Commons Attribution (CC BY) license (https://creativecommons.org/licenses/by/4.0/).
Share and Cite
Borm, F.J.; Smit, J.; Oprea-Lager, D.E.; Wondergem, M.; Haanen, J.B.A.G.; Smit, E.F.; de Langen, A.J. Response Prediction and Evaluation Using PET in Patients with Solid Tumors Treated with Immunotherapy. Cancers 2021, 13, 3083. https://doi.org/10.3390/cancers13123083
Borm FJ, Smit J, Oprea-Lager DE, Wondergem M, Haanen JBAG, Smit EF, de Langen AJ. Response Prediction and Evaluation Using PET in Patients with Solid Tumors Treated with Immunotherapy. Cancers. 2021; 13(12):3083. https://doi.org/10.3390/cancers13123083
Chicago/Turabian StyleBorm, Frank J., Jasper Smit, Daniela E. Oprea-Lager, Maurits Wondergem, John B. A. G. Haanen, Egbert F. Smit, and Adrianus J. de Langen. 2021. "Response Prediction and Evaluation Using PET in Patients with Solid Tumors Treated with Immunotherapy" Cancers 13, no. 12: 3083. https://doi.org/10.3390/cancers13123083
APA StyleBorm, F. J., Smit, J., Oprea-Lager, D. E., Wondergem, M., Haanen, J. B. A. G., Smit, E. F., & de Langen, A. J. (2021). Response Prediction and Evaluation Using PET in Patients with Solid Tumors Treated with Immunotherapy. Cancers, 13(12), 3083. https://doi.org/10.3390/cancers13123083