Article

EVI2B Is a New Prognostic Biomarker in Metastatic Melanoma with IFNgamma Associated Immune Infiltration

1
Gustave Roussy Cancer Campus (GRCC), 94800 Villejuif, France
2
Department of Urology, Kurume University School of Medicine, Kurume 830-0011, Japan
*
Author to whom correspondence should be addressed.
Cancers 2021, 13(16), 4110; https://doi.org/10.3390/cancers13164110
Submission received: 12 July 2021 / Revised: 5 August 2021 / Accepted: 11 August 2021 / Published: 15 August 2021
(This article belongs to the Special Issue Novel Biomarkers and Therapeutic Targets for Skin Cancer)

Abstract

:

Simple Summary

Ecotropic viral integration site 2B (EVI2B) is a protein-coding gene known as a lymphocyte-specific marker in peripheral blood. However, the prognostic value of EVI2B expression in metastatic melanoma tissue and its detailed profile of tumor-infiltrating lymphocytes are still unclear. In publicly available datasets, we found that increased EVI2B was significantly associated with longer prognoses such as overall survival and disease-specific survival. The EVI2B-high melanoma tissue had a favorable distribution/clustering pattern of infiltrating lymphocytes with increased CD8+ T cells over regulatory T cells. Moreover, EVI2B expression correlated with multiple immunomodulatory genes including IFN-γ signature genes. In conclusion, EVI2B is a prognostic biomarker with IFN-γ associated immune infiltration in metastatic melanoma.

Abstract

Background: To assess the prognostic role and the antitumor immunological relevance of ecotropic viral integration site 2B (EVI2B) in metastatic melanoma. Methods: In this study, we integrated clinical data, mRNA expression data, and the distribution and fraction of tumor infiltrating lymphocytes (TILs) using The Cancer Genome Atlas (TCGA) and Gene Expression Omnibus (GEO) datasets (GSE65904 and GSE19234). Results: The univariate and multivariate analyses showed that higher gene expression of EVI2B was significantly associated with longer prognoses. The EVI2B-high melanoma tissue had favorable histological parameters such as a brisk global distribution pattern and clustering structure of TILs (i.e., Banfield and Raftery index) with enriched CD8+ T cells over regulatory T cells and increased cytotoxicity scores. In addition, EVI2B expression positively correlated with IFN-γ signature genes (CXCL10, CXCL9, HLA-DRA, IDO1, IFNG, and STAT1) and other various immunomodulatory genes. Conclusion: EVI2B is a novel prognostic biomarker with IFN-γ associated immune infiltration in metastatic melanoma.

1. Introduction

Cutaneous melanoma is a malignant tumor originating from melanocytes [1]. Although the incidence rate of melanoma is lower than other skin cancers, it is responsible for most metastatic skin cancer–related deaths [2,3]. Melanoma is an immunogenic tumor with multiple types of tumor-infiltrating lymphocytes (TILs) in the tumor microenvironment (TME) [4]. The distribution and density of TILs are predictors of survival outcomes [5]. Moreover, the TME profile is closely associated with the therapeutic success of immune checkpoint blockade [6]. Therefore, analyzing the TME of melanoma may help better understand the immunological interactions between the tumor and the host cells and how such interactions influence the clinical outcomes.
Ecotropic viral integration site 2B (EVI2B), also known as CD361 [7], was first reported to be a common viral integration site in retrovirally-induced murine leukemia [8]. Zjablovskaja et al. showed EVI2B was necessary for granulocytic differentiation and functionality of hematopoietic progenitors [9]. EVI2B is one of the lymphocyte-specific attractor metagenes in multiple tumor samples such as breast cancer, colorectal adenocarcinoma, and ovarian cancer [10] and predictive of progression in colorectal cancer [11]. Since melanoma can be enriched with infiltrating lymphocytes, EVI2B could have a potential association. However, no study has previously investigated EVI2B as a potential biomarker in metastatic melanoma.
In this study, we investigated the prognostic value of EVI2B gene expressions using the metastatic melanoma datasets from The Cancer Genome Atlas (TCGA) and Gene Expression Omnibus (GEO) datasets. We characterized the TME using spatial distribution pattern (brisk vs. non-brisk) [12], statistical indices of clustering pattern [12,13,14,15,16], and estimated fractions of TILs [17]. Finally, our evaluation showed that EVI2B was associated with gene signatures that were associated with a better response to immune checkpoint blockades such as anti-PD1 or anti-CTLA4 antibody therapies [18,19].

2. Materials and Methods

2.1. Survival Analysis with EVI2B mRNA Level in the Public Database

Clinical data of patients with metastatic melanoma were obtained from cBioPortal (TCGA PanCancer Atlas, https://www.cbioportal.org/, accessed on 20 March 2020) [20,21]. OSskcm, an online tool for survival analysis with transcriptome information [22], was used to obtain the clinical data of GSE65904 [23] and GSE19234 [24], which both mostly consist of metastatic melanoma with gene expression data in tumor tissue. We classified the patients with upper 25% expression of EVI2B as EVI2B high and the remaining patients as EVI2B low in all the following analyses. For the visualization of the overall survival (OS) and disease-specific survival (DSS), we used Kaplan–Meier plotting. The multivariate Cox regression analysis was performed to assess the prognostic impact of EVI2B gene expression as a continuous variable with the other parameters such as age at diagnosis, sex (male vs. female), disease stage at initial diagnosis, and tumor purity on tumor immune estimation resource (TIMER, https://cistrome.shinyapps.io/timer/, accessed on 6 December 2020, TIMER2.0, http://timer.comp-genomics.org/, accessed on 6 December 2020) [25,26].

2.2. Estimated Fractions of TILs

The TIL fraction data estimated by the quanTIseq [17], TIMER [25,26,27], and Microenvironment Cell Populations counter (MCP-counter) [28] were downloaded from TIMER2.0 (http://timer.comp-genomics.org/, accessed on 6 December 2020) [26]. In addition, CIBERSORTx was used to estimate the TIL population using LM22 as signature with 100 permutations [29]. The heatmap of TIL fractions estimated by quanTIseq [17] or CIBERSORTx [29] combined with clinical information was generated by R package ”ComplexHeatmap”. Each fraction of TILs was converted to a z-score. We used non-hierarchical clustering for characterizing the TILs. The calculating method of the distance for rows and columns was ”Canberra”. The clustering method for rows and columns was ”ward.D” or ”ward.D2”. Multiple t-tests with false discovery approach [30] were used to compare the estimated TIL fractions between EVI2B high vs. EVI2B low patients.

2.3. Patial Pattern of TIL Analysis

The spatial TIL distribution patterns were downloaded from the Genomic Data Commons (GDC) data portal (https://gdc.cancer.gov/about-data/publications/tilmap, accessed on 20 March 2020) [12]. Samples with a pattern label of ”indeterminate” were excluded from the analysis. The distribution pattern of TILs was compared between EVI2B high and EVI2B low patients by Fisher’s exact test. We downloaded the computed indices data of the clustering pattern of TILs (determinant ratio [13], C [14], Banfield and Raftery [15], and Ball and Hall [16]) from the GDC data portal (https://gdc.cancer.gov/about-data/publications/tilmap, accessed on 20 March 2020) [12].

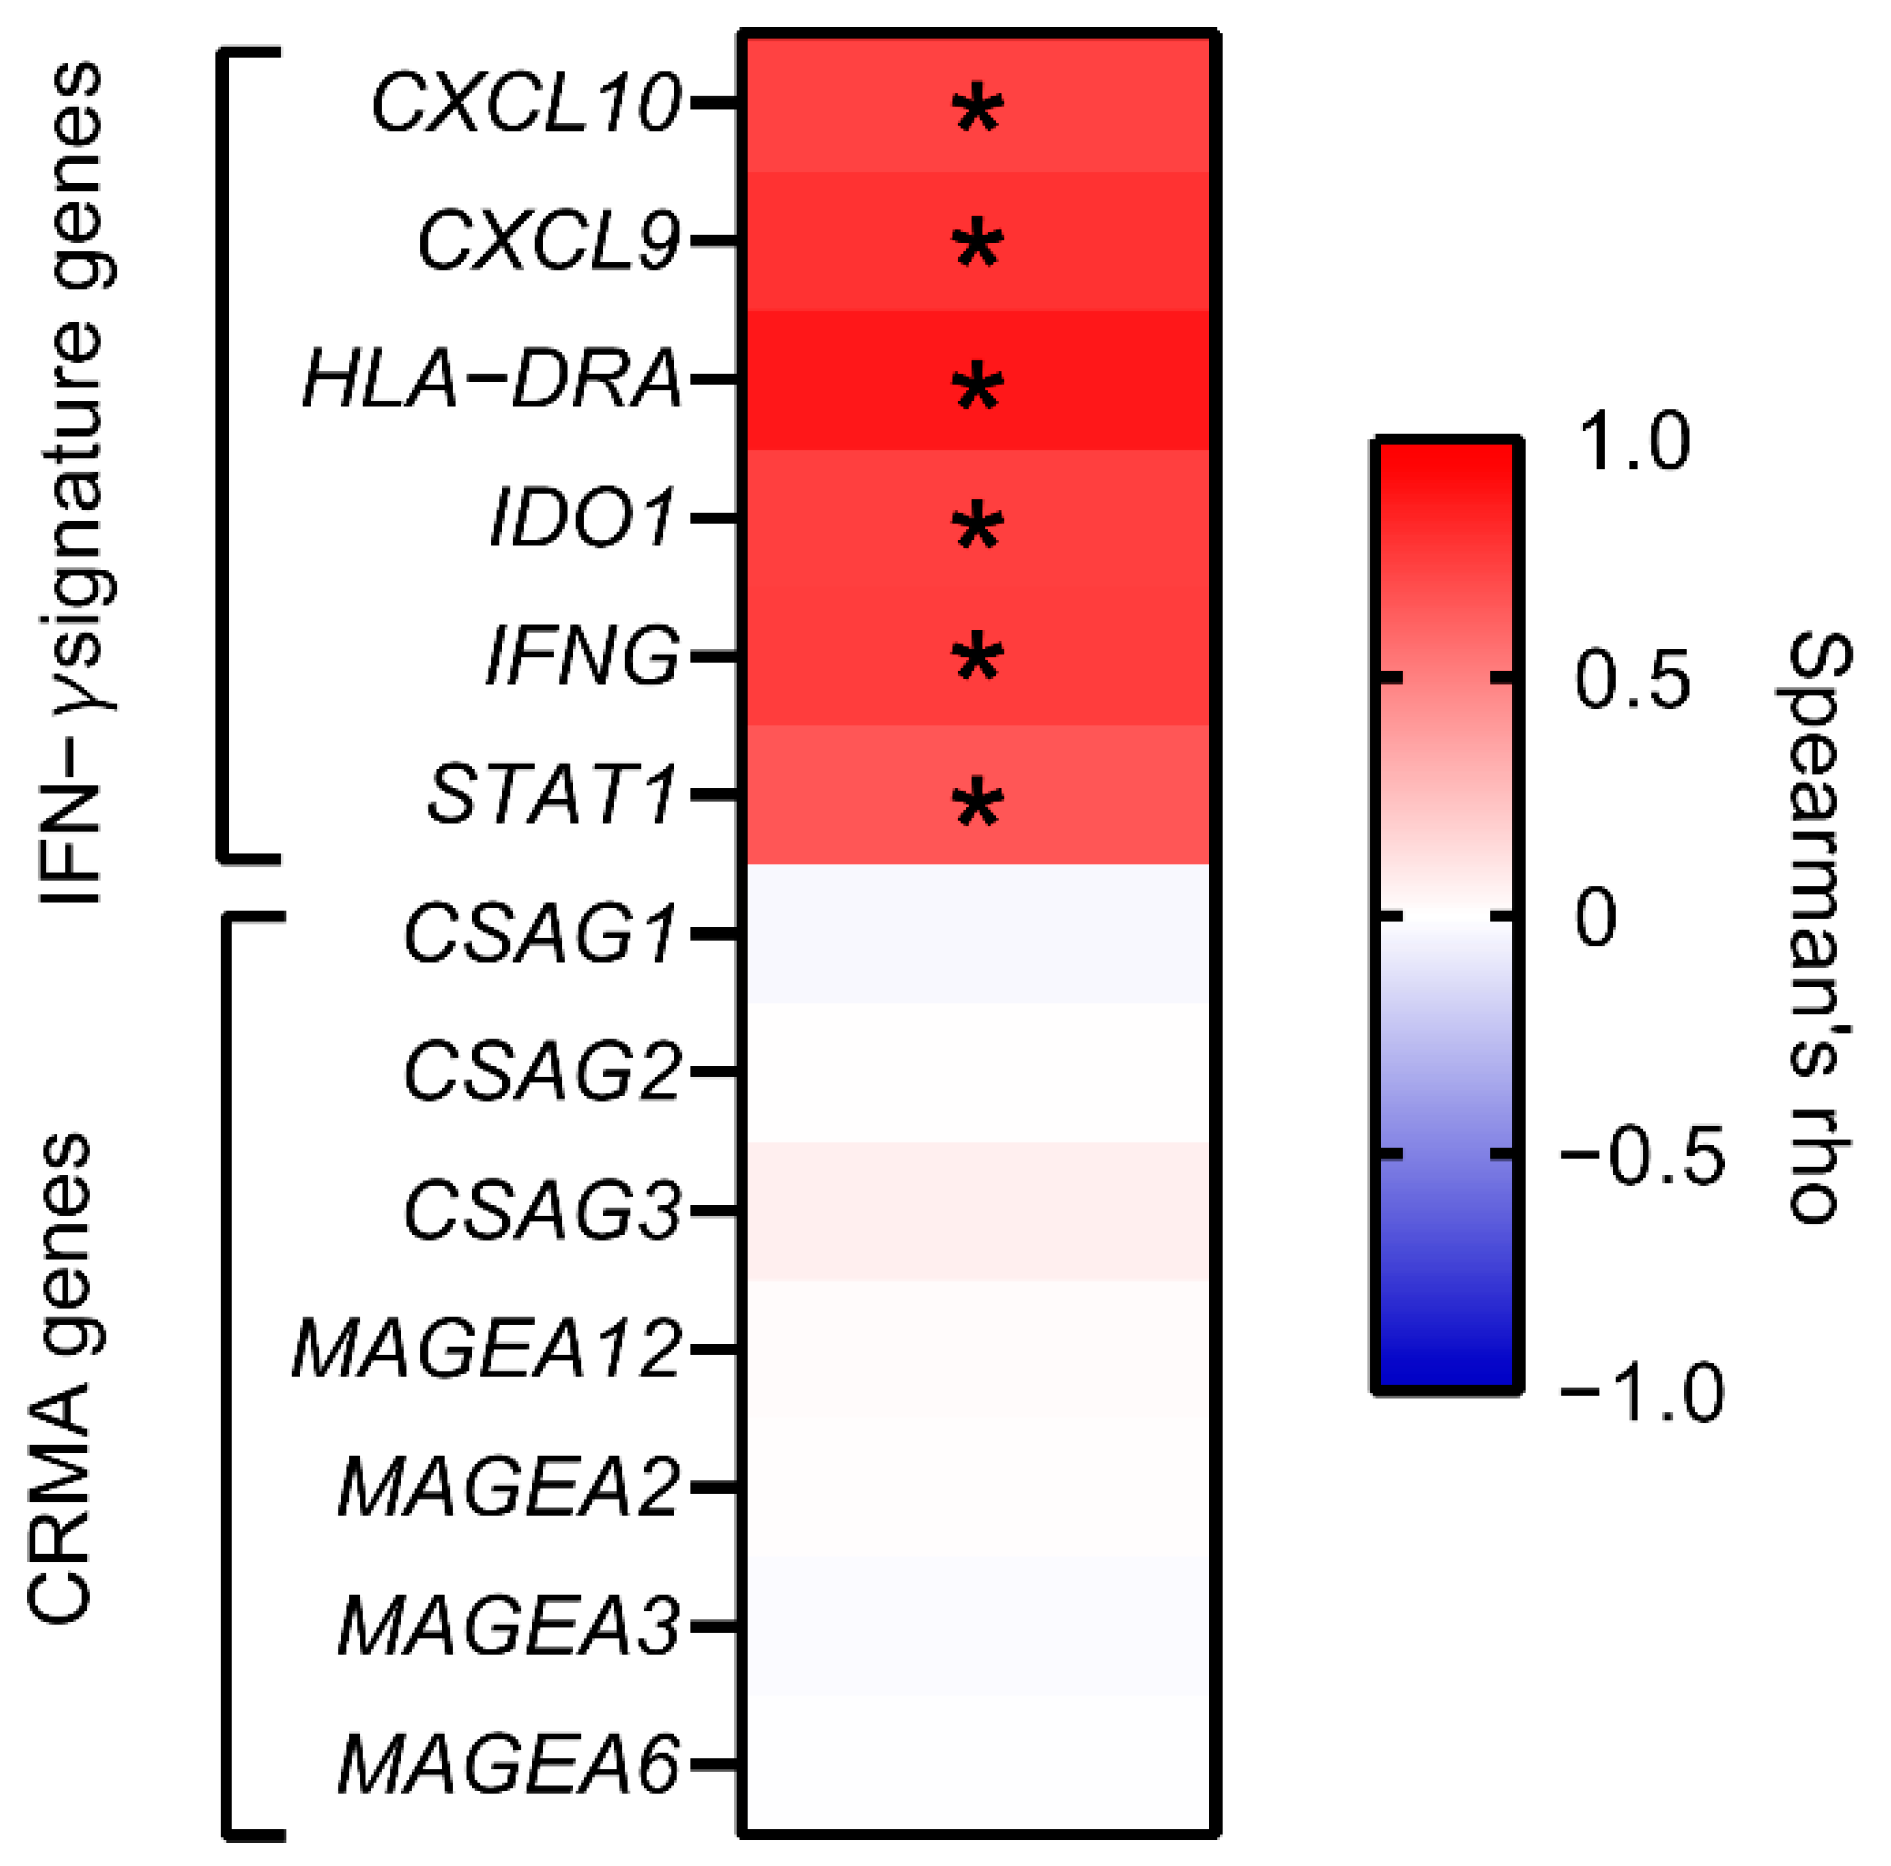
2.4. Correlation with Sets of Immunomodulatory Genes

The Spearman correlation of EVI2B mRNA level with IFN-γ signature gene levels (IDO1, CXCL10, CXCL9, HLA-DRA, STAT1, and IFNG) [18] and anti-CTLA-4 resistance-associated MAGE-A (CRMA) genes (CSAG1, CSAG2, CSAG3, MAGEA2, MAGEA3, MAGEA6, and MAGEA12) [19] were investigated using GEPIA2 [31]. We excluded MAGEA2B because the expression data were not available on GEPIA2 for metastatic melanoma. The correlation of EVI2B with two sets of genes (immunostimulators and immunoinhibitors [32]) were also investigated.

2.5. Statistical Analysis

Spearman’s rho was used for correlation analyses. Log-rank test was performed by the OSskcm [22]. For graphs and statistical analyses (multiple t-tests with false discovery rate (FDR) approach, Mann–Whitney test, and Fisher’s exact test), we used the R freeware (http://www.r-project.org, accessed on 14 December 2020) and GraphPad Prism (v. 8.3.0) software (GraphPad Software Inc., San Diego, City, CA, USA). All p-values were two-sided, and a p-value and an FDR (Q value) of ≤0.05 were considered statistically significant.

3. Results

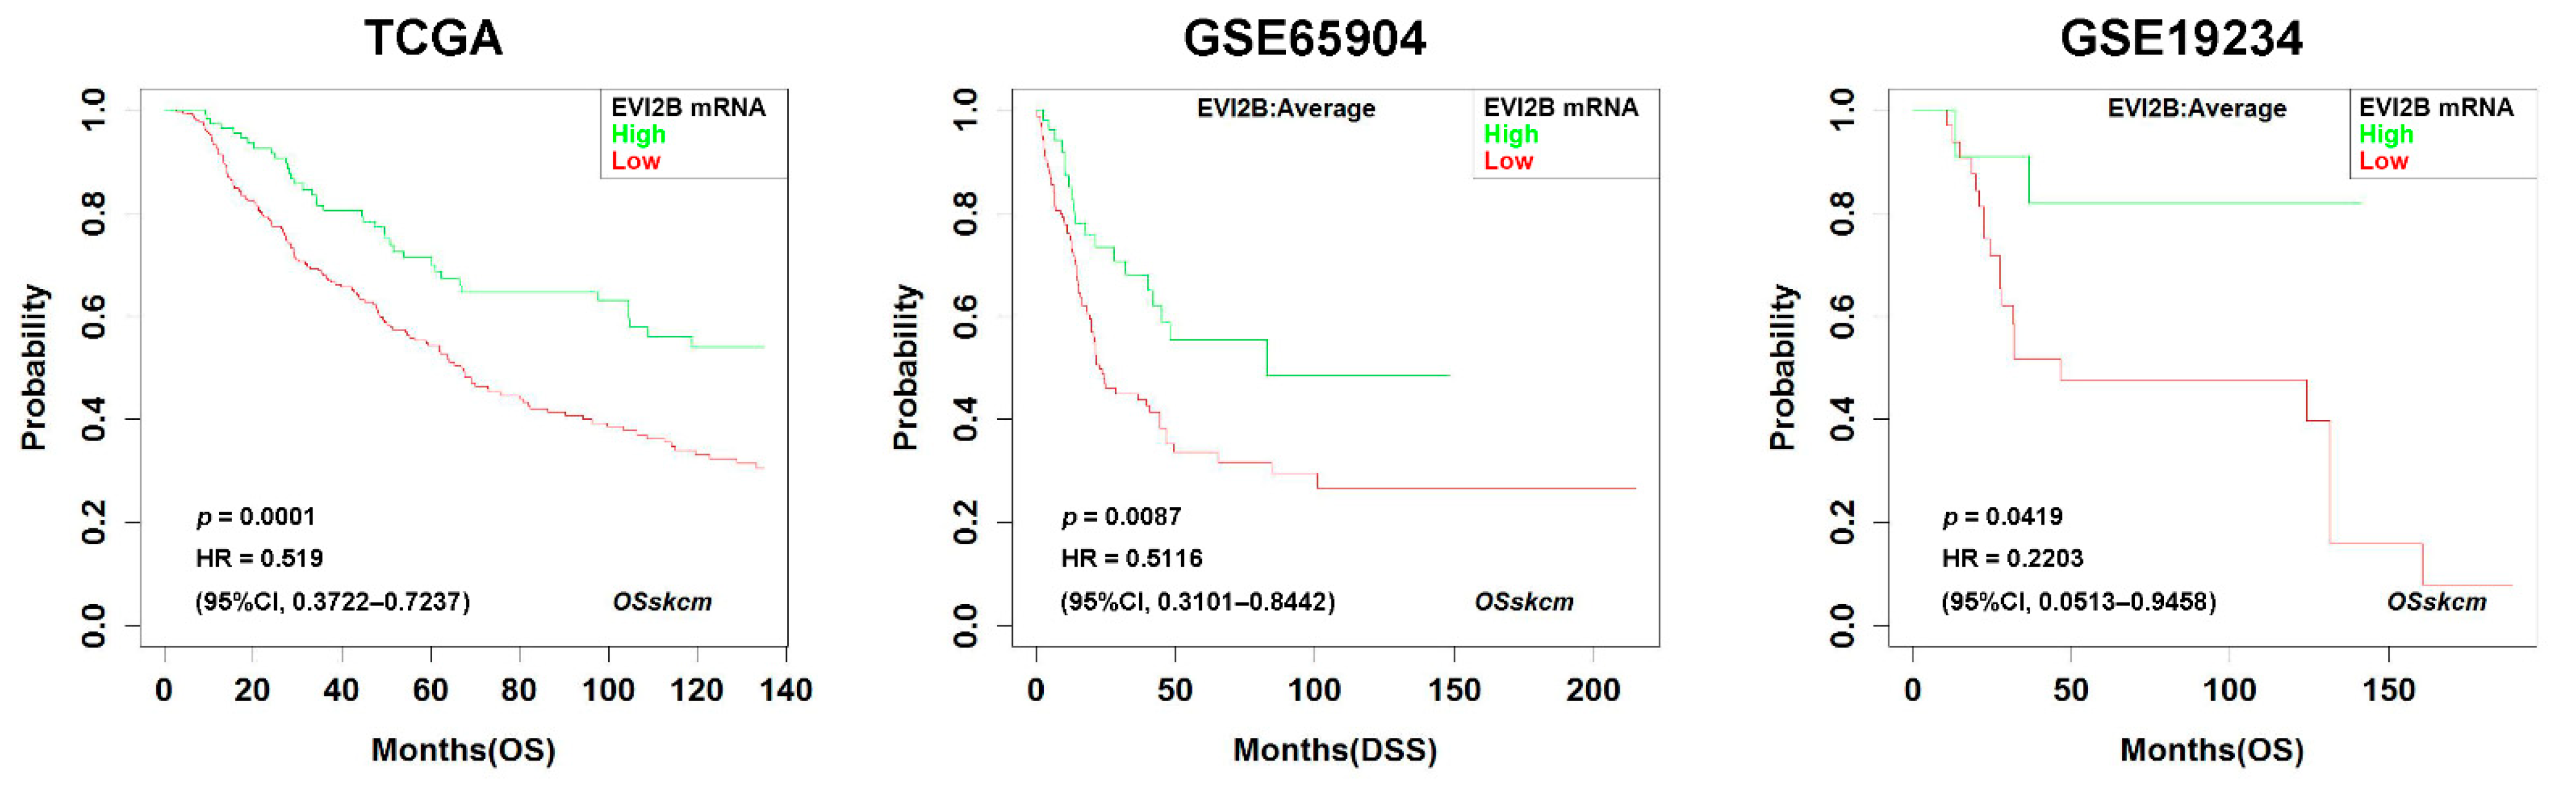
3.1. Prognostic Impact of EVI2B Gene Expression in Metastatic Melanoma

We investigated the survival data from TCGA in metastatic melanoma patients with EVI2B gene expression. The third quartile of EVI2B mRNA level was chosen as a cutoff to stratify patients as “EVI2B high” and “EVI2B low” because the distribution of the EVI2B mRNA levels was positively skewed (Figure S1). The basic characteristics of the evaluated patients are shown in Table 1. No difference in age, sex, race, and TNM stage was observed between EVI2B high and EVI2B low patient groups.
Patients with higher EVI2B gene expressions had longer OS (hazard ratio (HR) (95% confidence interval (CI)) 0.519 (0.372–0.724), p = 0.0001, Figure 1 left panel). Similarly, in the other cohorts (GSE65904 [23] and GSE19234 [24]), the EVI2B gene expression was a favorable factor on DSS and OS (HR (95% CI) 0.512 (0.310–0.844), p = 0.009 and HR (95% CI) 0.220 (0.051–0.946), p = 0.042, respectively, Figure 1 middle and right panels). We found a similar prognostic value of EVI2B with a 50% cut-off value in the TCGA, GSE65904 [23], and GSE19234 [24] datasets (Figure S2).
The multivariate Cox regression analysis also revealed that a higher EVI2B gene expression as a continuous parameter was significantly associated with longer OS (HR (95% CI) 0.716 (0.610–0.840), p < 0.0001, Table 2) in the TCGA cohort. The dichotomized EVI2B mRNA level (high vs low) was an independent prognostic factor in the multivariate Cox regression analysis as well (Table S1).

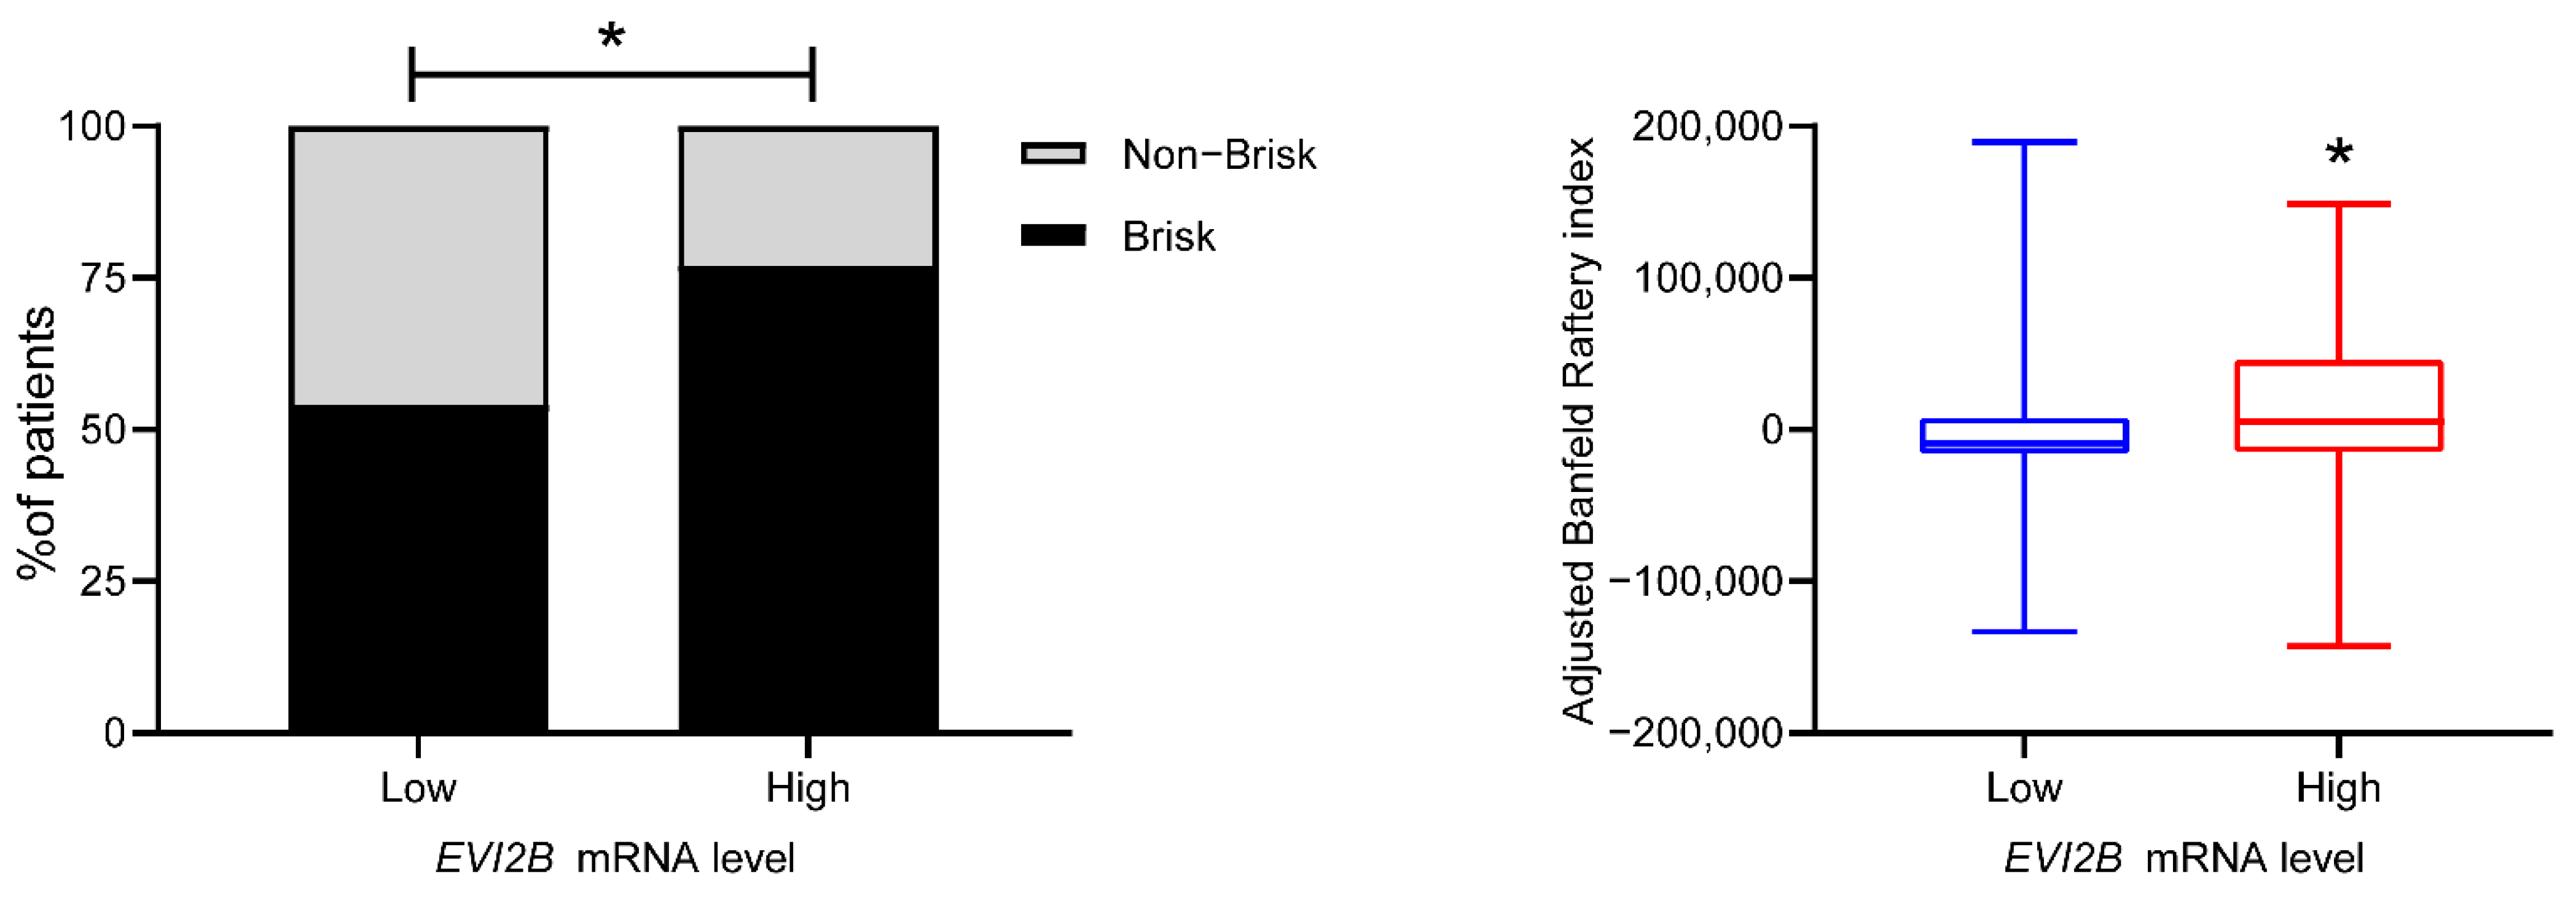
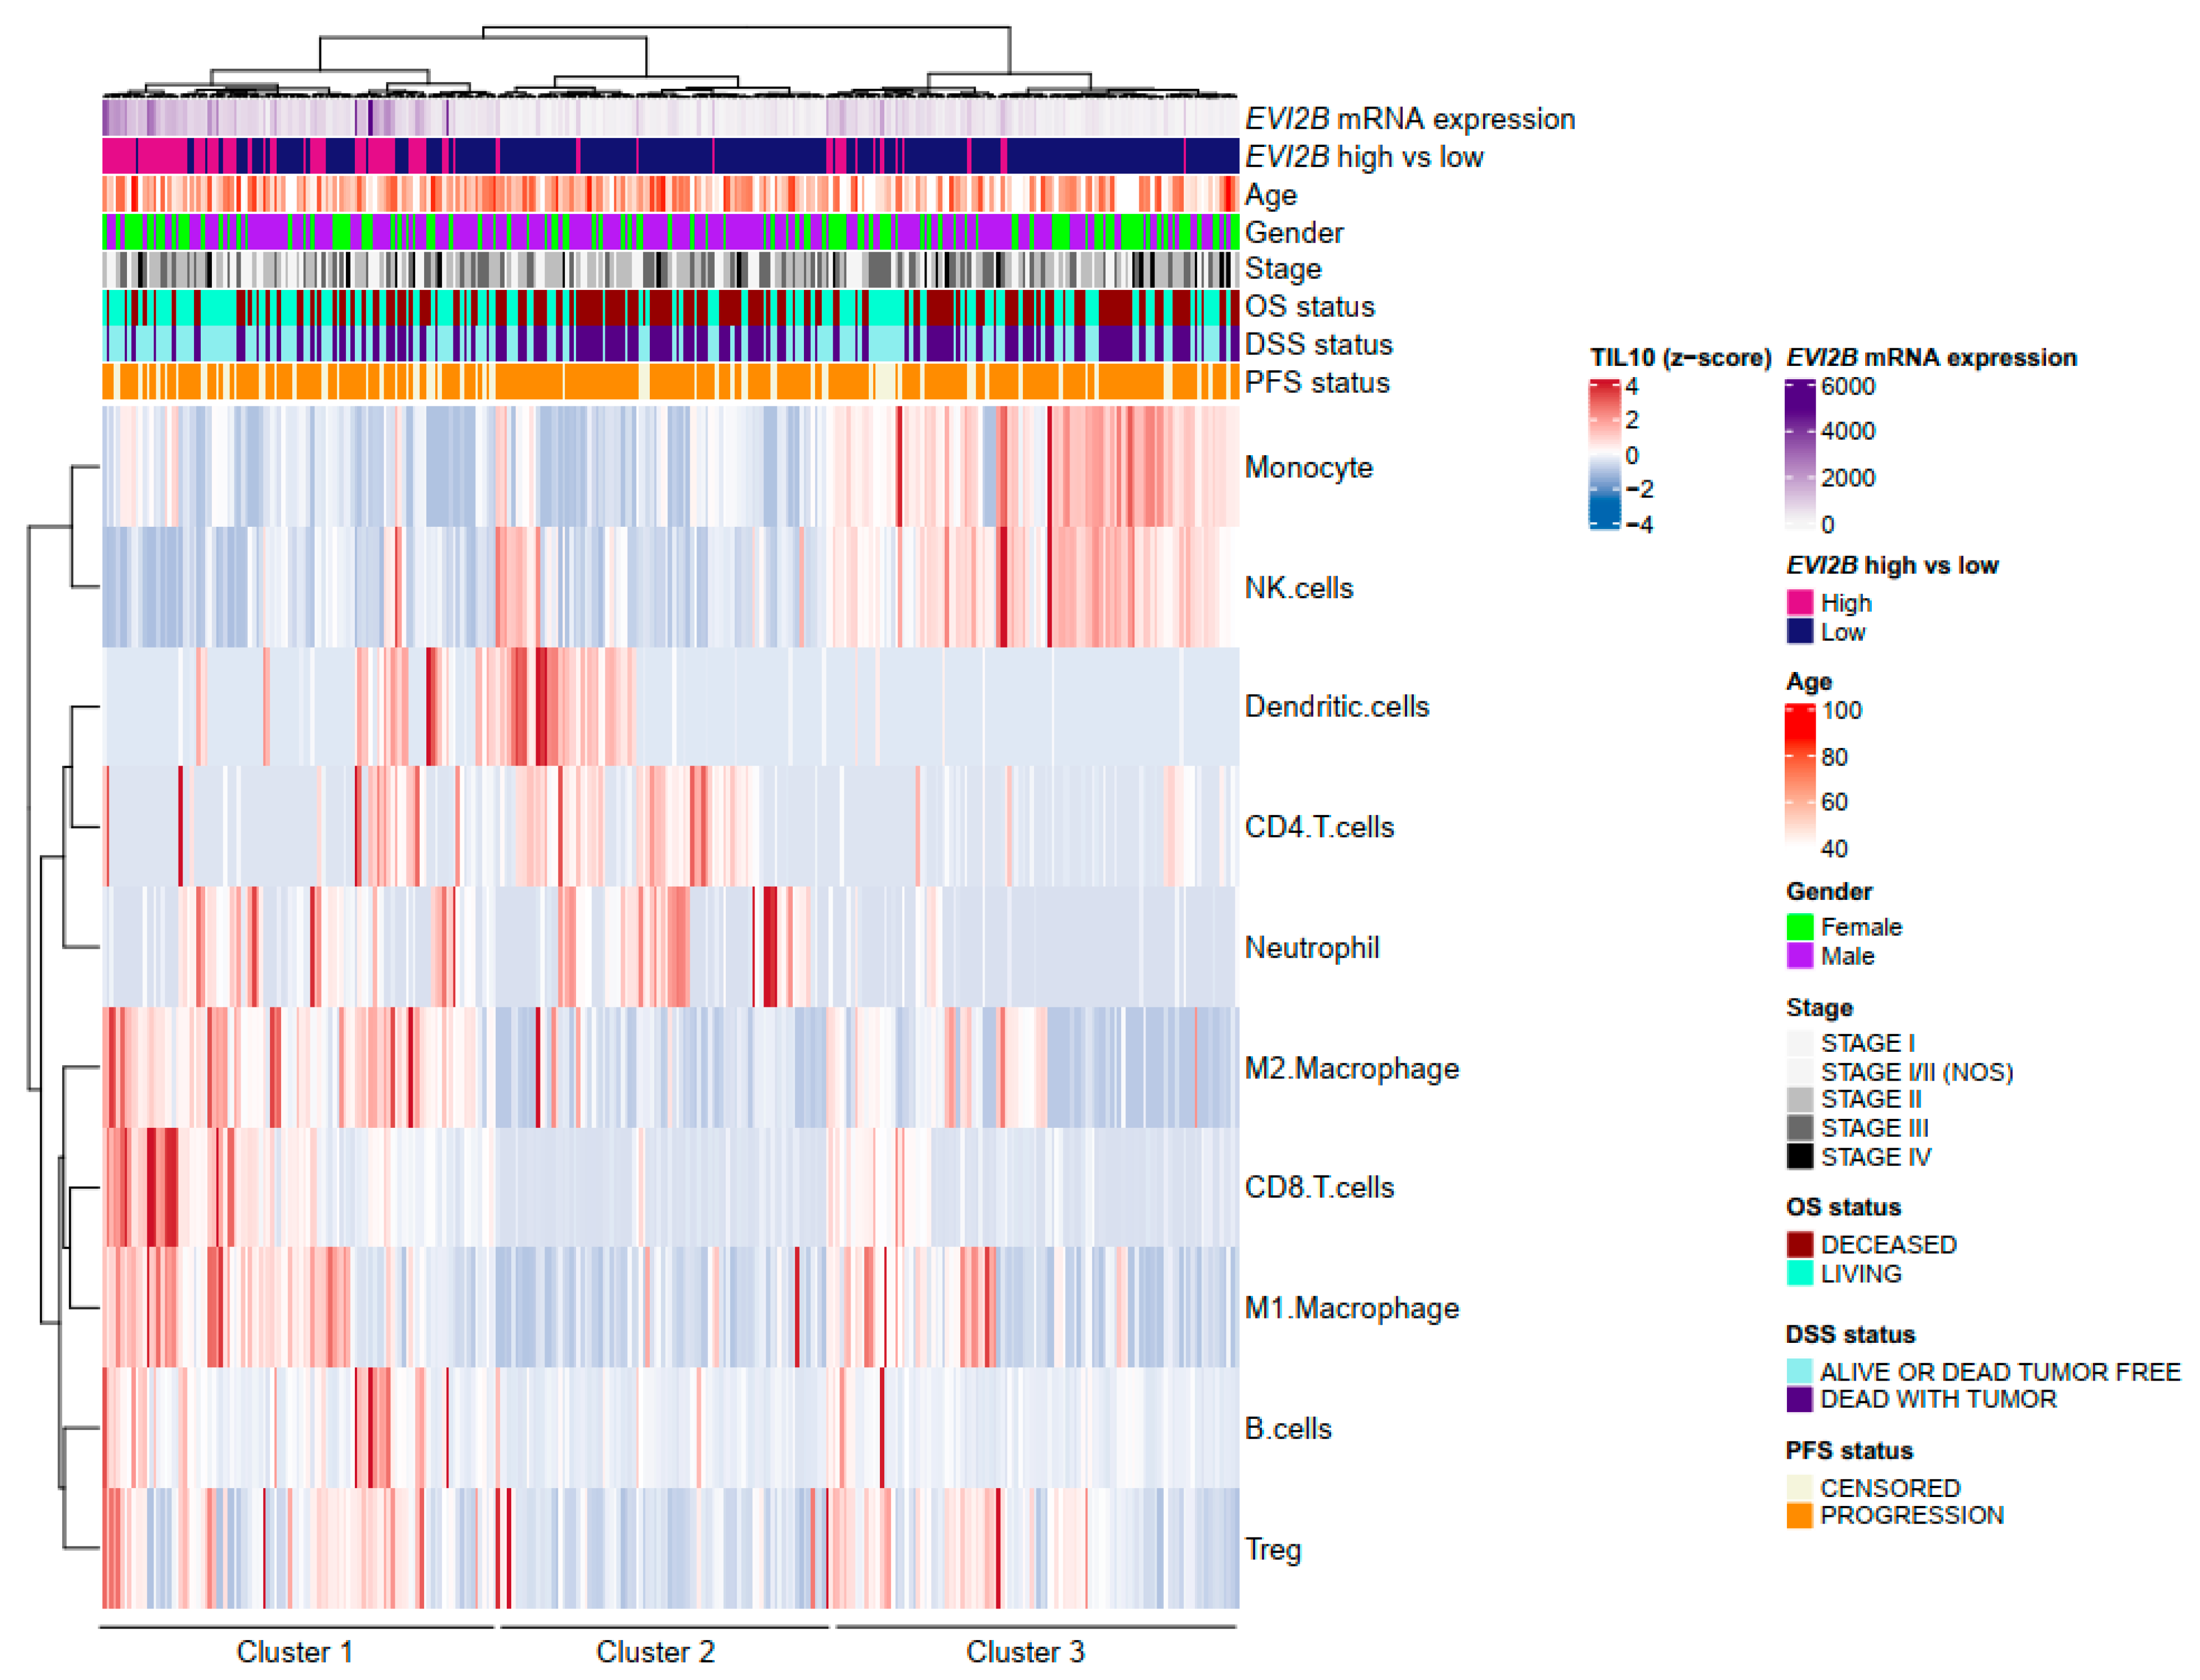
3.2. Spatial Pattern of Infiltrating Immune Cells by EVI2B Gene Expression

The spatial structure of infiltrating lymphocytes in tumor tissue such as global distribution and clustering patterns of TILs is vital to predicting patient prognosis [12]. We compared the distribution of TILs described in a previous study [12] between the EVI2B high vs. EVI2B low patient groups. Seven patients with the indeterminate pattern were excluded. In the EVI2B high patient group, 77.3% (58/75) had a brisk pattern (band-like and brisk diffuse), whereas 22.7% (17/75) had a non-brisk pattern (non-brisk multifocal, non-brisk focal, and none). In the EVI2B low patient group, almost half of the included patients had a brisk pattern (54.3%, 119/219). The distribution pattern between the EVI2B high and EVI2B low patient group was significantly different (p = 0.0002, Fisher’s exact test, Figure 2 left panel).
Computed clustering patterns of TILs such as determinant ratio [13], C [14], Banfield and Raftery [15], and Ball and Hall [16] are associated with prognosis in cancer patients [12]. A higher Banfield and Raftery index was significantly associated with better prognosis in TCGA melanoma patients [12]. In our study, the Banfield and Raftery index was significantly higher in the EVI2B high patients (Figure 2, right panel). In contrast, the other indices (adjusted Ball and Hall, adjusted C, and adjusted determinant ratio) were not significantly different (Figure S3).

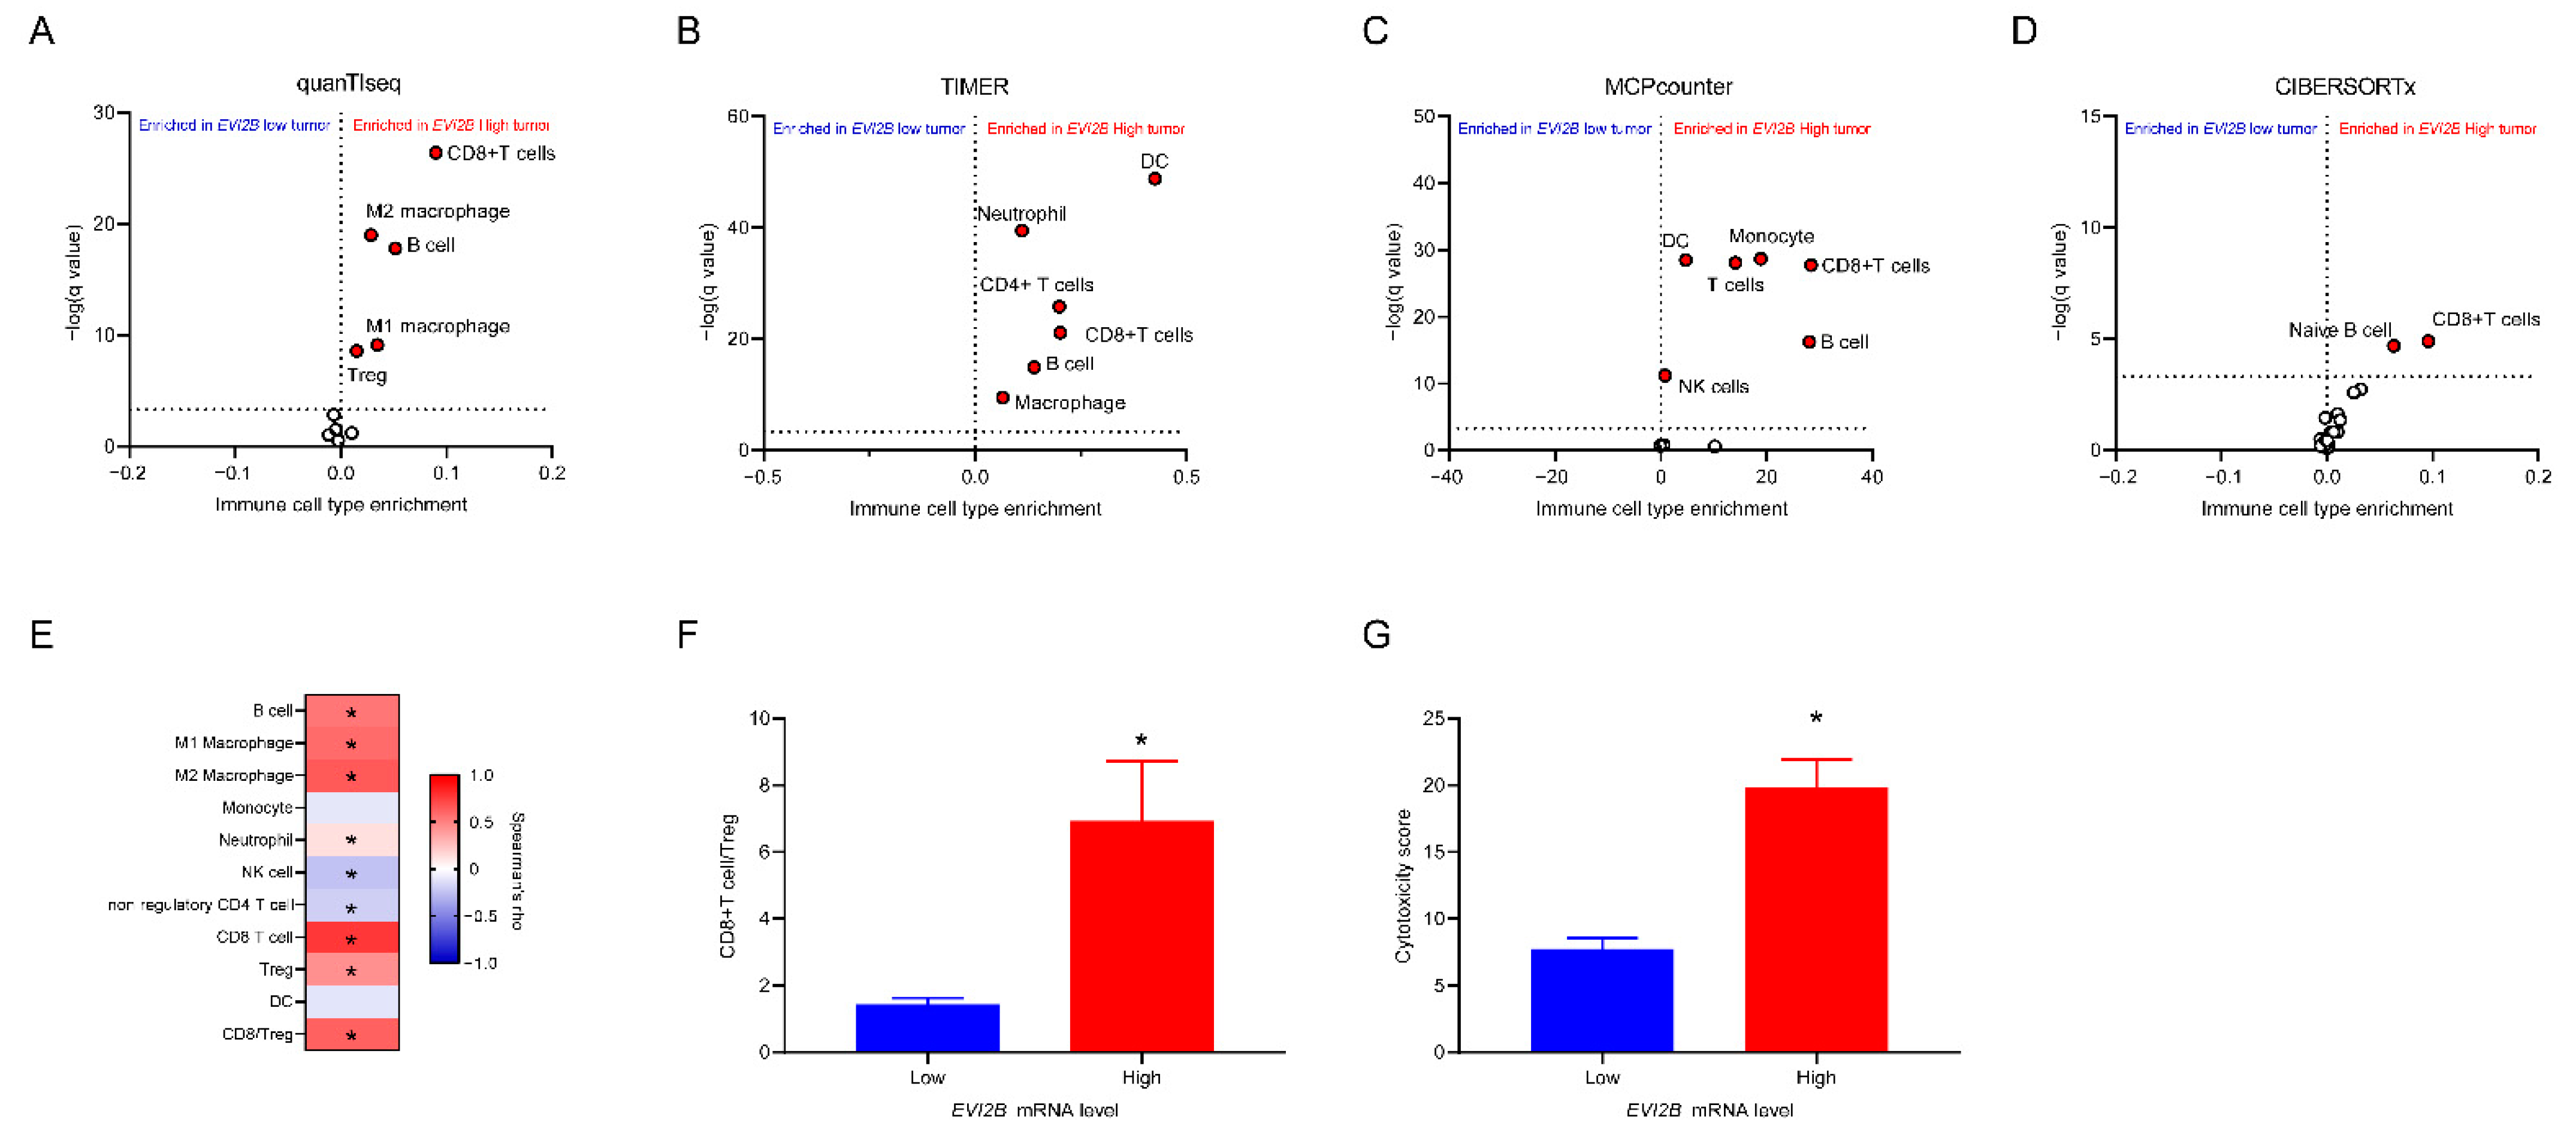
3.3. Infiltrating Immune Cells with EVI2B mRNA Level

To characterize the TIL population in the TME, we investigated the estimated fractions of TILs using the quanTIseq method [17]. Most of the EVI2B high tumors belonged to Cluster 1, and Cluster 2 or 3 consisted of EVI2B low tumors. Among EVI2B low tumors, Cluster 3 was enriched with particularly monocytes and NK cells, whereas Cluster 2 had dendritic cells, CD4+ T cells, and neutrophils. Notable, Cluster 1 (mostly EVI2B high tumor) had enriched cell fractions of CD8+ T cells, M1 and M2 macrophages, Treg, and B cells, while the other clusters (mostly EVI2B low tumor) had none of them (Figure 3). Similarly, the estimated TIL fraction by CIBERSORTx [29] showed one cluster in which most of patients were EVI2B high tumors, and had enriched CD8+ cells and M1 macrophages (Figure S4).
Next, we compared each estimated TIL population between the EVI2B high and EVI2B low patients. By the quanTIseq estimation [17], CD8+ T cells, M1 and M2 macrophages, B cells, and regulatory T cells (Treg) were significantly increased in EVI2B high patients (Figure 4A). Similarly, the other estimations by TIMER [27], MCPcounter [28], and CIBERSORTx [29] supported the increased CD8+ T cells and B cells (Figure 4B–D). Additionally, the EVI2B mRNA level was significantly correlated with the fractions of CD8+ T cells, Treg, M1/M2 macrophages, and B cells (Figure 4E). In melanoma patients, a balance of CD8+ T cells over Treg is essential for the prognosis. Here, we found that the CD8/Treg ratio and cytotoxicity score (by the MCPcounter method [28]) were significantly higher in EVI2B high patients (Figure 4F,G).
IFN-γ is a critical driver of programmed death ligand-1 (PD-L1) expression in cancer and host cells, and the IFN-γ related gene signature can predict the response to the anti-PD-1 blockade (pembrolizumab) [18]. We evaluated the correlation of EVI2B gene expression in metastatic melanoma samples with the IFN-γ related gene signature (CXCL10, CXCL9, HLA-DRA, IDO1, IFNG, and STAT1) [18]. Interestingly, EVI2B gene expression positively correlated with all of the six genes (Figure 5). The CRMA gene signature (CSAG1, CSAG2, CSAG3, MAGEA2, MAGEA3, MAGEA6, and MAGEA12) is a predictor of resistance against anti-CTLA-4 blockade therapy [19]. Contrary to the IFN-γ related gene signature, we found no significant correlation with the CRMA gene signature (Figure 5 left). To further explore the association of EVI2B with immune-related genes, we evaluated the correlation with two sets of genes (immunostimulators and immunoinhibitors) [32] (Figure S5). Most of genes were positively correlated with EVI2B mRNA levels. Among the immunostimulators, only PVR and CD276 were negatively correlated with EVI2B. VTCN1 was the only immunoinhibitory gene that was negatively correlated with EVI2B.

4. Discussion

Here, we report that EVI2B mRNA expression in tumor tissue was a favorable prognostic factor in metastatic melanoma patients. Melanoma tumors with higher EVI2B mRNA levels were characterized by a brisk pattern of TIL distribution with increased infiltration of multiple TILs, including CD8+ T cells. In EVI2B high patients, the ratio of CD8+ T cell to Treg was higher with increased cytotoxic activity. Moreover, EVI2B gene expression was positively correlated with IFN-γ related gene signature.
EVI2B (CD361 [7]) is a protein-coding gene that has been described as a common viral integration site in retrovirally-induced murine leukemia [8]. Granulocytic differentiation and functionality of hematopoietic progenitors are associated [9]. EVI2B works as a lymphocyte-specific marker in peripheral blood. EVI2B is one of the top 100 genes related to lymphocyte-specific attractor metagenes [10]. There are few publications on the association of EVI2B with cancer prognosis. In colorectal cancer, one study showed that EVI2B was one of the hub gene sets associated with tumor progression [11].
The current study adds a potential explanation for a favorable role of EVI2B in metastatic melanoma and shows that a higher EVI2B gene expression was associated with both increased TILs and favorable spatial arrangement of TILs. As compared with a non-brisk pattern of TILs, the brisk distribution pattern was associated with a high proportion of CD8+ T cells across tumors [12]. Consistent with this, we observed a higher CD8+ T cell fraction in the EVI2B high patient group. Moreover, the EVI2B high patients could have increased antitumor activity by a higher CD8+ T cell/Treg ratio, increased cytotoxicity score, and a positive correlation with IFN-γ and its related genes. Production of IFN-γ is observed by macrophages or certain types of lymphocytes, including effector CD8+ T cells, Th1 cells, NK, and NK T cells [33,34]. IFN-γ promotes increased tumor immunogenicity, cytotoxicity of CD8+ T cells, and migration of CD8+ T cells, NK cells, and NK T cells to a tumor site [35]. Therefore, IFN-γ in EVI2B high tumors mediates increased CD8+ T cells, contributing to a better prognosis. Of note, we observed some EVI2B low patients (i.e., Cluster 3) that harbored NK cells in tumor tissue (Figure 3). NK cells infiltration in melanoma can be a favorable prognostic factor [36]. NK cells in cancer tissue work for the recruitment/maturation of dendritic cells and Th1 differentiation [37]. However, our data showed that the NK cell-enriched patients lacked dendritic cells or CD8+ T cells (Figure 3). This could explain that enriched NK cells in EVI2B low patients are unlikely to contribute to a better prognosis.
The biomarker of a clinical response to an immune checkpoint blockade has been rigorously studied due to its limited response [38]. As for anti-PD-1 blockade, the IFN-γ gene signature (IDO1, CXCL10, CXCL9, HLA-DRA, STAT1, and IFNG) predicts the response to anti-PD-1 therapy in multiple tumors, including melanoma [18]. Recently, de Assis et al. showed that ARNTL (as known as BMAL1) was potentially a new clinical biomarker for T-cell based immunotherapy [39]. In the TCGA dataset, we found that EVI2B had a positive correlation with ARNTL (Figure S6). Moreover, EVI2B is highly correlated with immunostimulators and immunoinhibitors. Our data showed that EVI2B is closely associated with multiple sets of TILs and immunomodulatory genes; therefore, in this new era of immune oncology (IO), EVI2B could be a potentially interesting target for IO research in melanoma. The current study has multiple limitations. First, the publicly available cohorts that we used had a diverse background of patients with different disease stages or treatments, leading to difficulty in interpreting the results. Second, the results should be carefully interpreted because any random single or sets of genes can be significantly associated with a prognosis [40]. Third, the different tools or algorithms can harbor a potential bias due to different data processing or normalization. Further large studies would be necessary to demonstrate the predictive role of EVI2B mRNA level on the response to immune checkpoint blockade.

5. Conclusions

This study identifies the EVI2B mRNA expression as a prognostic biomarker in metastatic melanoma with IFN-γ related immune infiltration.

Supplementary Materials

The following are available online at https://www.mdpi.com/article/10.3390/cancers13164110/s1, Table S1: Multivariate Cox regression analysis with dichotomized EVI2B mRNA levels on overall survival of the TCGA dataset, Figure S1: Distribution of EVI2B mRNA levels in metastatic melanoma of the TCGA cohort, Figure S2: Kaplan–Meier survival curves in EVI2B high vs. EVI2B low patients with a 50% cut-off value in metastatic melanoma patients of the TCGA, GSE65904, and GSE19234 datasets, Figure S3: Distribution of EVI2B mRNA levels in metastatic melanoma of the TCGA cohort, Figure S4: Heatmap of estimated TILs fractions by CIBERSORTx and clinical data showing two clusters in metastatic melanoma patients by non-hierarchical clustering, Figure S5: Spearman correlation of EVI2B mRNA level with immunostimulators and immunoinhibitors, Figure S6: Spearman correlation of EVI2B mRNA level with ARNTL (BMAL1) in metastatic melanoma patients of the TCGA cohort. TPM, transcripts per million.

Author Contributions

Conceptualization, S.Y. and K.U.; data curation, S.Y.; formal analysis, S.Y.; writing—original draft, S.Y.; writing—review and editing, S.Y. and K.U. All authors have read and agreed to the published version of the manuscript.

Funding

No internal or external funding was received for this study.

Institutional Review Board Statement

Not applicable.

Informed Consent Statement

Not applicable.

Data Availability Statement

All the data used in this study are publicly available.

Conflicts of Interest

The authors declare no conflict of interest in this research.

References

  1. Schadendorf, D.; van Akkooi, A.C.J.; Berking, C.; Griewank, K.G.; Gutzmer, R.; Hauschild, A.; Stang, A.; Roesch, A.; Ugurel, S. Melanoma. Lancet 2018, 392, 971–984. [Google Scholar] [CrossRef]
  2. Phillips, M.; Marsden, H.; Jaffe, W.; Matin, R.N.; Wali, G.N.; Greenhalgh, J.; McGrath, E.; James, R.; Ladoyanni, E.; Bewley, A.; et al. Assessment of accuracy of an artificial intelligence algorithm to detect melanoma in images of skin lesions. JAMA Netw. Open 2019, 2, e1913436. [Google Scholar] [CrossRef] [PubMed] [Green Version]
  3. Braeuer, R.R.; Watson, I.R.; Wu, C.J.; Mobley, A.K.; Kamiya, T.; Shoshan, E.; Bar-Eli, M. Why is melanoma so metastatic? Pigment Cell Melanoma Res. 2014, 27, 19–36. [Google Scholar] [CrossRef]
  4. Antohe, M.; Nedelcu, R.I.; Nichita, L.; Popp, C.G.; Cioplea, M.; Brinzea, A.; Hodorogea, A.; Calinescu, A.; Balaban, M.; Ion, D.A.; et al. Tumor infiltrating lymphocytes: The regulator of melanoma evolution. Oncol. Lett. 2019, 17, 4155–4161. [Google Scholar] [CrossRef]
  5. Azimi, F.; Scolyer, R.A.; Rumcheva, P.; Moncrieff, M.; Murali, R.; McCarthy, S.W.; Saw, R.P.; Thompson, J.F. Tumor-infiltrating lymphocyte grade is an independent predictor of sentinel lymph node status and survival in patients with cutaneous melanoma. J. Clin. Oncol. 2012, 30, 2678–2683. [Google Scholar] [CrossRef]
  6. Yan, Y.; Leontovich, A.A.; Gerdes, M.J.; Desai, K.; Dong, J.; Sood, A.; Santamaria-Pang, A.; Mansfield, A.S.; Chadwick, C.; Zhang, R.; et al. Understanding heterogeneous tumor microenvironment in metastatic melanoma. PLoS ONE 2019, 14, e0216485. [Google Scholar] [CrossRef] [Green Version]
  7. Cawthon, R.M.; Andersen, L.B.; Buchberg, A.M.; Xu, G.F.; O’Connell, P.; Viskochil, D.; Weiss, R.B.; Wallace, M.R.; Marchuk, D.A.; Culver, M.; et al. cDNA sequence and genomic structure of EV12B, a gene lying within an intron of the neurofibromatosis type 1 gene. Genomics 1991, 9, 446–460. [Google Scholar] [CrossRef] [Green Version]
  8. Buchberg, A.M.; Bedigian, H.G.; Jenkins, N.A.; Copeland, N.G. Evi-2, a common integration site involved in murine myeloid leukemogenesis. Mol. Cell Biol. 1990, 10, 4658–4666. [Google Scholar] [CrossRef] [Green Version]
  9. Zjablovskaja, P.; Kardosova, M.; Danek, P.; Angelisova, P.; Benoukraf, T.; Wurm, A.A.; Kalina, T.; Sian, S.; Balastik, M.; Delwel, R.; et al. EVI2B is a C/EBPalpha target gene required for granulocytic differentiation and functionality of hematopoietic progenitors. Cell Death Differ. 2017, 24, 705–716. [Google Scholar] [CrossRef] [PubMed] [Green Version]
  10. Cheng, W.Y.; Ou Yang, T.H.; Anastassiou, D. Biomolecular events in cancer revealed by attractor metagenes. PLoS Comput. Biol. 2013, 9, e1002920. [Google Scholar] [CrossRef] [PubMed] [Green Version]
  11. Yuan, Y.; Chen, J.; Wang, J.; Xu, M.; Zhang, Y.; Sun, P.; Liang, L. Identification hub genes in colorectal cancer by integrating weighted gene co-expression network analysis and clinical validation in vivo and vitro. Front. Oncol. 2020, 10, 638. [Google Scholar] [CrossRef] [PubMed]
  12. Saltz, J.; Gupta, R.; Hou, L.; Kurc, T.; Singh, P.; Nguyen, V.; Samaras, D.; Shroyer, K.R.; Zhao, T.; Batiste, R.; et al. Spatial organization and molecular correlation of tumor-infiltrating lymphocytes using deep learning on pathology images. Cell Rep. 2018, 23, 181–193.e187. [Google Scholar] [CrossRef] [Green Version]
  13. Scott, A.J.; Symons, M.J. Clustering methods based on likelihood ratio criteria. Biometrics 1971, 27, 387–397. [Google Scholar] [CrossRef] [Green Version]
  14. Hubert, L.; Schultz, J. Quadratic assignment as a general data analysis strategy. Br. J. Math. Stat. Psychol. 1976, 29, 190–241. [Google Scholar] [CrossRef]
  15. Banfield, J.D.; Raftery, A.E. Model-based gaussian and non-gaussian clustering. Biometrics 1993, 49, 803–821. [Google Scholar] [CrossRef]
  16. Ball, G.H.; Hall, D.J. A Novel Method of Data Analysis and Pattern Classification; Technical Report; Stanford Research Institute: Menlo Park, CA, USA, 1965. [Google Scholar]
  17. Finotello, F.; Mayer, C.; Plattner, C.; Laschober, G.; Rieder, D.; Hackl, H.; Krogsdam, A.; Loncova, Z.; Posch, W.; Wilflingseder, D.; et al. Molecular and pharmacological modulators of the tumor immune contexture revealed by deconvolution of RNA-seq data. Genome Med. 2019, 11, 34. [Google Scholar] [CrossRef] [Green Version]
  18. Ayers, M.; Lunceford, J.; Nebozhyn, M.; Murphy, E.; Loboda, A.; Kaufman, D.R.; Albright, A.; Cheng, J.D.; Kang, S.P.; Shankaran, V.; et al. IFN-gamma-related mRNA profile predicts clinical response to PD-1 blockade. J. Clin. Investig. 2017, 127, 2930–2940. [Google Scholar] [CrossRef]
  19. Shukla, S.A.; Bachireddy, P.; Schilling, B.; Galonska, C.; Zhan, Q.; Bango, C.; Langer, R.; Lee, P.C.; Gusenleitner, D.; Keskin, D.B.; et al. Cancer-Germline Antigen Expression Discriminates Clinical Outcome to CTLA-4 Blockade. Cell 2018, 173, 624–633.e628. [Google Scholar] [CrossRef] [PubMed] [Green Version]
  20. Cerami, E.; Gao, J.; Dogrusoz, U.; Gross, B.E.; Sumer, S.O.; Aksoy, B.A.; Jacobsen, A.; Byrne, C.J.; Heuer, M.L.; Larsson, E.; et al. The cBio cancer genomics portal: An open platform for exploring multidimensional cancer genomics data. Cancer Discov. 2012, 2, 401–404. [Google Scholar] [CrossRef] [PubMed] [Green Version]
  21. Gao, J.; Aksoy, B.A.; Dogrusoz, U.; Dresdner, G.; Gross, B.; Sumer, S.O.; Sun, Y.; Jacobsen, A.; Sinha, R.; Larsson, E.; et al. Integrative analysis of complex cancer genomics and clinical profiles using the cBioPortal. Sci. Signal 2013, 6, pl1. [Google Scholar] [CrossRef] [Green Version]
  22. Zhang, L.; Wang, Q.; Wang, L.; Xie, L.; An, Y.; Zhang, G.; Zhu, W.; Li, Y.; Liu, Z.; Zhang, X.; et al. OSskcm: An online survival analysis webserver for skin cutaneous melanoma based on 1085 transcriptomic profiles. Cancer Cell Int. 2020, 20, 176. [Google Scholar] [CrossRef] [PubMed]
  23. Cirenajwis, H.; Ekedahl, H.; Lauss, M.; Harbst, K.; Carneiro, A.; Enoksson, J.; Rosengren, F.; Werner-Hartman, L.; Torngren, T.; Kvist, A.; et al. Molecular stratification of metastatic melanoma using gene expression profiling: Prediction of survival outcome and benefit from molecular targeted therapy. Oncotarget 2015, 6, 12297–12309. [Google Scholar] [CrossRef] [PubMed] [Green Version]
  24. Bogunovic, D.; O’Neill, D.W.; Belitskaya-Levy, I.; Vacic, V.; Yu, Y.L.; Adams, S.; Darvishian, F.; Berman, R.; Shapiro, R.; Pavlick, A.C.; et al. Immune profile and mitotic index of metastatic melanoma lesions enhance clinical staging in predicting patient survival. Proc. Natl. Acad. Sci. USA 2009, 106, 20429–20434. [Google Scholar] [CrossRef] [PubMed] [Green Version]
  25. Li, T.; Fan, J.; Wang, B.; Traugh, N.; Chen, Q.; Liu, J.S.; Li, B.; Liu, X.S. TIMER: A web server for comprehensive analysis of tumor-infiltrating immune cells. Cancer Res. 2017, 77, e108–e110. [Google Scholar] [CrossRef] [PubMed] [Green Version]
  26. Li, T.; Fu, J.; Zeng, Z.; Cohen, D.; Li, J.; Chen, Q.; Li, B.; Liu, X.S. TIMER2.0 for analysis of tumor-infiltrating immune cells. Nucleic. Acids Res. 2020, 48, W509–W514. [Google Scholar] [CrossRef]
  27. Li, B.; Severson, E.; Pignon, J.C.; Zhao, H.; Li, T.; Novak, J.; Jiang, P.; Shen, H.; Aster, J.C.; Rodig, S.; et al. Comprehensive analyses of tumor immunity: Implications for cancer immunotherapy. Genome Biol. 2016, 17, 174. [Google Scholar] [CrossRef] [PubMed] [Green Version]
  28. Becht, E.; Giraldo, N.A.; Lacroix, L.; Buttard, B.; Elarouci, N.; Petitprez, F.; Selves, J.; Laurent-Puig, P.; Sautes-Fridman, C.; Fridman, W.H.; et al. Estimating the population abundance of tissue-infiltrating immune and stromal cell populations using gene expression. Genome Biol. 2016, 17, 218. [Google Scholar] [CrossRef]
  29. Newman, A.M.; Steen, C.B.; Liu, C.L.; Gentles, A.J.; Chaudhuri, A.A.; Scherer, F.; Khodadoust, M.S.; Esfahani, M.S.; Luca, B.A.; Steiner, D.; et al. Determining cell type abundance and expression from bulk tissues with digital cytometry. Nat. Biotechnol. 2019, 37, 773–782. [Google Scholar] [CrossRef]
  30. Benjamini, Y.; Krieger, A.M.; Yekutieli, D. Adaptive linear step-up procedures that control the false discovery rate. Biometrika 2006, 93, 491–507. [Google Scholar] [CrossRef]
  31. Tang, Z.; Kang, B.; Li, C.; Chen, T.; Zhang, Z. GEPIA2: An enhanced web server for large-scale expression profiling and interactive analysis. Nucleic. Acids Res. 2019, 47, W556–W560. [Google Scholar] [CrossRef] [Green Version]
  32. Charoentong, P.; Finotello, F.; Angelova, M.; Mayer, C.; Efremova, M.; Rieder, D.; Hackl, H.; Trajanoski, Z. Pan-cancer immunogenomic analyses reveal genotype-immunophenotype relationships and predictors of response to checkpoint blockade. Cell Rep. 2017, 18, 248–262. [Google Scholar] [CrossRef] [PubMed] [Green Version]
  33. Kaplan, D.H.; Shankaran, V.; Dighe, A.S.; Stockert, E.; Aguet, M.; Old, L.J.; Schreiber, R.D. Demonstration of an interferon gamma-dependent tumor surveillance system in immunocompetent mice. Proc. Natl. Acad. Sci. USA 1998, 95, 7556–7561. [Google Scholar] [CrossRef] [Green Version]
  34. Bhat, P.; Leggatt, G.; Waterhouse, N.; Frazer, I.H. Interferon-gamma derived from cytotoxic lymphocytes directly enhances their motility and cytotoxicity. Cell Death Dis. 2017, 8, e2836. [Google Scholar] [CrossRef] [PubMed] [Green Version]
  35. Nakajima, C.; Uekusa, Y.; Iwasaki, M.; Yamaguchi, N.; Mukai, T.; Gao, P.; Tomura, M.; Ono, S.; Tsujimura, T.; Fujiwara, H.; et al. A role of interferon-gamma (IFN-gamma) in tumor immunity: T cells with the capacity to reject tumor cells are generated but fail to migrate to tumor sites in IFN-gamma-deficient mice. Cancer Res. 2001, 61, 3399–3405. [Google Scholar]
  36. Cursons, J.; Souza-Fonseca-Guimaraes, F.; Foroutan, M.; Anderson, A.; Hollande, F.; Hediyeh-Zadeh, S.; Behren, A.; Huntington, N.D.; Davis, M.J. A gene signature predicting natural killer cell infiltration and improved survival in melanoma patients. Cancer Immunol. Res. 2019, 7, 1162–1174. [Google Scholar] [CrossRef] [Green Version]
  37. Lee, H.; Da Silva, I.P.; Palendira, U.; Scolyer, R.A.; Long, G.V.; Wilmott, J.S. Targeting NK cells to enhance melanoma response to immunotherapies. Cancers 2021, 13, 1363. [Google Scholar] [CrossRef]
  38. Cogdill, A.P.; Andrews, M.C.; Wargo, J.A. Hallmarks of response to immune checkpoint blockade. Br. J. Cancer 2017, 117, 1–7. [Google Scholar] [CrossRef] [PubMed] [Green Version]
  39. de Assis, L.V.M.; Kinker, G.S.; Moraes, M.N.; Markus, R.P.; Fernandes, P.A.; Castrucci, A.M.L. Expression of the circadian clock gene BMAL1 Positively correlates with antitumor immunity and patient survival in metastatic melanoma. Front. Oncol. 2018, 8, 185. [Google Scholar] [CrossRef] [Green Version]
  40. Venet, D.; Dumont, J.E.; Detours, V. Most random gene expression signatures are significantly associated with breast cancer outcome. PLoS Comput. Biol. 2011, 7, e1002240. [Google Scholar] [CrossRef]
Figure 1. Kaplan–Meier survival curves in EVI2B high vs. EVI2B low patients with metastatic melanoma in TCGA, GSE65904, and GSE19234. The outcomes are overall survival (OS) (left and right panels) and disease-free survival (DSS) (middle panel).
Cancers 13 04110 g001
Figure 2. Spatial pattern of TILs in EVI2B high vs. EVI2B low patients: (left) Stacked bar plot of the distribution patterns of TILs (brisk or non-brisk), * p < 0.05 by Fisher’s exact test; (right) adjusted Banfield and Raftery index of TILs clustering patterns, *: p < 0.05 by Mann–Whitney test.
Cancers 13 04110 g002
Figure 3. Heatmap of estimated TIL fractions by quanTIseq estimation [17] and clinical data showing three clusters in metastatic melanoma patients by non-hierarchical clustering.
Cancers 13 04110 g003
Figure 4. Volcano plots of the estimated TIL fraction in EVI2B high vs. EVI2B low patients: (A) quanTIseq; (B) TIMER; (C) MCPcounter; (D) CIBERSORTx. The cell fractions with Q value < 0.05 were considered to be significantly different fractions. (E) Spearman correlation of EVI2B gene expression with the TIL fractions estimated by the quanTIseq method, * p < 0.05. (FG) Comparison of the CD8+ T cell/Treg ratio (F) and cytotoxicity score predicted by the MCPcounter method (G) between EVI2B high vs. EVI2B low patients. * p < 0.05 by Mann–Whitney Tests.
Cancers 13 04110 g004
Figure 5. Spearman correlation of EVI2B gene expression with the IFN-γ related six genes (IDO1, CXCL10, CXCL9, HLA-DRA, STAT1, and IFNG) and the CRMA gene signature (CSAG1, CSAG2, CSAG3, MAGEA2, MAGEA3, MAGEA6, and MAGEA12. * p < 0.05.
Cancers 13 04110 g005
Table 1. Multivariate Cox regression analysis on overall survival on TCGA dataset.
VariablesEVI2B LowEVI2B Highp Value *
No. of patients (%)272 (75%)91 (25%)
Age (years) (median, range)57 (15–87)54 (18–86)0.491
Sex 0.211
  Male17652
  Female9639
Race 0.169
  White25386
  Others (Asian or African American)33
  NA162
TNM stage 0.375
  Stage 061
  Stage I5520
  Stage I/II (NOS)103
  Stage II6012
  Stage III10140
  Stage IV183
  NA2212
TCGA, The Cancer Genome Atlas; SKCM, skin cutaneous melanoma; NOS. not otherwise specified; NA, not available. * Category variables were compared by Fisher exact test or chi-square test and the continuous variables were compared by Mann–Whitney test.
Table 2. Multivariate Cox regression analysis on overall survival on the TCGA dataset.
VariableHR95% CIp-Value
Age at diagnosis1.0211.010–1.032<0.0001
Male (ref: Female)0.8850.629–1.2450.483
Stage at initial diagnosis (ref: Stage 0/I)
II0.9980.633–1.5740.993
III1.5941.056–2.4040.026
IV2.9671.355–6.4980.007
Tumor purity0.7770.294–2.0560.611
EVI2B mRNA level0.7160.610–0.840<0.0001
N = 368. TCGA, The Cancer Genome Atlas; HR, hazard ratio; CI, confidence interval; ref, reference.
Publisher’s Note: MDPI stays neutral with regard to jurisdictional claims in published maps and institutional affiliations.

