
The Impact of Tumor Edema on T2-Weighted 3T-MRI Invasive Breast Cancer Histological Characterization: A Pilot Radiomics Study

 , , , and
Abstract
:Simple Summary
Abstract
1. Introduction
2. Materials and Methods
2.1. Study Population
2.2. MRI Examination
- T2-weighted axial single-shot fast spin echo sequence with a modified Dixon technique (IDEAL) for intravoxel fat-water separation (TR/TE 3500–5200/120–135 ms, matrix 352 × 224, FoV 370 × 370, NEX 1, slice thickness 3.5 mm).
- Diffusion weighted axial single-shot echo-planar with fat suppression sequence (TR/TE 2700/58 ms, matrix 100 × 120, FOV 360 × 360, NEX 6, slice thickness 5 mm) with diffusion-sensitizing gradient applied along the three orthogonal axes and with a b-value of 0, 500, and 1000 s/mm2.
- T1-weighted axial 3D dynamic gradient echo sequence with fat suppression (VIBRANT) (TR/TE 6.6/4.3 ms, flip angle 10°, matrix 512 × 256, NEX 1, slice thickness 2.4 mm), before and five times after intravenous contrast medium injection.
- Current guidelines suggest at least three time points to measure during the post-contrast-phase: one before the administration of contrast medium, one approximately 2 min later to capture the peak, one in the late phase. This allows us to evaluate whether a lesion continues to enhance or is characterized by contrast agent wash-out. At least two measurements after contrast medium administration are recommended, even if the optimal number of repetitions is unknown. In our center, we usually perform five acquisitions after contrast medium administration ensuring to obtain a specific signal intensity curve time without penalizing the duration of the examination.
- -
- Location on the breast quadrant;
- -
- Margins: regular, irregular, lobulated, spiculated or non-mass;
- -
- Dimensions (mm);
- -
- Morphology: round, oval, or irregular;
- -
- Contrast enhancement, quantified using the signal intensity/time curve: type I, characterized by a slow wash-in and without wash-out, type II, defined by a plateau curve after a rapid/slow wash-in, and type III, with rapid wash-in and rapid wash-out;
- -
- Associated-tumor edema type.
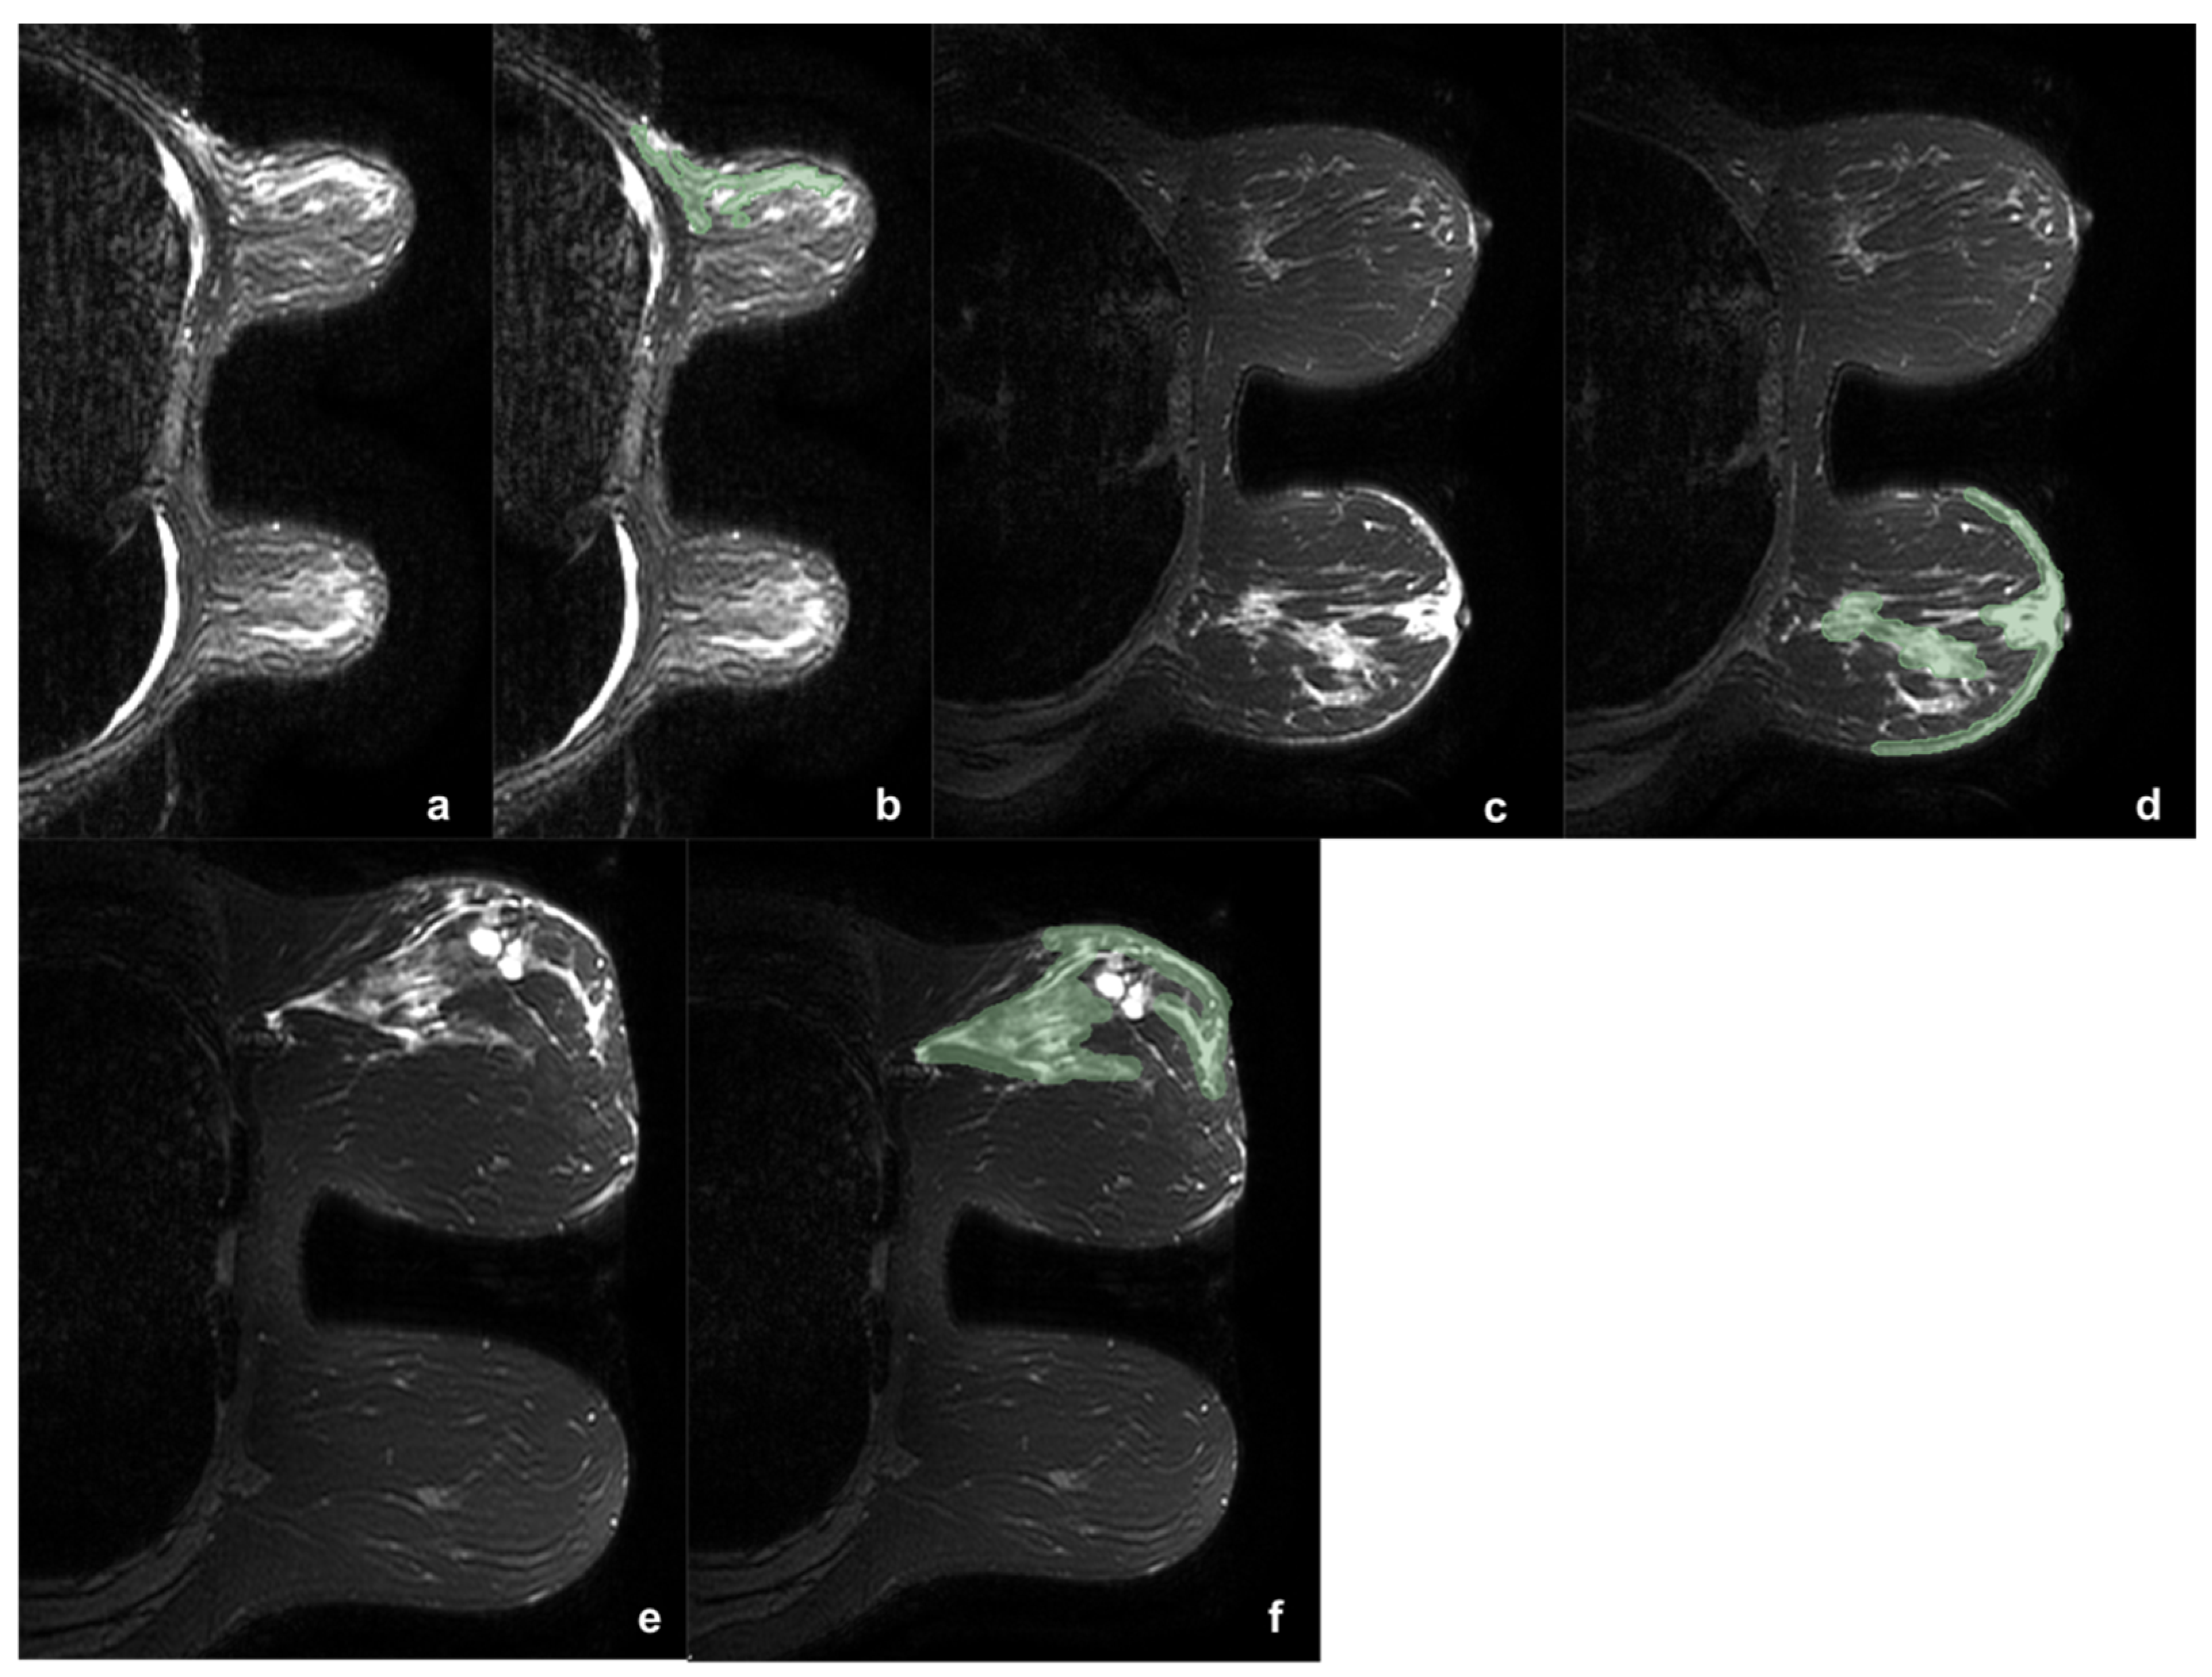
2.3. Edema Evaluation
2.4. Histological Characteristics
2.5. Statistical Analysis
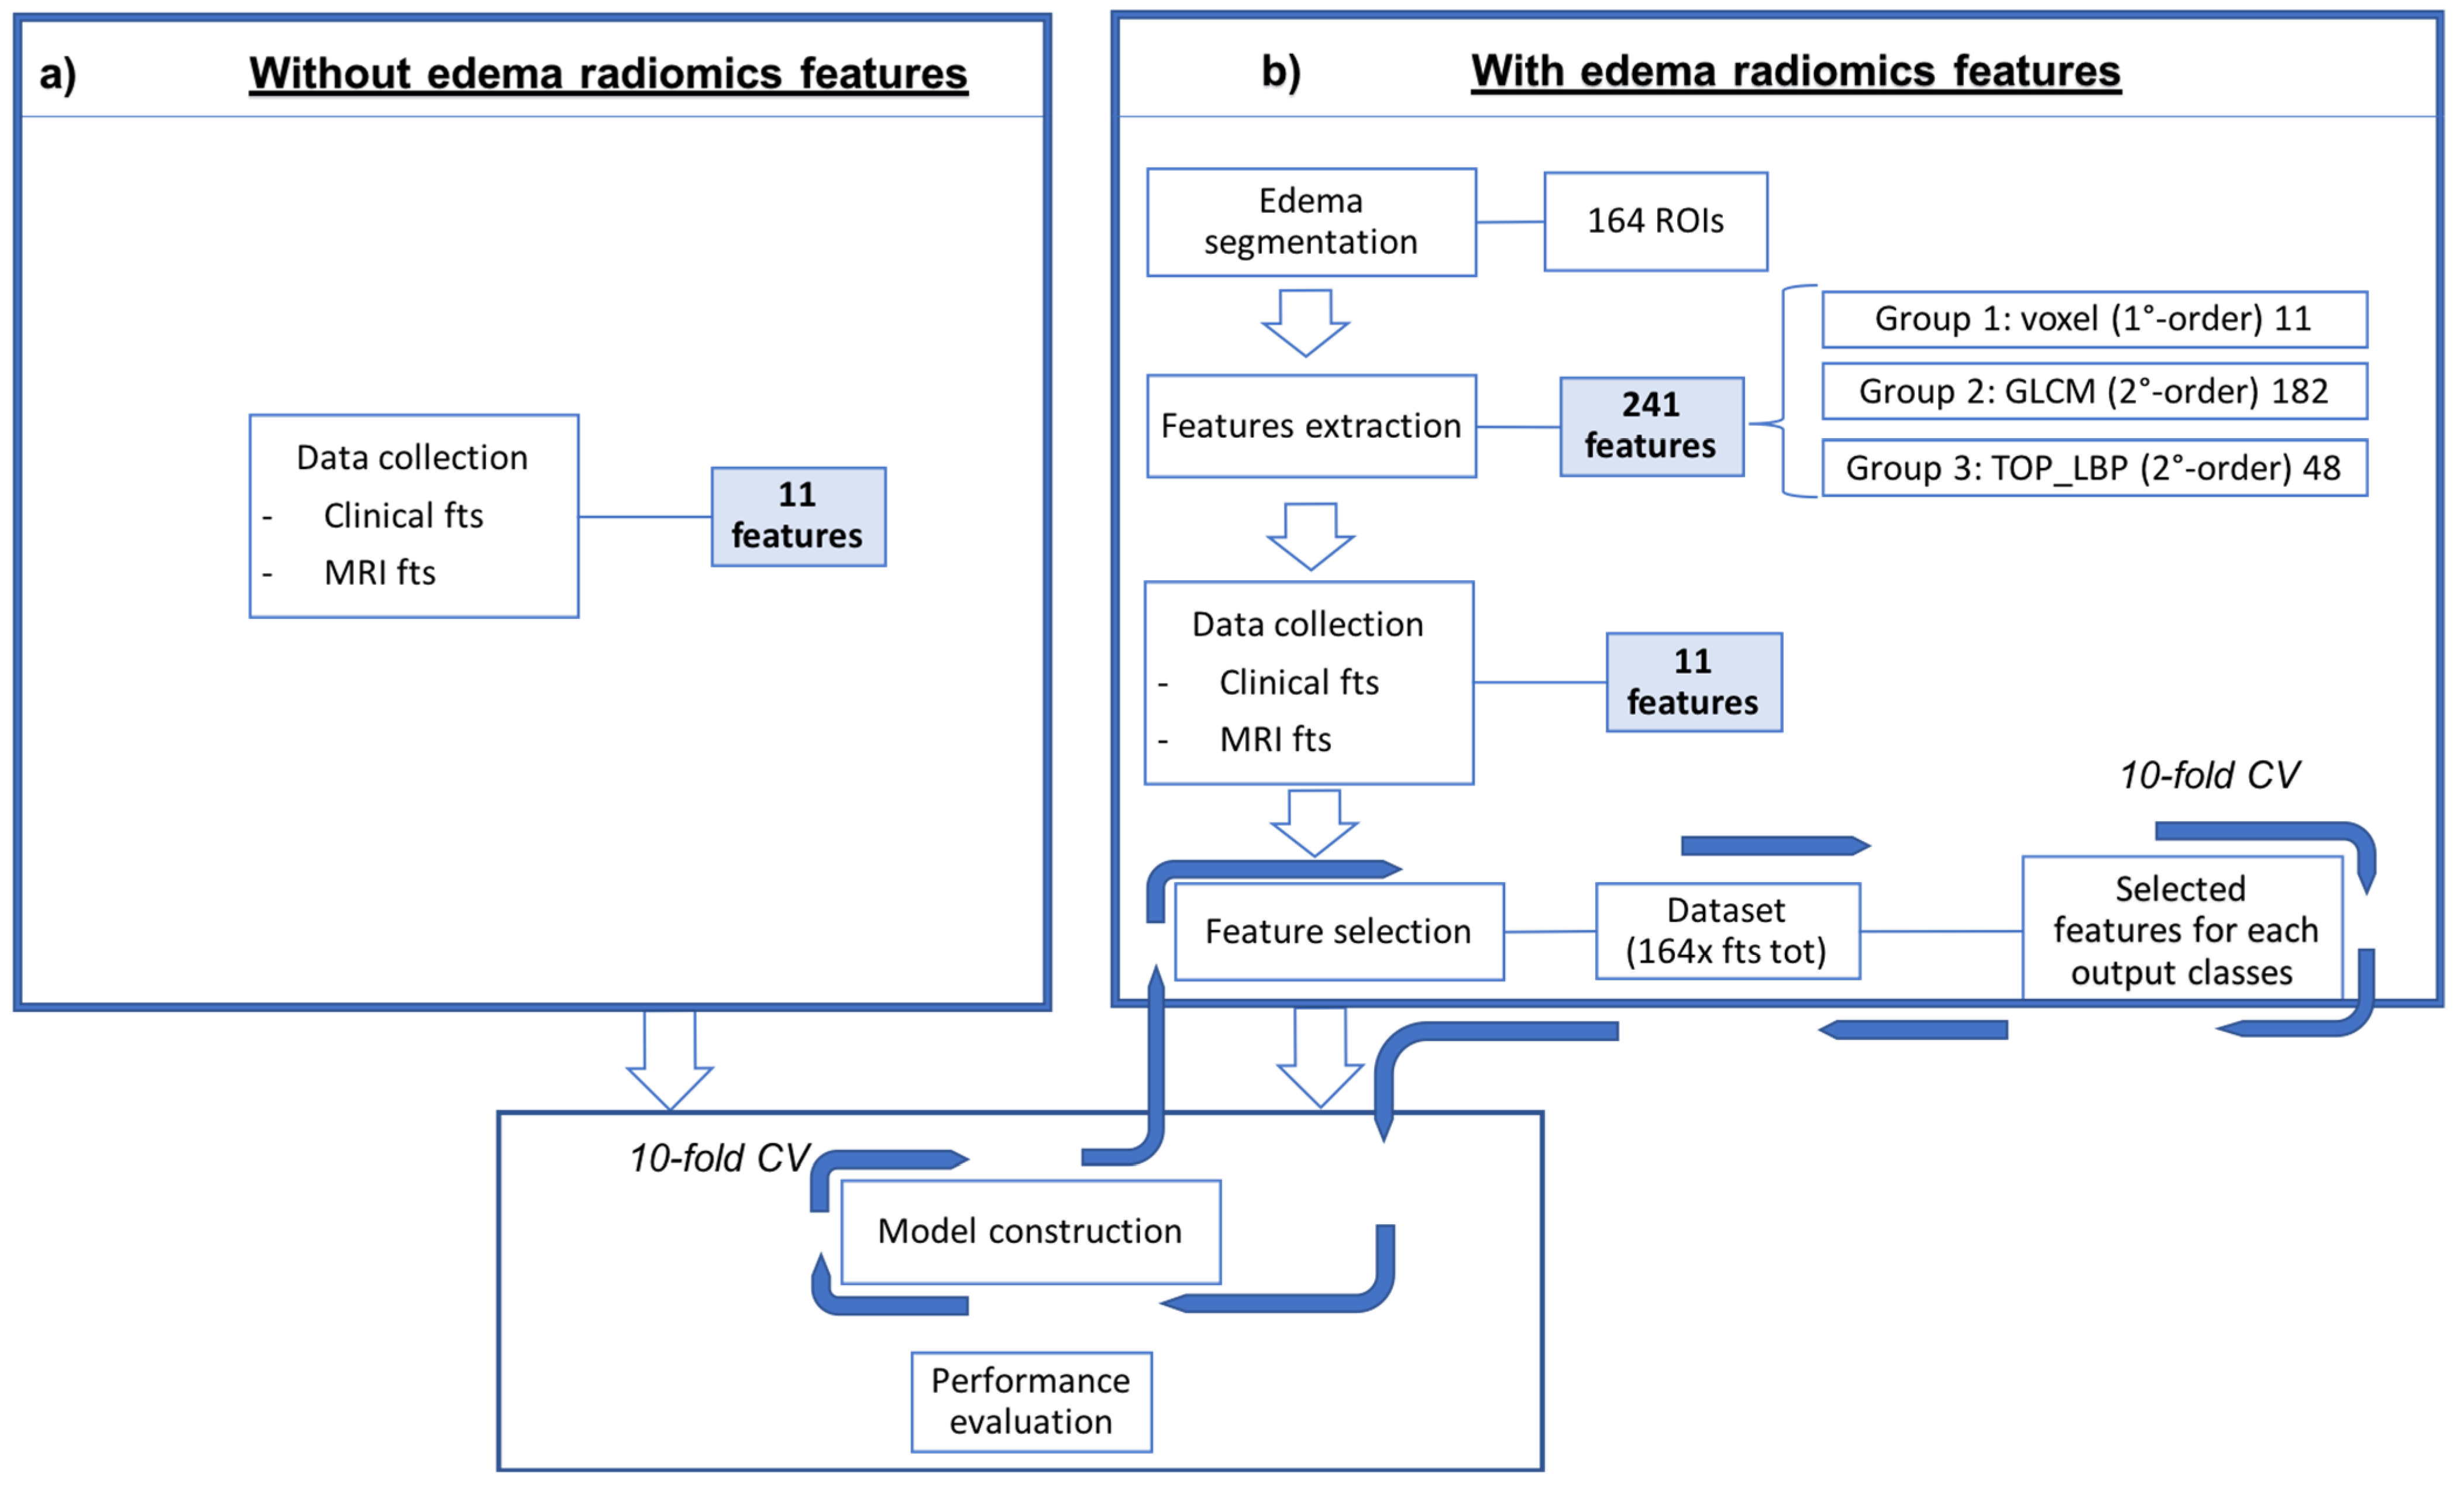
2.6. Radiomics
2.6.1. Segmentation
2.6.2. Feature Extraction and Selection
2.6.3. Classification
3. Results
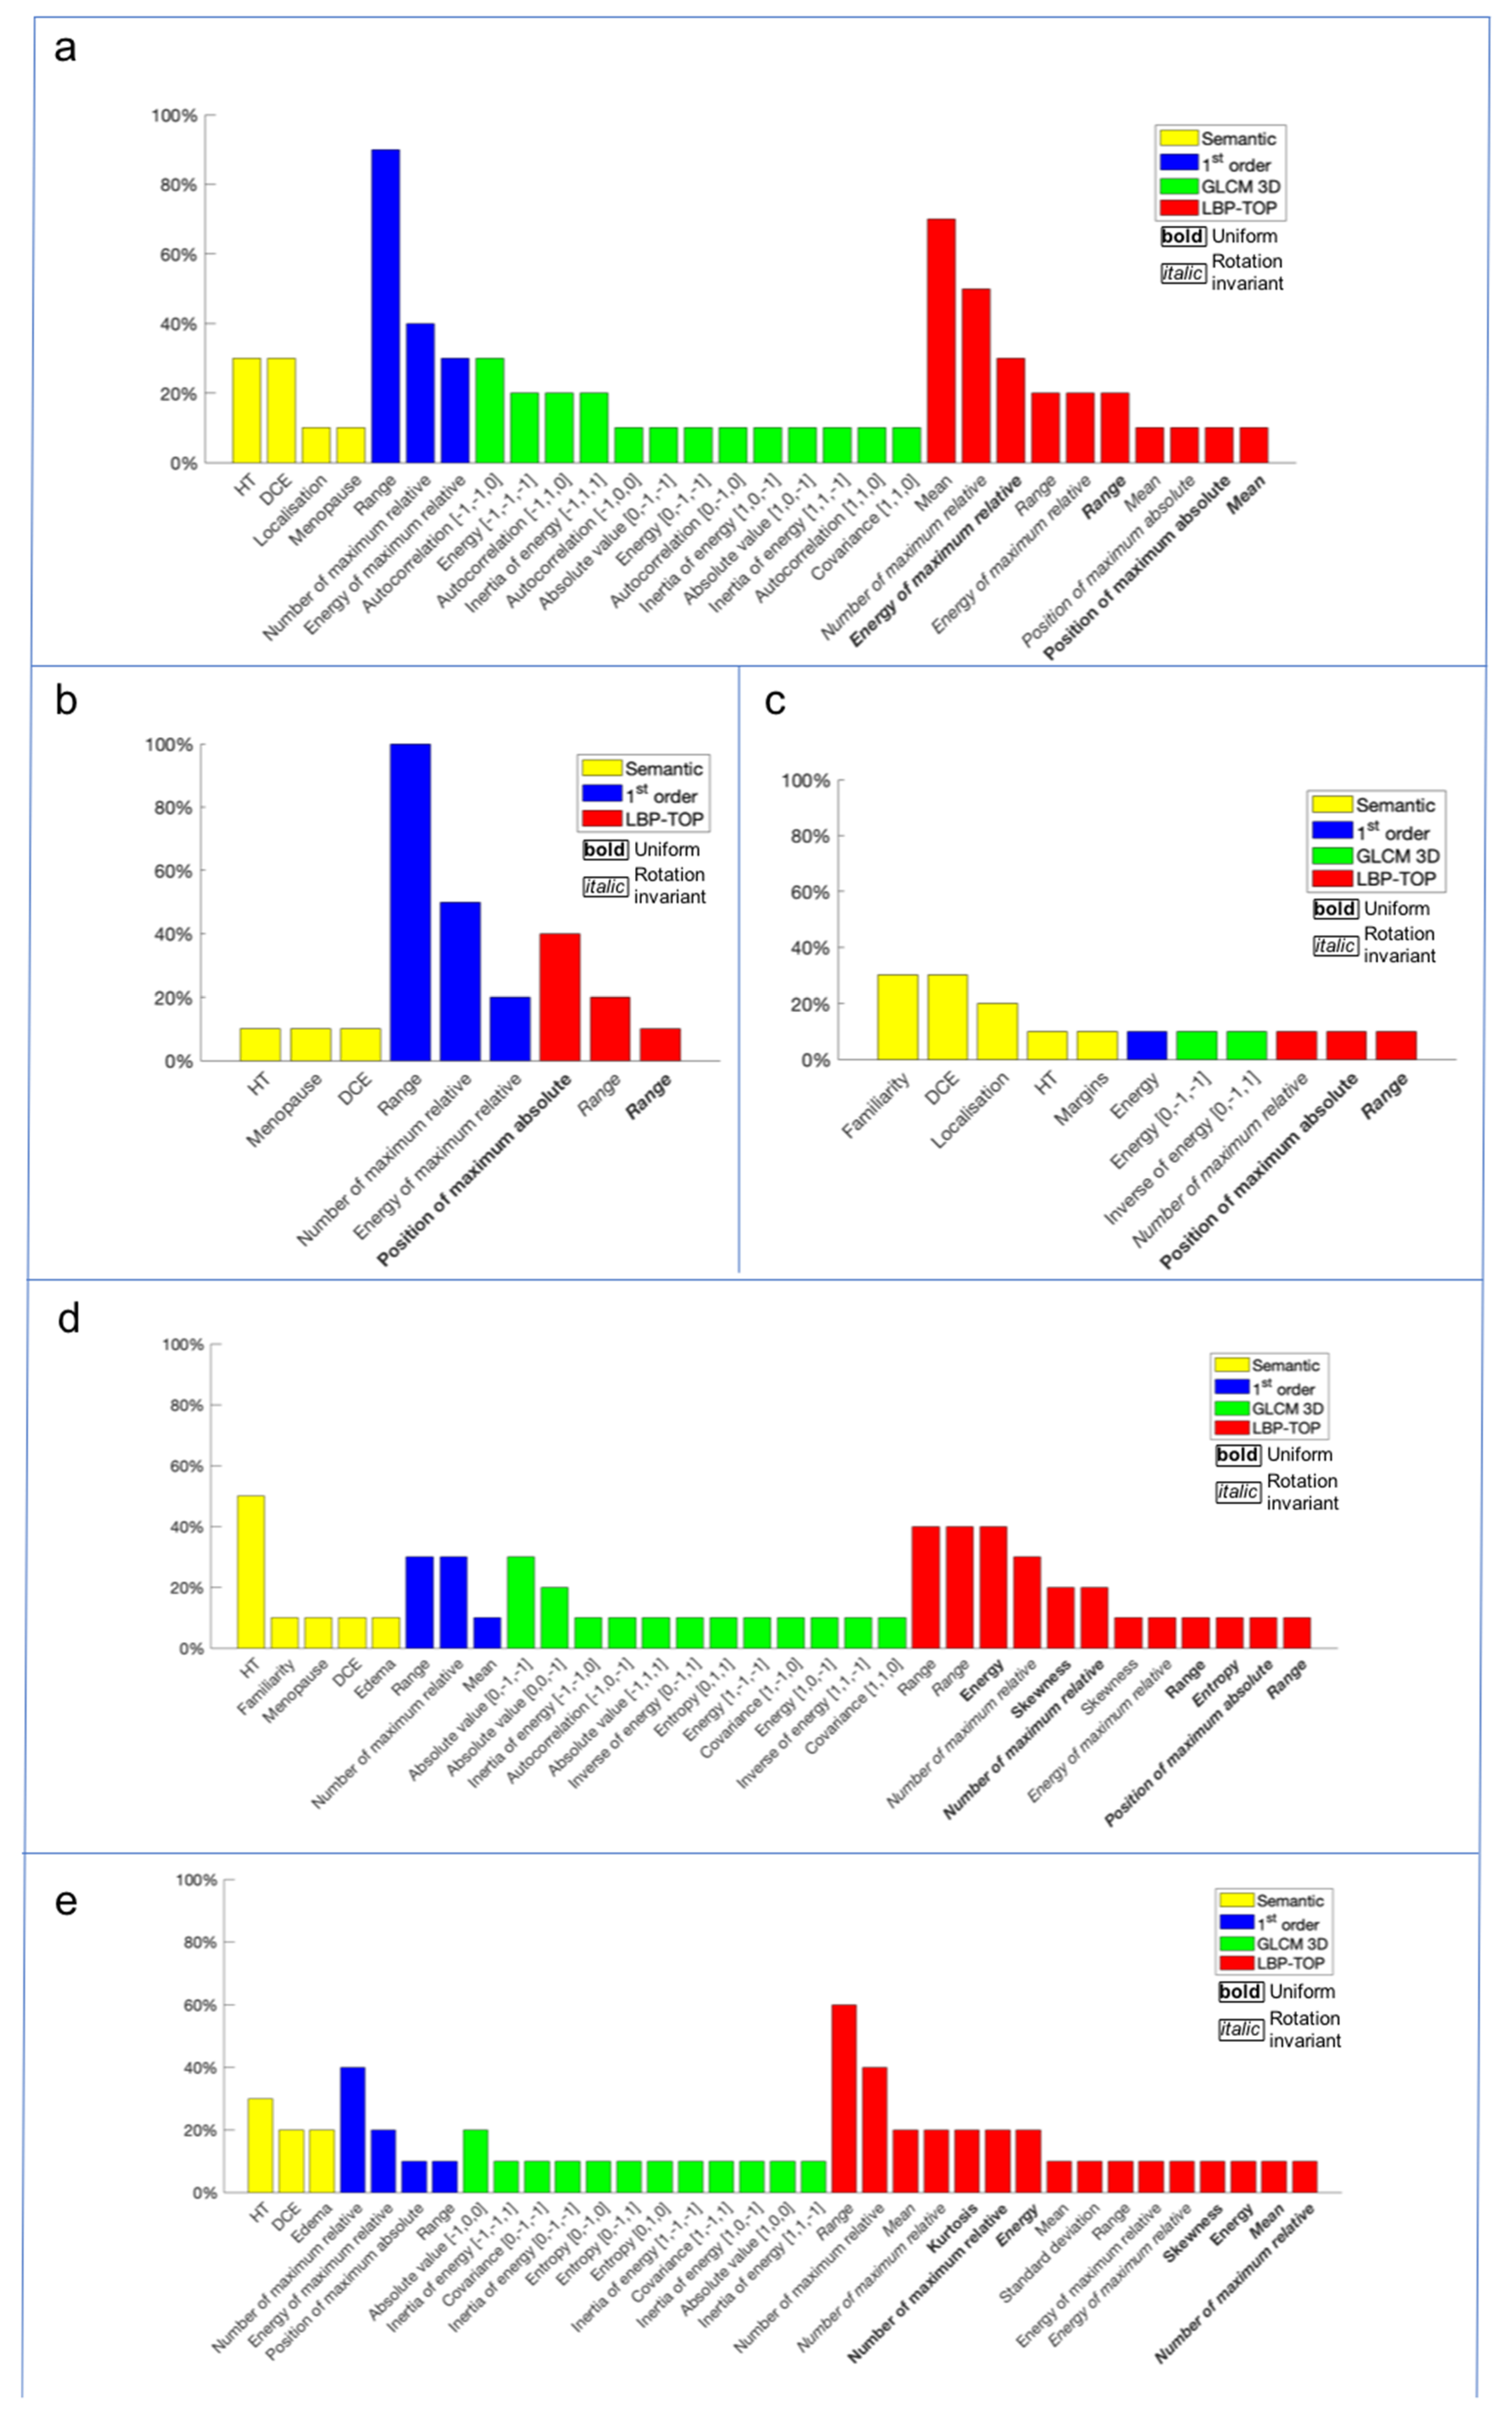
Radiomics Approach
4. Discussion
5. Conclusions
Author Contributions
Funding
Institutional Review Board Statement
Informed Consent Statement
Data Availability Statement
Conflicts of Interest
References
- Sung, H.; Ferlay, J.; Siegel, R.L.; Laversanne, M.; Soerjomataram, I.; Jemal, A.; Bray, F. Global cancer statistics 2020: GLOBOCAN estimates of incidence and mortality worldwide for 36 cancers in 185 countries. CA Cancer J. Clin. 2021, 71, 209–249. [Google Scholar] [CrossRef]
- Polyak, K. Heterogeneity in breast cancer. J. Clin. Investig. 2011, 121, 3786–3788. [Google Scholar] [CrossRef] [Green Version]
- Malhotra, G.K.; Zhao, X.; Band, H.; Band, V. Histological, molecular and functional subtypes of breast cancers. Cancer Biol. Ther. 2010, 10, 955–960. [Google Scholar] [CrossRef] [Green Version]
- Donegan, W.L. Tumor-related prognostic factors for breast cancer. CA Cancer J. Clin. 1997, 47, 28–51. [Google Scholar] [CrossRef]
- Li, C.I.; Uribe, D.J.; Daling, J.R. Clinical characteristics of different histologic types of breast cancer. Br. J. Cancer 2005, 93, 1046–1052. [Google Scholar] [CrossRef]
- Tirada, N.; Aujero, M.; Khorjekar, G.; Richards, S.; Chopra, J.; Dromi, S.; Ioffe, O. Breast Cancer Tissue Markers, Genomic Profiling, and Other Prognostic Factors: A Primer for Radiologists. Radiographics 2018, 38, 1902–1920. [Google Scholar] [CrossRef] [Green Version]
- Phung, M.T.; Tin, S.; Elwood, J.M. Prognostic models for breast cancer: A systematic review. BMC Cancer 2019, 19, 1–18. [Google Scholar] [CrossRef] [Green Version]
- AIOM—Assciazione Italiana Oncologia Medica. Linee Guida Neoplasia Della Mammella. 2021. Available online: https://www.aiom.it/ (accessed on 13 August 2021).
- Oeffinger, K.C.; Fontham, E.T.H.; Etzioni, R.; Herzig, A.; Michaelson, J.S.; Shih, Y.C.T.; Walter, L.C.; Church, T.R.; Flowers, C.R.; LaMonte, S.J.; et al. Breast Cancer Screening for Women at Average Risk: 2015 Guideline Update From the American Cancer Society. JAMA 2015, 314, 1599–1614. [Google Scholar] [CrossRef] [PubMed]
- Uematsu, T. Focal breast edema associated with malignancy on T2-weighted images of breast MRI: Peritumoral edema, prepectoral edema, and subcutaneous edema. Breast Cancer 2015, 22, 66–70. [Google Scholar] [CrossRef] [PubMed]
- Kaiser, C.G.; Herold, M.; Krammer, J.; Baltzer, P.; Gajda, M.; Camara, O.; Schoenberg, S.; Kaiser, W.A.; Dietzel, M. Prognostic value of “prepectoral edema” in MR-mammography. Anticancer Res. 2017, 37, 1989–1995. [Google Scholar] [CrossRef] [PubMed] [Green Version]
- Cheon, H.; Kim, H.J.; Kim, T.H.; Ryeom, H.K.; Lee, J.; Kim, G.C.; Yuk, J.-S.; Kim, W.H. Invasive breast cancer: Prognostic value of peritumoral edema identified at preoperative MR imaging. Radiology 2018, 287, 68–75. [Google Scholar] [CrossRef] [Green Version]
- Harada, T.L.; Uematsu, T.; Kazuaki, N.; Takashi, S.; Seiichirou, N.; Takahashi, K.; Hayashi, T.; Tadokoro, Y.; Watanabe, J.; Nakamoto, S.; et al. Is the presence of edema and necrosis on T2WI pretreatment breast MRI the key to predict pCR of triple negative breast cancer? Eur. Radiol. 2020, 30, 3363–3370. [Google Scholar] [CrossRef] [PubMed]
- Gemici, A.A.; Özal, S.T.; Hocaoğlu, E.; Arslan, G.; Sen, E.; Altınay, S.; İnci, E. Relation of peritumoral, prepectoral and diffuse edema with histopathologic findings of breast cancer in preoperative 3T magnetic resonance imaging. J. Surg. Med. 2019, 3, 49–53. [Google Scholar] [CrossRef] [Green Version]
- Bassett, L.W.; Dhaliwal, S.G.; Eradat, J.; Khan, O.; Farria, D.F.; Brenner, R.J.; Sayre, J.W. National trends and practices in breast MRI. Am. J. Roentgenol. 2008, 191, 332–339. [Google Scholar] [CrossRef]
- Cipolla, V.; Santucci, D.; Guerrieri, D.; Drudi, F.M.; Meggiorini, M.L.; de Felice, C. Correlation between 3T apparent diffusion coefficient values and grading of invasive breast carcinoma. Eur. J. Radiol. 2014, 83, 2144–2150. [Google Scholar] [CrossRef]
- Gillies, R.J.; Kinahan, P.E.; Hricak, H. Radiomics: Images Are More than Pictures, They Are Data. Radiology 2016, 278, 563–577. [Google Scholar] [CrossRef] [PubMed] [Green Version]
- Lambin, P.; Rios-Velazquez, E.; Leijenaar, R.; Carvalho, S.; Van Stiphout, R.G.; Granton, P.; Zegers, C.M.L.; Gillies, R.; Boellard, R.; Dekker, A.; et al. Radiomics: Extracting more information from medical images using advanced feature analysis. Eur. J. Cancer 2012, 48, 441–446. [Google Scholar] [CrossRef] [PubMed] [Green Version]
- Valdora, F.; Houssami, N.; Rossi, F.; Calabrese, M.; Tagliafico, A.S. Rapid review: Radiomics and breast cancer. Breast Cancer Res. Treat. 2018, 169, 217–229. [Google Scholar] [CrossRef]
- Fan, M.; Li, H.; Wang, S.; Zheng, B.; Zhang, J.; Li, L. Radiomic analysis reveals DCE-MRI features for prediction of molecular subtypes of breast cancer. PLoS ONE 2017, 12, e0171683. [Google Scholar] [CrossRef]
- Santucci, D.; Faiella, E.; Cordelli, E.; Sicilia, R.; de Felice, C.; Zobel, B.B.; Iannello, G.; Soda, P. 3T MRI-Radiomic Approach to Predict for Lymph Node Status in Breast Cancer Patients. Cancers 2021, 13, 2228. [Google Scholar] [CrossRef]
- Calabrese, A.; Santucci, D.; Landi, R.; Beomonte, Z.B.; Faiella, E.; de Felice, C. Radiomics MRI for lymph node status prediction in breast cancer patients: The state of art. J. Cancer Res. Clin. Oncol. 2021, 147, 1587–1597. [Google Scholar] [CrossRef]
- Zhu, Y.; Li, H.; Guo, W.; Drukker, K.; Lan, L.; Giger, M.L.; Ji, Y. Deciphering genomic underpinnings of quantitative MRI-based radiomic phenotypes of invasive breast carcinoma. Sci. Rep. 2015, 5, 1–10. [Google Scholar] [CrossRef] [PubMed]
- Antropova, N.; Huynh, B.Q.; Giger, M.L. A deep feature fusion methodology for breast cancer diagnosis demonstrated on three imaging modality datasets. Med. Phys. 2017, 44, 5162–5171. [Google Scholar] [CrossRef]
- Ha, S.; Park, S.; Bang, J.-I.; Kim, E.-K.; Lee, H.-Y. Metabolic Radiomics for Pretreatment (18)F-FDG PET/CT to Characterize Locally Advanced Breast Cancer: Histopathologic Characteristics, Response to Neoadjuvant Chemotherapy, and Prognosis. Sci. Rep. 2017, 7, 1–11. [Google Scholar] [CrossRef]
- Guo, Y.; Hu, Y.; Qiao, M.; Wang, Y.; Yu, J.; Li, J.; Chang, C. Radiomics Analysis on Ultrasound for Prediction of Biologic Behavior in Breast Invasive Ductal Carcinoma. Clin. Breast Cancer 2018, 18, e335–e344. [Google Scholar] [CrossRef] [PubMed]
- Li, H.; Zhu, Y.; Burnside, E.S.; Huang, E.; Drukker, K.; Hoadley, K.A.; Fan, C.; Conzen, S.D.; Zuley, M.; Net, J.M.; et al. Quantitative MRI radiomics in the prediction of molecular classifications of breast cancer subtypes in the TCGA/TCIA data set. NPJ Breast Cancer 2016, 2, 1–10. [Google Scholar] [CrossRef] [PubMed]
- Bickelhaupt, S.; Paech, D.; Kickingereder, P.; Steudle, F.; Lederer, W.; Daniel, H.; Götz, M.; Gählert, N.; Tichy, D.; Wiesenfarth, M.; et al. Prediction of malignancy by a radiomic signature from contrast agent-free diffusion MRI in suspicious breast lesions found on screening mammography. J. Magn. Reson. Imaging 2017, 46, 604–616. [Google Scholar] [CrossRef] [PubMed]
- Guo, W.; Li, H.; Zhu, Y.; Lan, L.; Yang, S.; Drukker, K.; Morris, E.A.; Burnside, E.S.; Whitman, G.J.; Giger, M.L.; et al. Prediction of clinical phenotypes in invasive breast carcinomas from the integration of radiomics and genomics data. J. Med. Imaging 2015, 2, 041007. [Google Scholar] [CrossRef] [PubMed]
- Sardanelli, F.; Boetes, C.; Borisch, B.; Decker, T.; Federico, M.; Gilbert, F.J.; Helbich, T.; Heywang-Köbrunner, S.H.; Kaiser, W.A.; Kerin, M.J.; et al. Magnetic resonance imaging of the breast: Recommendations from the EUSOMA working group. Eur. J. Cancer 2010, 46, 1296–1316. [Google Scholar] [CrossRef]
- Turnbull, L.W. Dynamic contrast-enhanced MRI in the diagnosis and management of breast cancer. NMR Biomed. 2009, 22, 28–39. [Google Scholar] [CrossRef] [PubMed]
- Uematsu, T.; Kasami, M.; Watanabe, J. Is evaluation of the presence of prepectoral edema on T2-weighted with fat-suppression 3 T breast MRI a simple and readily available noninvasive technique for estimation of prognosis in patients with breast cancer? Breast Cancer 2014, 21, 684–692. [Google Scholar] [CrossRef]
- Dietzel, M.; Baltzer, P.A.; Vag, T.; Zoubi, R.; Gröschel, T.; Burmeister, H.; Gajda, M.; Runnebaum, I.B.; Kaiser, W.A. Potenzial der Magnet-Resonanz-Mammografie zur Abschätzung des Differenzierungsgrads invasiver Mammakarzinome. RoFo Fortschr. Auf Dem Geb. Der Rontgenstrahlen Und Der Bildgeb. Verfahr. 2011, 183, 826–833. [Google Scholar] [CrossRef] [PubMed]
- Kwak, J.Y.; Kim, E.K.; Chung, S.Y.; You, J.K.; Oh, K.K.; Lee, Y.H.; Kwon, T.H.; Jung, H.K. Unilateral breast edema: Spectrum of etiologies and imaging appearances. Yonsei Med. J. 2005, 46, 1–7. [Google Scholar] [CrossRef] [PubMed]
- Baltzer, P.A.T.; Yang, F.; Dietzel, M.; Herzog, A.; Simon, A.; Vag, T.; Gajda, M.; Camara, O.; Kaiser, W.A. Sensitivity and Specificity of Unilateral Edema on T2w-TSE Sequences in MR-Mammography Considering 974 Histologically Verified Lesions. Breast J. 2010, 16, 233–239. [Google Scholar] [CrossRef]
- Malich, A.; Fischer, D.R.; Wurdinger, S.; Boettcher, J.; Marx, C.; Facius, M.; Kaiser, W.A. Potential MRI interpretation model: Differentiation of benign from malignant breast masses. Am. J. Roentgenol. 2005, 185, 964–970. [Google Scholar] [CrossRef]
- Uematsu, T.; Kasami, M.; Watanabe, J. Can T2-weighted 3-T breast MRI predict clinically occult inflammatory breast cancer before pathological examination? A single-center experience. Breast Cancer 2014, 21, 115–121. [Google Scholar] [CrossRef]
- Yuen, S.; Uematsu, T.; Kasami, M.; Tanaka, K.; Kimura, K.; Sanuki, J.; Uchida, Y.; Furukawa, H. Breast carcinomas with strong high-signal intensity on T2-weighted MR images: Pathological characteristics and differential diagnosis. J. Magn. Reson. Imaging 2007, 25, 502–510. [Google Scholar] [CrossRef] [PubMed]
- Dietzel, M.; Baltzer, P.A.; Vag, T.; Gröschel, T.; Gajda, M.; Camara, O.; Kaiser, W.A. Magnetic resonance mammography of invasive lobular versus ductal carcinoma: Systematic comparison of 811 patients reveals high diagnostic accuracy irrespective of typing. J. Comput. Assist. Tomogr. 2010, 34, 587–595. [Google Scholar] [CrossRef]
- Kawashima, H.; Kobayashi-Yoshida, M.; Matsui, O.; Zen, Y.; Suzuki, M.; Inokuchi, M. Peripheral hyperintense pattern on T2-weighted magnetic resonance imaging (MRI) in breast carcinoma: Correlation with early peripheral enhancement on dynamic MRI and histopathologic findings. J. Magn. Reson. Imaging 2010, 32, 1117–1123. [Google Scholar] [CrossRef] [PubMed]
- Estourgie, S.H.; Nieweg, O.E.; Olmos, R.A.V.; Rutgers, E.J.T.; Kroon, B.B.R. Lymphatic drainage patterns from the breast. Ann. Surg. 2004, 239, 232–237. [Google Scholar] [CrossRef]
- Blumgart, E.I.; Uren, R.F.; Nielsen, P.M.F.; Nash, M.P.; Reynolds, H.M. Predicting lymphatic drainage patterns and primary tumour location in patients with breast cancer. Breast Cancer Res. Treat. 2011, 130, 699–705. [Google Scholar] [CrossRef] [PubMed]
- Ran, S.; Volk, L.; Hall, K.; Flister, M.J. Lymphangiogenesis and lymphatic metastasis in breast cancer. Pathophysiol. Off. J. Int. Soc. Pathophysiol. 2010, 17, 229–251. [Google Scholar] [CrossRef] [PubMed] [Green Version]
- Uematsu, T. MRI findings of inflammatory breast cancer, locally advanced breast cancer, and acute mastitis: T2-weighted images can increase the specificity of inflammatory breast cancer. Breast Cancer 2012, 19, 289–294. [Google Scholar] [CrossRef] [PubMed]
- Renz, D.M.; Baltzer, P.A.T.; Böttcher, J.; Thaher, F.; Gajda, M.; Camara, O.; Runnebaum, L.B.; Kaiser, W.A. Magnetic resonance imaging of inflammatory breast carcinoma and acute mastitis. A comparative study. Eur. Radiol. 2008, 18, 2370–2380. [Google Scholar] [CrossRef]
- O’Sullivan, S.; Heinsen, H.; Grinberg, L.T.; Chimelli, L.; Amaro, E.; do Nascimento Saldiva, P.H.; Jeanquartier, F.; Jean-Quartier, C.; da Graca Morais Martain, M.; Sajid, M.I.; et al. The role of artificial intelligence and machine learning in harmonization of high-resolution post-mortem MRI (virtopsy) with respect to brain microstructure. Brain Inform. 2019, 6, 1–12. [Google Scholar] [CrossRef] [Green Version]
- Park, E.K.; Cho, K.R.; Seo, B.K.; Woo, O.H.; Cho, S.B.; Bae, J.W. Additional value of diffusion-weighted imaging to evaluate prognostic factors of breast cancer: Correlation with the apparent diffusion coefficient. Iran. J. Radiol. 2016, 13, 1–8. [Google Scholar] [CrossRef] [PubMed] [Green Version]
- Houssami, N.; Lee, C.I.; Buist, D.S.M.; Tao, D. Artificial intelligence for breast cancer screening: Opportunity or hype? Breast 2017, 36, 31–33. [Google Scholar] [CrossRef] [PubMed]

| Features n | Parameters | Description | |
|---|---|---|---|
| Semantic features | 11 | - | Clinical (age, HT, family history, menopausal state) and imaging (location, stadiation, margins, dimensions, morphology, kinetic curves, edema type) |
| First-order | 12 | # bins = 216 | All these features base on the count of the voxels in a ROI and therefore on the associated histogram computed on such count |
| Second-order TOP-LBP | 48 | Radius = 1 # neighbors = 8 | These features attempt to extract the shape’s pattern of tumour inside a ROI analysing the neighborhood of each voxel |
| Second-order GLCM | 182 | Interpixel distance = 1 | These are the multi-dimensional generalization of the histogram and aim to determine the tissue’s orientation inside a ROI |
| Edema Type | Total | |||||||
|---|---|---|---|---|---|---|---|---|
| Peritumoral | Pre-Pectoral | Subcutaneous | Diffuse | p-Value | ||||
| Family History | None | n | 37 | 17 | 14 | 18 | 86 | 0.0250 |
| % | 29.1% | 13.4% | 11.0% | 14.2% | 67.7% | |||
| 1 | n | 18 | 8 | 2 | 4 | 32 | ||
| % | 14.2% | 6.3% | 1.6% | 3.1% | 25.2% | |||
| >1 | n | 7 | 1 | 0 | 1 | 9 | ||
| % | 5.5% | 0.8% | 0.0% | 0.8% | 7.1% | |||
| Hormone Therapy | None | n | 58 | 26 | 15 | 19 | 118 | 0.267 |
| % | 45.7% | 20.5% | 11.8% | 15.0% | 92.9% | |||
| Positive | n | 4 | 0 | 1 | 4 | 9 | ||
| % | 3.1% | 0.0% | 0.8% | 3.1% | 7.1% | |||
| Menopause | Pre-m | n | 24 | 14 | 5 | 6 | 49 | 0.444 |
| % | 18.9% | 11.0% | 3.9% | 4.7% | 38.6% | |||
| Post- | n | 38 | 12 | 11 | 17 | 78 | ||
| % | 29.9% | 9.4% | 8.7% | 13.4% | 61.4% | |||
| Kinetic Curve | I | n | 9 | 2 | 2 | 6 | 19 | 0.375 |
| % | 7.1% | 1.6% | 1.6% | 4.7% | 15.0% | |||
| II | n | 32 | 13 | 4 | 7 | 56 | ||
| % | 25.2% | 10.2% | 3.1% | 5.5% | 44.1% | |||
| III | n | 21 | 11 | 10 | 10 | 52 | ||
| % | 16.5% | 8.7% | 7.9% | 7.9% | 40.9% | |||
| Margins | Regular | n | 3 | 0 | 1 | 0 | 4 | 0.746 |
| % | 2.4% | 0.0% | 0.8% | 0.0% | 3.1% | |||
| Irregular | n | 28 | 14 | 11 | 12 | 65 | ||
| % | 22.0% | 11.0% | 8.7% | 9.4% | 51.2% | |||
| Lobulated | n | 7 | 5 | 0 | 2 | 14 | ||
| % | 5.5% | 3.9% | 0.0% | 1.6% | 11.0% | |||
| Spiculated | n | 21 | 6 | 4 | 5 | 36 | ||
| % | 16.5% | 4.7% | 3.1% | 3.9% | 28.3% | |||
| Non-mass | n | 3 | 1 | 0 | 4 | 8 | ||
| % | 2.4% | 0.8% | 0.0% | 3.1% | 6.3% | |||
| Histology | IDC | n | 54 | 23 | 16 | 17 | 110 | 0.513 |
| % | 42.5% | 18.1% | 12.6% | 13.4% | 86.6% | |||
| ILC | n | 8 | 3 | 0 | 6 | 17 | ||
| % | 6.3% | 2.4% | 0.0% | 4.7% | 13.4% | |||
| Grade | 1 | n | 11 | 1 | 0 | 2 | 14 | <0.001 * |
| % | 8.7% | 0.8% | 0.0% | 1.6% | 11.0% | |||
| 2 | n | 33 | 8 | 6 | 6 | 53 | ||
| % | 26.0% | 6.3% | 4.7% | 4.7% | 41.7% | |||
| 3 | n | 18 | 17 | 10 | 15 | 60 | ||
| % | 14.2% | 13.4% | 7.9% | 11.8% | 47.2% | |||
| LNS | Negative | n | 53 | 23 | 14 | 14 | 104 | 0.064 |
| % | 41.7% | 18.1% | 11.0% | 11.0% | 81.9% | |||
| Positive | n | 9 | 3 | 2 | 9 | 23 | ||
| % | 7.1% | 2.4% | 1.6% | 7.1% | 18.1% | |||
| ER Status | Negative | n | 7 | 8 | 5 | 6 | 26 | 0.029 * |
| % | 5.5% | 6.3% | 3.9% | 4.7% | 20.5% | |||
| Positive | n | 55 | 18 | 11 | 17 | 101 | ||
| % | 43.3% | 14.2% | 8.7% | 13.4% | 79.5% | |||
| PR Status | Positive | n | 16 | 11 | 8 | 11 | 46 | 0.018 * |
| % | 12.6% | 8.7% | 6.3% | 8.7% | 36.2% | |||
| Negative | n | 46 | 15 | 8 | 12 | 81 | ||
| % | 36.2% | 11.8% | 6.3% | 9.4% | 63.8% | |||
| HER2 Status | Negative | n | 58 | 24 | 14 | 15 | 0.003 * | |
| % | 45.7% | 18.9% | 11.0% | 11.8% | ||||
| Positive | n | 4 | 2 | 2 | 8 | |||
| % | 3.1% | 1.6% | 1.6% | 6.3% | ||||
| Ki-67 | <20% | n | 30 | 6 | 1 | 6 | 43 | 0.004 * |
| % | 23.6% | 4.7% | 0.8% | 4.7% | 33.9% | |||
| >20% | n | 32 | 20 | 15 | 17 | 84 | ||
| % | 25.2% | 15.7% | 11.8% | 13.4% | 66.1% | |||
| Without Edema | With Edema | Difference | |
|---|---|---|---|
| Histology | AUC: 0.520 | AUC: 0.645 | AUC: +0.125 * |
| Accuracy: 85.8% | Accuracy: 64.17% | Accuracy: −21% | |
| Sensibility: 100% | Sensibility: 64.7% | Sensibility: −35.3% | |
| Specificity: 5.6% | Specificity: 61.1% | Specificity: +55.5% * | |
| PPV: 85.7% | PPV: 90.4% | PPV: +4.7% * | |
| NPV: 100% | NPV: 23.4% | NPV: −76.6% | |
| Grading | AUC: 0.590 | AUC: 0.789 | AUC: +0.199 * |
| Accuracy: 90% | Accuracy: 90.8% | Accuracy: +0.8% * | |
| Sensibility: 0% | Sensibility: 36.4% | Sensibility: +36.4% * | |
| Specificity: 100% | Specificity: 96.3% | Specificity: −3.7% | |
| PPV: 0% | PPV: 50% | PPV: +50% * | |
| NPV: 90.8% | NPV: 93.8% | NPV: +3% * | |
| ER | AUC: 0.466 | AUC: 0.487 | AUC: +0.021 * |
| Accuracy: 72.5% | Accuracy: 81.7% | Accuracy: +9.2% * | |
| Sensibility: 0% | Sensibility: 23.1% | Sensibility: +23.1% * | |
| Specificity: 92.6% | Specificity: 97.9% | Specificity: +5.3% * | |
| PPV: 0% | PPV: 75% | PPV: +75% * | |
| NPV: 77% | NPV: 82.1% | NPV: +5.1% * | |
| PR | AUC: 0.546 | AUC: 0.659 | AUC: +0.113 * |
| Accuracy: 55% | Accuracy: 61.7% | Accuracy: +6.7% * | |
| Sensibility: 35.4% | Sensibility: 54.2% | Sensibility: +18.8% * | |
| Specificity: 68.1% | Specificity: 66.7% | Specificity: −1.4% | |
| PPV: 42.5% | PPV: 52% | PPV: +9.5% * | |
| NPV: 61.3% | NPV: 68.6% | NPV: +7.3% * | |
| Ki-67 | AUC: 0.573 | AUC: 0.621 | AUC: +0.048 * |
| Accuracy: 59.2% | Accuracy: 64.2% | Accuracy: +5% * | |
| Sensibility: 17.1% | Sensibility: 34.1% | Sensibility: +17% * | |
| Specificity: 81% | Specificity: 79.7% | Specificity: −1.3% | |
| PPV: 31.8% | PPV: 46.7% | PPV: +14.9% * | |
| NPV: 65.3% | NPV: 70% | NPV: +4.7% * |
Publisher’s Note: MDPI stays neutral with regard to jurisdictional claims in published maps and institutional affiliations. |
© 2021 by the authors. Licensee MDPI, Basel, Switzerland. This article is an open access article distributed under the terms and conditions of the Creative Commons Attribution (CC BY) license (https://creativecommons.org/licenses/by/4.0/).
Share and Cite
Santucci, D.; Faiella, E.; Cordelli, E.; Calabrese, A.; Landi, R.; de Felice, C.; Beomonte Zobel, B.; Grasso, R.F.; Iannello, G.; Soda, P. The Impact of Tumor Edema on T2-Weighted 3T-MRI Invasive Breast Cancer Histological Characterization: A Pilot Radiomics Study. Cancers 2021, 13, 4635. https://doi.org/10.3390/cancers13184635
Santucci D, Faiella E, Cordelli E, Calabrese A, Landi R, de Felice C, Beomonte Zobel B, Grasso RF, Iannello G, Soda P. The Impact of Tumor Edema on T2-Weighted 3T-MRI Invasive Breast Cancer Histological Characterization: A Pilot Radiomics Study. Cancers. 2021; 13(18):4635. https://doi.org/10.3390/cancers13184635
Chicago/Turabian StyleSantucci, Domiziana, Eliodoro Faiella, Ermanno Cordelli, Alessandro Calabrese, Roberta Landi, Carlo de Felice, Bruno Beomonte Zobel, Rosario Francesco Grasso, Giulio Iannello, and Paolo Soda. 2021. "The Impact of Tumor Edema on T2-Weighted 3T-MRI Invasive Breast Cancer Histological Characterization: A Pilot Radiomics Study" Cancers 13, no. 18: 4635. https://doi.org/10.3390/cancers13184635