
In silico Approach for Validating and Unveiling New Applications for Prognostic Biomarkers of Endometrial Cancer

 , ,
, ,  ,
, 
Abstract
:Simple Summary
Abstract
1. Introduction
2. Materials and Methods
2.1. Data Source
2.2. Data Processing and Identification of Differentially Expressed Genes (DEGs) and Proteins (DEPs)
2.3. Survival Analysis
2.4. Statistical Analysis
2.5. Functional Analysis of DEG/Ps, Interactions, and Tractability Information
3. Results
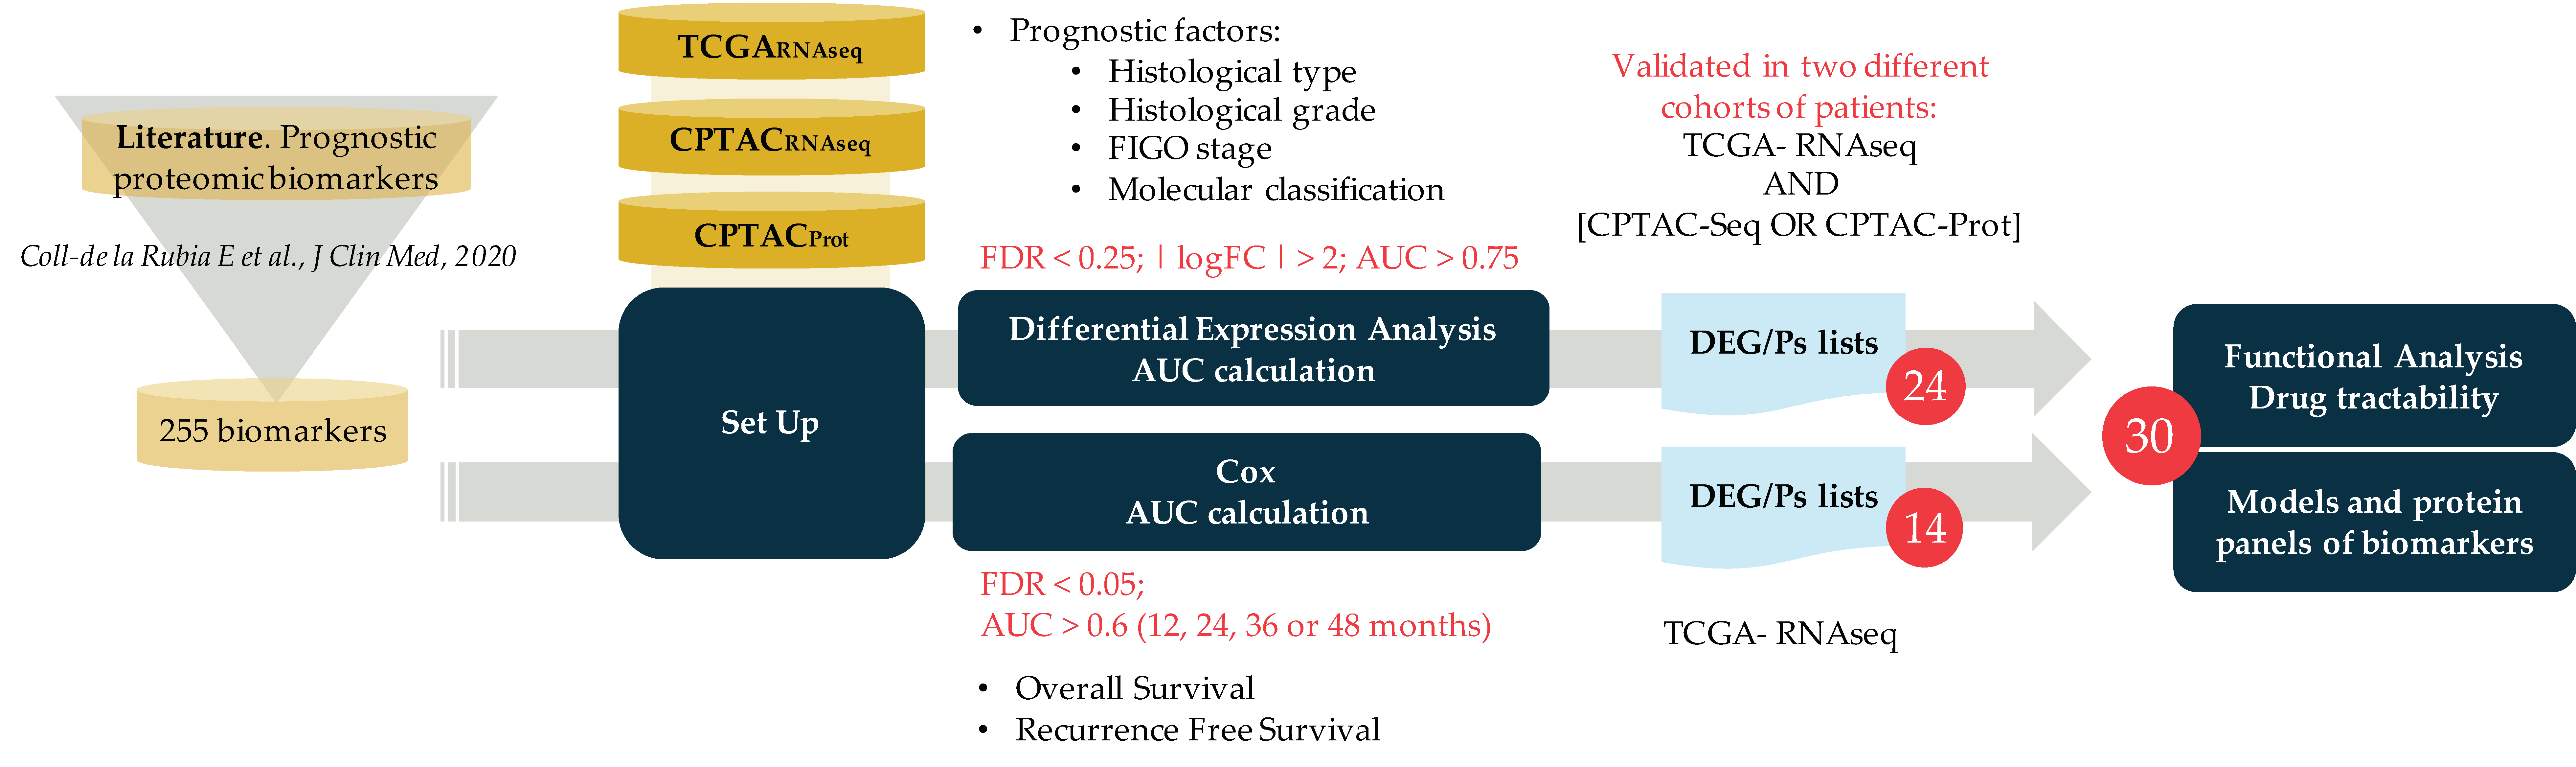
3.1. Study Workflow
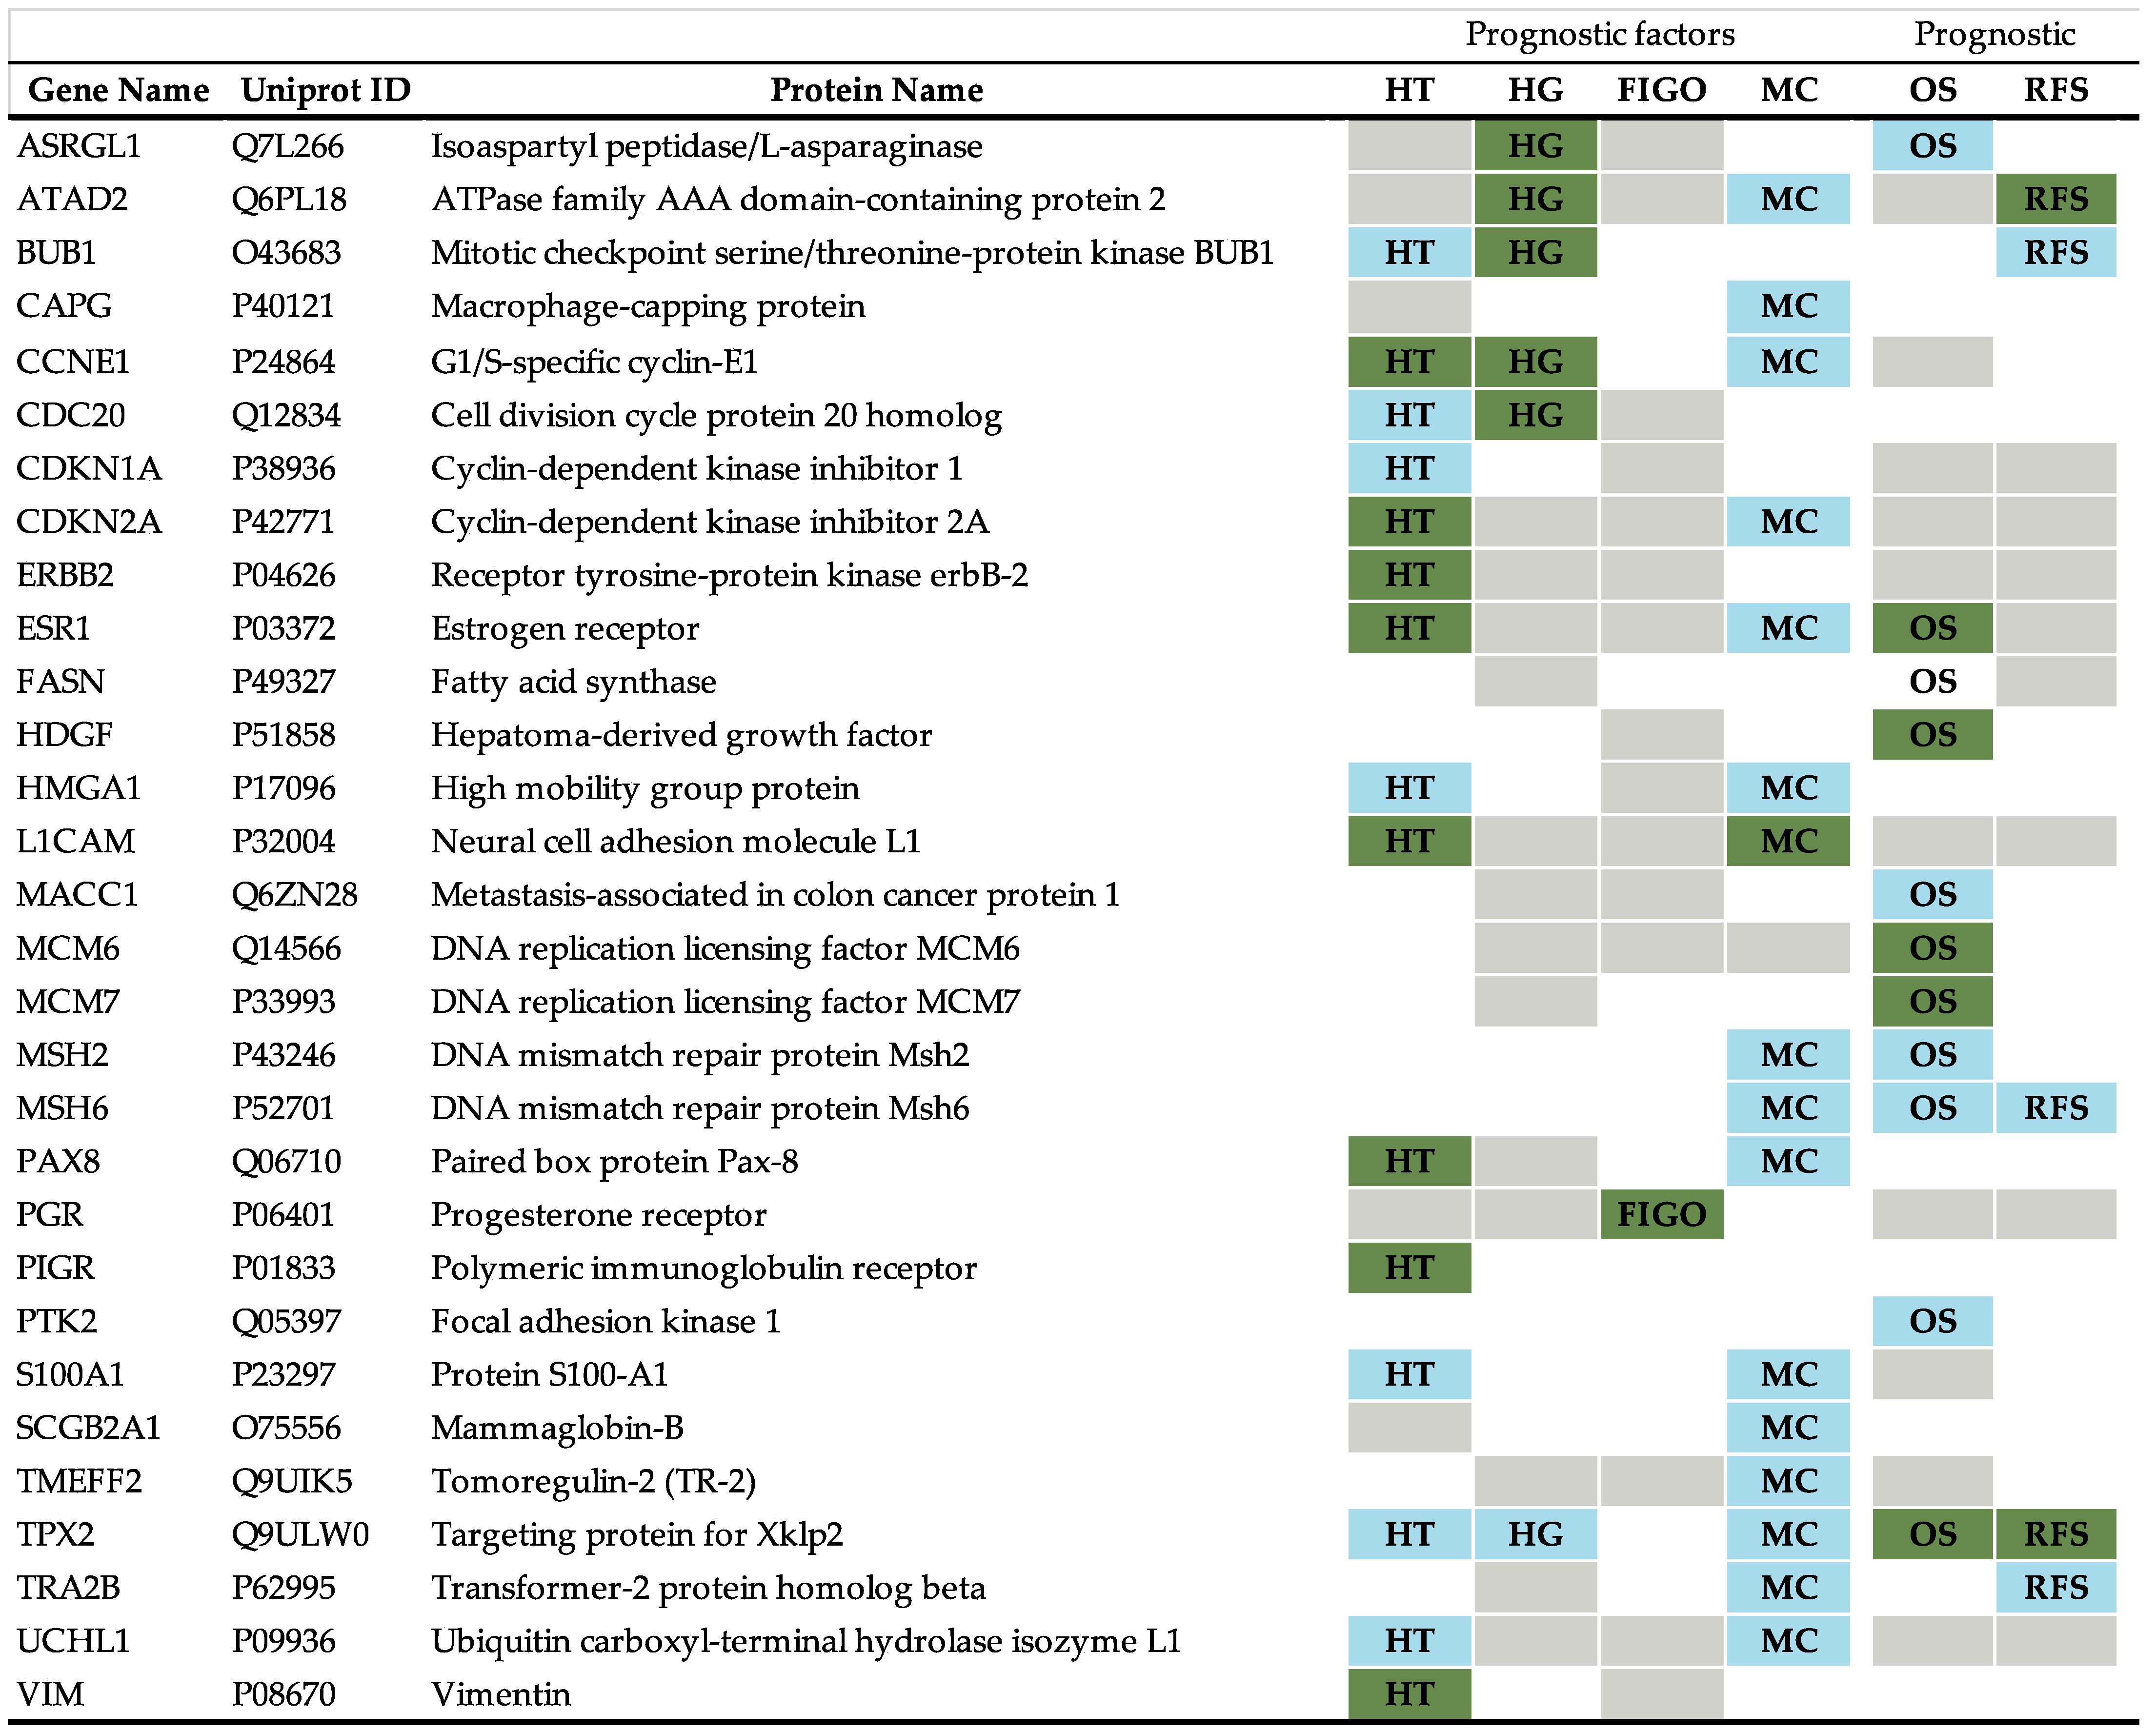
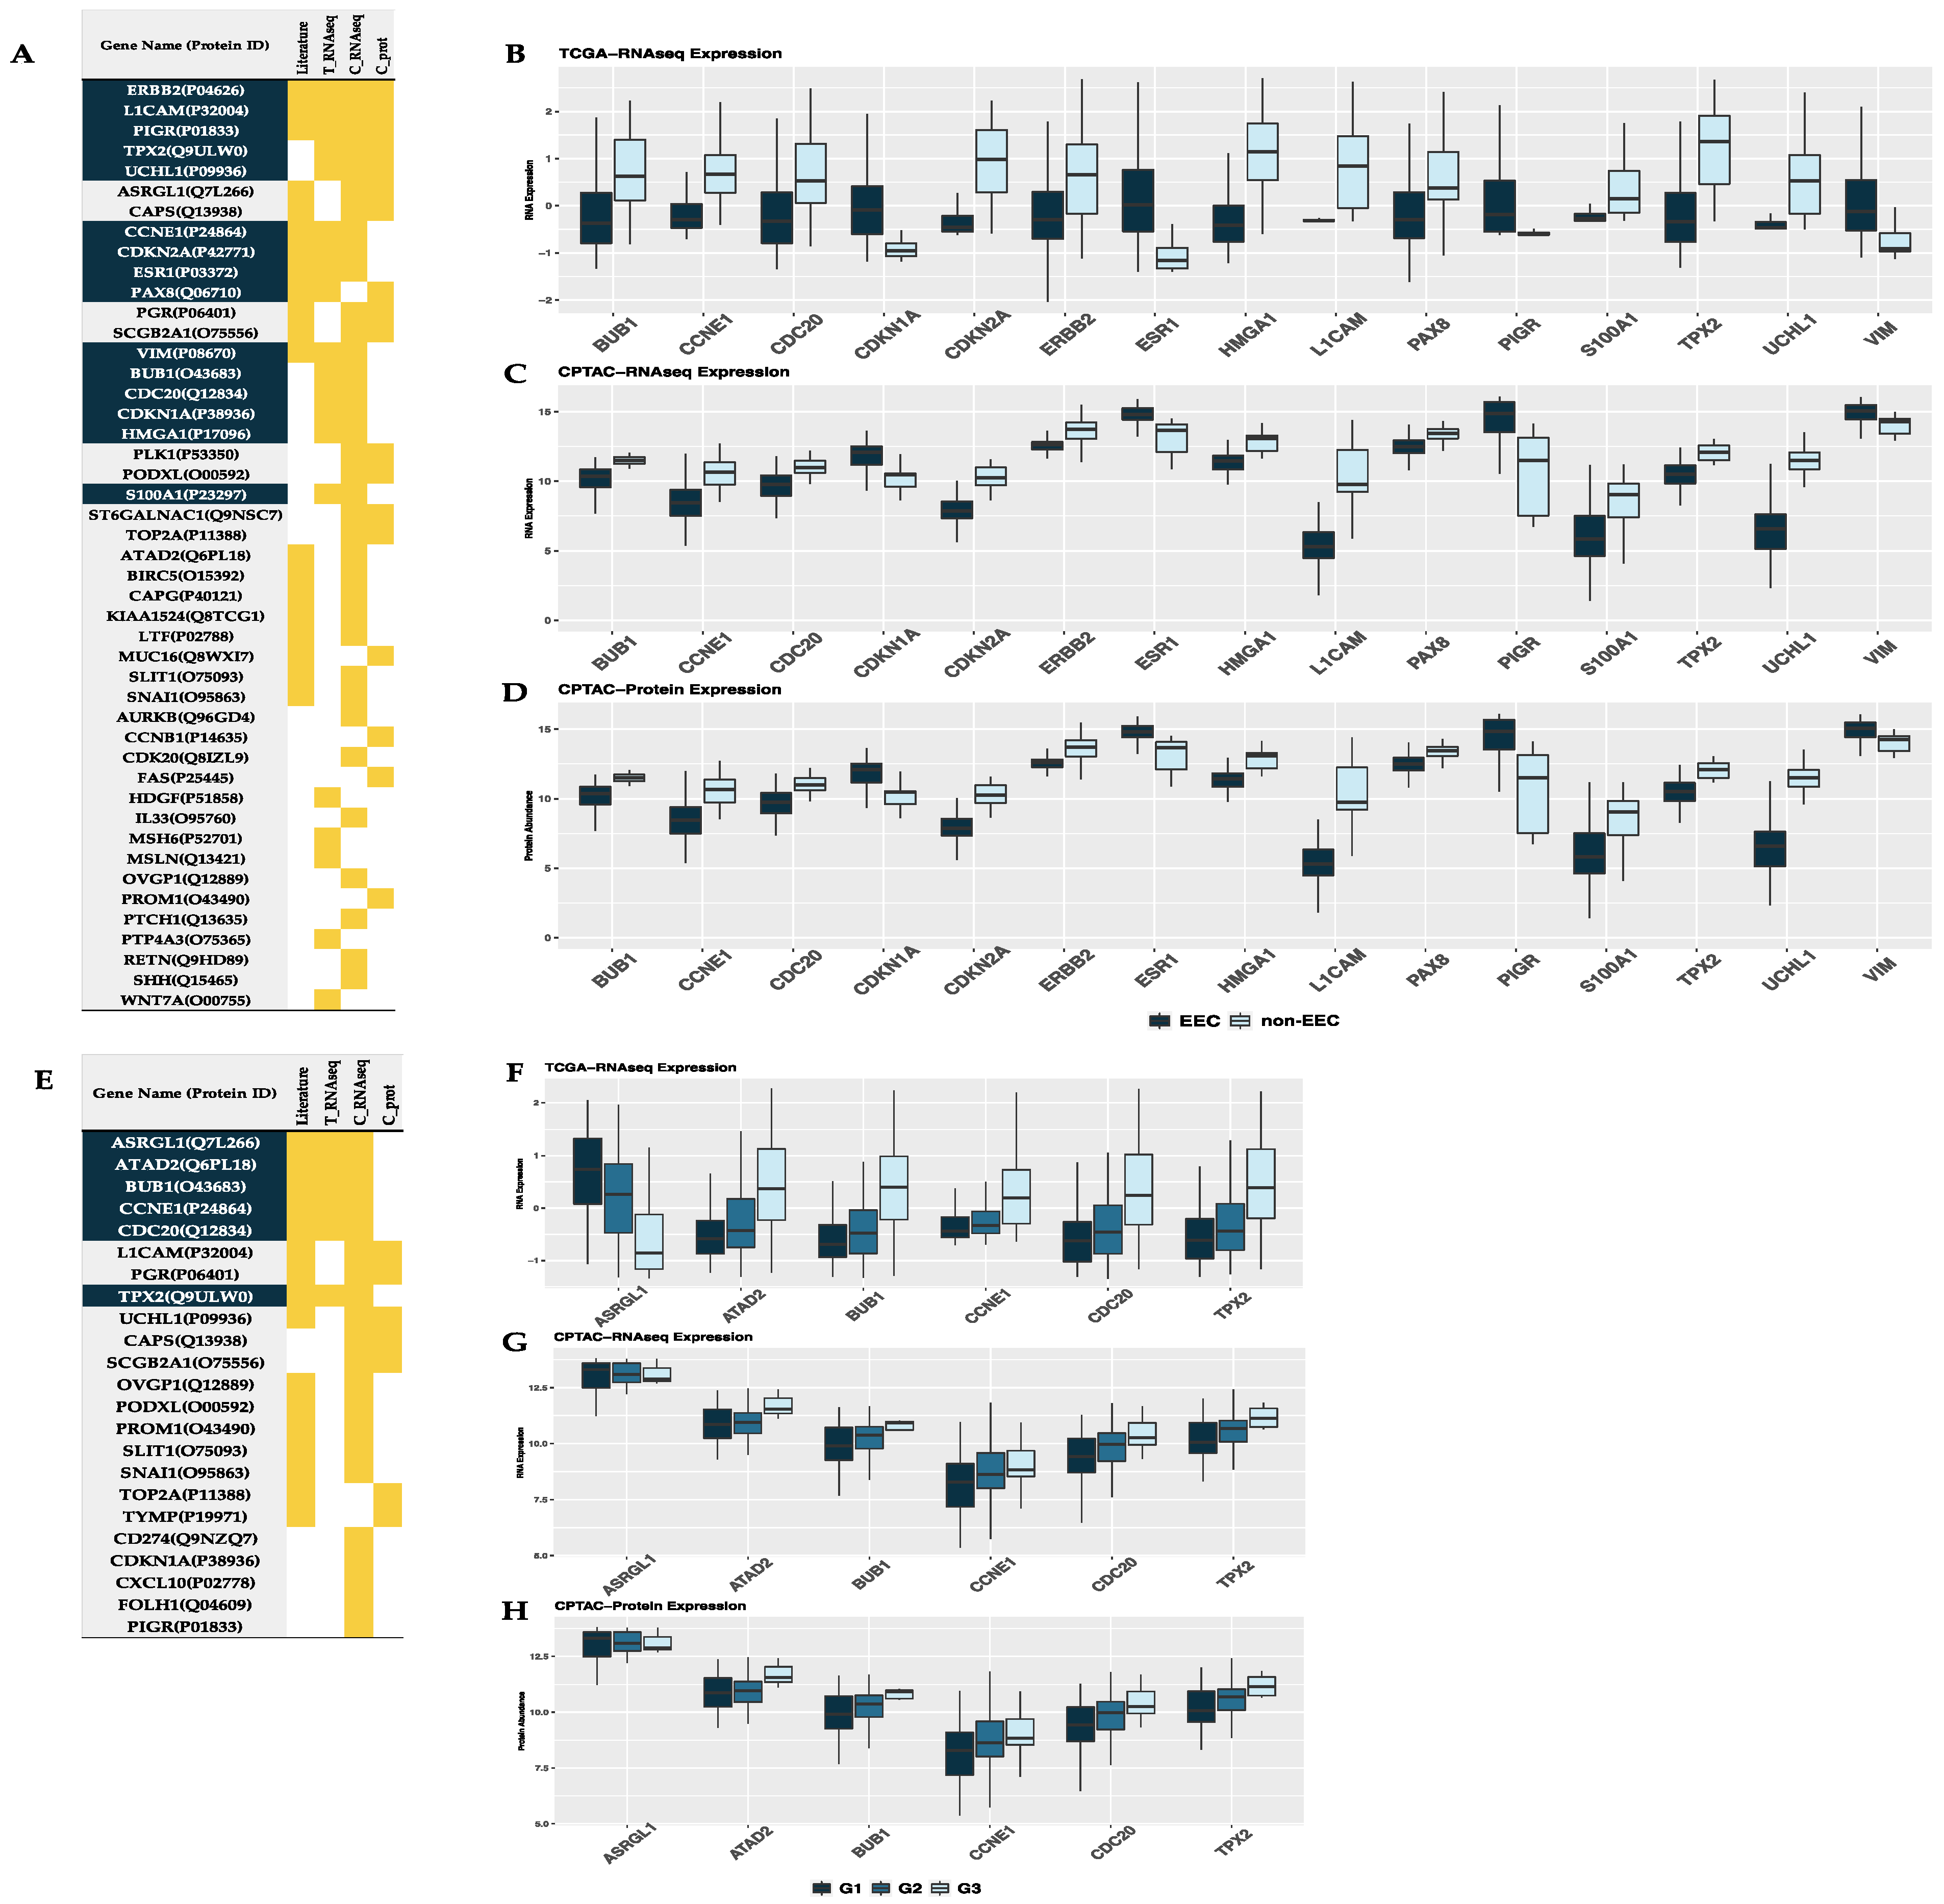
3.2. Validated Prognostic Biomarkers in EC
3.3. Validated Biomarkers Associated to OS and RFS in EC
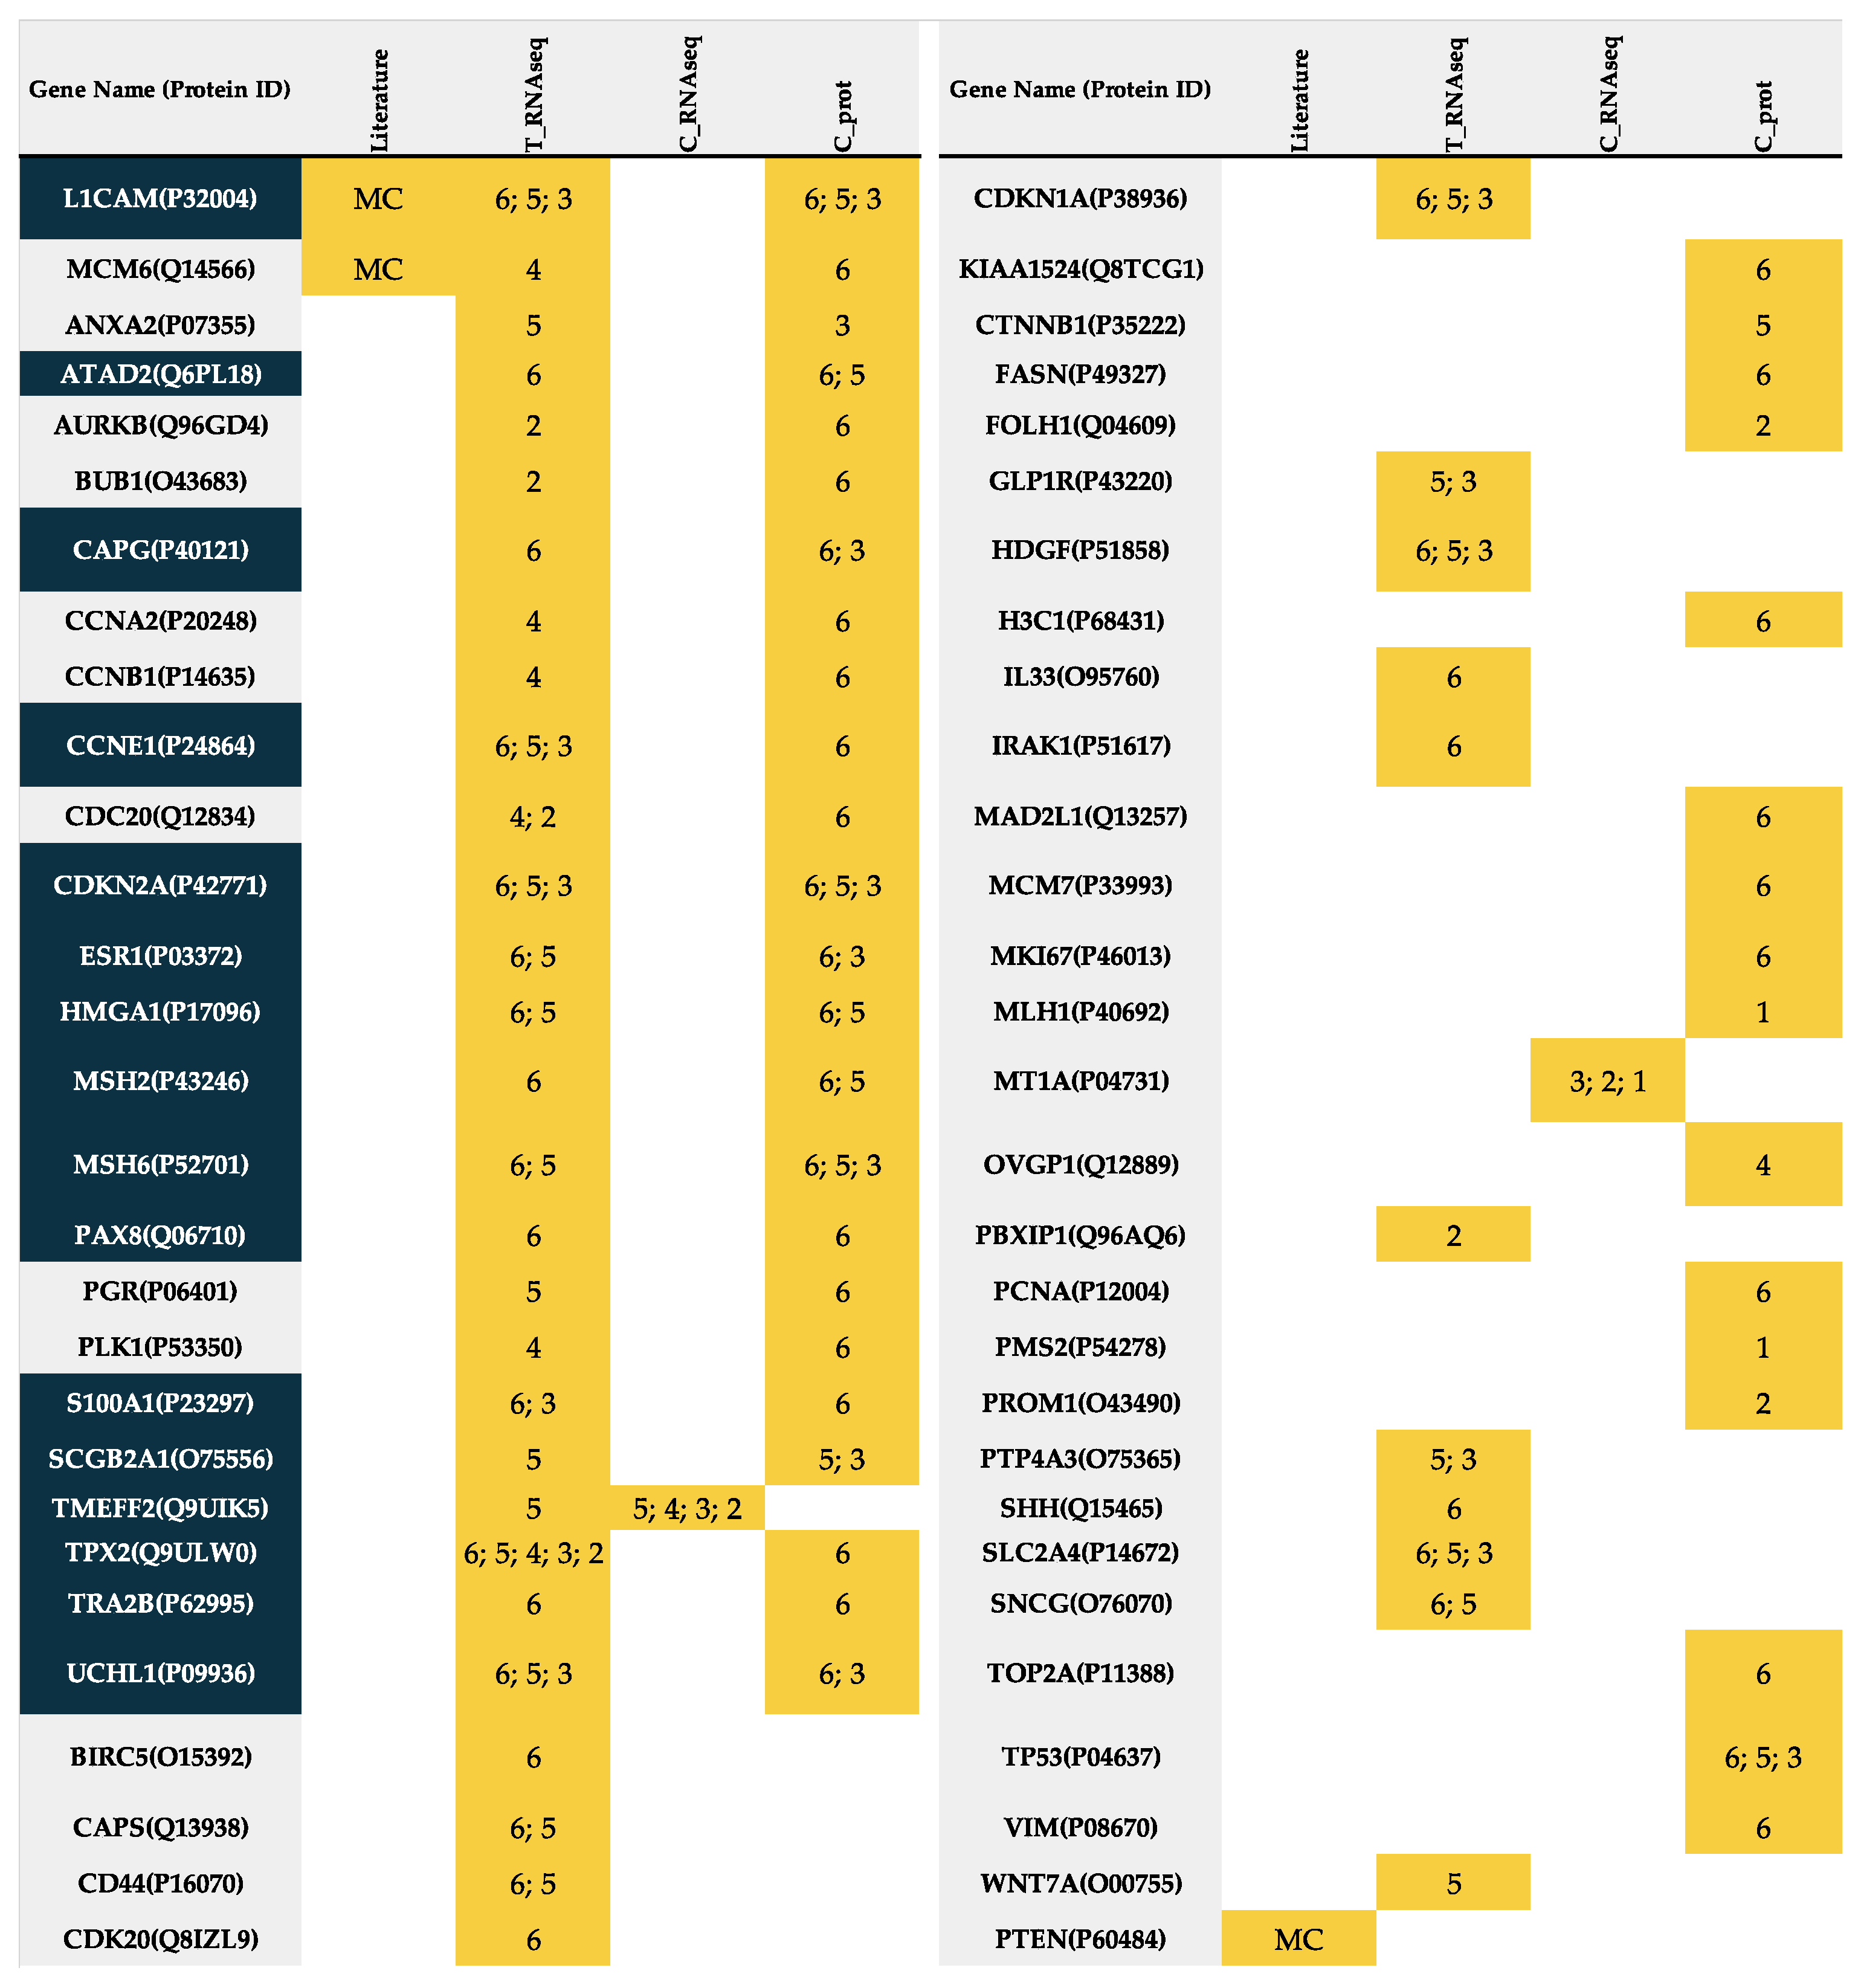
3.4. Biological Significance of the Validated Biomarkers
4. Discussion
5. Conclusions
Supplementary Materials
Author Contributions
Funding
Institutional Review Board Statement
Informed Consent Statement
Data Availability Statement
Conflicts of Interest
References
- Siegel, R.L.; Miller, K.D.; Fuchs, H.E.; Jemal, A. Cancer Statistics, 2021. CA Cancer J. Clin. 2021, 71, 7–33. [Google Scholar] [CrossRef]
- Ferlay, J.; Colombet, M.; Soerjomataram, I.; Mathers, C.; Parkin, D.M.; Piñeros, M.; Znaor, A.; Bray, F. Estimating the global cancer incidence and mortality in 2018: GLOBOCAN sources and methods. Int. J. Cancer 2019, 144, 1941–1953. [Google Scholar] [CrossRef] [PubMed] [Green Version]
- Colombo, N.; Creutzberg, C.; Amant, F.; Bosse, T.; González-Martín, A.; Ledermann, J.; Marth, C.; Nout, R.; Querleu, D.; Mirza, M.R.; et al. ESMO-ESGO-ESTRO Consensus Conference on Endometrial Cancer: Diagnosis, treatment and follow-up. Ann. Oncol. 2016, 27, 16–41. [Google Scholar] [CrossRef] [PubMed]
- Concin, N.; Matias-Guiu, X.; Vergote, I.; Cibula, D.; Mirza, M.R.; Marnitz, S.; Ledermann, J.; Bosse, T.; Chargari, C.; Fagotti, A.; et al. ESGO/ESTRO/ESP guidelines for the management of patients with endometrial carcinoma. Int. J. Gynecol. Cancer 2021, 31, 12–39. [Google Scholar] [CrossRef]
- Getz, G.; Gabriel, S.B.; Cibulskis, K.; Lander, E.; Sivachenko, A.; Sougnez, C.; Lawrence, M.; Kandoth, C.; Dooling, D.; Fulton, R.; et al. Integrated genomic characterization of endometrial carcinoma. Nature 2013, 497, 67–73. [Google Scholar] [CrossRef] [Green Version]
- Visser, N.C.M.; Reijnen, C.; Massuger, L.F.A.G.; Nagtegaal, I.D.; Bulten, J.; Pijnenborg, J.M.A. Accuracy of endometrial sampling in endometrial carcinoma: A systematic review and meta-analysis. Obstet. Gynecol. 2017, 130, 803–813. [Google Scholar] [CrossRef]
- Brennan, D.J.; Hackethal, A.; Metcalf, A.M.; Coward, J.; Ferguson, K.; Oehler, M.K.; Quinn, M.A.; Janda, M.; Leung, Y.; Freemantle, M.; et al. Serum HE4 as a prognostic marker in endometrial cancer—A population based study. Gynecol. Oncol. 2014, 132, 159–165. [Google Scholar] [CrossRef] [Green Version]
- Mannelqvist, M.; Stefansson, I.; Salvesen, H.B.; Akslen, L.A. Importance of tumour cell invasion in blood and lymphatic vasculature among patients with endometrial carcinoma. Histopathology 2009, 54, 174–183. [Google Scholar] [CrossRef] [Green Version]
- Talhouk, A.; McConechy, M.K.; Leung, S.; Li-Chang, H.H.; Kwon, J.S.; Melnyk, N.; Yang, W.; Senz, J.; Boyd, N.; Karnezis, A.N.; et al. A clinically applicable molecular-based classification for endometrial cancers. Br. J. Cancer 2015, 113, 299–310. [Google Scholar] [CrossRef] [PubMed] [Green Version]
- Talhouk, A.; McConechy, M.K.; Leung, S.; Yang, W.; Lum, A.; Senz, J.; Boyd, N.; Pike, J.; Anglesio, M.; Kwon, J.S.; et al. Confirmation of ProMisE: A simple, genomics-based clinical classifier for endometrial cancer. Cancer 2017, 123, 802–813. [Google Scholar] [CrossRef] [PubMed] [Green Version]
- Vermij, L.; Smit, V.; Nout, R.; Bosse, T. Incorporation of molecular characteristics into endometrial cancer management. Histopathology 2020, 76, 52–63. [Google Scholar] [CrossRef] [PubMed]
- Kommoss, S.; McConechy, M.K.; Kommoss, F.; Leung, S.; Bunz, A.; Magrill, J.; Britton, H.; Kommoss, F.; Grevenkamp, F.; Karnezis, A.; et al. Final validation of the ProMisE molecular classifier for endometrial carcinoma in a large population-based case series. Ann. Oncol. 2018, 29, 1180–1188. [Google Scholar] [CrossRef] [PubMed]
- Murali, R.; Davidson, B.; Fadare, O.; Carlson, J.A.; Crum, C.P.; Blake Gilks, C.; Irving, J.A.; Malpica, A.; Matias-Guiu, X.; Glenn McCluggage, W.; et al. High-grade Endometrial Carcinomas: Morphologic and Immunohistochemical Features, Diagnostic Challenges and Recommendations. Int. J. Gynecol. Pathol. 2019, 38, S40–S63. [Google Scholar] [CrossRef]
- León-Castillo, A.; Gilvazquez, E.; Nout, R.; Smit, V.T.H.B.M.; McAlpine, J.N.; McConechy, M.; Kommoss, S.; Brucker, S.Y.; Carlson, J.W.; Epstein, E.; et al. Clinicopathological and molecular characterisation of ‘multiple-classifier’ endometrial carcinomas. J. Pathol. 2020, 250, 312–322. [Google Scholar] [CrossRef] [PubMed]
- Coll-de la Rubia, E.; Martinez-Garcia, E.; Dittmar, G.; Gil-Moreno, A.; Cabrera, S.; Colas, E. Prognostic Biomarkers in Endometrial Cancer: A Systematic Review and Meta-Analysis. J. Clin. Med. 2020, 9, 1900. [Google Scholar] [CrossRef]
- Dou, Y.; Kawaler, E.A.; Cui Zhou, D.; Gritsenko, M.A.; Huang, C.; Blumenberg, L.; Karpova, A.; Petyuk, V.A.; Savage, S.R.; Satpathy, S.; et al. Proteogenomic Characterization of Endometrial Carcinoma. Cell 2020, 180, 729–748.e26. [Google Scholar] [CrossRef]
- Nazarov, P.V.; Wienecke-Baldacchino, A.K.; Zinovyev, A.; Czerwińska, U.; Muller, A.; Nashan, D.; Dittmar, G.; Azuaje, F.; Kreis, S. Deconvolution of transcriptomes and miRNomes by independent component analysis provides insights into biological processes and clinical outcomes of melanoma patients. BMC Med. Genom. 2019, 12. [Google Scholar] [CrossRef] [PubMed]
- Thomas, P.D.; Campbell, M.J.; Kejariwal, A.; Mi, H.; Karlak, B.; Daverman, R.; Diemer, K.; Muruganujan, A.; Narechania, A. PANTHER: A library of protein families and subfamilies indexed by function. Genome Res. 2003, 13, 2129–2141. [Google Scholar] [CrossRef] [Green Version]
- Bateman, A. UniProt: A worldwide hub of protein knowledge. Nucleic Acids Res. 2019, 47, D506–D515. [Google Scholar] [CrossRef] [Green Version]
- Szklarczyk, D.; Morris, J.H.; Cook, H.; Kuhn, M.; Wyder, S.; Simonovic, M.; Santos, A.; Doncheva, N.T.; Roth, A.; Bork, P.; et al. The STRING database in 2017: Quality-controlled protein-protein association networks, made broadly accessible. Nucleic Acids Res. 2017, 45, D362–D368. [Google Scholar] [CrossRef]
- Ochoa, D.; Hercules, A.; Carmona, M.; Suveges, D.; Gonzalez-Uriarte, A.; Malangone, C.; Miranda, A.; Fumis, L.; Carvalho-Silva, D.; Spitzer, M.; et al. Open Targets Platform: Supporting systematic drug-target identification and prioritisation. Nucleic Acids Res. 2021, 49, D1302–D1310. [Google Scholar] [CrossRef]
- Jiang, T.; Sui, D.; You, D.; Yao, S.; Zhang, L.; Wang, Y.; Zhao, J.; Zhang, Y. MiR-29a-5p inhibits proliferation and invasion and induces apoptosis in endometrial carcinoma via targeting TPX2. Cell Cycle 2018, 17. [Google Scholar] [CrossRef] [Green Version]
- Zhang, W.; Gao, L.; Wang, C.; Wang, S.; Sun, D.; Li, X.; Liu, M.; Qi, Y.; Liu, J.; Lin, B. Combining Bioinformatics and Experiments to Identify and Verify Key Genes with Prognostic Values in Endometrial Carcinoma. J. Cancer 2020, 11, 716–732. [Google Scholar] [CrossRef] [Green Version]
- Besso, M.; Montivero, L.; Lacunza, E.; Argibay, M.; Abba, M.; Furlong, L.; Colas, E.; Gil-Moreno, A.; Reventos, J.; Bello, R.; et al. Identification of early stage recurrence endometrial cancer biomarkers using bioinformatics tools. Oncol. Rep. 2020, 44, 873–886. [Google Scholar] [CrossRef] [PubMed]
- Dongre, A.; Weinberg, R.A. New insights into the mechanisms of epithelial–mesenchymal transition and implications for cancer. Nat. Rev. Mol. Cell Biol. 2019, 20, 69–84. [Google Scholar] [CrossRef] [PubMed]
- Thigpen, J.T.; Brady, M.F.; Alvarez, R.D.; Adelson, M.D.; Homesley, H.D.; Manetta, A.; Soper, J.T.; Given, F.T. Oral Medroxyprogesterone Acetate in the Treatment of Advanced or Recurrent Endometrial Carcinoma: A Dose-Response Study by the Gynecologic Oncology Group. J. Clin. Oncol. 1999, 17, 1736. [Google Scholar] [CrossRef]
- Reifenstein, E.C. The treatment of advanced endometrial cancer with hydroxyprogesterone caproate. Gynecol. Oncol. 1974, 2, 377–414. [Google Scholar] [CrossRef]
- Whitney, C.W.; Brunetto, V.L.; Zaino, R.J.; Lentz, S.S.; Sorosky, J.; Armstrong, D.K.; Lee, R.B. Phase II study of medroxyprogesterone acetate plus tamoxifen in advanced endometrial carcinoma: A Gynecologic Oncology Group study. Gynecol. Oncol. 2004, 92, 4–9. [Google Scholar] [CrossRef] [PubMed]
- Guan, J.; Xie, L.; Luo, X.; Yang, B.; Zhang, H.; Zhu, Q.; Chen, X. The prognostic significance of estrogen and progesterone receptors in grade I and II endometrioid endometrial adenocarcinoma: Hormone receptors in risk stratification. J. Gynecol. Oncol. 2019, 30. [Google Scholar] [CrossRef]
- Smith, D.; Stewart, C.J.R.; Clarke, E.M.; Lose, F.; Davies, C.; Armes, J.; Obermair, A.; Brennan, D.; Webb, P.M.; Nagle, C.M.; et al. ER and PR expression and survival after endometrial cancer. Gynecol. Oncol. 2018, 148, 258–266. [Google Scholar] [CrossRef]
- Expression of TPX2 in Cancer-Summary-The Human Protein Atlas. Available online: https://www.proteinatlas.org/ENSG00000088325-TPX2/pathology (accessed on 11 August 2021).
- Jiang, Y.; Liu, Y.; Tan, X.; Yu, S.; Luo, J. TPX2 as a Novel Prognostic Indicator and Promising Therapeutic Target in Triple-negative Breast Cancer. Clin. Breast Cancer 2019, 19, 450–455. [Google Scholar] [CrossRef]
- Cáceres-Gorriti, K.Y.; Carmona, E.; Barrès, V.; Rahimi, K.; Létourneau, I.J.; Tonin, P.N.; Mes-Masson, A.M. RAN nucleo-cytoplasmic transport and mitotic spindle assembly partners XPO7 and TPX2 are new prognostic biomarkers in serous epithelial ovarian cancer. PLoS ONE 2014, 9. [Google Scholar] [CrossRef]
- Shen, L.; Liu, M.; Liu, W.; Cui, J.; Li, C. Bioinformatics analysis of RNA sequencing data reveals multiple key genes in uterine corpus endometrial carcinoma. Oncol. Lett. 2017, 15, 205–212. [Google Scholar] [CrossRef] [Green Version]
- Liu, Y.; Chen, P.; Li, M.; Fei, H.; Huang, J.; Zhao, T.; Li, T. Comprehensive Analysis of the Control of Cancer Stem Cell Characteristics in Endometrial Cancer by Network Analysis. Comput. Math. Methods Med. 2021, 2021, 1–11. [Google Scholar] [CrossRef]
- Liu, J.; Wu, Z.; Sun, R.; Nie, S.; Meng, H.; Zhong, Y.; Nie, X.; Cheng, W. Using mRNAsi to identify prognostic-related genes in endometrial carcinoma based on WGCNA. Life Sci. 2020, 258, 118231. [Google Scholar] [CrossRef] [PubMed]
- Kommoss, F.K.; Karnezis, A.N.; Kommoss, F.; Talhouk, A.; Taran, F.-A.; Staebler, A.; Gilks, C.B.; Huntsman, D.G.; Krämer, B.; Brucker, S.Y.; et al. L1CAM further stratifies endometrial carcinoma patients with no specific molecular risk profile. Br. J. Cancer 2018, 119, 480–486. [Google Scholar] [CrossRef] [PubMed]
- León-Castillo, A.; de Boer, S.M.; Powell, M.E.; Mileshkin, L.R.; Mackay, H.J.; Leary, A.; Nijman, H.W.; Singh, N.; Pollock, P.M.; Bessette, P.; et al. Molecular Classification of the PORTEC-3 Trial for High-Risk Endometrial Cancer: Impact on Prognosis and Benefit From Adjuvant Therapy. J. Clin. Oncol. 2020, 38, 3388–3397. [Google Scholar] [CrossRef] [PubMed]
- Martinez-Garcia, E.; Lesur, A.; Devis, L.; Cabrera, S.; Matias-Guiu, X.; Hirschfeld, M.; Asberger, J.; Van Oostrum, J.; Casares de Cal, M.D.L.A.; Gomez-Tato, A.; et al. Targeted proteomics identifies proteomic signatures in liquid biopsies of the endometrium to diagnose endometrial cancer and assist in the prediction of the optimal surgical treatment. Clin. Cancer Res. 2017, 23, 6458–6467. [Google Scholar] [CrossRef] [PubMed] [Green Version]


| Characteristics | TCGA RNA-Seq (n = 333) | CPTAC RNA-Seq + Proteome (n = 95) |
|---|---|---|
| Age 1 | ||
| Mean | 63.23 ± 10.91 | 63.19 ± 9.78 |
| Maximum | 90 | 86 |
| Minimum | 33 | 38 |
| Histological type | ||
| Endometrioid | 271 | 83 |
| Serous | 52 | 12 |
| Mixed | 10 | 0 |
| Grade | ||
| Grade 1 | 79 | 37 |
| Grade 2 | 90 | 38 |
| Grade 3 | 164 | 8 |
| FIGO stage 2 | ||
| I | 226 | 71 |
| II | 19 | 8 |
| III | 70 | 13 |
| IV | 16 | 3 |
| NA | 2 | 0 |
| Molecular Classification 3 | ||
| POLE | 31 | 7 |
| MSI | 92 | 25 |
| CN-low | 110 | 43 |
| CN-high | 78 | 20 |
| Overall Survival | ||
| 0: Living | 282 | 36 |
| 1: Deceased | 51 | 7 |
Publisher’s Note: MDPI stays neutral with regard to jurisdictional claims in published maps and institutional affiliations. |
© 2021 by the authors. Licensee MDPI, Basel, Switzerland. This article is an open access article distributed under the terms and conditions of the Creative Commons Attribution (CC BY) license (https://creativecommons.org/licenses/by/4.0/).
Share and Cite
Coll-de la Rubia, E.; Martinez-Garcia, E.; Dittmar, G.; Nazarov, P.V.; Bebia, V.; Cabrera, S.; Gil-Moreno, A.; Colás, E. In silico Approach for Validating and Unveiling New Applications for Prognostic Biomarkers of Endometrial Cancer. Cancers 2021, 13, 5052. https://doi.org/10.3390/cancers13205052
Coll-de la Rubia E, Martinez-Garcia E, Dittmar G, Nazarov PV, Bebia V, Cabrera S, Gil-Moreno A, Colás E. In silico Approach for Validating and Unveiling New Applications for Prognostic Biomarkers of Endometrial Cancer. Cancers. 2021; 13(20):5052. https://doi.org/10.3390/cancers13205052
Chicago/Turabian StyleColl-de la Rubia, Eva, Elena Martinez-Garcia, Gunnar Dittmar, Petr V. Nazarov, Vicente Bebia, Silvia Cabrera, Antonio Gil-Moreno, and Eva Colás. 2021. "In silico Approach for Validating and Unveiling New Applications for Prognostic Biomarkers of Endometrial Cancer" Cancers 13, no. 20: 5052. https://doi.org/10.3390/cancers13205052
APA StyleColl-de la Rubia, E., Martinez-Garcia, E., Dittmar, G., Nazarov, P. V., Bebia, V., Cabrera, S., Gil-Moreno, A., & Colás, E. (2021). In silico Approach for Validating and Unveiling New Applications for Prognostic Biomarkers of Endometrial Cancer. Cancers, 13(20), 5052. https://doi.org/10.3390/cancers13205052