Article

In Vivo PET Imaging of Monocytes Labeled with [89Zr]Zr-PLGA-NH2 Nanoparticles in Tumor and Staphylococcus aureus Infection Models

by
Massis Krekorian
1,2,*,
Kimberley R. G. Cortenbach
1,
Milou Boswinkel
2,
Annemarie Kip
2,
Gerben M. Franssen
2,
Andor Veltien
2,
Tom W. J. Scheenen
2,
René Raavé
2,
Nicolaas Koen van Riessen
1,3,
Mangala Srinivas
1,3,
Ingrid Jolanda M. de Vries
1,
Carl G. Figdor
1,
Erik H. J. G. Aarntzen
2 and
Sandra Heskamp
2
1
Department of Tumor Immunology, Radboud Institute for Molecular Life Sciences, Radboud University Medical Center, Geert Grooteplein 28, 6525 GA Nijmegen, The Netherlands
2
Department of Medical Imaging, Radboud University Medical Center, Geert Grooteplein Zuid 10, 6525 GA Nijmegen, The Netherlands
3
Cenya Imaging BV, Tweede Kostverlorenkade 11H, 1052 RK Amsterdam, The Netherlands
*
Author to whom correspondence should be addressed.
Cancers 2021, 13(20), 5069; https://doi.org/10.3390/cancers13205069
Submission received: 30 August 2021 / Revised: 1 October 2021 / Accepted: 4 October 2021 / Published: 10 October 2021
(This article belongs to the Special Issue Targeted Treatment for Immunochemotherapy in Cancer)

Abstract

:

Simple Summary

Immune cells are increasingly used for therapy in cancer and other diseases. To better understand immune-cell kinetics, cell-tracking with highly sensitive imaging modalities is required. The aim of this study was to develop a new strategy for the in vivo tracking of a small number of cells, using positron emission tomography (PET). We labeled poly(lactic-co-glycolic acid) nanoparticles containing a primary endcap (PLGA-NH2) with the radionuclide zirconium-89. The nanoparticles were characterized for size, polydispersity index, zetapotential and radiolabel retention. Subsequently, they were used for the ex vivo radiolabeling of a monocyte cell line (THP-1). We demonstrated that these radiolabeled monocyte cells can be traced in vivo in mouse tumor and infection models.

Abstract

The exponential growth of research on cell-based therapy is in major need of reliable and sensitive tracking of a small number of therapeutic cells to improve our understanding of the in vivo cell-targeting properties. 111In-labeled poly(lactic-co-glycolic acid) with a primary amine endcap nanoparticles ([111In]In-PLGA-NH2 NPs) were previously used for cell labeling and in vivo tracking, using SPECT/CT imaging. However, to detect a low number of cells, a higher sensitivity of PET is preferred. Therefore, we developed 89Zr-labeled NPs for ex vivo cell labeling and in vivo cell tracking, using PET/MRI. We intrinsically and efficiently labeled PLGA-NH2 NPs with [89Zr]ZrCl4. In vitro, [89Zr]Zr-PLGA-NH2 NPs retained the radionuclide over a period of 2 weeks in PBS and human serum. THP-1 (human monocyte cell line) cells could be labeled with the NPs and retained the radionuclide over a period of 2 days, with no negative effect on cell viability (specific activity 279 ± 10 kBq/106 cells). PET/MRI imaging could detect low numbers of [89Zr]Zr-THP-1 cells (10,000 and 100,000 cells) injected subcutaneously in Matrigel. Last, in vivo tracking of the [89Zr]Zr-THP-1 cells upon intravenous injection showed specific accumulation in local intramuscular Staphylococcus aureus infection and infiltration into MDA-MB-231 tumors. In conclusion, we showed that [89Zr]Zr-PLGA-NH2 NPs can be used for immune-cell labeling and subsequent in vivo tracking of a small number of cells in different disease models.

Graphical Abstract

1. Introduction

Cell-based therapy is maturing into clinical practice and holds great promise for treating cancer, as well as immune-related diseases. In vivo cell tracking is desired to better understand the complex cell targeting mechanism and cell–cell interactions. For example, such tools could guide the development of treatment strategies to increase tumor-targeting and minimize off-target accumulation and associated toxicity [1,2,3,4]. The effector immune-cell populations involved in these therapeutic interventions reach peripheral tissues in relatively small numbers, in the order of a few thousand [5,6,7,8,9]. Therefore, stable labeling of immune cells and a highly sensitive imaging system with adequate tissue penetration depth for whole-body imaging are required.
For direct cell labeling, specific cell (sub)types are isolated from patients and labeled ex vivo. For example, T cells can be labeled with highly derivatized crosslinked iron oxide nanoparticles (NPs) and detected with magnetic resonance imaging (MRI) [10]. Although magnetic particle imaging (MPI) is a highly sensitive technique (detection of ∼200 cells and a resolution of ∼1 mm), there are currently no clinically available scanners [11,12,13,14]. In contrast, positron emission tomography (PET) is commonly applied in clinical practice for diagnosis, staging and response monitoring in cancer and other diseases. PET tracking of radiolabeled cells is traditionally performed with lipophilic compounds, including oxine and hexamethylpropyleneamine oxime (HMPAO), that passively diffuse across the cell membrane [15]. In clinical settings, [111In]In-oxine and [99mTc]Tc-HMPAO are used in combination with single-photon emission computed tomography (SPECT) imaging [16,17]. Although this labeling strategy is fast and results in a good labeling efficiency, it has several drawbacks. In particular, it has been shown that cells labeled with [111In]In-oxine release the radionuclide up to 50% within 48 h [18], and the oxine carrier appears to be chemotoxic [19]. Furthermore, clinical SPECT systems have a low sensitivity and resolution, which hamper the tracking of low numbers of cells distributed over a large volume. In contrast, PET has a higher resolution, sensitivity and more accurate quantification compared to SPECT. New developments in PET technology hold promise for even higher sensitivity compared to current PET scanners [20]. Therefore, PET-based in vivo cell tracking is preferred over SPECT in the clinical setting. In this study, we introduced the radiometal zirconium-89 (89Zr) as a positron emitter, with an ideal half-life (78.41 h) for cell tracking.
More recently, [89Zr]Zr-oxine has been introduced for PET-based cell tracking [21,22], but it experiences similar limitations to those observed with [111In]In-oxine [23,24]. A multitude of 89Zr-labeled NPs for different applications have been reported previously [25,26,27]. For example, chitosan NPs have also been used for 89Zr-labeling of leukocyte cells [28]. The intrinsic labeling of the chitosan NPs was suggested to be possible via the interaction of the 89Zr with the OH and NH2 groups. High cell-labeling efficiency was achieved with up to 73% after 24 h. However, the 89Zr-release from the cells was also rapid, with up to 79% after 24 h. No specific activity per number of cells was reported, making it difficult to compare to other studies. In another study, in vivo tumor-associated macrophages were targeted and imaged by using 89Zr-desferroxiamine-NCS (DFO) conjugated dextran NPs in colon carcinoma (CT26) tumor xenograft mice [25]. Here, also some release was detected in the bones with PET images. Radiolabel release by ex vivo labeled cells is a hurdle for sensitive and specific in vivo cell tracking, as free radionuclides accumulate in off-target tissue and could lead to higher background signal and potential misinterpretation of images, while also exposing tissue to unnecessary radiation dose [29,30].
In our previous work, we have shown that poly(lactic-co-glycolic acid) NPs with amine groups (PLGA-NH2 NPs) can be used to radiolabel cells and demonstrates improved radiolabel retention compared with the oxine labeling method [31]. Here, we report the intrinsic labeling capacity of these NPs with [89Zr]ZrCl4 under various conditions. In vitro, immortalized human monocytes (THP-1) were labeled with [89Zr]Zr-PLGA-NH2 NPs and the retention of 89Zr in the cell was studied over time. Finally, we show that it is feasible to image ex vivo labeled THP-1 cells with PET in mice with Staphylococcus aureus (S. aureus) inflamed muscles or human breast adenocarcinoma MDA-MB-231 tumors.

2. Materials and Methods

2.1. Synthesis of Nanoparticles

The same preparation protocol was used as described before [31]. Briefly, 100 mg of poly(lactic-co-glycolic acid) diamine endcap copolymer (PLGA-NH2, Mn = 5000, Sigma-Aldrich, Merck, Saint Louis, MO, USA), 200 µL of poly(propylene glycol) (PPO, 50 mg/mL stock, Sigma-Aldrich, average Mn 2700) and 900 µL perfluoro-15-crown-5-ether (PFCE, Exfluor Inc., Round Rock, TX, USA) were dissolved in 3 mL dichloromethane (DCM, Merck, Darmstadt, Germany). Simultaneously, 500 mg of poly(vinyl alcohol) (PVA, Mw 9000–10,000 Da, 80% hydrolyzed, Sigma-Aldrich) was dissolved in 25 g of MilliQ (18.2 MΩ cm, Merck, Kenilworth, NJ, USA). The organic phase was mixed and rapidly added to the PVA solution during sonication for 3 min, at 40% amplitude, with a probe sonicator (Sonifier 250, microtip 6.4 mm, Branson Sonic Power, Saint Louis, MO, USA). The organic phase was left to evaporate overnight, at 4 °C, while stirring. After washing the NPs four times with MilliQ and snap-freezing in liquid nitrogen, the samples were lyophilized for 48 h and stored at −20 °C until needed.

2.2. Characterization of Nanoparticles

PLGA-NH2 NPs were analyzed for size, polydispersity index (PDI) and zeta potential, in the same way as in our previous study [31]. The NPs were dissolved at 0.1 mg/mL in MilliQ, and both size and PDI were measured by using a NANO-flex (Microtrac, Inc., Duesseldorf, Germany), and the data were analyzed by using Microtrac software (Microtrac FLEX 11.1.0.2, Duesseldorf, Germany). The zeta potential was measured by using Zetasizer Nano ZS (Malvern Instruments, Worcestershire, United Kingdom), where similar NP concentrations were dissolved in NaCl (5 mM, pH 7.4). Encapsulation efficiency of PFCE was measured by using a nuclear magnetic resonance (NMR, Bruker Avance III 400 MHz, Bruker BioSpin, Ettlingen, Germany) spectrometer coupled with a Broad Band Fluorine Observation (BBFO) probe. NPs, ~5 mg, were dissolved in 500 µL deuterium oxide (D2O) containing 100 µL 1 volume% trifluoroacetic acid (TFA) in D2O. For quantification, the interscan relaxation delay (D1) was set at 5 times the relaxation time (T1) of TFA, at 20 s. The data were evaluated with Mestrenova 10.0.2 (Mestrelab Research, Escandido, CA, USA).

2.3. Characterization of Nanoparticles Stability in Human Serum and PBS over Time

PLGA-NH2 and Zr-PLGA-NH2 NPs’ size and PDI were measured in 100% human serum (human male AB plasma, Sigma-Aldrich, USA) and PBS at 0, 1, 2, 4, 6, 24, 48, 72, 168 and 336 h. First, the NPs were labeled with non-radioactive zirconium (932 µg zirconium/mg NP in 0.05 M HCl, pH 1.1–1.4, MO, USA) in metal-free 0.5 M ammonium acetate (NH4Ac, pH 5.5), which is similar to 89Zr-labeling (see Zirconium-89 labeling of PLGA and PLGA-NH2 NPs). Second, both PLGA and Zr-PLGA-NH2 NPs were dissolved at a concentration of 10 mg/mL in PBS or 100% human serum. The samples were incubated at 37 °C, in a thermomixer, for the indicated timepoints. Last, 10 µL of NP solution was transferred to 990 µL MilliQ (0.1 mg/mL), and both size and PDI were measured as explained above.

2.4. [89Zr]ZrCl4 Preparation from 89Zr-Oxalate

In order to obtain [89Zr]ZrCl4, we removed oxalate by using a Sep-Pak Light Accell Plus QMA Cartridge (Waters, Dublin, Ireland). The Sep-Pak was activated with 10 mL acetonitrile and then washed with 10 mL 0.9% NaCl, 10 mL 1 M HCl and 10 mL water. [89Zr]Zr-oxalate (Cyclotron VU, Amsterdam, The Netherlands) was added, and the cartridge was washed with 50 mL water. Finally, the 89Zr-label was eluted with 1 mL HCl (0.1 M) in 100 µL aliquots.

2.5. Intrinsic 89Zr-Labeling of PLGA and PLGA-NH2 NPs

This experiment was performed in the same manner as described in our previous study [31]. For intrinsic labeling, 1 mg NPs were dissolved in 0.5 M NH4Ac and incubated with 1–5 MBq [89Zr]ZrCl4, at 37 °C, for 30 min. After washing the NPs 3 times with PBS, the labeling efficiency and radiochemical purity were determined with instant Thin-Layer Chromatography (iTLC). Labeling efficiency was calculated as the fraction of radioactivity at the origin to the total amount of radioactivity. Unless otherwise stated, the NPs were washed until a radiochemical purity of >95% was obtained. All radioactive labeling was performed in 0.5 M NH4Ac, pH 5.5, unless stated otherwise.

2.6. 89Zr-Retention of PLGA-NH2 NPs in PBS and Human Serum

[89Zr]Zr-PLGA-NH2 NPs (1–5 MBq/mg, 10 mg/mL) were incubated in 100% human serum and PBS, at 37 °C, for 2 weeks. The 89Zr-retention was measured at 0, 1, 2, 4, 6, 24, 48, 72 and 336 h after incubation with iTLC.

2.7. EDTA Challenge

[89Zr]Zr-PLGA-NH2 NPs (3 MBq/mg, 10 mg/mL) were challenged with 0.1, 1, 10 and 50 mM EDTA (corresponds to approximately 0.1, 1, 10 and 50 equivalents more EDTA to NP) in PBS at 37 °C for 2 weeks. At 0, 1, 2, 4, 6, 24, 48, 72, 168 and 336 h, samples of 1 µL were analyzed with iTLC.

2.8. Cell Culture

The immortalized human monocyte cell line THP-1 (ATCC® TIB-202TM, VA, Gaithersburg, MD, USA) was used for cell labeling (passage of <20). The cells were maintained in culture as described previously [31].
The human adenocarcinoma cell line (MDA-MB-231, passage 46, ATCC® HTB-26TM, Gaithersburg, MD, USA) was cultured under the same conditions.

2.9. [89Zr]Zr-PLGA-NH2 NP Labeling of THP-1 Cell Line and Retention of Radiolabel over Time

THP-1 cells were incubated with [89Zr]Zr-PLGA-NH2 NPs, at a concentration of 7.5 ± 0.3 MBq/1 mg NP/106 cells, at 37 °C, for 2 h. As a control, we treated the THP-1 cells in the same manner, without the addition of [89Zr]Zr-PLGA-NH2 NPs, but with PBS. Subsequently, cells were washed to remove NPs which were not taken up by the cells. After labeling and washing, cells were incubated at culture conditions for 1, 2, 4, 6, 24 and 48 h. At every timepoint, the cells were first measured for radioactivity for 1 min with a γ-counter (wizard 2480 Automatic Gamma Counter, PerkinElmer, Downers Grove, IL, USA). The cells were then centrifuged at 300× g for 5 min, the supernatant was removed and the cells were resuspended in fresh PBS before another radioactivity measurement. The percentage retained radioactivity in the cells was calculated by dividing the activity measured after removal of supernatant by total amount of radioactivity before centrifugation, multiplied by 100.

2.10. Cell Counting

Cell numbers after an experiment were counted with Luna-II Automated Cell Counter (Logos Biosystems, Inc., Anyang, South Korea). The mixture of cells with trypan blue (1:1) was transferred to a counting cassette (Logos Biosystems, Inc., Korea) before automated counting. Living cells were used for calculating the specific activity per number of cells by dividing the total activity associated with the pellet with the number of living cells times hundred.

2.11. CellTiter-Glo Assay

For ATP content measurement, 80,000 cells were diluted with PBS to a volume of 350 µL and mixed with 350 µL of premixed substrate and buffer CellTiter-Glo (Promega, Madison, WI, USA). After a short vortex, the samples were incubated for 10 min, at room temperature (RT). From each sample, 200 µL in triplicate was transferred to a 96-wells plate (black flat bottom), and luminescence was measured by using a Tecan Infinite M200 PRO and software Tecan i-control (attenuation automatic, integration time 1000 millisecond, settle time 0 millisecond, Tecan, Grödig, Austria). Controls were set to 100%, and sample results were compared to this.

2.12. Animal Experiments

For animal experiments, the guidelines set by the Nijmegen and European Animal Experiments Committee (CCD application 2018-0011 and 2020-0007) were followed. The animals were housed in groups in individually ventilated Blue line cages. To determine [89Zr]Zr-PLGA-NH2 NPs biodistribution and blood clearance, 6 female C57BL/6JRj mice (Janvier Labs) were used (age 6–8 weeks, weight 18.4 ± 1.2 g). For PET and MRI studies with [89Zr]Zr-PLGA-NH2 NPs labeled THP-1 cells in Matrigel, 12 female BALB/cAnNRj-Foxn1nu/Foxn1nu mice (Janvier Labs) were used (age 6–8 weeks, weight 20.0 ± 0.9 g). In vivo tracking of [89Zr]Zr-THP-1 cells in S. aureus and MDA-MB-231 tumor models were performed in 11 female BALB/CAnN.Cg-Foxn1nu/Crl mice (Charles River) (age 6–8 weeks, weight 16.5 ± 2.3 g). The mice were allowed to acclimate for 1 week before the start of the experiments. Upon arrival, the mice were randomly identified with tattoos by biotechnicians who were blinded to the experimental setup.

2.13. [89Zr]Zr-PLGA-NH2 NPs Biodistribution and Blood Clearance in C57BL/6JRj Mice

At day 0, all mice were i.v. injected via the tail vein with 200 µL PBS containing 1.81 ± 0.61 MBq/5 mg [89Zr]Zr-PLGA-NH2 NPs (the particles were washed until <5% release of free 89Zr was measured compared to previous washing step). For blood kinetics, blood samples were collected via saphenous vein or heart puncture (when sacrificed), at 30 min (3 mice), 1 h (6 mice), 2 h (3 mice), 4 h (6 mice), 24 h (6 mice), day 2 (6 mice), day 3 (6 mice), day 7 (3 mice) and day 14 (3 mice). For ex vivo biodistribution, organs (spleen, liver, kidney, heart, lungs, pancreas, bladder, duodenum, ileum, colon, brain, muscle, lymph nodes (LN, inguinal), femur, bone marrow, thymus, brown fat, stomach, salivary glands and knees) were harvested after euthanizing the mice with CO2/O2 asphyxiation at day 3 (3 mice) and day 14 (3 mice). Radioactivity of the blood and organs was measured for 1 min with a γ-counter. Tissue and blood were measured for % injected dose per gram (%ID/g) with simultaneous measurements of aliquots from injected fluid. GraphPad Prism (GraphPad Software Inc., San Diego, CA, USA) was used for calculating the blood half-life (t1/2) with nonlinear regression with one-phase decay, as computed by using the formula In(2)/K, with K as a rate constant, expressed in reciprocal of the x-axis time units.
For in vivo PET/MRI imaging, mice were anesthetized by using isoflurane in oxygen (33% oxygen + 67% air) before imaging. Isoflurane (5%) was used for induction and maintained at 1–2% during scanning. Mice were imaged at 1 h (3 mice), 4 h (3 mice), 24 h (3 mice), day 3 (3 mice), day 7 (3 mice) and day 14 (3 mice) with PET (Siemens Preclinical Solution) and followed immediately by MRI (Bruker ClinScan 70/30 7T, Bruker BioSpin, Ettlingen, Germany). During scanning, the temperature of the mice was maintained at 37 °C, using a heating bed. For reconstruction of PET scans (30–60 min), Inveon Acquisition Workspace software (version 1.5, Siemens Preclinical Solution, Erlangen, Germany) was used with the reconstruction algorithm OSEM3D/SO-MAP and the following settings: no scatter correction; using scale factor, 0; matrix, 256 × 256; image zoom, 1; frames, all; OSEM Iterations, 2; MAP Iterations, 18; target resolution, 1.5 mm; voxel size, 0.4 × 0.4 × 0.8 mm.
Immediately following the PET scan, mice were transported by using the same imaging bed to the MRI scanner for anatomical imaging, where they were scanned for a duration of 32 min. A birdcage body coil (Bruker BioSpin, Ettlingen, Germany) with 86 mm inner diameter was used for image acquisition. After a localizer scan, the following settings were used for the 3D gradient echo scans: acquisition time = 32 min; repetition time = 30 ms; echo time = 1.3 ms; flip angle = 15 degrees; field of view = 120 × 56 × 32 mm; and matrix = 576 × 270 × 160, resulting in an isotropic resolution of 0.20 mm3.
The PET/MRI images were merged, and Inveon Research Workplace software (version 4.1) was used to create maximum-intensity projections. For the overlay, a reference tube with 89Zr in PBS was placed on the scan bed.

2.14. PET and MRI Imaging of [89Zr]Zr-PLGA-NH2 NPs Labeled THP-1 Cells in Matrigel

At day 0, 10,000 (395 ± 179 Bq, n = 4) or 100,000 (3950 ± 1790 Bq, n = 4) of [89Zr]Zr-THP-1 cells suspended in PBS were mixed with Matrigel (2:1 (v/v) PBS:Matrigel, BD Matrigel Matrix Basement Membrane (20.20 MG/ML), BD Biosciences, Bedford, MA, USA) before 200 µL was s.c. injected in the flank lower part of the back and abdomen. In addition, a mixture of Matrigel (1:1) and 1.56 ± 0.47 µg [89Zr]Zr-PLGA-NH2 NPs (3400 ± 2194 Bq, n = 4) in PBS was s.c. injected as a control. For blood kinetics, blood samples were collected via saphenous vein or heart puncture (after sacrifice) at 30 min (4 mice), 1 h (4 mice), 4 h (4 mice) and 24 h (6 mice). For ex vivo biodistribution, organs and Matrigel were harvested and measured as described previously.
For in vivo PET/MRI imaging, mice were imaged at 1 h (4 mice) and 24 h (4 mice) with PET and followed immediately by MRI (Bruker BioSpec 117/16 11.7T, Bruker BioSpin, Ettlingen, Germany). For PET, the same settings were used as previously described.
Immediately following the PET scan, mice were transported by using the same imaging bed to the MRI scanner for anatomical imaging, where they were scanned for a duration of 45 min. A birdcage body coil (Bruker BioSpin, Ettlingen, Germany) with 72 mm inner diameter was used for image acquisition. After a localizer scan, the following settings were used for the 3D gradient echo scans: acquisition time = 42 min; repetition time = 100 ms; echo time = 2.2 ms; flip angle = 30 degrees; field of view = 100 × 40 × 40 mm; and matrix = 400 × 160 × 160, resulting in an isotropic resolution of 0.25 mm3.

2.15. In Vivo Tracking of [89Zr]Zr-THP-1 Cells in S. aureus and MDA-MB-231 Tumor Models

S. aureus was purchased from QM Diagnostics (1.05 × 10⁹ Colony-Forming Units (CFU)/mL PBS). At day −2, S. aureus was mixed (1:1) with freshly extracted blood from donor mice, and 50 µL of the mixture was injected intramuscular in the right hind leg of mice (n = 5). In addition, PBS was mixed (1:1) with donor blood, and 50 µL was injected in the contralateral hind leg muscle of the same mice. At day 0, [89Zr]Zr-THP-1 cells (5.8 × 10⁶ cell/mouse, 90.75 ± 12.84 kBq/mouse) were injected i.v. via the tail vein.
For the tumor model, MDA-MB-231 cells (5 × 10⁶ cells/mouse) were suspended in RPMI-1640 medium, mixed with Matrigel (1:1) and injected s.c. in the right hind back side at day −22 (n = 5, 200 µL/mouse). When tumors reached a size of approximately 0.1 cm3, [89Zr]Zr-THP-1 cells were injected i.v. via the tail vein (5 × 10⁶ cells/mouse, 164.80 ± 12.99 kBq/mouse).
For PET/MRI imaging and processing of images, the same settings were used as in PET and MRI imaging of [89Zr]Zr-PLGA-NH2 NPs labeled THP-1 cells in Matrigel.

2.16. Statistical Analysis

Statistical analysis was performed in GraphPad Prism software. A Gaussian distribution with a two-tailed unpaired Student’s t-test was used to analyze differences in two groups. A p-value of <0.05 was considered statistically significant. When comparing three or more groups, a one-way ANOVA test with a Tukey test correction of multiple comparisons was performed. A two-way ANOVA test with a Sidak correction of multiple comparisons was used in the biodistribution experiments (Figure 2A), while a Tukey’s correction was used to compare the groups in the Matrigel experiments (Figure 5A). All comparisons were based on a minimum of three replicates.

3. Results

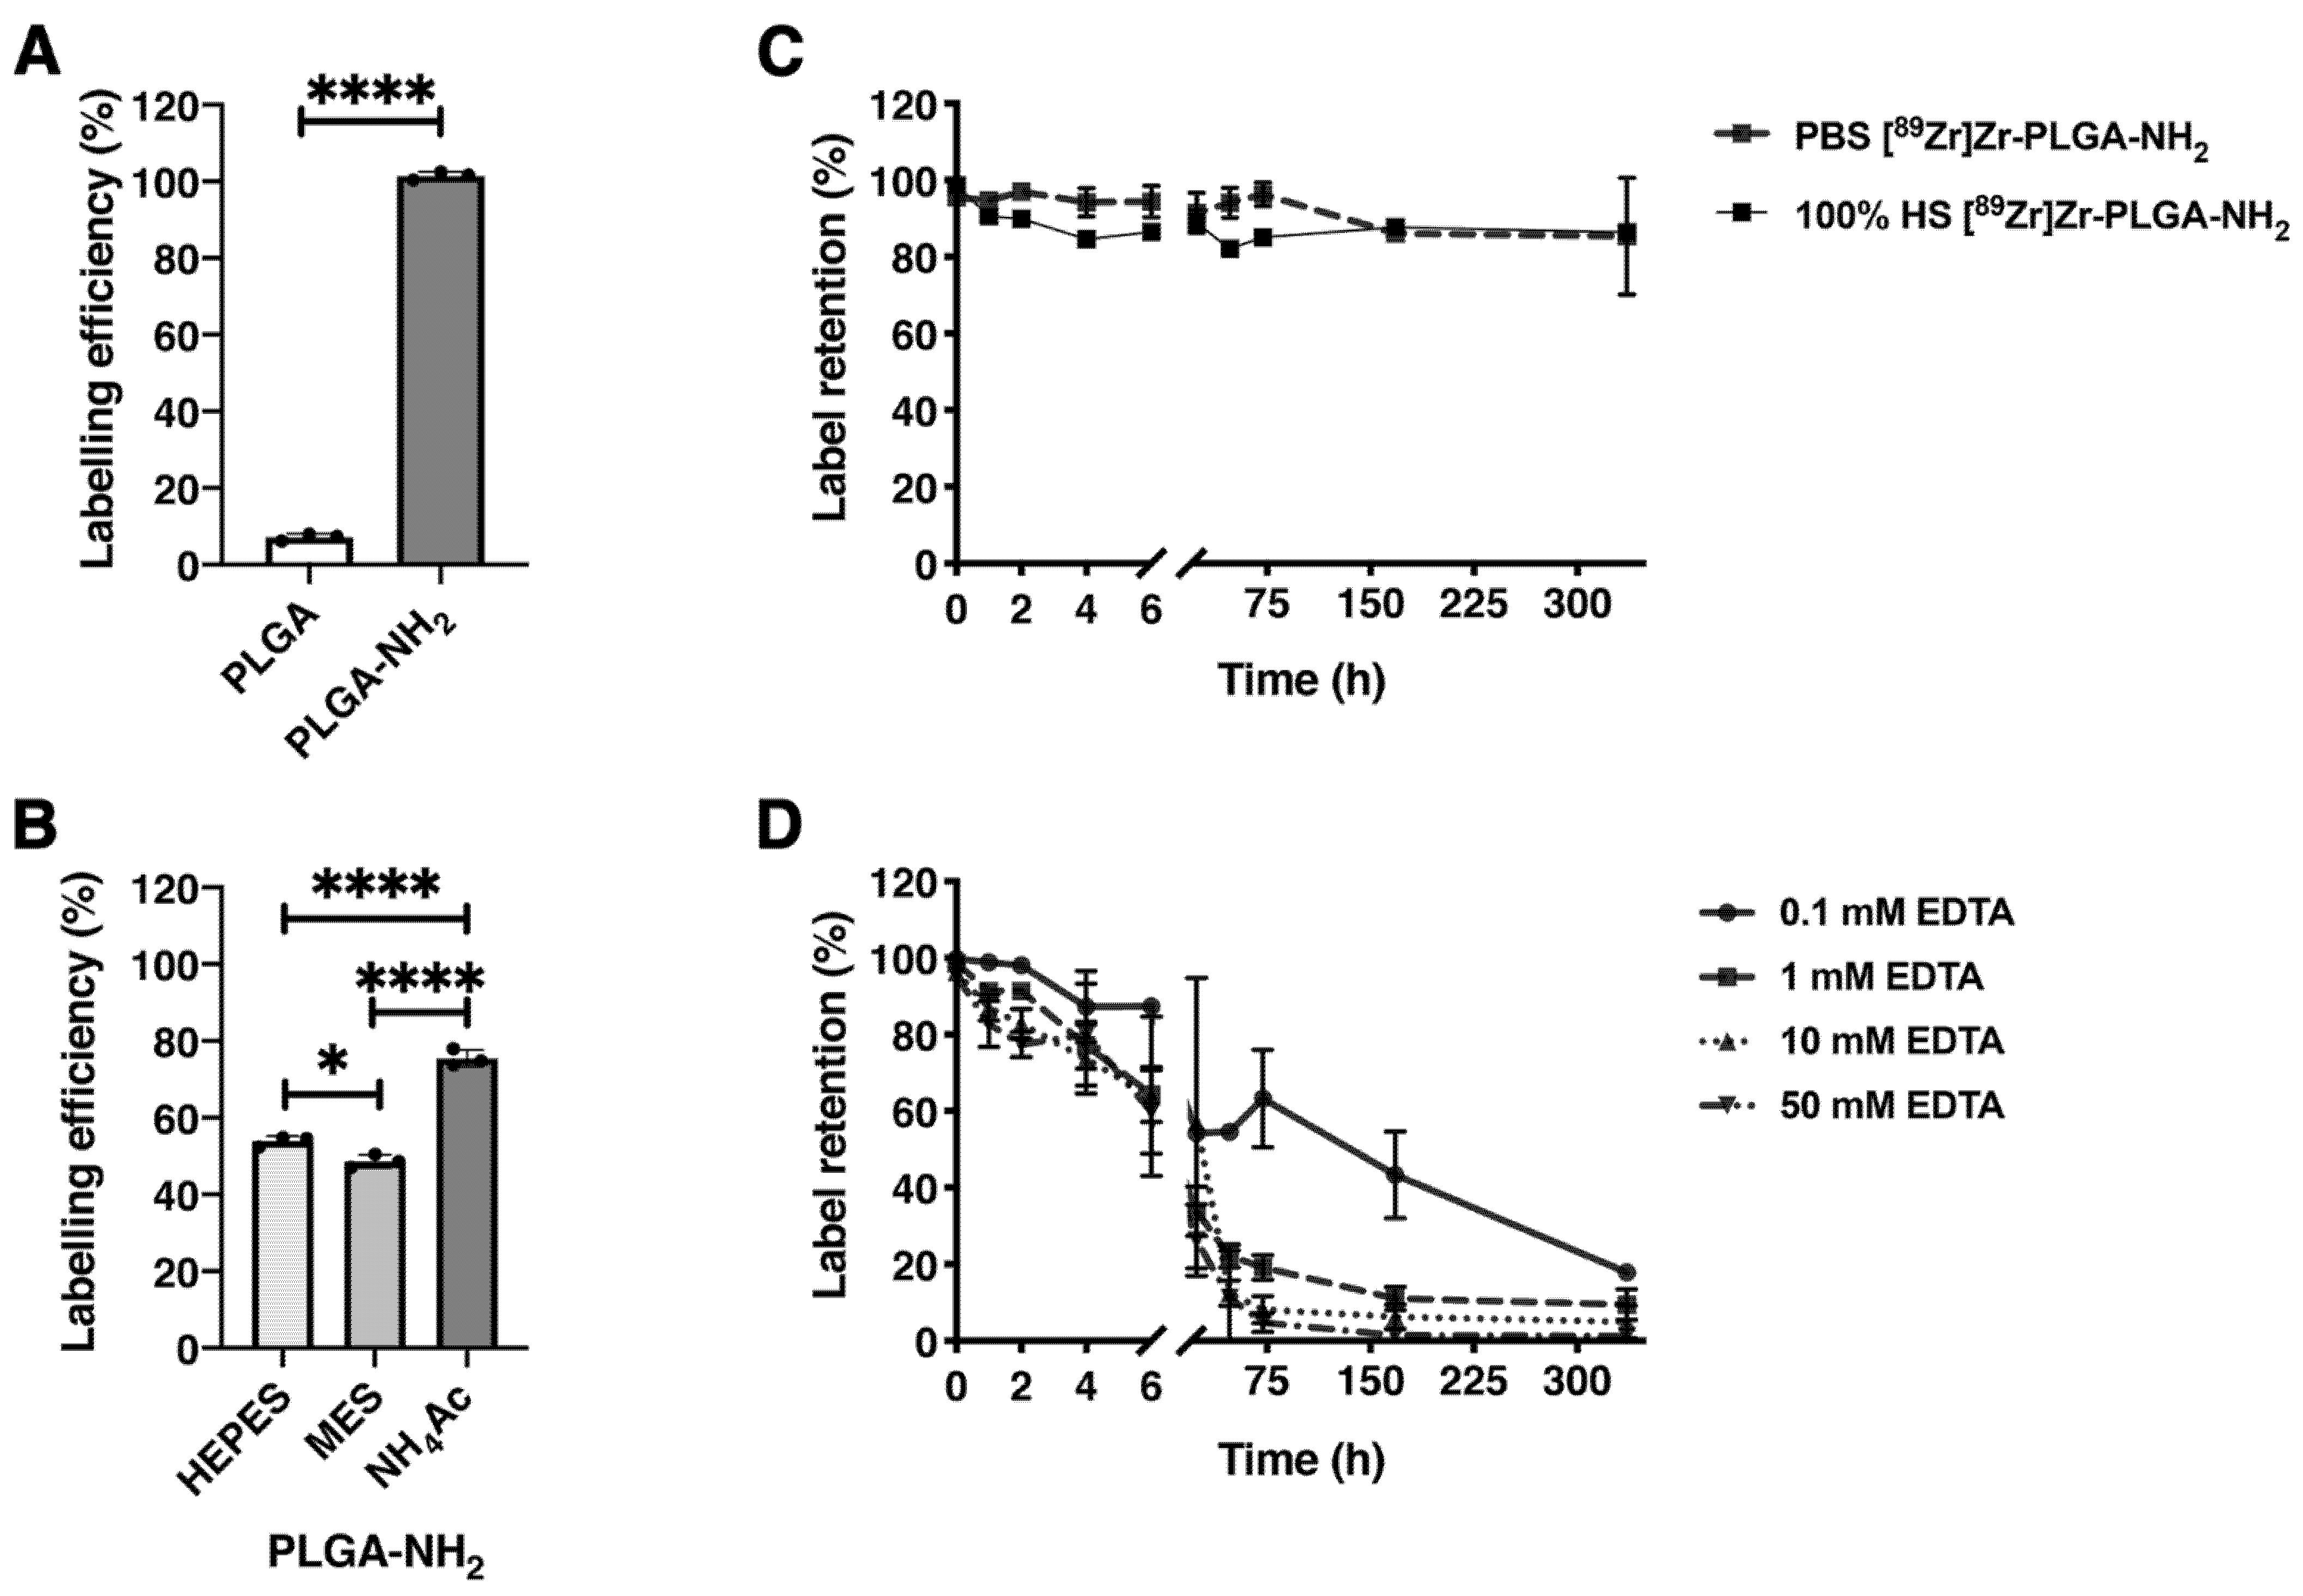
3.1. Characterization of Particles

The PLGA-NH2 particles, prepared as described previously [31], were labeled with non-radioactive zirconium (Zr) and characterized for diameter, polydispersity (PDI) and zeta potential (Table 1). The diameter increased slightly when the PLGA-NH2 NPs were labeled with zirconium from 189 ± 1.9 nm to 196 ± 4.1 nm. The PDI remained the same while the zeta potential increased to a more neutral charge, from −2.3 ± 0.9 mV to −0.3 ± 0.4 mV. These results indicate that NP characteristics were altered by the Zr-labeling, with increased size and zeta potential.

3.2. Stability of the PLGA-NH2 and Zr-PLGA-NH2 NPs in PBS and Human Serum

To assess whether the characteristics of the particles changed over time, we incubated the PLGA-NH2 and Zr-PLGA-NH2 NPs in PBS and 100% human serum at 37 °C for a period of 2 weeks. The diameter of the NPs remained stable (~200 nm) in PBS for 72 h and was increased (~300 nm) at 336 h (Figure S1A). Similarly, the PDI of both NPs remained stable (~0.08) for 72 h and was increased (~0.2) at 336 h. In human serum, the diameter of the NPs was increased (>200 nm) at 336 h (Figure S1B). The PDI of both samples showed similar fluctuations as observed for the diameter over time.

3.3. [89Zr]ZrCl4 Labeling of PLGA and PLGA-NH2 NPs

PLGA and PLGA-NH2 NPs were radiolabeled with [89Zr]ZrCl4, where a labeling efficiency of 7.1 ± 0.9% and 101.5 ± 1.1% for PLGA NPs and PLGA-NH2 NPs (p < 0.0001, Figure 1A) was observed, respectively, showing efficient 89Zr-labeling of PLGA-NH2 NPs, without the need for additional chelator. To evaluate the effect of buffer on labeling efficiency, the PLGA-NH2 NPs were labeled in 0.5 M HEPES, MES and NH4Ac buffer at a pH of 5.5 (Figure 1B). Labeling efficiency was highest for the NH4Ac buffer (76 ± 2%, p < 0.0001 compared to HEPES and MES buffers). We therefore continued to label PLGA-NH2 NPs in NH4Ac buffer. The retention of the 89Zr by the NPs was measured in PBS and 100% human serum. In PBS and 100% human serum, the 89Zr-retention was ∼85 ± 15% after 336 h (Figure 1C). In addition, [89Zr]Zr-PLGA-NH2 NPs were challenged with EDTA at 37 °C, for 336 h. After an initial release of 89Zr from the NPs during the first 6 h, a gradual and EDTA concentration-dependent release of 89Zr was observed for up to 336 h (Figure 1D). From these results, we can conclude that 89Zr was interacting with the PLGA-NH2 NPs and retained by the NPs in PBS and human serum. However, the 89Zr-label could be challenged by EDTA.

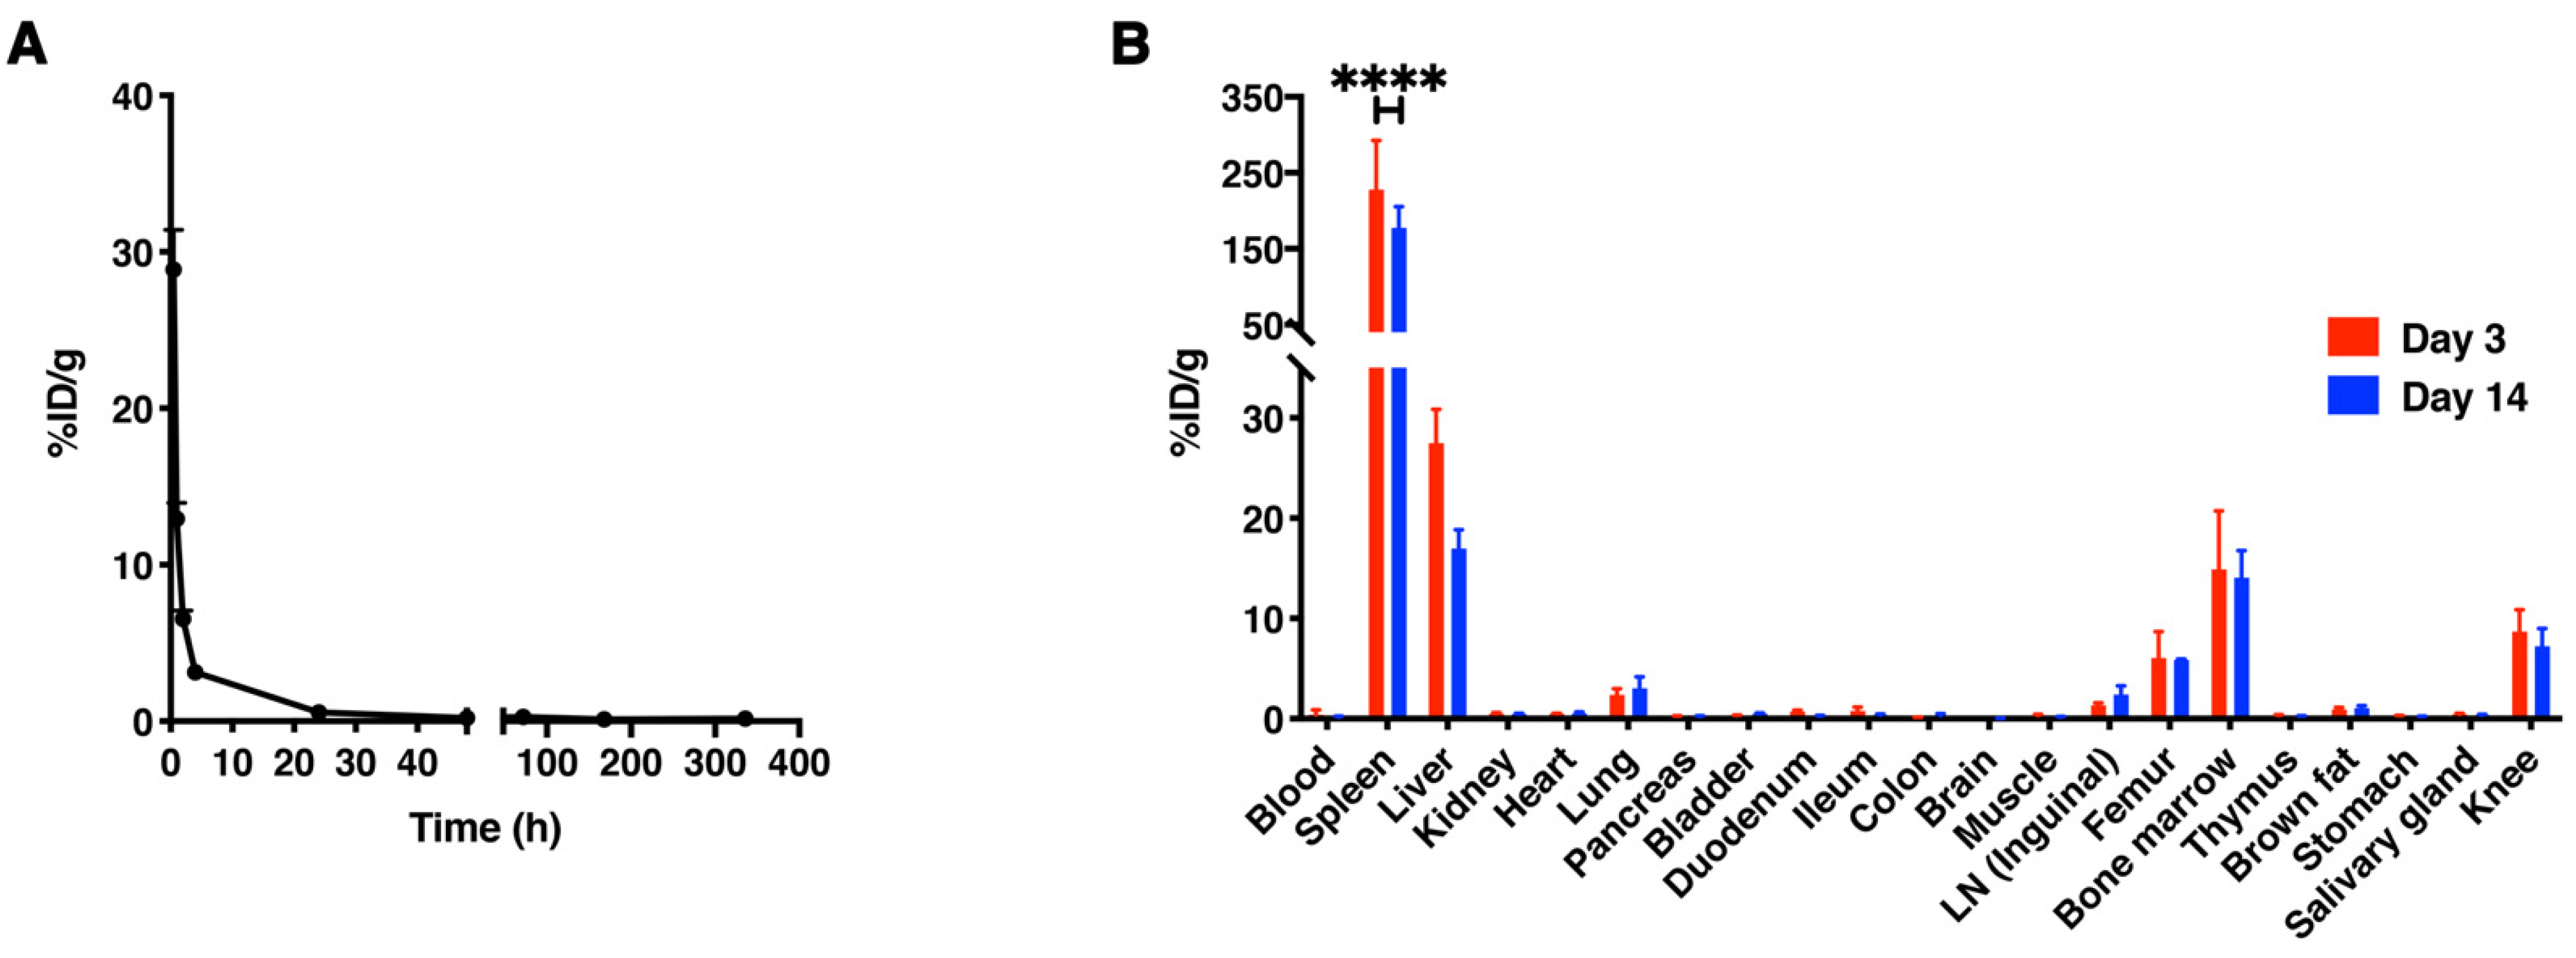
3.4. In Vivo Biodistribution of [89Zr]Zr-PLGA-NH2 NPs in C57BL/6 Mice

The in vivo biodistribution of [89Zr]Zr-PLGA-NH2 NPs upon intravenous (i.v.) injection was evaluated in C57BL/6 mice. The concentration of [89Zr]Zr-PLGA-NH2 NPs in blood decreased rapidly, and the calculated blood half-life (t1/2) was 28 ± 6 min (Figure 2A and Table S1).
Spleen, liver and bone marrow were the main organs for NP accumulation, as demonstrated by the result of the ex vivo measurements and PET/MRI scans (Figure 2B and Figure 3 and Table S1). In addition, we also observed accumulation in femur (5.9 ± 0.1% ID/g at day 14) and knees (7.2 ± 1.8% ID/g at day 14). Taken together, these results show that the particles are cleared from the blood in the first 24 h after injection and that the spleen, liver and bone marrow are the main accumulation sites.

3.5. [89Zr]Zr-PLGA-NH2 NPs Labeling of THP-1 Cells and Retention over Time

THP-1 cells, immortalized human monocytes, were labeled with [89Zr]Zr-PLGA-NH2 NPs ([89Zr]Zr-THP-1 cells), where a labeling efficiency of 4.03 ± 0.16% was observed, resulting in a specific activity of 279 ± 10 kBq/106 cells. The [89Zr]Zr-THP-1 cells retained 79.6 ± 5.9% of the radiolabel at 48 h after incubation (Figure 4A). Cell counting showed that 76.4 ± 15.2% of [89Zr]Zr-THP-1 cells remained alive over 48 h, while the ATP content, as measured with CellTiter-Glo assay in the cells, did not decrease (119.7 ± 9.4% compared with control samples; Figure 4B,C). In summary, [89Zr]Zr-PLGA-NH2 NPs could stably label THP-1 cells, which remained viable over 48 h.

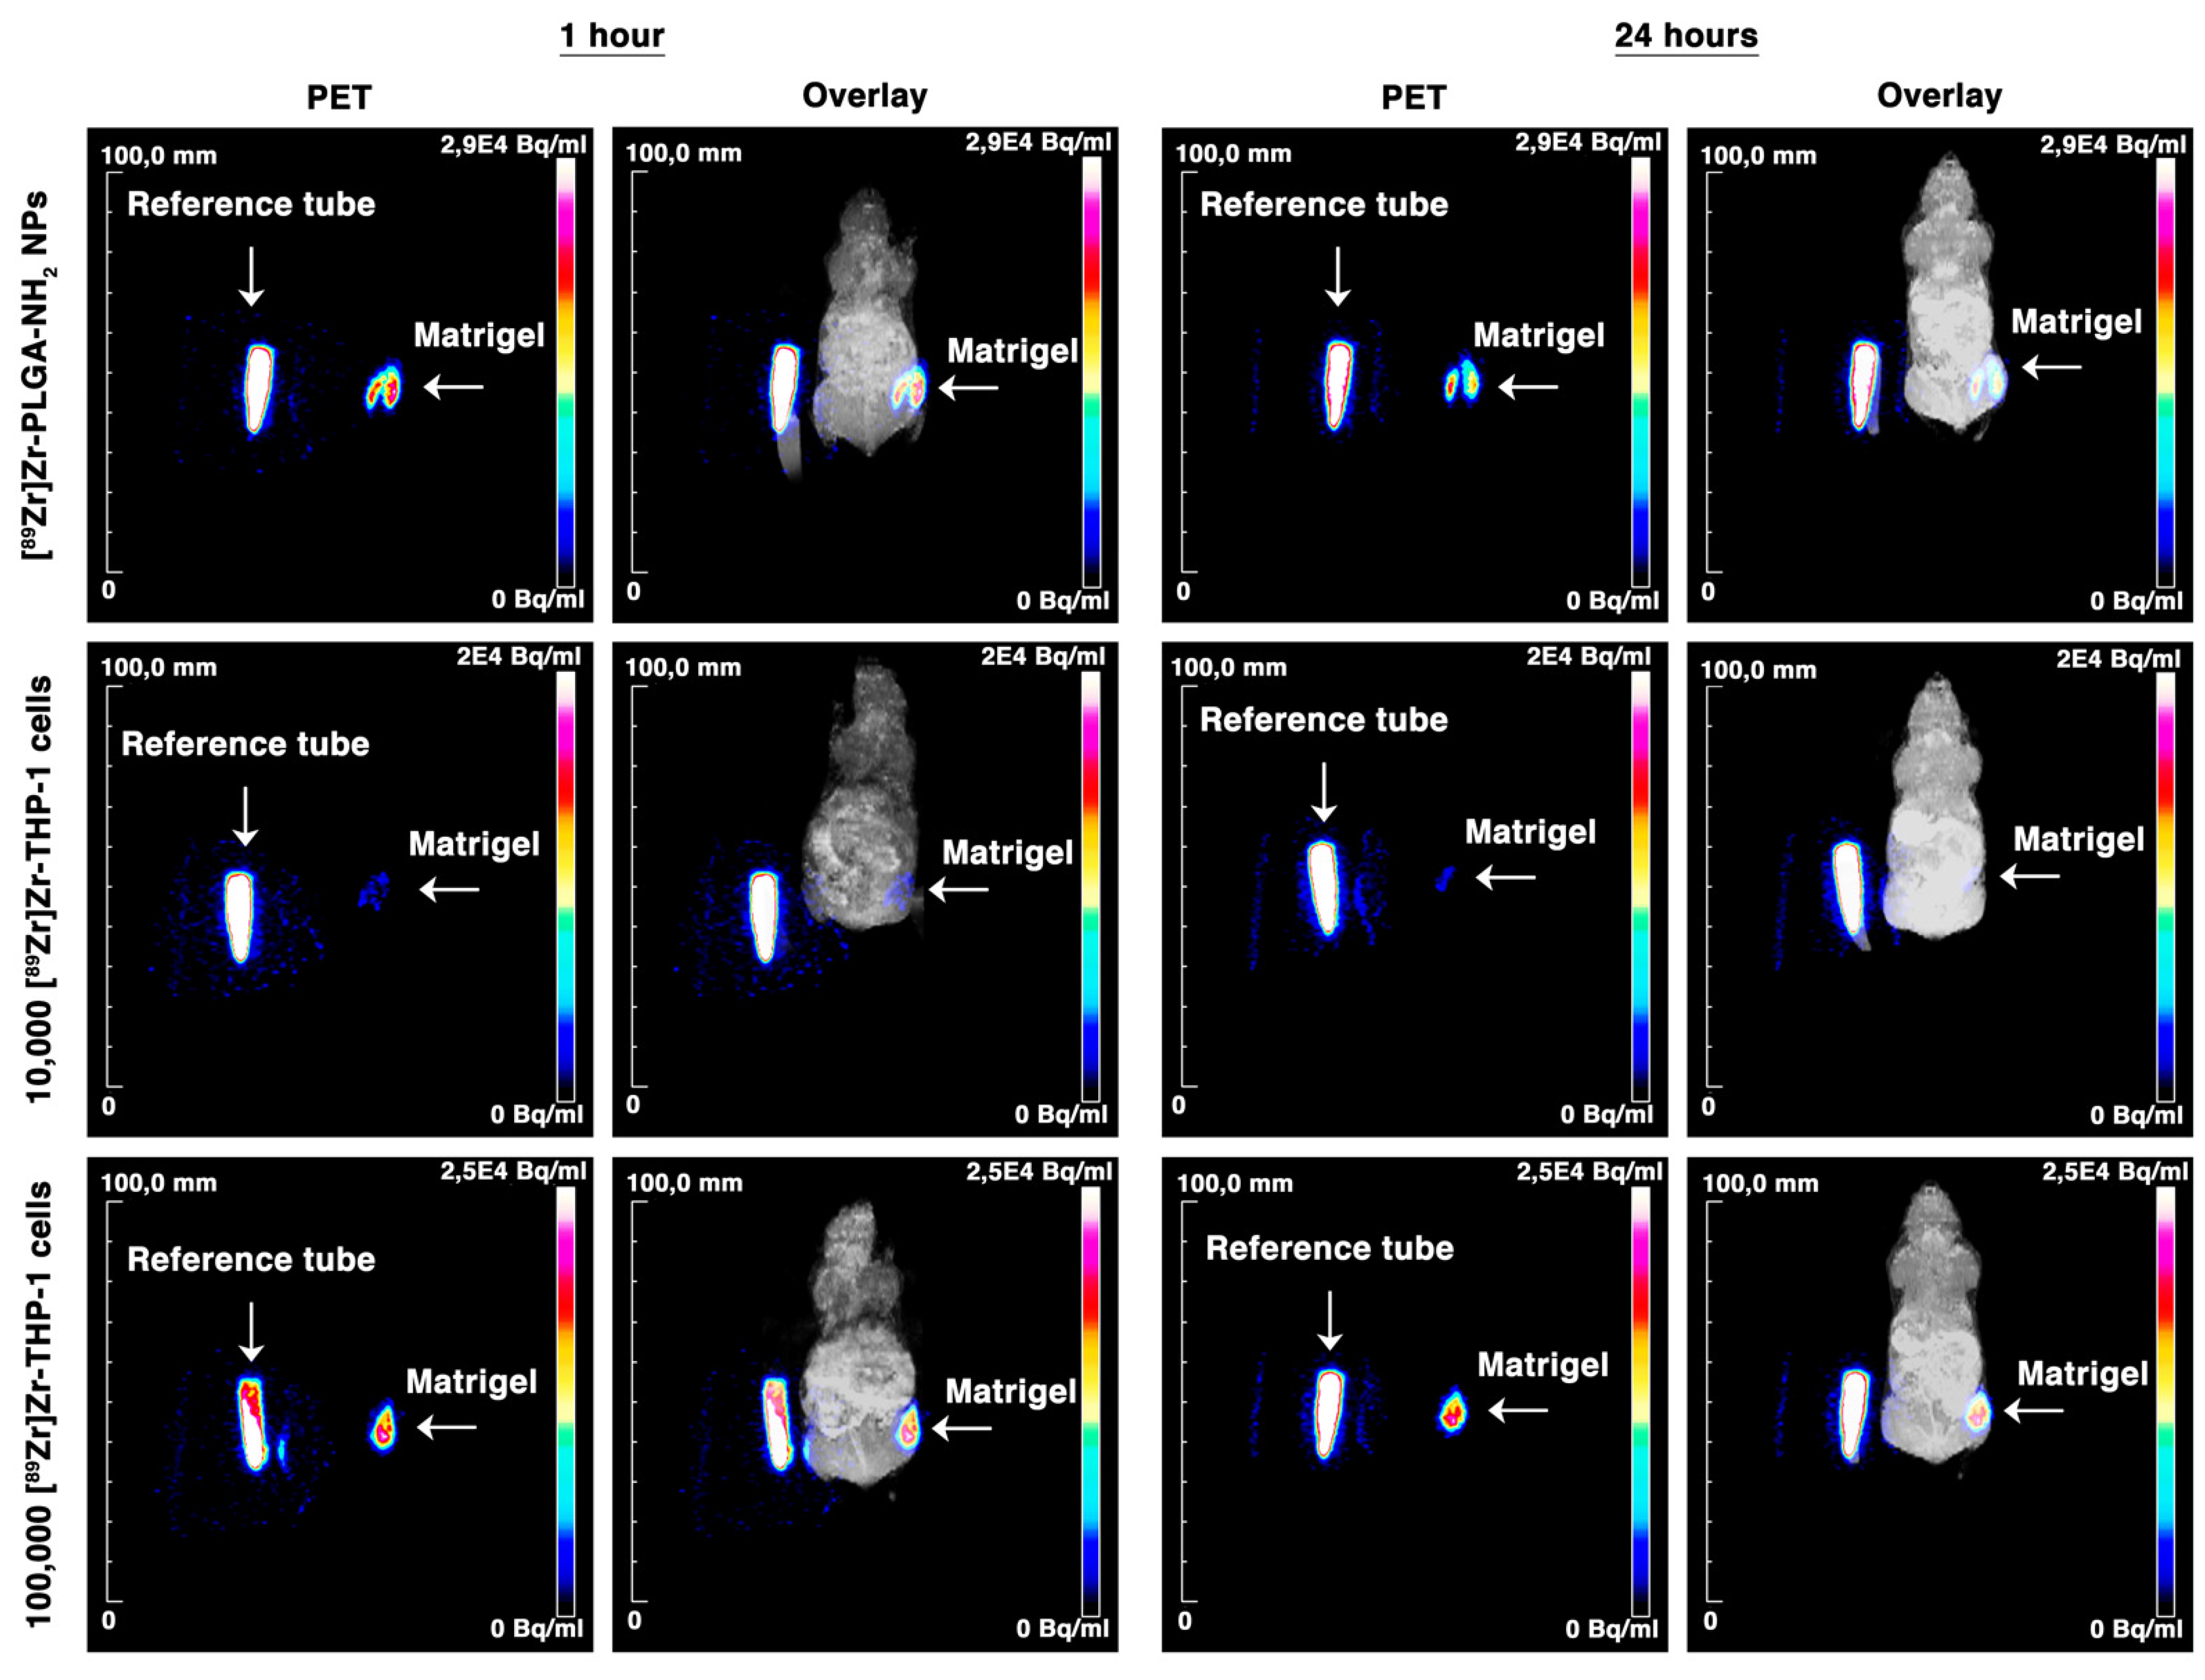
3.6. [89Zr]Zr-THP-1 Cells for In Vivo PET/MRI Imaging

To determine PET sensitivity for the detection of low numbers of [89Zr]Zr-THP-1 cells, three groups of mice were injected subcutaneously (s.c.) with Matrigel containing 10,000 [89Zr]Zr-THP-1 cells, 100,000 [89Zr]Zr-THP-1 cells or [89Zr]Zr-PLGA-NH2 NPs (Figure 5). All three Matrigel depositions were visible on the PET scans (Figure 6). From the biodistribution data, we can see that the blood and organ signals were low, indicating that the radioactive signal remains at the Matrigel for over 24 h (Figure 5 and Table S2).

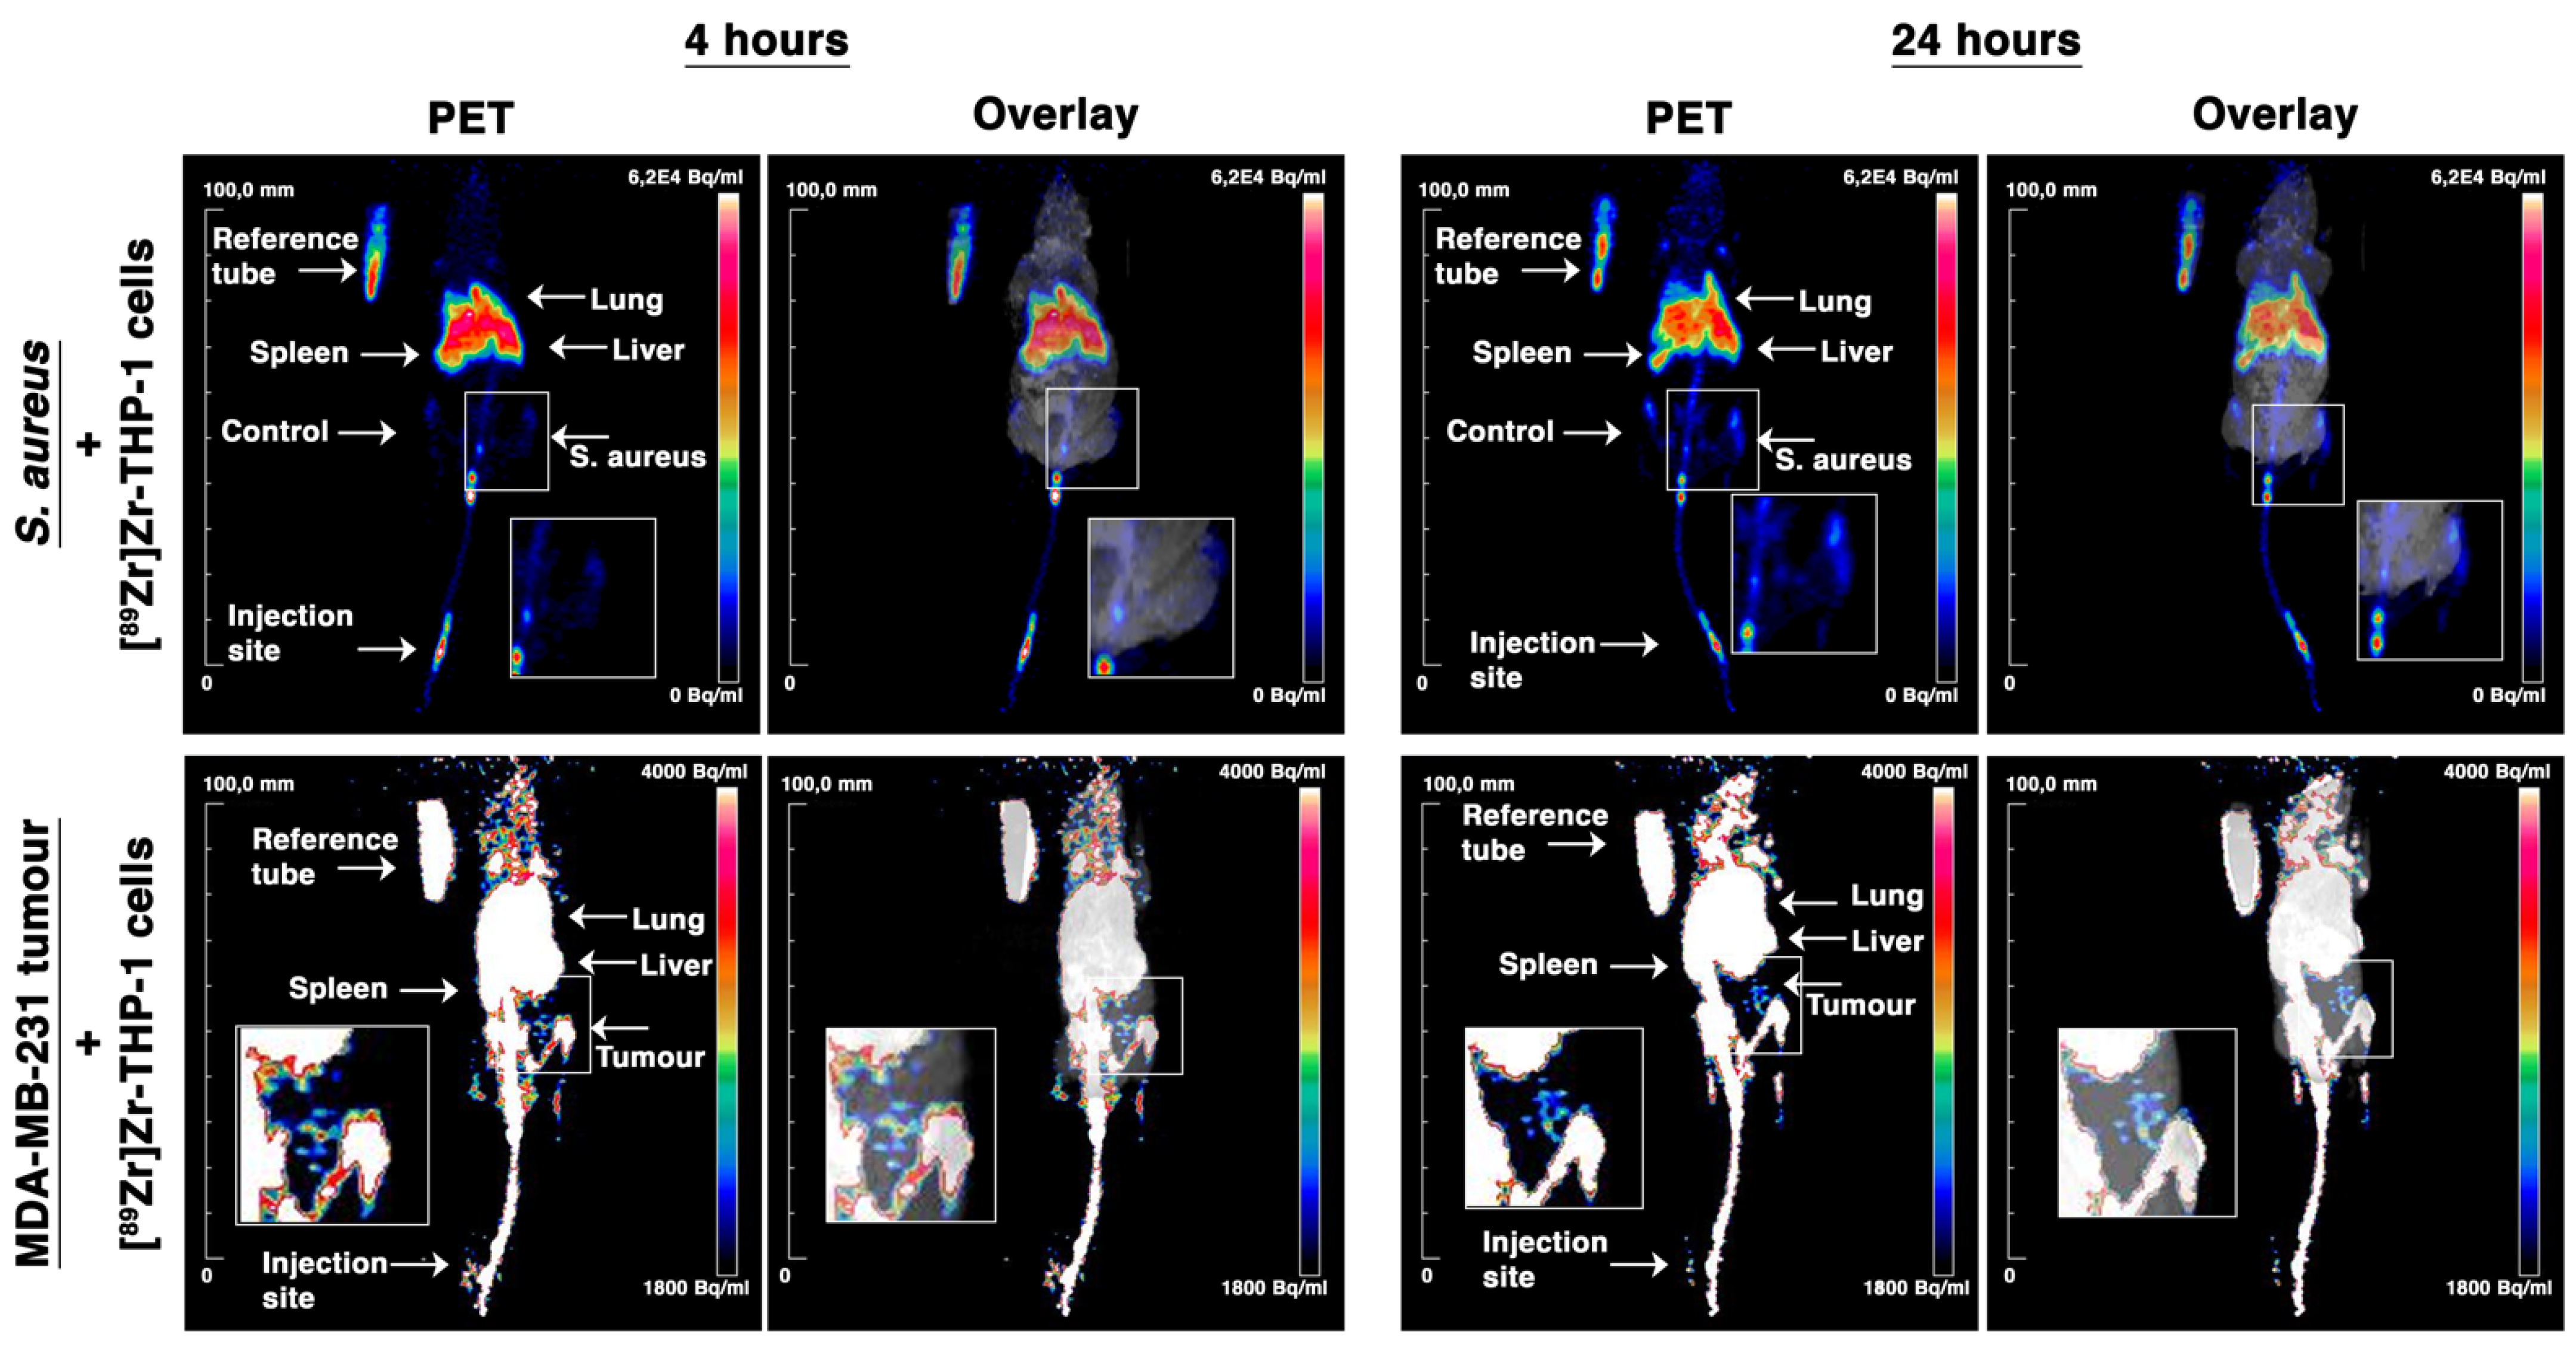
3.7. In Vivo PET/MRI Tracking of [89Zr]Zr-THP-1 Cells in Local S. aureus Infection and MDA-MB-231 Tumor Model

[89Zr]Zr-THP-1 cells were tracked in vivo in a local intramuscular S. aureus infection and MDA-MB-231 tumor model. For the S. aureus model, i.v. injected [89Zr]Zr-THP-1 cells were rapidly cleared from blood within 30 min. Ex vivo biodistribution study at 24 h showed that the organs with the highest uptake were spleen, liver, lung and bone marrow (Figure 7A,B and Table S3). Furthermore, 0.46 ± 0.10% of the total administered [89Zr]Zr-THP-1 cells (corresponding to 26.89 ± 5.79 × 10³ cells) accumulated in the S. aureus–infected muscle, compared with 0.04 ± 0.02% (2.14 ± 0.89 × 10³ cells) in the control muscle. A PET signal was detected as early as 4 h post-injection in the S. aureus–infected muscle, which increased at 24 h post-injection (Figure 8 and Videos S1 and S2).
In MDA-MB-231 tumor-bearing mice, [89Zr]Zr-THP-1 cells were also cleared from blood within 30 min. The spleen, liver, lung and bone marrow showed a high uptake of the radiolabeled cells at 24 h (Figure 7C,D and Table S3). The number of [89Zr]Zr-THP-1 cells accumulated at the tumor site was 0.11 ± 0.05% (corresponding to 5.55 ± 2.53 × 10³ cells) of the total injected cells, compared with 0.02 ± 0.00% (0.96 ± 0.19 × 10³ cells) in the muscle of the foreleg. Moreover, a low PET signal in the tumor was detected at 4 h, which slightly increased at 24 h post-injection (Figure 8 and Videos S3 and S4).
Together, these sets of experiments show that it was feasible to track ex vivo [89Zr]Zr-PLGA-NH2 NPs labeled THP-1 cells in two disease models.

4. Discussion

PET is currently the most sensitive whole-body-imaging modality for clinical studies that is ideal for in vivo tracking of small numbers of labeled cells. The long-lived positron emitter 89Zr4+ allows for imaging up to several days post-injection. This prompted us to explore the potential of [89Zr]Zr-PLGA-NH2 NPs for cell labeling and in vivo tracking with PET.
We previously developed PLGA-NH2-based NPs that were able to intrinsically complex and retain [111In]InCl3 for SPECT [31]. Here we demonstrated that these NPs also allow for intrinsic labeling with [89Zr]ZrCl4 for PET. As expected, labeling with non-radioactive Zr slightly increased the NPs’ size and zeta potential.
PLGA-NH2 NPs showed efficient labeling with [89Zr]ZrCl4, compared to normal PLGA NPs without -NH2. In PBS and human serum, 89Zr was retained for >80% by the NPs for up to 2 weeks. This indicates that the particles are able to retain the 89Zr-label without the use of a chelator, such as desferrioxamine (DFO). However, when challenged with EDTA, 89Zr was partly released from the particles, even at 0.1 mM (0.1 equivalents of EDTA) concentration. 89Zr-release upon EDTA (1000 equivalents) challenge was also reported for DFO-conjugated trastuzumab, which showed a release of 25% and 50% in the first 24 h 7 days, respectively, which is slower than observed in our study [32]. From the literature, it was known that 89Zr requires a strong Lewis base, such as OH ions, and an 8-coordination for optimal binding and retention [33], which cannot be secured in the NPs, as chelation depends on free primary amine groups. However, for our application, the [89Zr]Zr-PLGA-NH2 NPs mainly serve the purpose of ex vivo cell labeling, and the release, in the first instance, is mainly limited to the intracellular compartments of the labeled cells. However, in the course of time or upon cell death, 89Zr can be released and redistributed within the body.
The biodistribution of the [89Zr]Zr-PLGA-NH2 NPs was in line with our previous observations with [111In]In-PLGA-NH2 NPs [34]. The signal at the tail was probably due to partial s.c. injection of the NPs. Interestingly, the accumulation in liver was half that of [111In]In-PLGA-NH2 NPs [31]. Furthermore, in spleen, activity at day 14 was only 50 %ID/g for [89Zr]Zr-PLGA-NH2 NPs, while it was >100 %ID/g for [111In]In-PLGA-NH2 NPs. Accumulation of 89Zr was observed in the femur and knee at day 3, but this did not increase further at day 14. From the literature, it is known that free 89Zr released from the targeting vehicle has the tendency to accumulate in bone tissue [29]. The radioactivity in femur and knee might be explained by (I) the <5% free 89Zr present during injection of the NPs, (II) 89Zr-release from the NPs after injection or (II) macrophages and monocytes that take up the NPs and are present in or migrate to bone marrow.
The labeling of the THP-1 cells with [89Zr]Zr-PLGA-NH2 NPs was not very efficient, as only ∼4% of the NPs was taken up by the cells. In general, cell labeling with [89Zr]Zr-oxine is faster (15–30 min) and more efficient (10–40% labeling efficiency) when compared with NP-based cell labeling [35,36,37,38]. However, the specific activity of the NPs labeled cells was in range with the results from the literature, where human mesenchymal stem cells or chimeric antigen receptor (CAR) T cells were labeled for in vivo imaging with a broad range of specific activity of 0.009–0.370 MBq/106 cells, using desferrioxamine or oxine as carrier [21,37,39,40]. Moreover, higher specific activity per cell is not desired, as this could lead to radiotoxicity [37]. Furthermore, 89Zr was retained by the cells up to 48 h after incubation, which was comparable to [111In]In-PLGA-NH2-labeled moDC cells. Different type of cells (for example, CAR T cell and natural killer cells) labeled with [89Zr]Zr-oxine showed a similar decrease of radioactivity over a period of 48 h [22,37,41]. The 89Zr release from [89Zr]Zr-oxine-labeled cells was also rapid for certain cell types (DCs and CAR T cells), i.e., >25% release after 2 days. These indicate that the NPs used in this study could play a role in cell labeling and in vivo tracking. However, future studies are needed to demonstrate feasibility of radiolabeling of other cell types, such as T cells. One strategy to enhance overall cellular uptake would be to modify the coating of NPs with, for example, cell-penetrating peptides or Lipofectamine [42,43,44]. Alternatively, to improve labeling of specific subsets of immune cells, NPs can be decorated with antibodies or peptides with the desired specificity [45,46].
In vivo studies showed that we were able to detect small numbers of labeled THP-1 cells, using PET. A clear signal was observed in mice which were transplanted s.c. with 10,000–100,000 [89Zr]Zr-THP-1 cells (395–3950 Bq). Furthermore, minimal redistribution of radioactivity to other organs was observed, except for the femur and bone marrow, potentially caused by [89Zr]Zr-THP-1 cells migrating to bone marrow or 89Zr released from the cells. This indicates that 89Zr is well retained inside cells.
Next, we injected [89Zr]Zr-THP-1 cells i.v. and tracked their biodistribution in S. aureus inflammation model and a MDA-MB-231 tumor model. We detected a radioactive signal in the inflamed muscle and at the tumor site. However, it should be noted that the tumor accumulation was minimal, most likely because the tumor environment is less chemotactic compared with the S. aureus induced inflammation. Other studies have also developed techniques for PET-based cell tracking. For example, [89Zr]Zr-oxine-based cell labeling has been evaluated in several studies with different type of cells and disease models. Recently, the potential of surface labeling with [89Zr]Zr-DFO was shown by using human cardiopoietic stem cells for in vivo tracking in an ischemic-heart-failure mice model. Alternatively, a signal cell labeling and tracking was demonstrated with [68Ga]Ga-mesoporous silica NPs, using PET [47]. The concept of single-cell tracking is highly challenging, as a high load of radioactivity per cell (>70 Bq) is required for accurate tracking. This could pose a problem in prolonged studies (24–72 h), since more radioactivity per cell would be required, as the half-life of 68Ga is 67 min. Single-cell tracking would be interesting to study the behavior of that single cell; however, most effector mechanisms require cooperation with a multitude of other cells [48].

5. Conclusions

As PET is a highly sensitive imaging modality, in combination with novel cell-labeling approaches, it is ideally positioned for whole-body in vivo cell tracking. Here we expanded on our previous radiolabeling strategy and demonstrated for the first time that [89Zr]Zr-PLGA-NH2 NPs can be used as a tool for cell labeling and sensitive in vivo cell tracking, using PET. For future (clinical) applications, however, cell-labeling efficiency can be improved by coating the surface of the NPs with cell-specific antibodies, peptides, nanobodies or other targeting agents.

Supplementary Materials

The following are available online at https://www.mdpi.com/article/10.3390/cancers13205069/s1. Figure S1: Over time particle stability in different buffers, Table S1: Biodistribution of [89Zr]Zr-PLGA-NH2 NPs at days 3 and 14 after intravenous tail injection in C57BL/6 mice, Data are expressed as % injected dose per gram (mean ± standard deviation, n = 3), Table S2: Biodistribution of [89Zr]Zr-THP-1 cells at 24 h after subcutaneous injection, Data are expressed as % injected dose per gram (mean ± standard deviation, n = 4), Table S3: Biodistribution of [89Zr]Zr-THP-1 cells at 24 h after intravenous injection in Staphylococcus aureus and MDA-MB-231 tumor models, Data are expressed as % injected dose per gram (mean ± standard deviation, n = 4–5), Video S1: Staphylococcus aureus 4 h, Video S2: Staphylococcus aureus 24 h, Video S3: MDA-MB-231 tumor 4 h, Video S4: MDA-MB-231 tumor 24 h.

Author Contributions

Conceptualization, M.K., M.S., E.H.J.G.A. and S.H.; methodology, M.K., M.S., E.H.J.G.A. and S.H.; software, M.K., K.R.G.C., M.B., A.K. and G.M.F., A.V., T.W.J.S., R.R. and N.K.v.R.; validation, M.K., K.R.G.C., M.B., A.K., G.M.F., A.V., T.W.J.S., R.R., N.K.v.R. and S.H.; formal analysis, M.K., K.R.G.C., M.B., A.K., G.M.F., A.V., T.W.J.S., R.R., N.K.v.R. and S.H.; investigation, M.K., K.R.G.C., M.B., A.K., G.M.F., A.V., T.W.J.S., R.R., N.K.v.R., M.S., E.H.J.G.A. and S.H.; resources, M.K., M.S., I.J.M.d.V., C.G.F., E.H.J.G.A. and S.H.; data curation, M.K., M.S., E.H.J.G.A. and S.H.; writing—original draft preparation, M.K., M.S., E.H.J.G.A. and S.H.; writing—review and editing, M.K., K.R.G.C., M.B., A.K., G.M.F., A.V., T.W.J.S., R.R., N.K.v.R., M.S., I.J.M.d.V., C.G.F., E.H.J.G.A. and S.H.; visualization, M.K., M.S., E.H.J.G.A. and S.H.; supervision, M.K., M.S., E.H.J.G.A. and S.H.; project administration, M.K., M.S., E.H.J.G.A. and S.H.; funding acquisition, M.S., I.J.M.d.V., C.G.F., E.H.J.G.A. and S.H. All authors have read and agreed to the published version of the manuscript.

Funding

EA received Junior Researcher grants from the Radboud Institute for Molecular Life Sciences (RIMLS) and Dutch Cancer Society Young Investigator Grant (project 12493) and is supported by a grant from the Radboud Oncologie Fonds/Stichting Bergh in het Zadel, partner of Dutch Cancer Society (KUN2015-8106). This study received funding from the Innovative Medicines Initiative 2 Joint Undertaking under grant agreement No 116106. This Joint Undertaking received support from the European Union’s Horizon 2020 research and innovation program and EFPIA. SH is supported by the Netherlands Organisation for Scientific Research (NWO, project number 91617039), and the Dutch Cancer Society (KWF, project number 10099). MS received a European Research Council (ERC) starting grant (CoNQUeST, grant 336454) and Proof of Concept (CoNQUeST, grant 713524), grant 14716 from The Netherlands organisation for scientific research NWO-TTW and a grant from European Research Area Network on Cardiovascular Disease (ERA-CVD, SCAN, 2017T097).

Institutional Review Board Statement

Experiments were performed in accordance with the guidelines set for animal care of the Nijmegen and European Animal Experiments Committee (CCD application 2018-0011 and 2020-0007).

Informed Consent Statement

Not applicable.

Data Availability Statement

The data presented in this study are available in this article and supplementary material. The raw data are available upon request.

Acknowledgments

We would also like to thank Olga Koshkina, Edyta Swider and Alexander H.J. Staal from the Tumor Immunology department of the Radboud University Medical Center for their helpful discussions. We would also like to thank Peter Laverman and Mark Rijpkema from the Medical Imaging department of the Radboud University Medical Center for their helpful discussions. We would also like to thank Raffaela Rossin and Thuur van Onzen from Tagworks Pharmaceuticals for their helpful discussions.

Conflicts of Interest

The authors declare the following competing financial interest(s): M.S. and N.K.v.R. work for Cenya Imaging BV, The Netherlands.

References

  1. Harari, A.; Graciotti, M.; Bassani-Sternberg, M.; Kandalaft, L.E. Antitumour Dendritic Cell Vaccination in a Priming and Boosting Approach. Nat. Rev. Drug Discov. 2020, 19, 635–652. [Google Scholar] [CrossRef] [PubMed]
  2. Boudewijns, S.; Bloemendal, M.; de Haas, N.; Westdorp, H.; Bol, K.F.; Schreibelt, G.; Aarntzen, E.H.J.G.; Lesterhuis, W.J.; Gorris, M.A.J.; Croockewit, A.; et al. Autologous Monocyte-Derived DC Vaccination Combined with Cisplatin in Stage III and IV Melanoma Patients: A Prospective, Randomized Phase 2 Trial. Cancer Immunol. Immunother. 2020, 69, 477–488. [Google Scholar] [CrossRef] [Green Version]
  3. D’Agostino, M.; Raje, N. Anti-BCMA CAR T-Cell Therapy in Multiple Myeloma: Can We Do Better? Leukemia 2020, 34, 21–34. [Google Scholar] [CrossRef] [PubMed]
  4. Singh, A.K.; McGuirk, J.P. CAR T Cells: Continuation in a Revolution of Immunotherapy. Lancet Oncol. 2020, 21, e168–e178. [Google Scholar] [CrossRef]
  5. Lee, S.; Ko, Y.; Kim, T.J. Homeostasis and Regulation of Autoreactive B Cells. Cell. Mol. Immunol. 2020, 17, 561–569. [Google Scholar] [CrossRef] [PubMed]
  6. Volkov, M.; Schie, K.A.; Woude, D. Autoantibodies and B Cells: The ABC of Rheumatoid Arthritis Pathophysiology. Immunol. Rev. 2020, 294, 148–163. [Google Scholar] [CrossRef] [Green Version]
  7. Schwartz, D.M.; Burma, A.M.; Kitakule, M.M.; Luo, Y.; Mehta, N.N. T Cells in Autoimmunity-Associated Cardiovascular Diseases. Front. Immunol. 2020, 11, 588776. [Google Scholar] [CrossRef]
  8. Paijens, S.T.; Vledder, A.; de Bruyn, M.; Nijman, H.W. Tumor-Infiltrating Lymphocytes in the Immunotherapy Era. Cell. Mol. Immunol. 2021, 18, 842–859. [Google Scholar] [CrossRef] [PubMed]
  9. Lin, B.; Du, L.; Li, H.; Zhu, X.; Cui, L.; Li, X. Tumor-Infiltrating Lymphocytes: Warriors Fight against Tumors Powerfully. Biomed. Pharmacother. 2020, 132, 110873. [Google Scholar] [CrossRef]
  10. Kircher, M.F.; Allport, J.R.; Graves, E.E.; Love, V.; Josephson, L.; Lichtman, A.H.; Weissleder, R. In Vivo High Resolution Three-Dimensional Imaging of Antigen-Specific Cytotoxic T-Lymphocyte Trafficking to Tumors. Cancer Res. 2003, 63, 6838–6846. [Google Scholar]
  11. Zhou, X.Y.; Tay, Z.W.; Chandrasekharan, P.; Yu, E.Y.; Hensley, D.W.; Orendorff, R.; Jeffris, K.E.; Mai, D.; Zheng, B.; Goodwill, P.W.; et al. Magnetic Particle Imaging for Radiation-Free, Sensitive and High-Contrast Vascular Imaging and Cell Tracking. Curr. Opin. Chem. Biol. 2018, 45, 131–138. [Google Scholar] [CrossRef] [PubMed]
  12. Panagiotopoulos, N.; Vogt, F.; Barkhausen, J.; Buzug, T.M.; Duschka, R.L.; Lüdtke-Buzug, K.; Ahlborg, M.; Bringout, G.; Debbeler, C.; Gräser, M.; et al. Magnetic Particle Imaging: Current Developments and Future Directions. Int. J. Nanomed. 2015, 10, 3097. [Google Scholar] [CrossRef] [Green Version]
  13. Graeser, M.; Thieben, F.; Szwargulski, P.; Werner, F.; Gdaniec, N.; Boberg, M.; Griese, F.; Möddel, M.; Ludewig, P.; van de Ven, D.; et al. Human-Sized Magnetic Particle Imaging for Brain Applications. Nat. Commun. 2019, 10, 1936. [Google Scholar] [CrossRef] [PubMed]
  14. Mason, E.E.; Cooley, C.Z.; Cauley, S.F.; Griswold, M.A.; Conolly, S.M.; Wald, L.L. Design Analysis of an MPI Human Functional Brain Scanner. Int. J. Magn. Part. Imaging 2017, 3, 12. [Google Scholar] [CrossRef]
  15. Thakur, M.L.; Segal, A.W.; Louis, L.; Welch, M.J.; Hopkins, J.; Peters, T.J. Indium-111-Labeled Cellular Blood Components: Mechanism of Labeling and Intracellular Location in Human Neutrophils. J. Nucl. Med. Off. Publ. Soc. Nucl. Med. 1977, 18, 1022–1026. [Google Scholar]
  16. Roca, M.; de Vries, E.F.J.; Jamar, F.; Israel, O.; Signore, A. Guidelines for the Labelling of Leucocytes with 111In-Oxine. Eur. J. Nucl. Med. Mol. Imaging 2010, 37, 835–841. [Google Scholar] [CrossRef] [Green Version]
  17. De Vries, E.F.J.; Roca, M.; Jamar, F.; Israel, O.; Signore, A. Guidelines for the Labelling of Leucocytes with 99mTc-HMPAO. Eur. J. Nucl. Med. Mol. Imaging 2010, 37, 842–848. [Google Scholar] [CrossRef] [Green Version]
  18. Bin Othman, M.F.; Mitry, N.R.; Lewington, V.J.; Blower, P.J.; Terry, S.Y.A. Re-Assessing Gallium-67 as a Therapeutic Radionuclide. Nucl. Med. Biol. 2017, 46, 12–18. [Google Scholar] [CrossRef] [Green Version]
  19. Kassis, A.I.; Adelstein, S.J. Chemotoxicity of Indium-111 Oxine in Mammalian Cells. J. Nucl. Med. Off. Publ. Soc. Nucl. Med. 1985, 26, 187–190. [Google Scholar]
  20. Cherry, S.R.; Jones, T.; Karp, J.S.; Qi, J.; Moses, W.W.; Badawi, R.D. Total-Body PET: Maximizing Sensitivity to Create New Opportunities for Clinical Research and Patient Care. J. Nucl. Med. 2018, 59, 3–12. [Google Scholar] [CrossRef] [Green Version]
  21. Asiedu, K.O.; Ferdousi, M.; Ton, P.T.; Adler, S.S.; Choyke, P.L.; Sato, N. Bone Marrow Cell Homing to Sites of Acute Tibial Fracture: 89Zr-Oxine Cell Labeling with Positron Emission Tomographic Imaging in a Mouse Model. EJNMMI Res. 2018, 8, 109. [Google Scholar] [CrossRef]
  22. Patrick, P.S.; Kolluri, K.K.; Zaw Thin, M.; Edwards, A.; Sage, E.K.; Sanderson, T.; Weil, B.D.; Dickson, J.C.; Lythgoe, M.F.; Lowdell, M.; et al. Lung Delivery of MSCs Expressing Anti-Cancer Protein TRAIL Visualised with 89Zr-Oxine PET-CT. Stem Cell Res. Ther. 2020, 11, 256. [Google Scholar] [CrossRef]
  23. Charoenphun, P.; Meszaros, L.K.; Chuamsaamarkkee, K.; Sharif-Paghaleh, E.; Ballinger, J.R.; Ferris, T.J.; Went, M.J.; Mullen, G.E.D.; Blower, P.J. [89Zr]Oxinate4 for Long-Term in Vivo Cell Tracking by Positron Emission Tomography. Eur. J. Nucl. Med. Mol. Imaging 2015, 42, 278–287. [Google Scholar] [CrossRef] [Green Version]
  24. Davidson-Moncada, J.; Sato, N.; Hoyt, R.F.; Reger, R.N.; Thomas, M.; Clevenger, R.; Metzger, M.E.; Donahue, R.E.; Eclarinal, P.C.; Szajek, L.; et al. A Novel Method to Study the in Vivo Trafficking and Homing of Adoptively Transferred NK Cells in Rhesus Macaques and Humans. Blood 2014, 124, 659. [Google Scholar] [CrossRef]
  25. Keliher, E.J.; Yoo, J.; Nahrendorf, M.; Lewis, J.S.; Marinelli, B.; Newton, A.; Pittet, M.J.; Weissleder, R. 89Zr-Labeled Dextran Nanoparticles Allow in Vivo Macrophage Imaging. Bioconjug. Chem. 2011, 22, 2383–2389. [Google Scholar] [CrossRef] [Green Version]
  26. Patrick, P.S.; Bogart, L.K.; Macdonald, T.J.; Southern, P.; Powell, M.J.; Zaw-Thin, M.; Voelcker, N.H.; Parkin, I.P.; Pankhurst, Q.A.; Lythgoe, M.F.; et al. Surface Radio-Mineralisation Mediates Chelate-Free Radiolabelling of Iron Oxide Nanoparticles. Chem. Sci. 2019, 10, 2592–2597. [Google Scholar] [CrossRef] [Green Version]
  27. Pérez-Medina, C.; Tang, J.; Abdel-Atti, D.; Hogstad, B.; Merad, M.; Fisher, E.A.; Fayad, Z.A.; Lewis, J.S.; Mulder, W.J.M.; Reiner, T. PET Imaging of Tumor-Associated Macrophages with 89Zr-Labeled High-Density Lipoprotein Nanoparticles. J. Nucl. Med. 2015, 56, 1272–1277. [Google Scholar] [CrossRef] [PubMed] [Green Version]
  28. Fairclough, M.; Ellis, B.; Boutin, H.; Jones, A.K.P.; McMahon, A.; Alzabin, S.; Gennari, A.; Prenant, C. Development of a Method for the Preparation of Zirconium-89 Radiolabelled Chitosan Nanoparticles as an Application for Leukocyte Trafficking with Positron Emission Tomography. Appl. Radiat. Isot. 2017, 130, 7–12. [Google Scholar] [CrossRef] [PubMed]
  29. Abou, D.S.; Ku, T.; Smith-Jones, P.M. In Vivo Biodistribution and Accumulation of 89Zr in Mice. Nucl. Med. Biol. 2011, 38, 675–681. [Google Scholar] [CrossRef] [PubMed] [Green Version]
  30. Perrin, J.; Capitao, M.; Mougin-Degraef, M.; Guérard, F.; Faivre-Chauvet, A.; Rbah-Vidal, L.; Gaschet, J.; Guilloux, Y.; Kraeber-Bodéré, F.; Chérel, M.; et al. Cell Tracking in Cancer Immunotherapy. Front. Med. 2020, 7, 34. [Google Scholar] [CrossRef] [PubMed] [Green Version]
  31. Krekorian, M.; Sandker, G.G.W.; Cortenbach, K.R.G.; Tagit, O.; van Riessen, N.K.; Raavé, R.; Srinivas, M.; Figdor, C.G.; Heskamp, S.; Aarntzen, E.H.J.G. Characterization of Intrinsically Radiolabeled Poly(Lactic- Co -Glycolic Acid) Nanoparticles for Ex Vivo Autologous Cell Labeling and in Vivo Tracking. Bioconjug. Chem. 2021, 32, 1802–1811. [Google Scholar] [CrossRef]
  32. Raavé, R.; Sandker, G.; Adumeau, P.; Jacobsen, C.B.; Mangin, F.; Meyer, M.; Moreau, M.; Bernhard, C.; Da Costa, L.; Dubois, A.; et al. Direct Comparison of the in Vitro and in Vivo Stability of DFO, DFO* and DFOcyclo* for 89Zr-ImmunoPET. Eur. J. Nucl. Med. Mol. Imaging 2019, 46, 1966–1977. [Google Scholar] [CrossRef] [Green Version]
  33. Holland, J.P.; Divilov, V.; Bander, N.H.; Smith-Jones, P.M.; Larson, S.M.; Lewis, J.S. 89Zr-DFO-J591 for ImmunoPET of Prostate-Specific Membrane Antigen Expression In Vivo. J. Nucl. Med. 2010, 51, 1293–1300. [Google Scholar] [CrossRef] [Green Version]
  34. Staal, A.H.J.; Becker, K.; Tagit, O.; Koen van Riessen, N.; Koshkina, O.; Veltien, A.; Bouvain, P.; Cortenbach, K.R.G.; Scheenen, T.; Flögel, U.; et al. In Vivo Clearance of 19F MRI Imaging Nanocarriers Is Strongly Influenced by Nanoparticle Ultrastructure. Biomaterials 2020, 261, 120307. [Google Scholar] [CrossRef] [PubMed]
  35. Sato, N.; Wu, H.; Asiedu, K.O.; Szajek, L.P.; Griffiths, G.L.; Choyke, P.L. 89Zr-Oxine Complex PET Cell Imaging in Monitoring Cell-Based Therapies. Radiology 2015, 275, 490–500. [Google Scholar] [CrossRef] [Green Version]
  36. Man, F.; Khan, A.A.; Carrascal-Miniño, A.; Blower, P.J.; de Rosales, R.T. A Kit Formulation for the Preparation of [89Zr]Zr(Oxinate)4 for PET Cell Tracking: White Blood Cell Labelling and Comparison with [111In]In(Oxinate). Nucl. Med. Biol. 2020, 90, 31–40. [Google Scholar] [CrossRef]
  37. Weist, M.R.; Starr, R.; Aguilar, B.; Chea, J.; Miles, J.K.; Poku, E.; Gerdts, E.; Yang, X.; Priceman, S.J.; Forman, S.J.; et al. PET of Adoptively Transferred Chimeric Antigen Receptor T Cells with 89Zr-Oxine. J. Nucl. Med. 2018, 59, 1531–1537. [Google Scholar] [CrossRef] [Green Version]
  38. Liu, Y.; Zhao, X.; Ding, J.; Xing, Y.; Zhou, M.; Wang, X.; Zhu, W.; Huo, L.; Yang, J. Evidence of Accumulated Endothelial Progenitor Cells in the Lungs of Rats with Pulmonary Arterial Hypertension by 89Zr-Oxine PET Imaging. Mol. Ther. Methods Clin. Dev. 2020, 17, 1108–1117. [Google Scholar] [CrossRef]
  39. Bansal, A.; Pandey, M.K.; Demirhan, Y.E.; Nesbitt, J.J.; Crespo-Diaz, R.J.; Terzic, A.; Behfar, A.; DeGrado, T.R. Novel 89Zr Cell Labeling Approach for PET-Based Cell Trafficking Studies. EJNMMI Res. 2015, 5, 19. [Google Scholar] [CrossRef] [Green Version]
  40. Bansal, A.; Pandey, M.K.; Yamada, S.; Goyal, R.; Schmit, N.R.; Jeon, R.; Nesbitt, J.J.; Witt, T.A.; Singh, R.D.; Gunderson, T.M.; et al. [89Zr]Zr-DBN Labeled Cardiopoietic Stem Cells Proficient for Heart Failure. Nucl. Med. Biol. 2020, 90, 23–30. [Google Scholar] [CrossRef]
  41. Sato, N.; Stringaris, K.; Davidson-Moncada, J.K.; Reger, R.; Adler, S.S.; Dunbar, C.; Choyke, P.L.; Childs, R.W. In Vivo Tracking of Adoptively Transferred Natural Killer Cells in Rhesus Macaques Using 89Zirconium-Oxine Cell Labeling and PET Imaging. Clin. Cancer Res. 2020, 26, 2573–2581. [Google Scholar] [CrossRef] [PubMed]
  42. Van Bracht, E.; Versteegden, L.R.M.; Stolle, S.; Verdurmen, W.P.R.; Woestenenk, R.; Raavé, R.; Hafmans, T.; Oosterwijk, E.; Brock, R.; van Kuppevelt, T.H.; et al. Enhanced Cellular Uptake of Albumin-Based Lyophilisomes When Functionalized with Cell-Penetrating Peptide TAT in HeLa Cells. PLoS ONE 2014, 9, e110813. [Google Scholar] [CrossRef] [PubMed] [Green Version]
  43. Cardarelli, F.; Digiacomo, L.; Marchini, C.; Amici, A.; Salomone, F.; Fiume, G.; Rossetta, A.; Gratton, E.; Pozzi, D.; Caracciolo, G. The Intracellular Trafficking Mechanism of Lipofectamine-Based Transfection Reagents and Its Implication for Gene Delivery. Sci. Rep. 2016, 6, 25879. [Google Scholar] [CrossRef] [Green Version]
  44. Silva, S.; Almeida, A.; Vale, N. Combination of Cell-Penetrating Peptides with Nanoparticles for Therapeutic Application: A Review. Biomolecules 2019, 9, 22. [Google Scholar] [CrossRef] [PubMed] [Green Version]
  45. Kim, K.-T.; Lee, J.-Y.; Kim, D.-D.; Yoon, I.-S.; Cho, H.-J. Recent Progress in the Development of Poly(Lactic-Co-Glycolic Acid)-Based Nanostructures for Cancer Imaging and Therapy. Pharmaceutics 2019, 11, 280. [Google Scholar] [CrossRef] [PubMed] [Green Version]
  46. Juan, A.; Cimas, F.J.; Bravo, I.; Pandiella, A.; Ocaña, A.; Alonso-Moreno, C. An Overview of Antibody Conjugated Polymeric Nanoparticles for Breast Cancer Therapy. Pharmaceutics 2020, 12, 802. [Google Scholar] [CrossRef]
  47. Jung, K.O.; Kim, T.J.; Yu, J.H.; Rhee, S.; Zhao, W.; Ha, B.; Red-Horse, K.; Gambhir, S.S.; Pratx, G. Whole-Body Tracking of Single Cells via Positron Emission Tomography. Nat. Biomed. Eng. 2020, 4, 835–844. [Google Scholar] [CrossRef]
  48. Weigelin, B.; den Boer, A.T.; Wagena, E.; Broen, K.; Dolstra, H.; de Boer, R.J.; Figdor, C.G.; Textor, J.; Friedl, P. Cancer Cell Elimination by Cytotoxic T Cell Cooperation and Additive Damage. Immunology 2020. [Google Scholar] [CrossRef] [Green Version]
Figure 1. 89Zr-labeling of NPs and label retention. (A) Labeling efficiency of PLGA and PLGA-NH2 NPs with [89Zr]ZrCl4 (n = 3). (B) 89Zr-labeling of PLGA-NH2 NPs in 0.5 M and pH 5.5 HEPES, MES and NH4Ac labeling buffers (n = 3). (C) 89Zr-retention by PLGA-NH2 NPs was examined in PBS and 100% human serum (100% HS) at 37 °C at 0, 1, 2, 4, 6, 24, 48, 72, 168 and 336 h (n = 3). (D) EDTA concentration range challenge was performed at 37 °C at 0, 1, 2, 4, 6, 24, 48, 72, 168 and 336 h (n = 3). * p = 0.0276, **** p < 0.0001.
Cancers 13 05069 g001
Figure 2. Blood clearance and biodistribution of [89Zr]Zr-PLGA-NH2 NPs. (A) [89Zr]Zr-PLGA-NH2 NPs clearance from blood after intravenously injection in C57BL/6 mice, measured at 0.5, 1, 2, 4, 6, 24, 48, 72, 168 and 336 h (n = 3–6). (B) Organ accumulation of the [89Zr]Zr-PLGA-NH2 NPs at day 3 and day 14 post-injection (n = 3 per group). Abbreviations: %ID/g, % injected dose per gram of organ; LN, lymph node. **** p < 0.0001.
Cancers 13 05069 g002
Figure 3. PET/MRI images of [89Zr]Zr-PLGA-NH2 NPs in C57BL/6 mice. C57BL/6JRj mice were intravenously injected with [89Zr]Zr-PLGA-NH2 NPs and imaged with PET/MRI at 1 h, 4 h, 24 h, 3 days, 7 days and 14 days post-injection. The reference tube contains 10% of the injected 89Zr dose.
Cancers 13 05069 g003
Figure 4. THP-1 labeling and retention of radionuclide over time. The 89Zr-retention by THP-1 cells was measured for 1, 2, 4, 6, 24 and 48 h, at culture conditions; (A) the cells were measured for relative radioactivity after one spin; (B) viable cell numbers counted with trypan blue staining; and (C) the ATP content of cells as a measure with CellTiter-Glo for cell viability. In all experiments, controls are THP-1 cells which were treated in the same way as other conditions without [89Zr]Zr-PLGA-NH2 but with PBS. Moreover, the controls did not change in value over time and therefore were set to 100%, and the remaining samples were compared to the controls. The mean and standard deviation of at least three independent experimental datasets are shown.
Cancers 13 05069 g004
Figure 5. Blood values and biodistribution of [89Zr]Zr-THP-1 cells in BALB/cAnNRj-Foxn1nu/Foxn1nu mice. (A) Blood values of [89Zr]Zr-PLGA-NH2 NPs (n = 4), 10,000 [89Zr]Zr-THP-1 cells (n = 4) and 100,000 [89Zr]Zr-THP-1 cells (n = 4) after subcutaneous injection in BALB/cAnNRj-Foxn1nu/Foxn1nu mice, measured at 0.5, 1, 4 and 24 h post-injection. (B) Matrigel and organ accumulation of the [89Zr]Zr-PLGA-NH2 NPs, 10,000 [89Zr]Zr-THP-1 cells and 100,000 [89Zr]Zr-THP-1 cells in the same mice. Abbreviations: %ID/g, % injected dose per gram of organ; LN, lymph node.
Cancers 13 05069 g005
Figure 6. PET and MRI images of subcutaneous injected [89Zr]Zr-THP-1 cells in BALB/cAnNRj-Foxn1nu/Foxn1nu mice. Mice were subcutaneously injected with Matrigel containing [89Zr]Zr-PLGA-NH2, 10,000 [89Zr]Zr-THP-1 cells or 100,000 [89Zr]Zr-THP-1 cells. PET and MRI scans were performed after 1 and 24 h. The reference tube contains 10% of the injected dose. Brightness (+100 points) and contrast (+70 points) were increased for better visualization, with Adobe Photoshop, in all the images.
Cancers 13 05069 g006
Figure 7. Biodistribution and blood clearance of [89Zr]Zr-THP-1 cells in Staphylococcus aureus (S. aureus) and MDA-MB-231 tumor models. Blood clearance and organs were measured after injection of the ex vivo labeled [89Zr]Zr-THP-1 cells in S. aureus (A,B) and MDA-MB-231 tumor (C,D) BALB/CAnN.Cg-Foxn1nu mice models. Blood was collected at 0.5, 1, 2, 4 and 24 h (n = 3–5). Organs were harvested after 24 h (n = 4–5). Additional information: infected muscle (R), S. aureus + blood (1:1) injected in right hind leg; control muscle, PBS + blood (1:1) injected in left hind leg; muscle foreleg (R), negative control muscle without any injection. Abbreviations: %ID/g, % injected dose per gram of organ; LN, lymph node.
Cancers 13 05069 g007
Figure 8. In vivo PET/MRI tracking of [89Zr]Zr-THP-1 cells in Staphylococcus aureus (S. aureus) and MDA-MB-231 tumor models. S. aureus or MDA-MB-231 tumor cells were injected intramuscular or subcutaneously injected in BALB/CAnN.Cg-Foxn1nu mice, respectively. Subsequently, ex vivo 89Zr-labeled THP-1 cells ([89Zr]Zr-THP-1, 5–5.8 × 10⁶ cells/mouse) were injected intravenously and followed with PET/MRI for 24 h.
Cancers 13 05069 g008
Table 1. Characterization of PLGA-NH2 and Zr-PLGA-NH2 NPs: size (n = 3), PDI (n = 3) and zeta potential (n = 3).
SampleDiameter (nm)Polydispersity (PDI)Zeta Potential (mV)
PLGA-NH2189 ± 1.90.07−2.3 ± 0.9
Zr-PLGA-NH2196 ± 4.10.07−0.3 ± 0.4
Publisher’s Note: MDPI stays neutral with regard to jurisdictional claims in published maps and institutional affiliations.

