
A Novel Prognostic Biomarker Panel for Early-Stage Colon Carcinoma

 , , ,
, , ,
Abstract
:Simple Summary
Abstract

1. Introduction
2. Materials and Methods
2.1. Immunohistochemical Assessment and Scoring
2.2. Statistical Analysis
3. Results
3.1. Study Variable Assessment
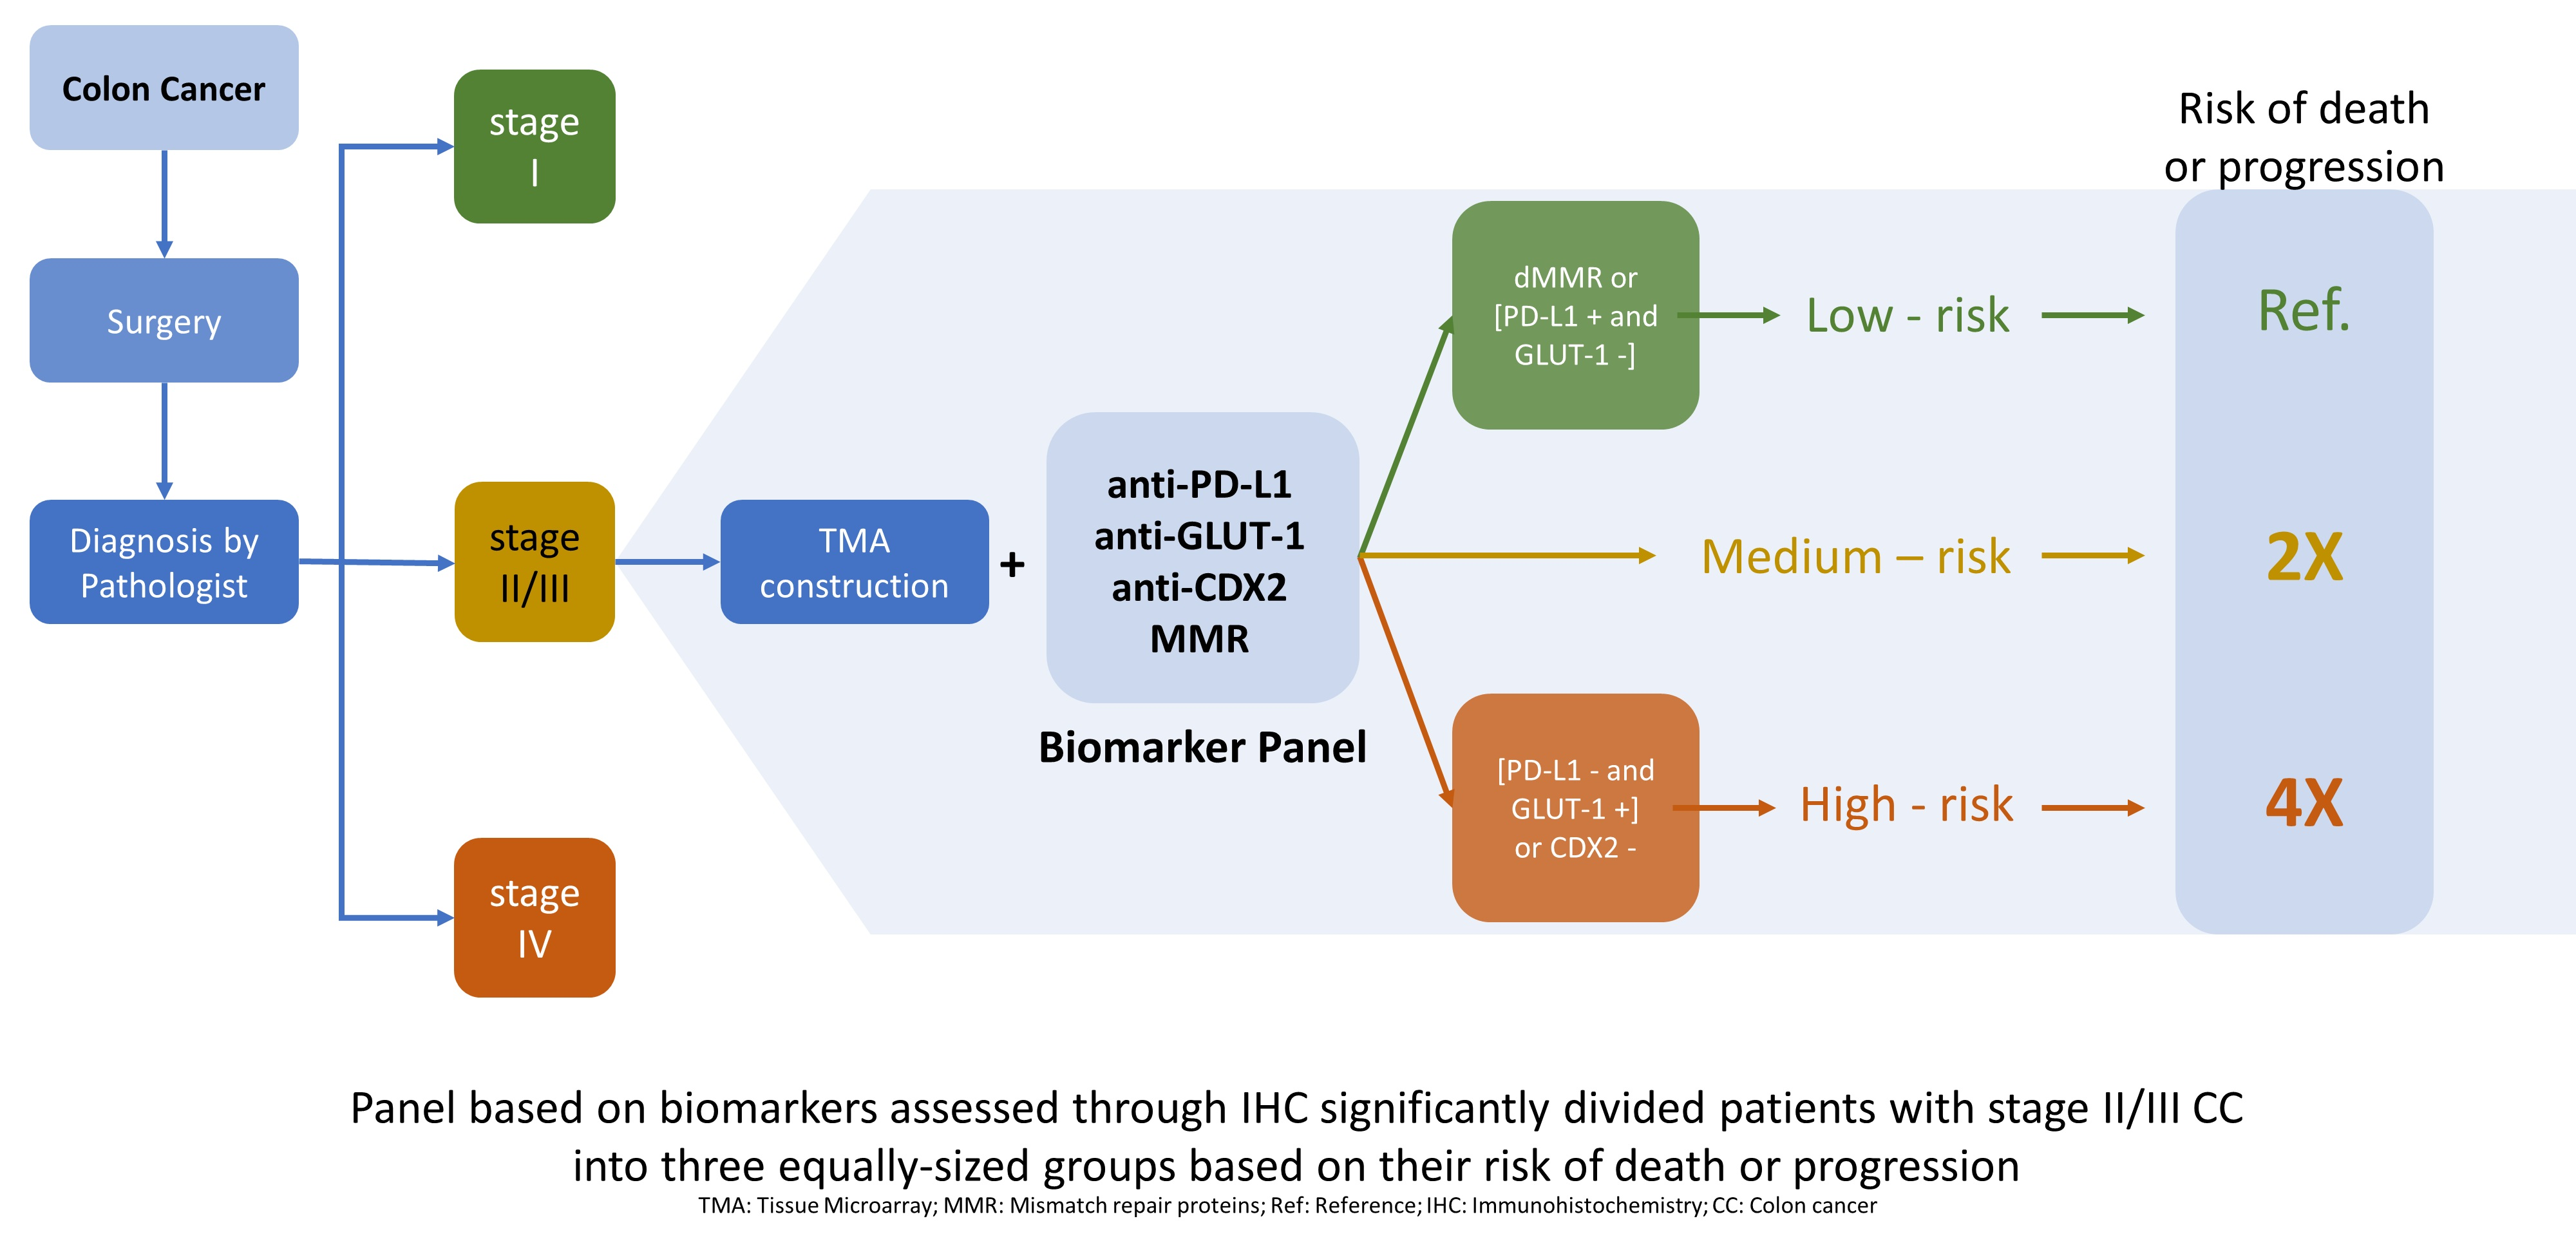
3.2. Biomarker Panel and Risk Category Definition
3.3. Assessing the Prognositic Capabilities of the Biomarker Panel
4. Discussion
5. Conclusions
Supplementary Materials
Author Contributions
Funding
Institutional Review Board Statement
Informed Consent Statement
Data Availability Statement
Acknowledgments
Conflicts of Interest
References
- Bray, F.; Ferlay, J.; Soerjomataram, I.; Siegel, R.L.; Torre, L.A.; Jemal, A. Global cancer statistics 2018: GLOBOCAN estimates of incidence and mortality worldwide for 36 cancers in 185 countries. CA Cancer J. Clin. 2018, 68, 394–424. [Google Scholar] [CrossRef] [Green Version]
- Siegel, R.L.; Miller, K.D.; Jemal, A. Cancer statistics, 2020. CA A Cancer J Clin. 2020, 70, 7–30. [Google Scholar] [CrossRef] [PubMed]
- Verkuijl, S.J.; Jonker, J.E.; Trzpis, M.; Burgerhof, J.G.; Broens, P.M.; Furnée, E.J. Functional outcomes of surgery for colon cancer: A systematic review and meta-analysis. Eur. J. Surg. Oncol. (EJSO) 2020, 47, 960–969. [Google Scholar] [CrossRef] [PubMed]
- National Comprehensive Cancer Network (NCCN). NCCN Clinical Practice Guidelines in Oncology. Colon Cancer Version 2.2021 [Internet]. 2021. Available online: https://www.nccn.org/professionals/physician_gls/pdf/colon.pdf (accessed on 29 May 2021).
- Zhao, B.; Wang, L.; Qiu, H.; Zhang, M.; Sun, L.; Peng, P.; Yu, Q.; Yuan, X. Mechanisms of resistance to anti-EGFR therapy in colorectal cancer. Oncotarget 2017, 17, 3980–4000. [Google Scholar] [CrossRef] [PubMed] [Green Version]
- Misale, S.; Di Nicolantonio, F.; Sartore-Bianchi, A.; Siena, S.; Bardelli, A. Resistance to Anti-EGFR Therapy in Colorectal Cancer: From Heterogeneity to Convergent Evolution. Cancer Discov. 2014, 4, 1269–1280. [Google Scholar] [CrossRef] [Green Version]
- Argilés, G.; Tabernero, J.; Labianca, R.; Hochhauser, D.; Salazar, R.; Iveson, T.; Laurent-Puig, P.; Quirke, P.; Yoshino, T.; Taieb, J.; et al. Localised colon cancer: ESMO Clinical Practice Guidelines for diagnosis, treatment and follow-up. Ann. Oncol. 2020, 31, 1291–1305. [Google Scholar] [CrossRef]
- Andre, T.; Shiu, K.-K.; Kim, T.W.; Jensen, B.V.; Jensen, L.H.; Punt, C.J.A.; Smith, D.M.; Garcia-Carbonero, R.; Benavides, M.; Gibbs, P.; et al. Pembrolizumab versus chemotherapy for microsatellite instability-high/mismatch repair deficient metastatic colorectal cancer: The phase 3 KEYNOTE-177 Study. J. Clin. Oncol. 2020, 38, LBA4. [Google Scholar] [CrossRef]
- Sjöblom, T.; Jones, S.; Wood, L.D.; Parsons, D.W.; Lin, J.; Barber, T.D.; Mandelker, D.; Leary, R.J.; Ptak, J.; Silliman, N.; et al. The consensus coding sequences of human breast and colorectal cancers. Science 2006, 314, 268–274. [Google Scholar] [CrossRef] [PubMed]
- Jass, J.R. Classification of colorectal cancer based on correlation of clinical, morphological and molecular features. Histopathology 2007, 50, 113–130. [Google Scholar] [CrossRef]
- Ogino, S.; Goel, A. Molecular Classification and Correlates in Colorectal Cancer. J. Mol. Diagn. 2008, 10, 13–27. [Google Scholar] [CrossRef] [Green Version]
- Roepman, P.; Schlicker, A.; Tabernero, J.; Majewski, I.; Tian, S.; Moreno, V.; Snel, M.H.; Chresta, C.M.; Rosenberg, R.; Nitsche, U.; et al. Colorectal cancer intrinsic subtypes predict chemotherapy benefit, deficient mismatch repair and epithelial-to-mesenchymal transition. Int. J. Cancer 2014, 134, 552–562. [Google Scholar] [CrossRef] [PubMed]
- Guinney, J.; Dienstmann, R.; Wang, X.; de Reyniès, A.; Schlicker, A.; Soneson, C.; Marisa, L.; Roepman, P.; Nyamundanda, G.; Angelino, P.; et al. The consensus molecular sub-types of colorectal cancer. Nat. Med. 2015, 21, 1350–1356. [Google Scholar] [CrossRef] [PubMed]
- Singh, M.P.; Rai, S.; Pandey, A.; Singh, N.K.; Srivastava, S. Molecular subtypes of colorectal cancer: An emerging therapeutic opportunity for personalized medicine. Genes Dis. 2019, 8, 133–145. [Google Scholar] [CrossRef] [PubMed]
- Inamura, K. Colorectal Cancers: An Update on Their Molecular Pathology. Cancers 2018, 10, 26. [Google Scholar] [CrossRef] [Green Version]
- Pilati, C.; Taieb, J.; Balogoun, R.; Marisa, L.; de Reyniès, A.; Laurent-Puig, P. CDX2 prognostic value in stage II/III resected colon cancer is related to CMS classification. Ann. Oncol. 2017, 28, 1032–1035. [Google Scholar] [CrossRef]
- De Sousa EMelo, F.; Wang, X.; Jansen, M.; Fessler, E.; Trinh, A.; de Rooij, L.P.M.H.; de Jong, J.H.; de Boer, O.J.; van Leersum, R.; Bijlsma, M.F.; et al. Poor-prognosis colon cancer is defined by a molecularly distinct subtype and develops from serrated precursor lesions. Nat. Med. 2013, 19, 614–618. [Google Scholar] [CrossRef]
- Fontana, E.; Eason, K.; Cervantes, A.; Salazar, R.; Sadanandam, A. Context matters—Consensus molecular subtypes of colorectal cancer as biomarkers for clinical trials. Ann. Oncol. 2019, 30, 520–527. [Google Scholar] [CrossRef]
- Song, N.; Pogue-Geile, K.L.; Gavin, P.G.; Yothers, G.; Kim, S.R.; Johnson, N.L.; Lipchik, C.; Allegra, C.J.; Petrelli, N.J.; O’Connell, M.J.; et al. Clinical Outcome From Oxaliplatin Treatment in Stage II/III Colon Cancer According to Intrinsic Subtypes: Secondary Analysis of NSABP C-07/NRG Oncology Randomized Clinical Trial. JAMA Oncol. 2016, 2, 1162–1169. [Google Scholar] [CrossRef]
- Azcue, P.; Mercado Gutierrez, M.; Galbete, A.; Suarez Alecha, J.; Gomez-Dorronsoro, M.L.; Guerrero Setas, D. In Search of an Immunohistochemical Classification of Early Stage Colon Adenocarcinomas, Results of a Tertiary Hospital. In Proceedings of the 32nd Congress of the ESP and XXXIII International Congress of the IAP, Glasgow, UK, 5–9 December 2020; pp. 1–390. [Google Scholar]
- Chen, S.; Crabill, G.A.; Pritchard, T.S.; McMiller, T.L.; Wei, P.; Pardoll, D.M.; Pan, F.; Topalian, S.L. Mechanisms regulating PD-L1 expression on tumor and immune cells. J. Immunother. Cancer 2019, 7, 305. [Google Scholar] [CrossRef]
- Ruan, Z.; Liang, M.; Lai, M.; Shang, L.; Deng, X.; Su, X. KYA1797K down-regulates PD-L1 in colon cancer stem cells to block immune evasion by suppressing the β-catenin/STT3 signaling pathway. Int. Immunopharmacol. 2019, 78, 106003. [Google Scholar] [CrossRef]
- Shen, Z.; Gu, L.; Mao, D.; Chen, M.; Jin, R. Clinicopathological and prognostic significance of PD-L1 expression in colorectal cancer: A systematic review and meta-analysis. World J. Surg. Oncol. 2019, 17, 1–9. [Google Scholar] [CrossRef] [PubMed] [Green Version]
- Duan, J.; Liu, X.; Chen, H.; Sun, Y.; Liu, Y.; Bai, H.; Wang, J. Impact of PD-L1, transforming growth factor-β expression and tumor-infiltrating CD8 + T cells on clinical outcome of patients with advanced thymic epithelial tumors: PD-L1, TGF-β, and CD8 + TILs in TETs. Thorac. Cancer. 2018, 9, 1341–1353. [Google Scholar] [CrossRef] [PubMed]
- Lind, H.; Gameiro, S.R.; Jochems, C.; Donahue, R.N.; Strauss, J.; Gulley, J.L.; Palena, C.; Schlom, J. Dual targeting of TGF-β and PD-L1 via a bifunctional anti-PD-L1/TGF-βRII agent: Status of preclinical and clinical advances. J. Immunother. Cancer 2020, 8, e000433. [Google Scholar] [CrossRef] [Green Version]
- Yi, M.; Zhang, J.; Li, A.; Niu, M.; Yan, Y.; Jiao, Y.; Luo, S.; Zhou, P.; Wu, K. The construction, expression, and enhanced anti-tumor activity of YM101: A bispecific antibody simultaneously targeting TGF-β and PD-L1. J. Hematol. Oncol. 2021, 14, 27. [Google Scholar] [CrossRef] [PubMed]
- Younes, M.; Lechago, L.V.; Somoano, J.R.; Mosharaf, M.; Lechago, J. Wide Expression of the Human Erythrocyte Glucose Transporter Gluti in Human Cancers. Cancer Res. 1996, 56, 1164–1167. [Google Scholar] [PubMed]
- Carvalho, K.C.; Cunha, I.W.; Rocha, R.M.; Ayala, F.R.; Cajaíba, M.M.; Begnami, M.D.; Vilela, R.S.; Paiva, G.R.; Andrade, R.G.; Soares, F.A. GLUT1 expression in malignant tumors and its use as an immunodiagnostic marker. Clinics 2011, 66, 965–972. [Google Scholar] [CrossRef] [Green Version]
- Bai, J.; Xu, J.; Zhao, J.; Zhang, R. Downregulation of lncRNA AWPPH inhibits colon cancer cell proliferation by downregulating GLUT-1. Oncol. Lett. 2019, 18, 2007–2012. [Google Scholar] [CrossRef] [PubMed] [Green Version]
- Haber, R.S.; Rathan, A.; Weiser, K.R.; Pritsker, A.; Itzkowitz, S.H.; Bodian, C.; Slater, G.; Weiss, A.; Burstein, D.E. GLUT1 glucose transporter expression in colorectal carcinoma. Cancer 1998, 83, 34–40. [Google Scholar] [CrossRef]
- Sakashita, M.; Aoyama, N.; Minami, R.; Maekawa, S.; Kuroda, K.; Shirasaka, D.; Ichihara, T.; Kuroda, Y.; Maeda, S.; Kasuga, M. Glut1 expression in T1 and T2 stage colorectal carcinomas: Its relationship to clinicopathological features. Eur. J. Cancer 2001, 37, 204–209. [Google Scholar] [CrossRef]
- Gumbiner, B.M. Cell Adhesion: The Molecular Basis of Tissue Architecture and Morphogenesis. Cell 1996, 84, 345–357. [Google Scholar] [CrossRef] [Green Version]
- Christou, N.; Perraud, A.; Blondy, S.; Jauberteau, M.-O.; Battu, S.; Mathonnet, M. E-cadherin: A potential biomarker of colorectal cancer prognosis. Oncol. Lett. 2017, 13, 4571–4576. [Google Scholar] [CrossRef] [PubMed] [Green Version]
- Pal, I.; Rajesh, Y.; Banik, P.; Dey, G.; Dey, K.K.; Bharti, R.; Naskar, D.; Chakraborty, S.; Ghosh, S.K.; Das, S.K.; et al. Prevention of epithelial to mesenchymal transition in colorectal carcinoma by regulation of the E-cadherin-β-catenin-vinculin axis. Cancer Lett. 2019, 452, 254–263. [Google Scholar] [CrossRef] [PubMed]
- Kim, J.H.; Kim, C.N.; Kang, D.W. Squalene Epoxidase Correlates E-Cadherin Expression and Overall Survival in Colorectal Cancer Patients: The Impact on Prognosis and Correlation to Clinicopathologic Features. J. Clin. Med. 2019, 8, 632. [Google Scholar] [CrossRef] [PubMed] [Green Version]
- Wilmanns, C.; Grossmann, J.; Steinhauer, S.; Manthey, G.; Weinhold, B.; Schmitt-Gräff, A.; Von Specht, B.-U. Soluble serum E-cadherin as a marker of tumour progression in colorectal cancer patients. Clin. Exp. Metastasis 2004, 21, 75–78. [Google Scholar] [CrossRef] [PubMed]
- Okugawa, Y.; Toiyama, Y.; Inoue, Y.; Iwata, T.; Fujikawa, H.; Saigusa, S.; Konishi, N.; Tanaka, K.; Uchida, K.; Kusunoki, M. Clinical Significance of Serum Soluble E-cadherin in Colorectal Carcinoma. J. Surg. Res. 2012, 175, e67–e73. [Google Scholar] [CrossRef] [PubMed]
- Thievessen, I.; Seifert, H.-H.; Swiatkowski, S.; Florl, A.R.; Schulz, W.A. E-cadherin involved in inactivation of WNT/β-catenin signalling in urothelial carcinoma and normal urothelial cells. Br. J. Cancer 2003, 88, 1932–1938. [Google Scholar] [CrossRef] [PubMed] [Green Version]
- Toribara, N.W.; Gum, J.R.; Culhane, P.J.; Lagace, R.E.; Hicks, J.W.; Petersen, G.M.; Kim, Y.S. MUC-2 human small intestinal mucin gene structure. Repeated arrays and polymorphism. J. Clin. Investig. 1991, 88, 1005–1013. [Google Scholar] [CrossRef] [PubMed] [Green Version]
- Lasota, J.; Chłopek, M.; Lamoureux, J.; Christiansen, J.; Kowalik, A.; Wasąg, B.; Felisiak-Gołąbek, A.; Agaimy, A.; Biernat, W.; Canzonieri, V.; et al. Colonic Adenocarcinomas Harboring NTRK Fusion Genes: A Clinicopathologic and Molecular Genetic Study of 16 Cases and Review of the Literature. Am. J. Surg. Pathol. 2020, 44, 162–173. [Google Scholar] [CrossRef] [PubMed]
- Kasprzak, A.; Siodła, E.; Andrzejewska, M.; Szmeja, J.; Seraszek-Jaros, A.; Cofta, S.; Szaflarski, W. Differential expression of mucin 1 and mucin 2 in colorectal cancer. World J. Gastroenterol. 2018, 24, 4164–4177. [Google Scholar] [CrossRef]
- Elzagheid, A.; Emaetig, F.; Buhmeida, A.; Laato, M.; El-Faitori, O.; Syrjänen, K.; Collan, Y.; Pyrhönen, S. Loss of MUC2 expression predicts disease recurrence and poor outcome in colorectal carcinoma. Tumor Biol. 2013, 34, 621–628. [Google Scholar] [CrossRef]
- Kang, H.; Min, B.S.; Lee, K.Y.; Kim, N.K.; Kim, S.N.; Choi, J.; Kim, H. Loss of E-cadherin and MUC2 Expressions Correlated with Poor Survival in Patients with Stages II and III Colorectal Carcinoma. Ann. Surg. Oncol. 2010, 18, 711–719. [Google Scholar] [CrossRef] [PubMed]
- Cecchini, M.J.; Walsh, J.C.; Parfitt, J.; Chakrabarti, S.; Correa, R.J.; MacKenzie, M.J.; Driman, D.K. CDX2 and Muc2 immuno-histochemistry as prognostic markers in stage II colon cancer. Hum. Pathol. 2019, 90, 70–79. [Google Scholar] [CrossRef] [PubMed]
- Wang, H.; Jin, S.; Lu, H.; Mi, S.; Shao, W.; Zuo, X.; Yin, H.; Zeng, S.; Shimamoto, F.; Qi, G. Expression of surviving, MUC2 and MUC5 in colorectal cancer and their association with clinicopathological characteristics. Oncol. Lett. 2017, 14, 1011–1016. [Google Scholar] [CrossRef] [Green Version]
- Li, C.; Zuo, D.; Yin, L.; Lin, Y.; Li, C.; Liu, T.; Wang, L. Prognostic Value of MUC2 Expression in Colorectal Cancer: A Systematic Review and Meta-Analysis. Gastroenterol. Res. Pract. 2018, 2018, 1–12. [Google Scholar] [CrossRef] [Green Version]
- Werling, R.W.; Yaziji, H.; Bacchi, C.E.; Gown, A.M. CDX2, a Highly Sensitive and Specific Marker of Adenocarcinomas of Intestinal Origin: An Immunohistochemical Survey of 476 Primary and Metastatic Carcinomas. Am. J. Surg. Pathol. 2003, 27, 303–310. [Google Scholar] [CrossRef] [PubMed]
- Zhang, B.Y.; Jones, J.C.; Briggler, A.M.; Hubbard, J.M.; Kipp, B.R.; Sargent, D.J.; Dixon, J.G.; Grothey, A. Lack of Caudal-Type Homeobox Transcription Factor 2 Expression as a Prognostic Biomarker in Metastatic Colorectal Cancer. Clin. Color. Cancer 2016, 16, 124–128. [Google Scholar] [CrossRef]
- Olsen, J.; Eiholm, S.; Kirkeby, L.; Espersen, M.; Jess, P.; Gögenür, I.; Troelsen, J. CDX2 downregulation is associated with poor differentiation and MMR deficiency in colon cancer. Exp. Mol. Pathol. 2016, 100, 59–66. [Google Scholar] [CrossRef]
- Bruun, J.; Sveen, A.; Barros, R.; Eide, P.W.; Eilertsen, I.; Kolberg, M.; Pellinen, T.; David, L.; Svindland, A.; Kallioniemi, O.; et al. Prognostic, predictive, and pharmacogenomic assessments of CDX2 refine stratification of colorectal cancer. Mol. Oncol. 2018, 12, 1639–1655. [Google Scholar] [CrossRef] [PubMed]
- Bae, J.M.; Lee, T.H.; Cho, N.-Y.; Kim, T.-Y.; Kang, G.H. Loss of CDX2 expression is associated with poor prognosis in colorectal cancer patients. World J. Gastroenterol. 2015, 21, 1457–1467. [Google Scholar] [CrossRef]
- Dalerba, P.; Sahoo, D.; Paik, S.; Guo, X.; Yothers, G.; Song, N.; Wilcox-Fogel, N.; Forgó, E.; Rajendran, P.S.; Miranda, S.P.; et al. CDX2 as a Prognostic Biomarker in Stage II and Stage III Colon Cancer. N. Engl. J. Med. 2016, 374, 211–222. [Google Scholar] [CrossRef]
- Slik, K.; Turkki, R.; Carpén, O.; Kurki, S.; Korkeila, E.; Sundström, J.; Pellinen, T. CDX2 Loss With Microsatellite Stable Phe-notype Predicts Poor Clinical Outcome in Stage II Colorectal Carcinoma. Am. J. Surg. Pathol. 2019, 43, 1473–1482. [Google Scholar] [CrossRef] [PubMed]
- Azcue, P.; Encío, I.; Setas, D.G.; Alecha, J.S.; Galbete, A.; Mercado, M.; Vera, R.; Gomez-Dorronsoro, M. PD-L1 as a Prognostic Factor in Early-Stage Colon Carcinoma within the Immunohistochemical Molecular Subtype Classification. Cancers 2021, 13, 1943. [Google Scholar] [CrossRef] [PubMed]
- Sobin, L.H.; Gospodarowicz, M.K.; Wittekind, C. TNM Classification of Malignant Tumours, 7th ed.; Wiley-Blackwell: Somerset, UK, 2011; 336p. [Google Scholar]
- Cooper, R.; Sarioğlu, S.; Sökmen, S.; Füzün, M.; Küpelioğlu, A.; Valentine, H.; Görken, I.B.; Airley, R.; West, C. Glucose transporter-1 (GLUT-1): A potential marker of prognosis in rectal carcinoma? Br. J. Cancer 2003, 89, 870–876. [Google Scholar] [CrossRef] [PubMed] [Green Version]
- Jun, Y.J.; Jang, S.M.; Han, H.L.; Lee, K.H.; Jang, K.-S.; Paik, S.S. Clinicopathologic significance of GLUT1 expression and its correlation with Apaf-1 in colorectal adenocarcinomas. World J. Gastroenterol. 2011, 17, 1866–1873. [Google Scholar] [CrossRef]
- Madunić, I.V.; Madunić, J.; Breljak, D.; Karaica, D.; Sabolić, I. Sodium-glucose cotransporters: New targets of cancer therapy? Arch. Ind. Hyg. Toxicol. 2018, 69, 278–285. [Google Scholar] [CrossRef] [Green Version]
- Airley, R.; Evans, A.; Mobasheri, A.; Hewitt, S. Glucose transporter Glut-1 is detectable in peri-necrotic regions in many human tumor types but not normal tissues: Study using tissue microarrays. Ann. Anat. Anat. Anz. 2010, 192, 133–138. [Google Scholar] [CrossRef] [PubMed]
- Yang, J.; Wen, J.; Tian, T.; Lu, Z.; Wang, Y.; Wang, Z. GLUT-1 overexpression as an unfavorable prognostic biomarker in patients with colorectal cancer. Oncotarget. 2017, 8, p. 11788. Available online: http://www.oncotarget.com/fulltext/14352 (accessed on 5 March 2021).
- Yu, M.; Chen, S.; Hong, W.; Gu, Y.; Huang, B.; Lin, Y.; Zhou, Y.; Jin, H.; Deng, Y.; Tu, L.; et al. Prognostic role of glycolysis for cancer outcome: Evidence from 86 studies. J. Cancer Res. Clin. Oncol. 2019, 145, 967–999. [Google Scholar] [CrossRef]
- Jurčić, P.; Radulović, P.; Balja, M.P.; Milosevic, M.; Krušlin, B. E-cadherin and NEDD9 expression in primary colorectal cancer, metastatic lymph nodes and liver metastases. Oncol. Lett. 2019, 17, 2881–2889. [Google Scholar] [CrossRef] [Green Version]
- Kesari, M.V.; Gaopande, V.L.; Joshi, A.R.; Babanagare, S.V.; Gogate, B.P.; Khadilkar, A.V. Immunohistochemical study of MUC1, MUC2 and MUC5AC in colorectal carcinoma and review of literature. Indian J. Gastroenterol. 2015, 34, 63–67. [Google Scholar] [CrossRef]
- Betge, J.; Schneider, N.I.; Harbaum, L.; Pollheimer, M.J.; Lindtner, R.A.; Kornprat, P.; Ebert, M.P.; Langner, C. MUC1, MUC2, MUC5AC, and MUC6 in colorectal cancer: Expression profiles and clinical significance. Virchows Arch. 2016, 469, 255–265. [Google Scholar] [CrossRef] [Green Version]
- Al-Maghrabi, J.; Sultana, S.; Gomaa, W. Low expression of MUC2 is associated with longer disease-free survival in patients with colorectal carcinoma. Saudi J. Gastroenterol. 2019, 25, 61–66. [Google Scholar] [CrossRef] [PubMed]
- Imai, Y.; Yamagishi, H.; Fukuda, K.; Ono, Y.; Inoue, T.; Ueda, Y. Differential mucin phenotypes and their significance in a variation of colorectal carcinoma. World J. Gastroenterol. 2013, 19, 3957–3968. [Google Scholar] [CrossRef] [PubMed]
- Grainger, S.; Savory, J.G.; Lohnes, D. Cdx2 regulates patterning of the intestinal epithelium. Dev. Biol. 2010, 339, 155–165. [Google Scholar] [CrossRef] [PubMed] [Green Version]
- Hansen, T.; Kjær-Frifeldt, S.; Eriksen, A.C.; Lindebjerg, J.; Jensen, L.H.; Sørensen, F.B.; Jakobsen, A. Prognostic impact of CDX2 in stage II colon cancer: Results from two nationwide cohorts. Br. J. Cancer 2018, 119, 1367–1373. [Google Scholar] [CrossRef] [Green Version]
- Tomasello, G.; Barni, S.; Turati, L.; Ghidini, M.; Pezzica, E.; Passalacqua, R.; Petrelli, F. Association of CDX2 Expression With Survival in Early Colorectal Cancer: A Systematic Review and Meta-analysis. Clin. Colorectal Cancer 2018, 17, 97–103. [Google Scholar] [CrossRef] [PubMed]
- Berger, M.D.; Yang, D.; Sunakawa, Y.; Zhang, W.; Ning, Y.; Matsusaka, S.; Okazaki, S.; Miyamoto, Y.; Suenaga, M.; Schirripa, M.; et al. Impact of sex, age, and ethnicity/race on the survival of patients with rectal cancer in the United States from 1988 to 2012. Oncotarget 2016, 7, 53668–53678. [Google Scholar] [CrossRef] [Green Version]
- Salem, M.E.; Yin, J.; Weinberg, B.A.; Renfro, L.A.; Pederson, L.D.; Maughan, T.S.; Adams, R.; Van Cutsem, E.; Falcone, A.; Tebbutt, N.C.; et al. Clinicopathological differences and survival outcomes with first-line therapy in patients with left-sided colon cancer and rectal cancer: Pooled analysis of 2879 patients from AGITG (MAX), COIN, FOCUS2, OPUS, CRYSTAL and COIN-B trials in the ARCAD database. Eur. J. Cancer 2018, 103, 205–213. [Google Scholar] [CrossRef] [PubMed]
- Tamas, K.; Walenkamp, A.M.E.; de Vries, E.G.E.; van Vugt, M.A.T.M.; Beets-Tan, R.G.; van Etten, B.; de Groota, D.J.A.; Hospersa, G.A.P. Rectal and colon cancer: Not just a different anatomic site. Cancer Treat. Rev. 2015, 41, 671–679. [Google Scholar] [CrossRef] [PubMed]
- Wyss, J.; Dislich, B.; Koelzer, V.H.; Galván, J.A.; Dawson, H.; Hädrich, M.; Inderbitzin, D.; Lugli, A.; Zlobec, I.; Berger, M.D. Stromal PD-1/PD-L1 Expression Predicts Outcome in Colon Cancer Patients. Clin. Colorectal Cancer 2019, 18, e20–e38. [Google Scholar] [CrossRef] [PubMed]
- Van der Sijp, M.P.L.; Bastiaannet, E.; Mesker, W.E.; van der Geest, L.G.M.; Breugom, A.J.; Steup, W.H. Differences between colon and rectal cancer in complications, short-term survival and recurrences. Int. J. Colorectal Dis. 2016, 31, 1683–1691. [Google Scholar] [CrossRef] [PubMed] [Green Version]
- Picard, E.; Verschoor, C.P.; Ma, G.W.; Pawelec, G. Relationships between Immune Landscapes, Genetic Subtypes and Responses to Immunotherapy in Colorectal Cancer. Front. Immunol. 2020, 11, 369. [Google Scholar] [CrossRef]
- Sun, B.L. Current Microsatellite Instability Testing in Management of Colorectal Cancer. Clin. Colorectal Cancer 2020, 20, e12–e20. [Google Scholar] [CrossRef]
- Thomas, J.; Leal, A.; Overman, M.J. Clinical Development of Immunotherapy for Deficient Mismatch Repair Colorectal Cancer. Clin. Colorectal Cancer 2020, 19, 73–81. [Google Scholar] [CrossRef] [PubMed]
- De Smedt, L.; Lemahieu, J.; Palmans, S.; Govaere, O.; Tousseyn, T.; Van Cutsem, E.; Prenen, H.; Tejpar, S.; Spaepen, M.; Matthijs, G.; et al. Microsatellite instable vs stable colon carcinomas: Analysis of tumour heterogeneity, inflammation and angiogenesis. Br. J. Cancer 2015, 113, 500–509. [Google Scholar] [CrossRef] [PubMed] [Green Version]
- Airley, R.E.; Mobasheri, A. Hypoxic Regulation of Glucose Transport, Anaerobic Metabolism and Angiogenesis in Cancer: Novel Pathways and Targets for Anticancer Therapeutics. Chemotherapy 2007, 53, 233–256. [Google Scholar] [CrossRef] [PubMed]
- Dienstmann, R.; Vermeulen, L.; Guinney, J.; Kopetz, S.; Tejpar, S.; Tabernero, J. Consensus molecular subtypes and the evolution of precision medicine in colorectal cancer. Nat. Rev. Cancer 2017, 17, 79–92. [Google Scholar] [CrossRef]
- Najdi, R.; Holcombe, R.F.; Waterman, M.L. Wnt signaling and colon carcinogenesis: Beyond APC. J. Carcinog. 2011, 10, 5. [Google Scholar] [CrossRef]
- Juanes, M.A. Cytoskeletal Control and Wnt Signaling—APC’s Dual Contributions in Stem Cell Division and Colorectal Cancer. Cancers 2020, 12, 3811. [Google Scholar] [CrossRef]
- Perrais, M.; Pigny, P.; Copin, M.-C.; Aubert, J.-P.; Van Seuningen, I. Induction of MUC2 and MUC5AC Mucins by Factors of the Epidermal Growth Factor (EGF) Family Is Mediated by EGF Receptor/Ras/Raf/Extracellular Signal-regulated Kinase Cascade and Sp1. J. Biol. Chem. 2002, 277, 32258–32267. [Google Scholar] [CrossRef] [Green Version]
- Nishiuchi, A.; Hisamori, S.; Sakaguchi, M.; Fukuyama, K.; Hoshino, N.; Itatani, Y.; Honma, S.; Maekawa, H.; Nishigori, T.; Tsunoda, S.; et al. MicroRNA-9-5p-CDX2 Axis: A Useful Prognostic Biomarker for Patients with Stage II/III Colorectal Cancer. Cancers 2019, 11, 1891. [Google Scholar] [CrossRef] [Green Version]
- Baba, Y.; Nosho, K.; Shima, K.; Freed, E.; Irahara, N.; Philips, J. Relationship of CDX2 Loss with Molecular Features and Prognosis in Colorectal Cancer. Clin. Cancer Res. 2009, 15, 4665–4673. [Google Scholar] [CrossRef] [Green Version]
- Dae Hong, K.; Lee, D.; Lee, Y.; Lee, S.I.; Moon, H.Y. Reduced CDX2 Expression Predicts Poor Overall Survival in Patients with Colorectal Cancer. Am. Surgeon. 2013, 79, 353–360. [Google Scholar] [CrossRef]
- Trinh, A.; Trumpi, K.; De Sousa EMelo, F.; Wang, X.; de Jong, J.H.; Fessler, E. Practical and Robust Identification of Molecular Subtypes in Colorectal Cancer by Immunohistochemistry. Clin. Cancer Res. 2017, 23, 387–398. [Google Scholar] [CrossRef] [PubMed] [Green Version]
- Purcell, R.V.; Schmeier, S.; Lau, Y.C.; Pearson, J.F.; Frizelle, F.A. Molecular subtyping improves prognostication of Stage 2 colorectal cancer. BMC Cancer 2019, 19, 1–9. [Google Scholar] [CrossRef] [PubMed] [Green Version]
- Chalabi, M.; Fanchi, L.; Berg, J.V.D.; Beets, G.; Lopez-Yurda, M.; Aalbers, A.; Grootscholten, C.; Snaebjornsson, P.; Maas, M.; Mertz, M.; et al. Neoadjuvant ipilimumab plus nivolumab in early stage colon cancer. Ann. Oncol. 2018, 29, viii731. [Google Scholar] [CrossRef]


| Characteristics | N (%) n = 144 |
|---|---|
| Age * (years) | 72.2 (9.6) |
| Range | 48–93 |
| Gender | |
| Female | 46 (31.9) |
| Male | 98 (68.1) |
| Localization | |
| Left | 65 (45.1) |
| Right | 79 (54.9) |
| Differentiation grade | |
| <50% | 26 (18.1) |
| ≥50% | 118 (81.9) |
| Lymph node ratio | |
| Mean * (SD) | 6.7 (12.1) |
| Histologic type | |
| Colloid | 18 (12.5) |
| Adenocarcinoma NOS | 125 (86.8) |
| Signet ring cell carcinoma | 1 (0.7) |
| TNM Stage | |
| II | 80 (55.6) |
| III | 64 (44.4) |
| CMS | |
| CMS1 | 18 (12.5) |
| CMS2/3 | 117 (81.2) |
| CMS4 | 9 (6.2) |
| Lymphatic vascular invasion | |
| Negative | 108 (75.0) |
| Positive | 36 (25.0) |
| Blood vessel invasion | |
| Negative | 102 (70.8) |
| Positive | 42 (29.2) |
| Perineural invasion | |
| Negative | 112 (77.8) |
| Positive | 32 (22.2) |
| Variable | n = 144 Total N (%) | n = 126 pMMR N (%) | n = 18 dMMR N (%) | p |
|---|---|---|---|---|
| PD-L1 | ||||
| PD-L1—H (p/n) | 29 (20.1)/115 (79.9) | 19 (15.1)/107 (84.9) | 10 (55.6)/8 (44.4) | <0.001 1 |
| PD-L1—L (p/n) | 80 (55.6)/64 (44.4) | 66 (52.4)/60 (47.6) | 14 (77.8)/4 (22.2) | 0.076 2 |
| GLUT-1 | ||||
| GLUT-1—H (p/n) | 81 (56.2)/63 (43.8) | 70 (55.6)/56 (44.4) | 11 (61.1)/7 (38.9) | 0.849 2 |
| GLUT-1—L (p/n) | 98 (68.1)/46 (31.9) | 86 (68.3)/40 (31.7) | 12 (66.7)/6 (33.3) | 1.000 2 |
| e-Cadherin | ||||
| Positive | 66 (45.8) | 56 (44.4) | 10 (55.6) | |
| Negative | 78 (54.2) | 70 (55.6) | 8 (44.4) | 0.527 2 |
| MUC2 | ||||
| Positive | 123 (85.4) | 113 (89.7) | 10 (55.6) | |
| Negative | 21 (14.6) | 13 (10.3) | 8 (44.4) | 0.001 1 |
| CDX2 | ||||
| Positive | 16 (11.1) | 9 (7.1) | 7 (38.9) | |
| Negative | 128 (88.9) | 117 (92.9) | 11 (61.1) | 0.0011 |
| Variable | Overall Survival HR | p | Disease-Free Survival HR | p |
|---|---|---|---|---|
| PD-L1 | ||||
| PD-L1—H | 0.45 (0.16–1.25) | 0.088 | 0.46 (0.18–1.15) | 0.090 |
| PD-L1—L | 0.47 (0.26–0.84) | 0.010 | 0.47 (0.27–0.81) | 0.007 |
| GLUT-1 | ||||
| GLUT-1—H | 1.94 (1.05–3.58) | 0.029 | 1.77 (1.01–3.09) | 0.043 |
| GLUT-1—L | 1.62 (0.83–3.19) | 0.143 | 1.48 (0.81–2.73) | 0.201 |
| e-Cadherin | ||||
| N/P | 1.22 (0.69–2.16) | 0.497 | 1.06 (0.62–1.81) | 0.825 |
| MUC2 | ||||
| N/P | 1.05 (0.41–2.65) | 0.921 | 0.83 (0.33–2.09) | 0.693 |
| CDX2 | ||||
| N/P | 1.70 (0.67–4.31) | 0.300 | 2.15 (0.92–5.04) | 0.070 |
| Variable | Overall Survival HR | p | p LR * | Disease-Free Survival HR | p | p LR * | ||
|---|---|---|---|---|---|---|---|---|
| Univariate Cox Model | ||||||||
| Risk category | ||||||||
| Low | Ref. | Ref. | ||||||
| Medium | 2.10 (0.99–4.46) | 0.054 | 2.07 (1.04–4.15) | 0.039 | ||||
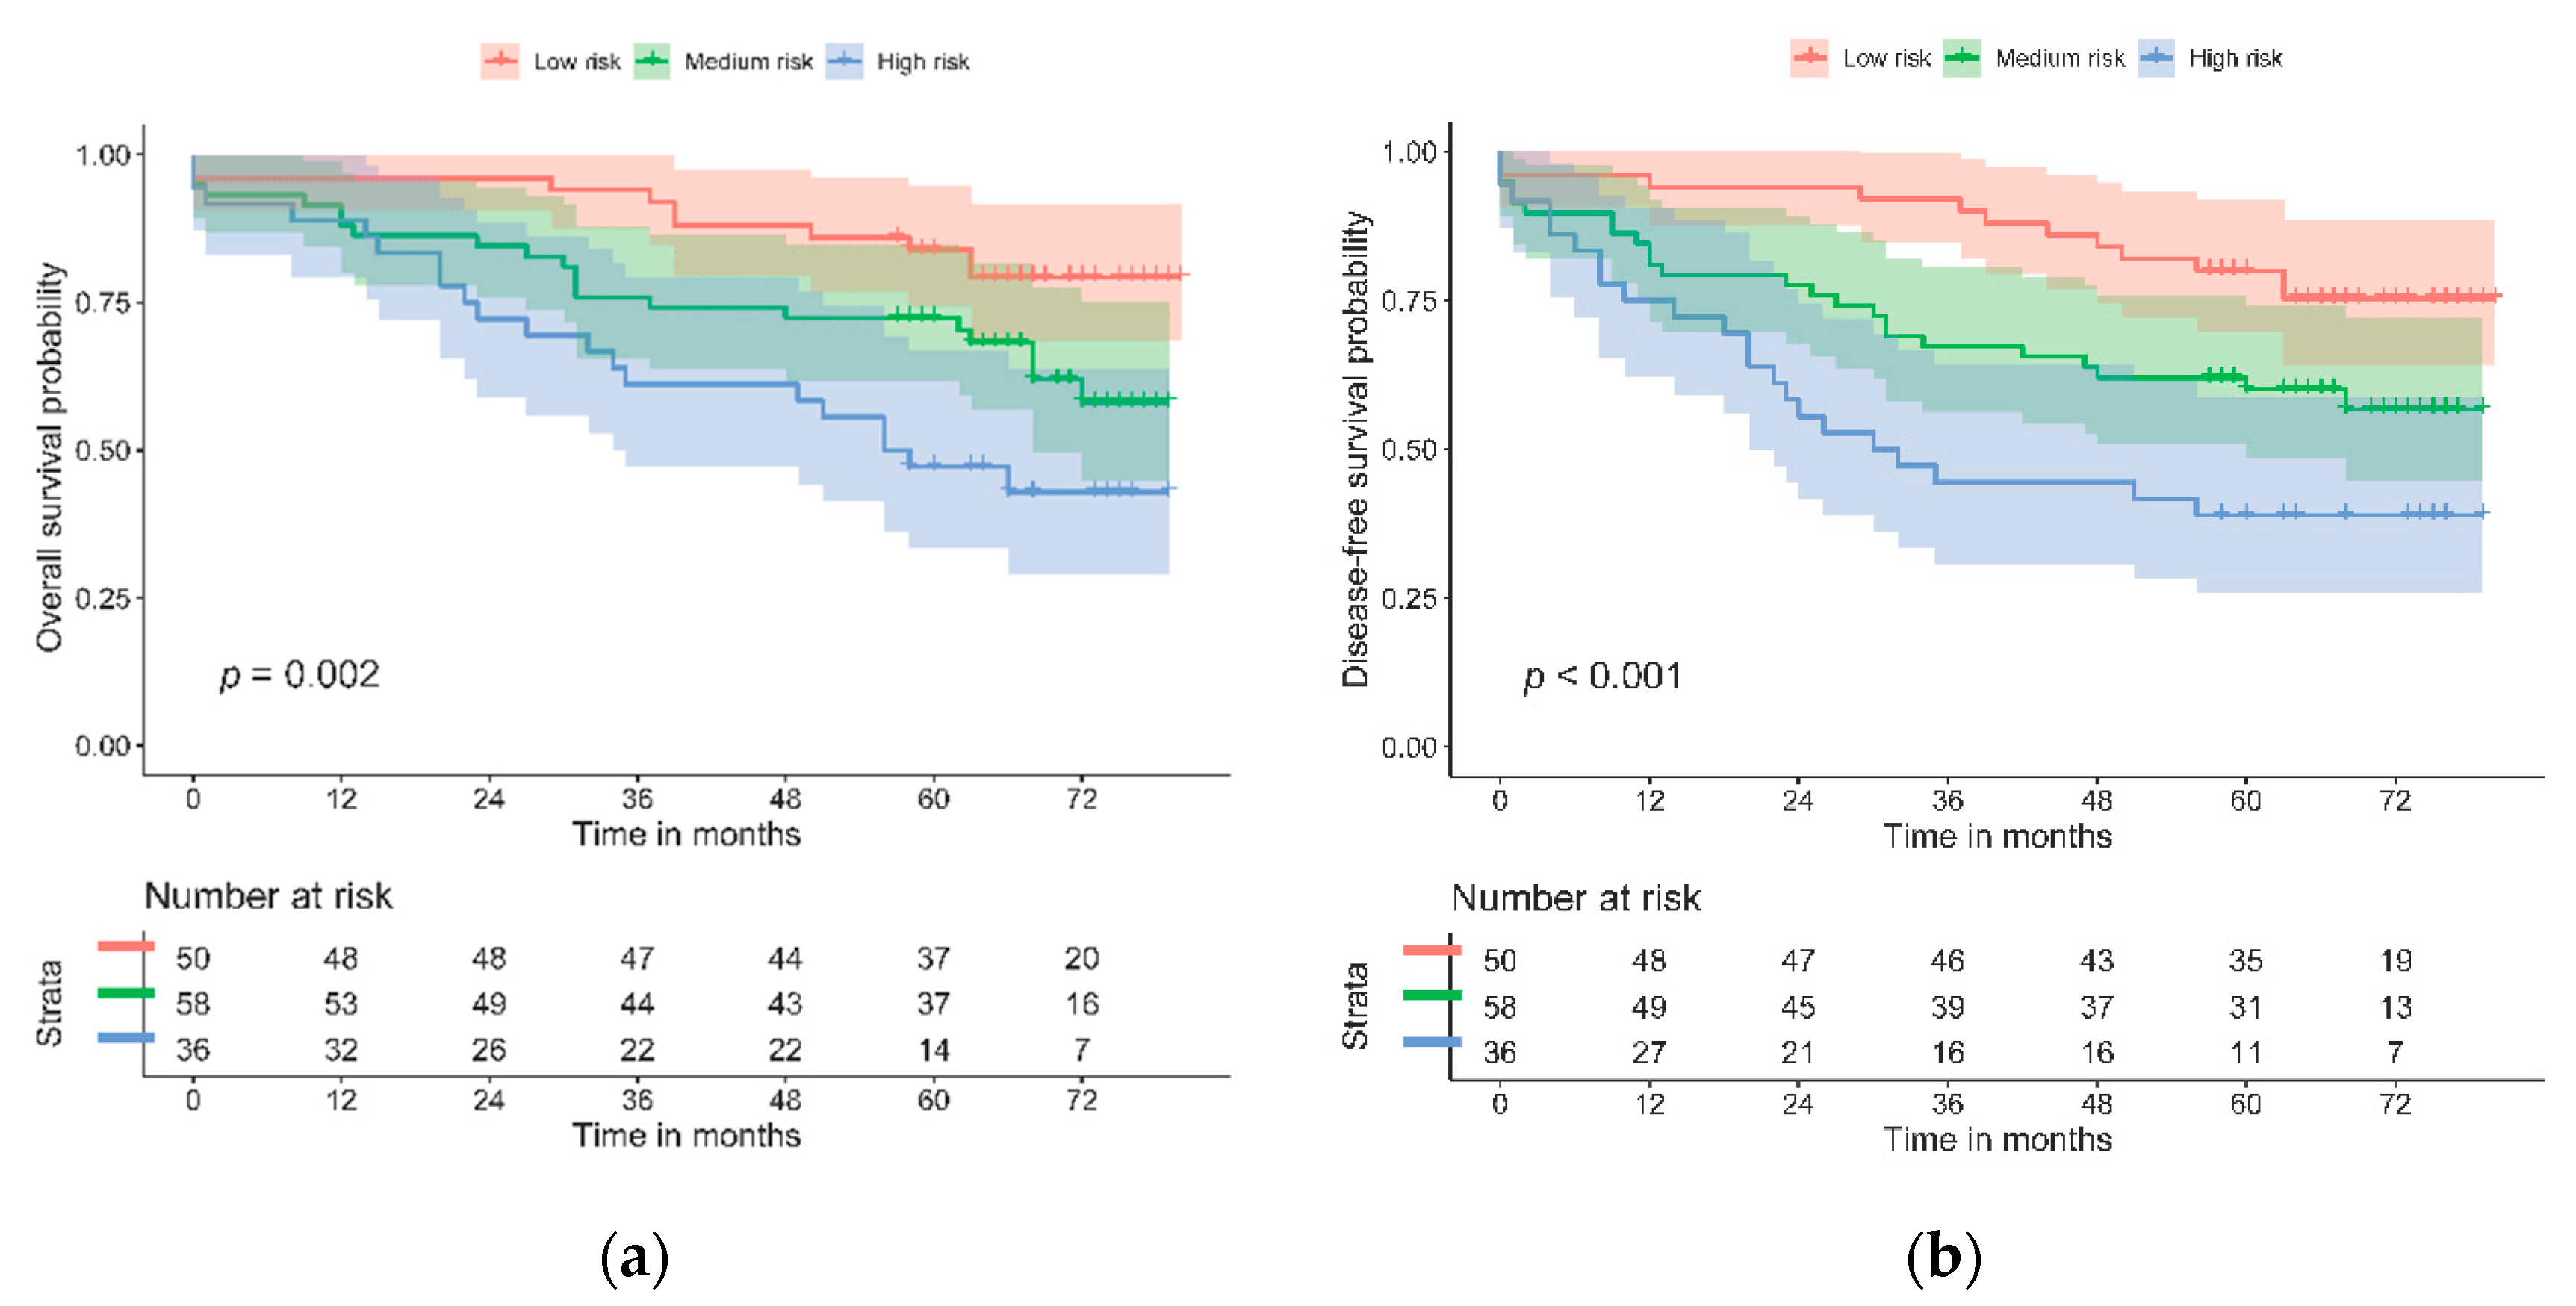
| High | 3.79 (1.77–8.11) | 0.001 | 0.002 | 3.78 (1.86–7.66) | <0.001 | 0.001 | ||
| Multivariate Model | ||||||||
| Age | ||||||||
| Years | 1.08 (1.05–1.12) | <0.001 | 1.06 (1.03–1.09) | <0.001 | ||||
| Sex | ||||||||
| Female | Ref. | Ref. | ||||||
| Male | 0.94 (0.51–1.73) | 0.846 | 0.95 (0.54–1.67) | 0.894 | ||||
| Stage | ||||||||
| II | Ref. | Ref. | ||||||
| III | 1.04 (0.55–1.96) | 0.906 | 1.14 (0.64–2.05) | 0.652 | ||||
| Perineural invasion | ||||||||
| No | Ref. | Ref. | ||||||
| Yes | 2.32 (1.16–4.62) | 0.017 | 2.26 (1.19–4.31) | 0.013 | ||||
| Risk category | ||||||||
| Low | Ref. | Ref. | ||||||
| Medium | 1.70 (0.77–3.74) | 0.186 | 1.61 (0.78–3.32) | 0.198 | ||||
| High | 3.79 (1.73–8.32) | 0.001 | 0.002 | 3.39 (1.64–7.02) | 0.001 | 0.003 | ||
| Harrell’s C-index | C | Dxy | SD | C | Dxy | SD | ||
| Univariate model | 0.637 | 0.275 | 0.071 | <0.001 | 0.644 | 0.288 | 0.065 | <0.001 |
| Multivariate model | 0.756 | 0.516 | 0.057 | <0.001 | 0.714 | 0.428 | 0.060 | <0.001 |
Publisher’s Note: MDPI stays neutral with regard to jurisdictional claims in published maps and institutional affiliations. |
© 2021 by the authors. Licensee MDPI, Basel, Switzerland. This article is an open access article distributed under the terms and conditions of the Creative Commons Attribution (CC BY) license (https://creativecommons.org/licenses/by/4.0/).
Share and Cite
Azcue, P.; Guerrero Setas, D.; Encío, I.; Ibáñez-Beroiz, B.; Mercado, M.; Vera, R.; Gómez-Dorronsoro, M.L. A Novel Prognostic Biomarker Panel for Early-Stage Colon Carcinoma. Cancers 2021, 13, 5909. https://doi.org/10.3390/cancers13235909
Azcue P, Guerrero Setas D, Encío I, Ibáñez-Beroiz B, Mercado M, Vera R, Gómez-Dorronsoro ML. A Novel Prognostic Biomarker Panel for Early-Stage Colon Carcinoma. Cancers. 2021; 13(23):5909. https://doi.org/10.3390/cancers13235909
Chicago/Turabian StyleAzcue, Pablo, David Guerrero Setas, Ignacio Encío, Berta Ibáñez-Beroiz, María Mercado, Ruth Vera, and María Luisa Gómez-Dorronsoro. 2021. "A Novel Prognostic Biomarker Panel for Early-Stage Colon Carcinoma" Cancers 13, no. 23: 5909. https://doi.org/10.3390/cancers13235909
APA StyleAzcue, P., Guerrero Setas, D., Encío, I., Ibáñez-Beroiz, B., Mercado, M., Vera, R., & Gómez-Dorronsoro, M. L. (2021). A Novel Prognostic Biomarker Panel for Early-Stage Colon Carcinoma. Cancers, 13(23), 5909. https://doi.org/10.3390/cancers13235909