Article

Epigenetic Dysregulation of KCNK9 Imprinting and Triple-Negative Breast Cancer

1
Department of Biological Sciences, North Carolina State University, Raleigh, NC 27695, USA
2
Beckman Research Institute, Department of Population Sciences, City of Hope, Duarte, CA 91010, USA
3
Department of Biostatistics, School of Medicine, Duke University, Durham, NC 27710, USA
4
Department of Pathology, Mercy Hospital, Miami, FL 33133, USA
5
Laboratory of Oncology, Department of Oncology, School of Medicine, University of Tennessee Health Science, Memphis, TN 38163, USA
6
McArdle Laboratory for Cancer Research, University of Wisconsin-Madison, Madison, WI 53706, USA
*
Authors to whom correspondence should be addressed.
These authors contributed equally to this work.
Deceased.
Cancers 2021, 13(23), 6031; https://doi.org/10.3390/cancers13236031
Submission received: 15 November 2021 / Accepted: 26 November 2021 / Published: 30 November 2021

Abstract

:

Simple Summary

Genomic imprinting is an inherited form of parent-of-origin specific epigenetic gene regulation that is dysregulated by poor prenatal nutrition and environmental toxins. Here, we showed that KCNK9 is imprinted in breast tissue and identified the differentially methylated region (DMR) controlling its imprint status. Hypomethylation at the DMR, coupled with biallelic expression of KCNK9, occurred in 63% of triple-negative breast cancers (TNBC). The association between hypomethylation and TNBC status was highly significant in African-Americans (p = 0.006), but not in Caucasians (p = 0.70). The high frequency of KCNK9 DMR hypomethylation in TNBC and non-cancerous breast tissue from high-risk women provides evidence that hypomethylation of the KNCK9 DMR/TASK3 overexpression may provide a new target for prevention of TNBC.

Abstract

Genomic imprinting is an inherited form of parent-of-origin specific epigenetic gene regulation that is dysregulated by poor prenatal nutrition and environmental toxins. KCNK9 encodes for TASK3, a pH-regulated potassium channel membrane protein that is overexpressed in 40% of breast cancer. However, KCNK9 gene amplification accounts for increased expression in <10% of these breast cancers. Here, we showed that KCNK9 is imprinted in breast tissue and identified a differentially methylated region (DMR) controlling its imprint status. Hypomethylation at the DMR, coupled with biallelic expression of KCNK9, occurred in 63% of triple-negative breast cancers (TNBC). The association between hypomethylation and TNBC status was highly significant in African-Americans (p = 0.006), but not in Caucasians (p = 0.70). KCNK9 hypomethylation was also found in non-cancerous tissue from 77% of women at high-risk of developing breast cancer. Functional studies demonstrated that the KCNK9 gene product, TASK3, regulates mitochondrial membrane potential and apoptosis-sensitivity. In TNBC cells and non-cancerous mammary epithelial cells from high-risk women, hypomethylation of the KCNK9 DMR predicts for increased TASK3 expression and mitochondrial membrane potential (p < 0.001). This is the first identification of the KCNK9 DMR in mammary epithelial cells and demonstration that its hypomethylation in breast cancer is associated with increases in both mitochondrial membrane potential and apoptosis resistance. The high frequency of hypomethylation of the KCNK9 DMR in TNBC and non-cancerous breast tissue from high-risk women provides evidence that hypomethylation of the KNCK9 DMR/TASK3 overexpression may serve as a marker of risk and a target for prevention of TNBC, particularly in African American women.

Graphical Abstract

1. Introduction

Epigenetic adaptations in response to in utero nutritional and environmental factors are hypothesized to play an important role in developmental plasticity and human disease susceptibility [1,2,3]. Diet-derived methyl donors and co-factors are necessary for the synthesis of S-adenosylmethionine (SAM), the methyl group donor for DNA methylation. Thus, environmental factors that alter early nutrition and/or SAM production can potentially influence adult disease risk by altering CpG methylation at critically important, epigenetically labile regulatory regions [4,5].
Genomic imprinting is an inherited form of parent-of-origin dependent epigenetic gene regulation that renders autosomal genes functionally haploid in a species, developmental stage, and tissue dependent manner [6,7]. There is evidence that epigenetic modifications in the genome link environmental exposures to adult disease susceptibility [5,8,9,10,11], including cancer [12,13,14,15]. Moreover, imprinting can be dysregulated not only in somatic cells, but also in germ cells, potentially affecting offspring never subject to the parental exposure [2,8]. Since imprinted genes are frequently clustered and coordinately regulated by differentially methylated regions (DMRs), changes in a single DMR can disrupt the expression of more than one imprinted gene [16,17]. Disease susceptibility due to epigenetic deregulation also has specific windows of vulnerability, including embryogenesis, puberty, pregnancy, and old age [5,18,19,20].
In a computational model, KCNK9 was predicted to be regulated by imprinting [21]. KCNK9 and its gene product, TASK3, is of interest for human health studies, as overexpression is strongly tied to cancer. KCNK9 is maternally expressed in the human brain, as well as in the mouse brain [21,22]. The KCNK9 gene encodes for the pH sensitive potassium channel protein, TASK3. TASK3 is present at the plasma membrane and regulates membrane depolarization in response to acidosis via inhibition of the background potassium-current [23,24]. Inactivation of the expressed maternal copy of KCNK9 results in Birk-Barel syndrome [25]. Overexpression of TASK3 in cell lines promotes tumor formation and hypoxia-resistance [23,24,26]. Blocking the TASK3 channel protein, either chemically or by mutation, reduces cell proliferation and increases apoptosis, by unknown mechanisms [26,27]. However, TASK3 has been observed to also be localized in the mitochondria, in addition to the plasma membrane [28,29,30,31], and inhibition of TASK3 function has been shown to lead to mitochondrial dysfunction [29,30,31].
TASK3 is overexpressed in >40% of breast cancers, but genomic amplification of KCNK9 only accounts for TASK overexpression in <10% of breast cancers [24]. KCNK9 is known to be epigenetically regulated. Consequently, we hypothesized that overexpression of TASK3 protein (in the absence of KCNK9 duplication) could be due to epigenetic dysregulation, specifically the loss of parental silencing methylation or imprinting.
In this study, we investigated the imprinting status of KCNK9 in normal and malignant mammary epithelial cells. We demonstrated that it is monoallelically expressed and identified an associated DMR and regulatory DMR chromatin structure. In both cancer cells and mammary epithelial cells from high-risk women, we observed hypomethylation of the KCNK9 DMR. Hypomethylation of the KCNK9 DMR increased TASK3 protein expression and resulted in increased mitochondrial membrane potential and apoptosis-resistance. DMR hypomethylation, and an increase in mitochondrial membrane potential, was observed most frequently in triple negative breast cancer (TNBC).

2. Materials and Methods

DNA extraction: DNA was extracted from blood with the PAX gene blood DNA kit (Qiagen, Germantown, MD, USA), according to the manufacturer’s instructions. DNA was extracted from breast epithelial cells collected by Random Periareolar Fine Needle Aspiration (RPFNA). This DNA was isolated using standard procedures [32].
Methylation analysis: CpG methylation was measured by analysis of bisulfite converted DNA. See Appendix A Materials and Methods for details.
Nucleosome occupancy and methylome sequencing (NOMe-Seq): Nucleosome occupancy in conjunction with in vivo DNA methylation was measured as described previously [33]. In vitro methylated DNA was bisulfite converted using EpiTect Bisulfite Kits (Qiagen) according to manufacturer’s instructions and amplified using primers KCNK9-US0f and KCNK9-US4r, which avoid both CpG and GpC dinucleotides. Primer sequences are listed in Appendix A Materials and Methods. Amplicons were cloned and sequenced as described above.
Monoallelic expression analysis: Determination of mono- and biallelic gene expression was performed by cDNA sequencing. Tissues were genotyped at rs2615374 using Applied Biosystems components and equipment (Foster City, CA, USA), according to the manufacturer’s standard protocols as described in Appendix A Materials and Methods. Primer sequences are listed in Appendix A Materials and Methods.
Cloning human KCNK9: To clone KCNK9, 1 μg of human brain total RNA (Takara Bio USA, Mountain View, CA, USA) was transcribed into cDNA using the Superscript III First Strand Kit (Invitrogen, Waltham, MA, USA). KCNK9 was amplified by PCR with BamHI ends from the cDNA and subcloned into pCR2.1 (Life Technologies, Carlsbad, CA, USA). KCNK9 was then digested from pCR2.1 using BamHI and inserted into pLXSN (Takara Bio, Mountain View, CA, USA). Primer sequences are listed in Appendix A Materials and Methods.
LXSN transduction vector construction: A point mutation was generated in pLXSN KCNK9 using the QuickChange II XL Site-Directed Mutagenesis kit (Stratagene, Santa Clara, CA, USA) to generate the dominant negative KCNK9-G95E. Retrovirus particles were generated by co-transfecting pLXSN KCNK9 or KCNK9-G95E with VSV-G into the GP-293 packaging cell line (Takara Bio, Mountain View, CA, USA) as previously described [34]. Primer sequences for site directed mutagenesis are listed in Appendix A Materials and Methods.
FLAG-tagged KCNK9 construction: KCNK9 was cloned into pCr2.1 as described above. KCNK9 was then digested from pCR2.1 using BamHI and inserted into pCMV 3TAG 1 (Agilent Technologies, Santa Clara, CA, USA).
Stable expression of TASK3 protein (KCNK9 gene product): Using previously published methods [34], cell lines were transduced with empty LXSN, LXSN containing wildtype KCNK9, or LXSN containing KCNK9-G95E (dominant negative). Transduced cells were selected with G418 (Life Technologies): MDA231 using 2.0 µg/mL, DKAT using 0.50 µg/mL, SUM225 using 0.10 µg/mL, and HEK293 using 1.0 µg/mL. Expression of TASK3 was confirmed by SDS-PAGE and western analysis.
Transient expression of TASK3 protein (KCNK9 gene product): MCF10A cells were transiently transfected with FLAG-tagged empty plasmid or FLAG-Tagged KCNK9 plasmid for 24 h using X-treme GENE HP DNA (Roche, Indianapolis, IN, USA) according to the manufacturer’s instructions. Expression of the KCNK9 protein product, TASK3, in the cells was confirmed by immunofluorescence. Experiments were performed in triplicate.
Cell Lines: Cell lines were grown at 37 °C and 5% CO2 in a humidified chamber. See Appendix A Materials and Methods for details.
SDS-PAGE and western analysis: SDS-PAGE was performed as previously published [35]. Primary antibodies include 1/1000 KCNK9, ARP35260_P050 (Aviva Systems Biology, San Diego, CA, USA); 1/1000 goat GAPDH, sc-20357 (Santa Cruz Biotechnology, Santa Cruz, CA, USA); 1/500 VDAC1, sc-390996 (Santa Cruz Biotechnology). Secondary antibodies were sc-2313 (anti-rabbit) and sc-2020 (anti-goat) (Santa Cruz Biotechnology), used at a dilution of 1/20,000.
5-Aza-2′-deoxycytidine treatment: MCF10A (data shown) and HMEC15 (data not shown) cells were treated with 1.0 or 2.5 µM of 5-aza-2′-deoxycytidine (Sigma Aldrich, St. Louis, MO, USA) or vehicle control for up to 72 h, with fresh medium added after 24 h. Cells were harvested every 24 h for determining DNA methylation and ΔΨM. Expression of TASK3 was detected via western blot. Experiments were performed in triplicate. Total RNA was also extracted for KCNK9 mRNA quantitation and cell growth was measured using an MTT assay. See Appendix A Materials and Methods for details.
Apoptosis and measurement of ΔΨM: Apoptosis was assessed by measuring intracellular caspase-3 activity. ΔΨM in cell lines was detected using JC-1 (Life Technologies). ΔΨm was also determined in aspirated RPFNA cells from patients. The cells were collected as described below. An aspirate was removed from the subject and was analyzed immediately after collection. See Appendix A Materials and Methods for details.
Mitochondrial localization of TASK3: Transient expression of FLAG-tagged TASK3 in MCF10A cells was detected by immunofluorescence using anti-FLAG antibody (Sigma Aldrich) according to the manufacturer’s instructions. The expression of FLAG-tagged TASK3 in the mitochondria was assessed by SDS-PAGE and western analysis of purified mitochondria (see below).
Isolation of mitochondria: High purity mitochondria were isolated using a Qproteome mitochondrial isolation kit, according to the manufacturer’s instructions (Qiagen).
Human subjects and tissue collection: Tissue collection protocols were approved by the Human Subjects Committee and the Institutional Review Board at Duke University. High-risk women, or women with cancer, were sequentially recruited by a research coordinator in order of presentation. All women provided informed consent to participate in this study. Demographic data were collected by patient interview. Definition of high-risk is described in detail in Appendix A Materials and Methods. All tissues underwent pathology review by a pathologist who was blinded to the results of this study.
RPFNA of breast epithelial cells and Masood Cytology Score: RPFNA was performed by our published methods [32,36]. Masood Cytology Score and epithelial cell count for duplicate RPFNA samples were assigned by a sample blinded, single dedicated cytopathologist as previously reported [36].
Statistical analysis: Assessment of the association of breast cancer subtype with methylation status was performed using Fisher’s exact test. Stratified contingency tables and Fisher’s exact tests were used to assess the association of breast cancer subtype with methylation status by race. Association was estimated for total hypomethylation, partial hypomethylation, normal, and hypermethylated status versus ER+, HER2+, and TNBC (and also categorized as hypomethylated total versus not, and TNBC yes versus not). The association of Masood Cytology Index Score and R/G ratio versus methylation status in high-risk women was completed using linear models with robust standard errors to control for the correlation of multiple measures per patient. Least squares means are reported with paired comparisons across methylation status levels as well as 95% confidence intervals of mean differences. Adjustment of confidence intervals and p-values for the two comparisons to normal methylation status was based on a Bonferroni adjustment [37]. Statistical analysis was completed in SAS v9.4 (SAS Institute, Cary, NC, USA) and in Stata v12 (StataCorp LP, College Station, TX, USA).

3. Results

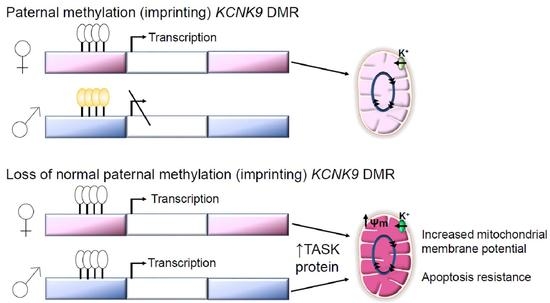
3.1. KCNK9 Is Imprinted in Mammary Epithelial Cells

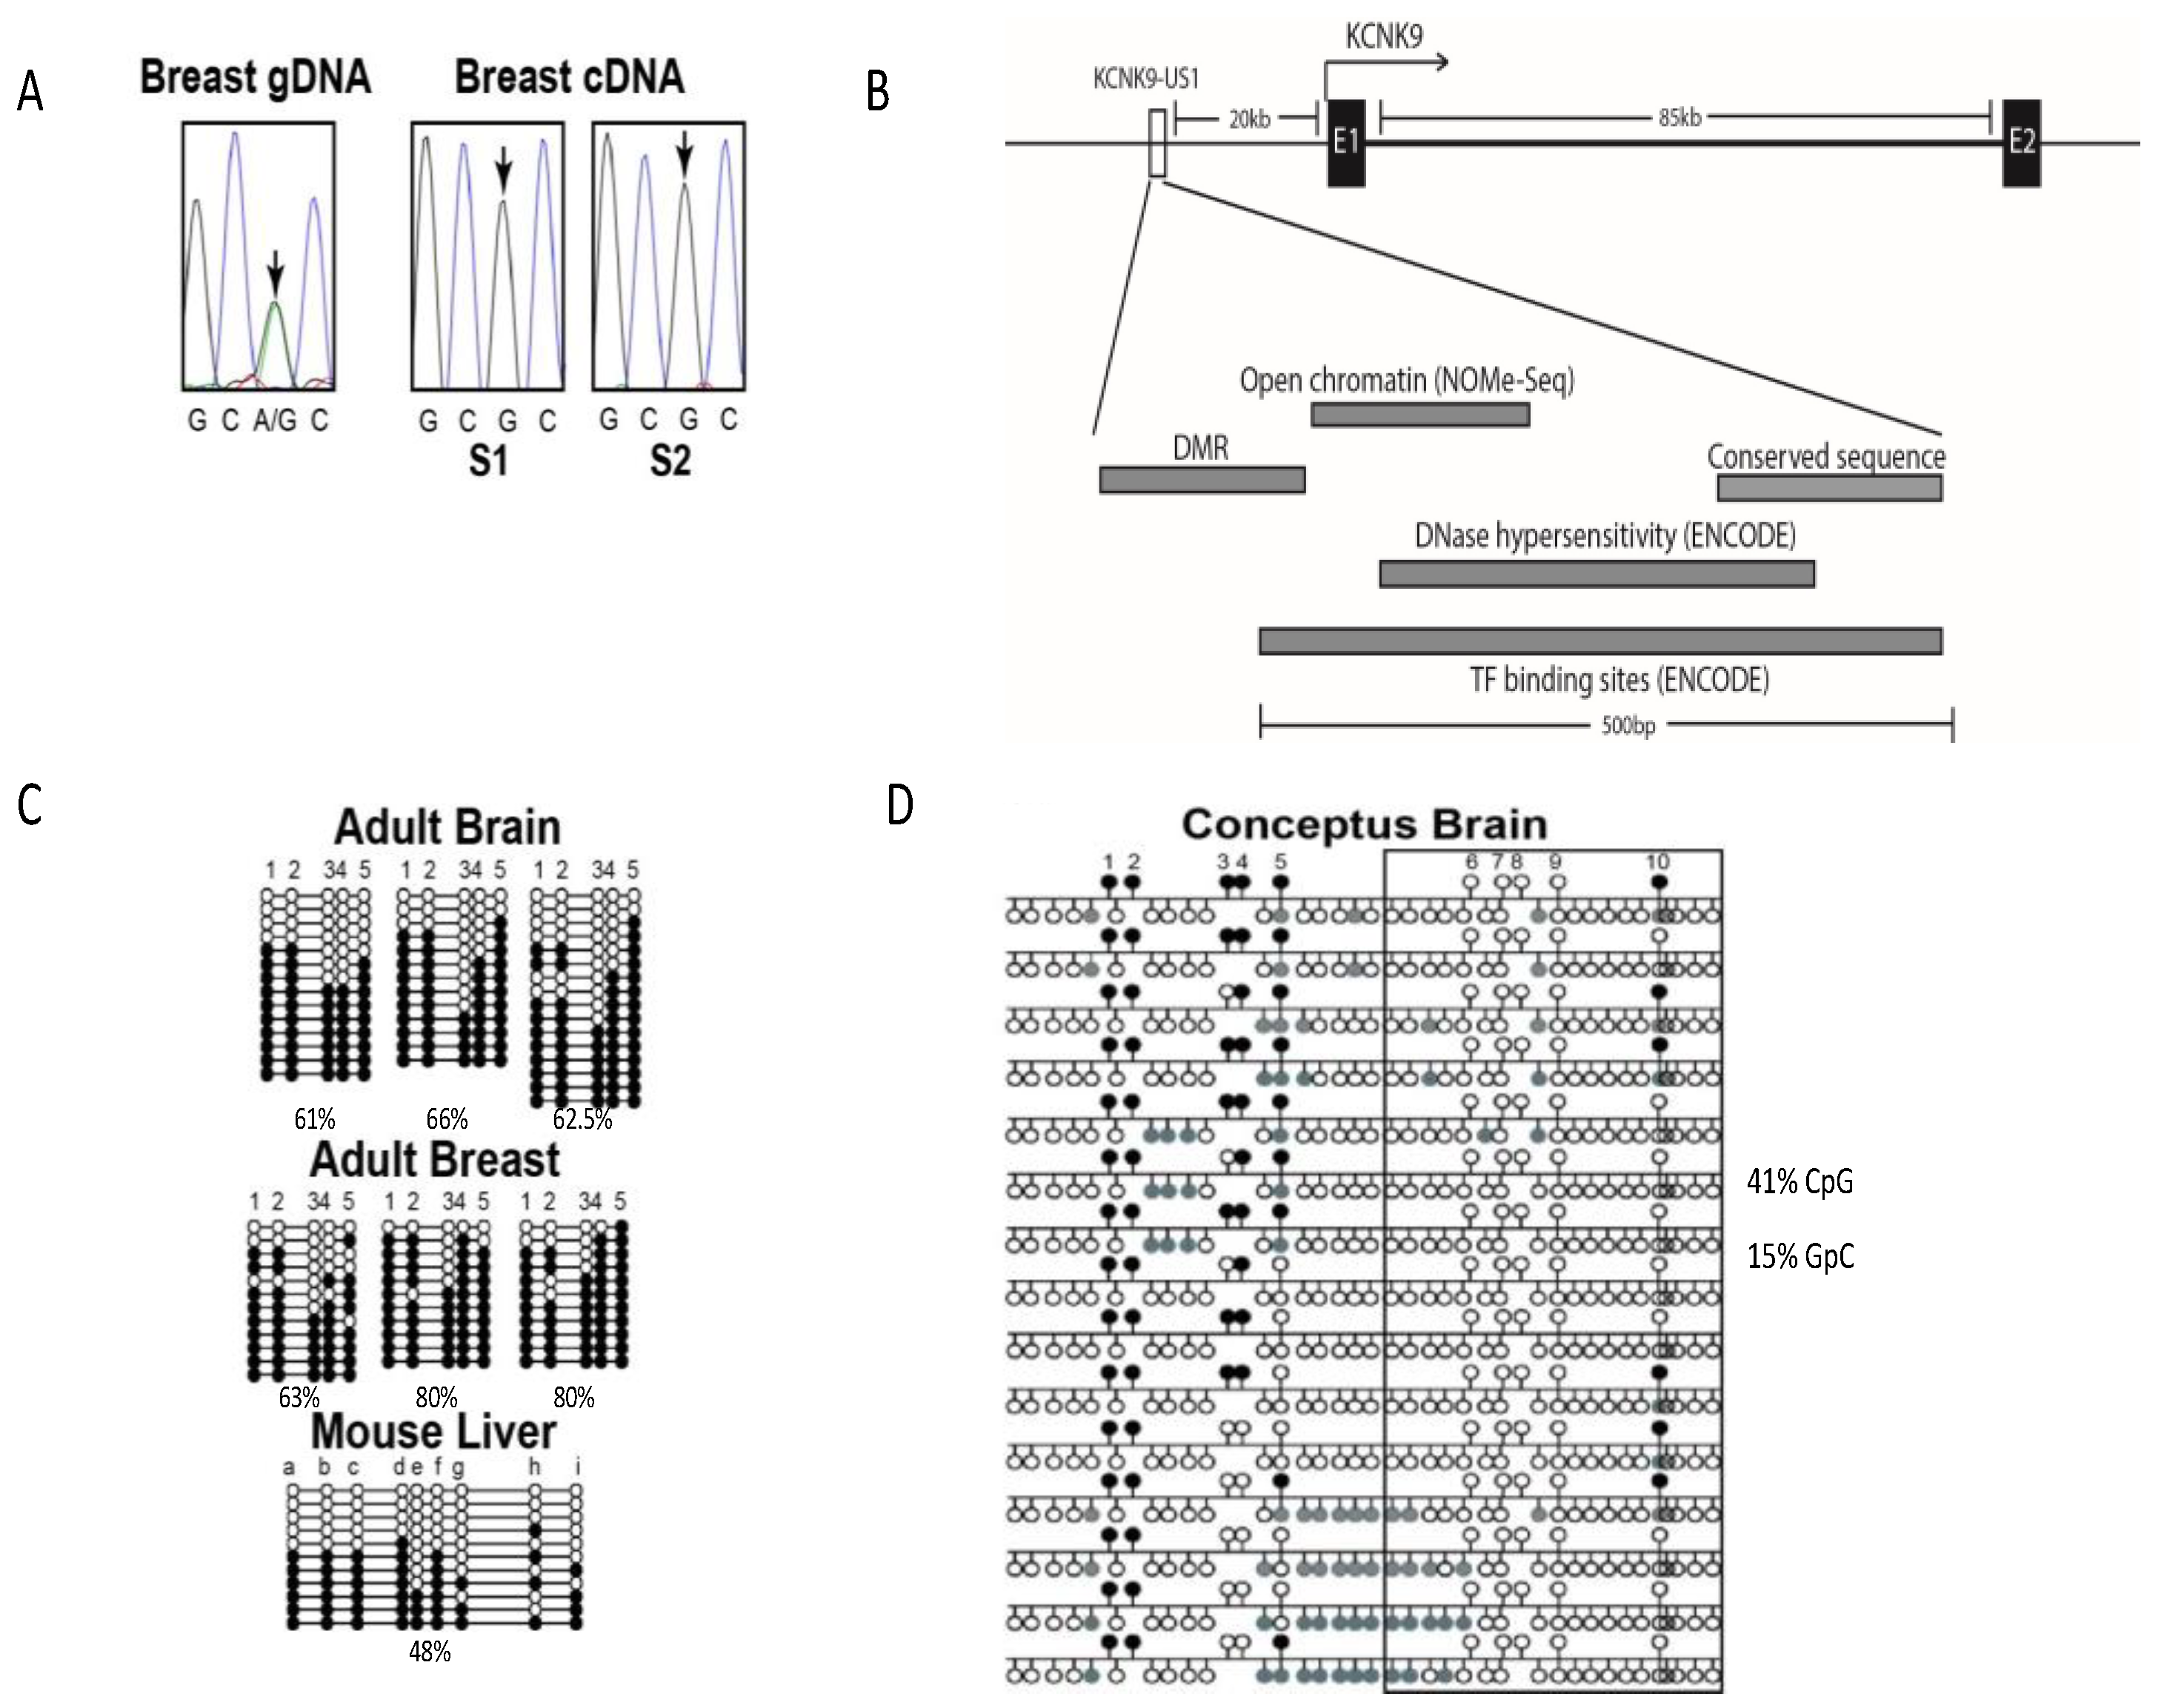
3.1.1. KCNK9 Exhibits Monoallelic Expression in Breast Tissue

Monoallelic expression of KCNK9 in normal mammary epithelial cells was tested using the single nucleotide polymorphism, rs2615374; this was the same polymorphism used to identify monoallelic expression in the brain [21]. Using matched DNA/RNA samples extracted from adult breast tissue, monoallelic expression was observed in two samples heterozygous for rs2615374 (Figure 1A).

3.1.2. Identification of the KCNK9 Imprint DMR

Analysis of the canonical CpG island covering the KCNK9 promoter region, transcription factor binding sites, transcription start site, and first exon identified no allele-specific methylation (Table A1). Expanding the search by a bioinformatic approach, using ENCODE data and cross-species sequence conservation, we identified a KCNK9 upstream region (KCNK9-US1) that had characteristics of an imprint regulatory sequence (Figure 1B). Approximately 20 kb upstream of the KCNK9 start site is a 500 bp region (chr8:140,732,400-140,732,870 GRCh37/hg19) containing areas of strong cross-species conservation, DNase hypersensitivity, and binding of multiple transcription factors [38,39,40]. Immediately adjacent to the conserved sequence is a cluster of CpG sites, but the sequence containing these dinucleotides has no cross-species conservation [39]. Quantitative methylation analysis by Sequenom MassArray identified intermediate methylation (20–70%) for five consecutive CpG sites within this adjacent region in brain, breast, liver, and testis from eight different adults (Table 1). These differentially methylated CpG sites are not within the ENCODE defined DNase hypersensitive region, nor the majority of the transcription factor binding regions [38]. Sequencing of PCR clones shows continuity of methylated or unmethylated cytosines for this region in DNA from the adult brain, with the adult breast showing a higher average methylation level (Figure 1C).
While the putative KCNK9-US1 DMR has no sequence similarity to mouse, human and mouse have comparable numbers of CpG sites and spacing of these sites [40]. Humans have 10 CpG sites in 385 bp with 53% GC content, for an observed:expected CpG ratio of 0.37. Mice have 12 CpG sites in 291 bp with a 51% GC content, for an observed:expected CpG ratio of 0.64. Clone sequencing of this region in mouse liver identified a DMR comparable to that observed in humans, with five CpG sites showing strong contiguous methylation (sites a–d, and f) (Figure 1C).

3.1.3. Methylation of the KCNK9 DMR Regulates Chromatin Structure

The ENCODE data suggested open regulatory chromatin near the KCNK9-US1 DMR, based on observed DNase hypersensitivity and transcription factor binding (Figure 1B). NOMe-seq was used to determine the relationship between CpG methylation and chromatin structure at the DNase hypersensitive and transcription factor binding sites [33,41]. Chromatin structure dependent in vitro methylation by bacterial GpC methyltransferase identified 10 consecutive GpC dinucleotides over ~130 bp as consistently methylated or demethylated in the conceptus brain (Figure 1D). Clone sequencing showed an inverse relationship between this region of differential open/closed chromatin and methylation at DMR CpG sites 3 and 4 (Figure 1D). This strong correlation was observed in conceptus brain tissue, where KCNK9 mRNA expression is highest, with a lesser amount of open chromatin seen in conceptus kidney and liver (data not shown).

3.1.4. Methylation Status of the KCNK9 DMR Does Not Correlate with Age

We used bisulfite sequencing to determine (1) the consistency of KCNK9-US1 DMR methylation in individuals without breast cancer and (2) whether KCNK9-US1 DMR hypomethylation increased with increasing age. Genomic DNA from six women with no breast cancer history, ages 21 to 83 years, showed consistent methylation for each of the five CpG sites for five individuals, while one 81-year-old individual had marginal hypomethylation at sites 3 to 5 (Figure 2).

3.2. Hypomethylaiton of the KCNK9 DMR Is Observed in Invasive Breast Cancer; Hypomethylation of the KCNK9 DMR Increases TASK3 Protein Expression

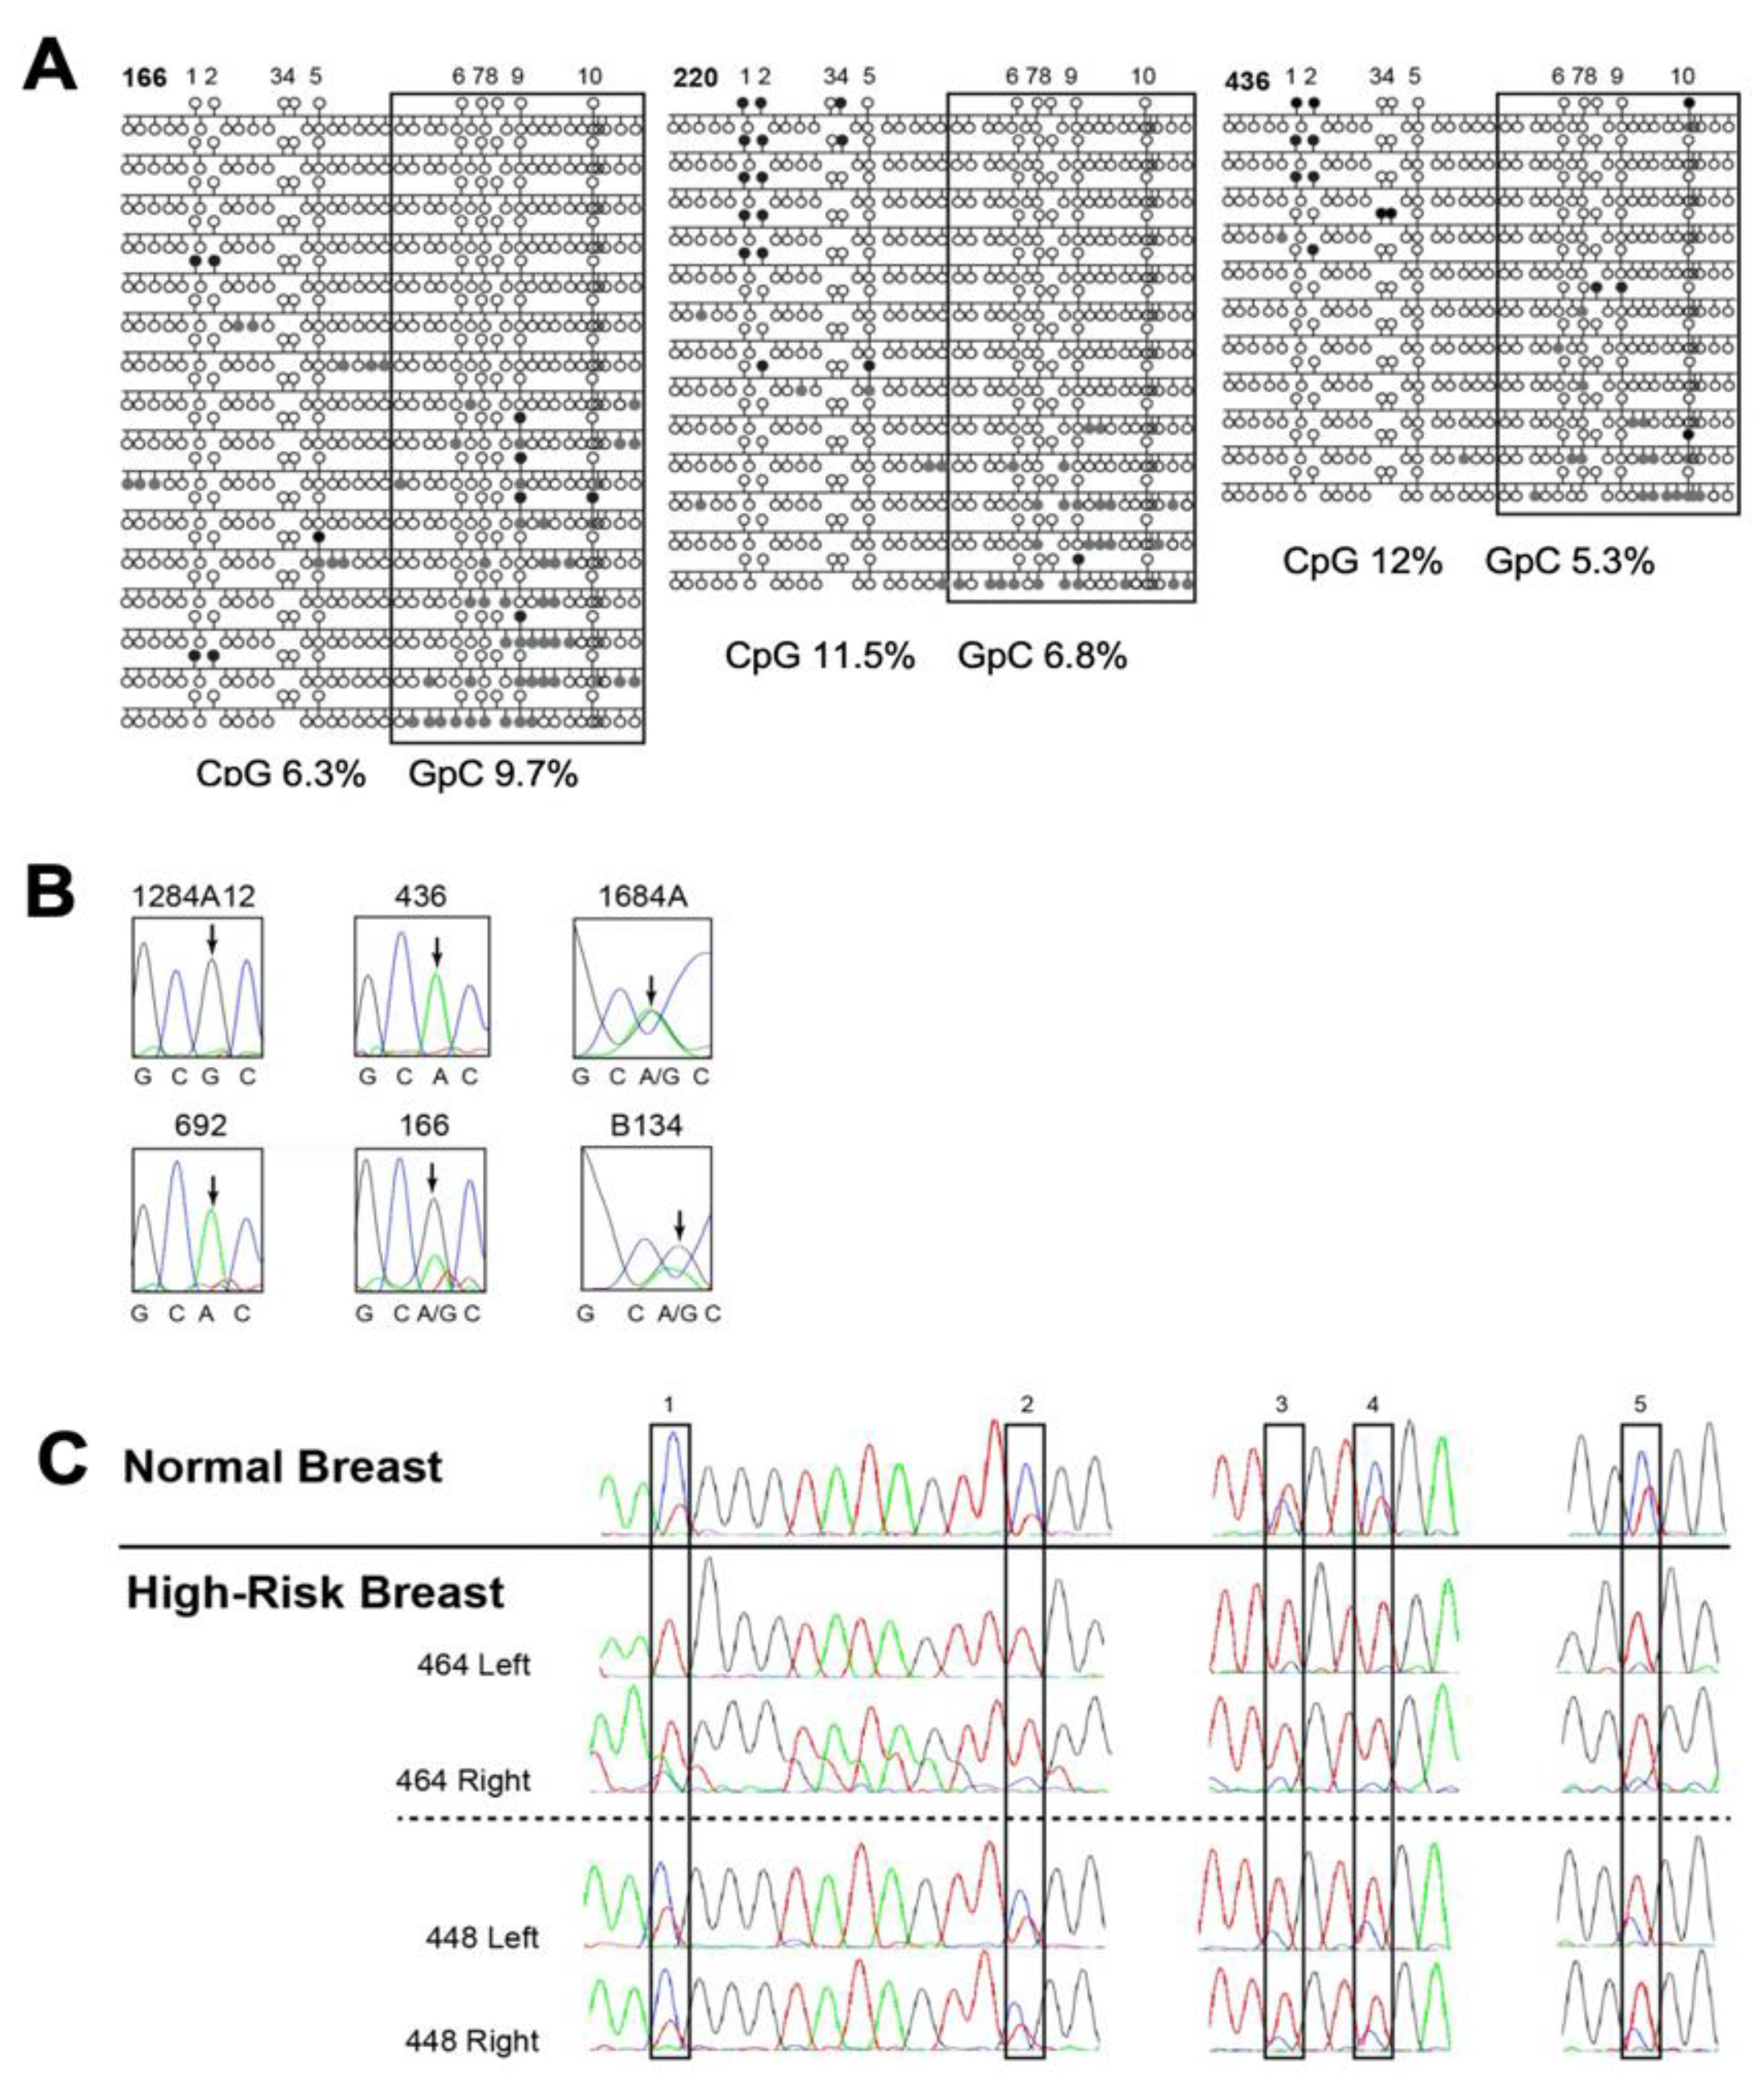
3.2.1. KCNK9 DMR Analysis and Invasive Breast Cancer

Analysis of KCNK9 DMR methylation in invasive cancer biopsy specimens indicated that the most significant differences in methylation between brain and invasive cancer biopsies were for sites 3 to 5. Sites 3 to 5 were the most highly correlated to chromatin structure by NOMe-seq. NOMe-seq of three invasive cancers with DMR hypomethylation indicated open chromatin was linked to DMR hypomethylation (Figure 3A). The open chromatin position in tumor cores (GRCh37/hg19 Chr8:~140732560–140732690) is shifted from that observed in the conceptus brain (Chr8:~140732450–140732630), but is within the ENCODE defined region containing transcription factor binding sites (Figure 1B). Expression analysis by cDNA sequencing of rs2615374 in heterozygous core and epithelial samples showed expression of both alleles, i.e., LOI, in 36% (4/11) of the breast tumors informative for rs2615374 (Figure 3B). As discussed below, methylation was variable in non-cancerous breast tissue from high-risk women, with some individuals showing hypomethylation at sites 3–5, and others showing hypomethylation at sites 1–5 (for a representative analysis of two women, see Figure 3C).

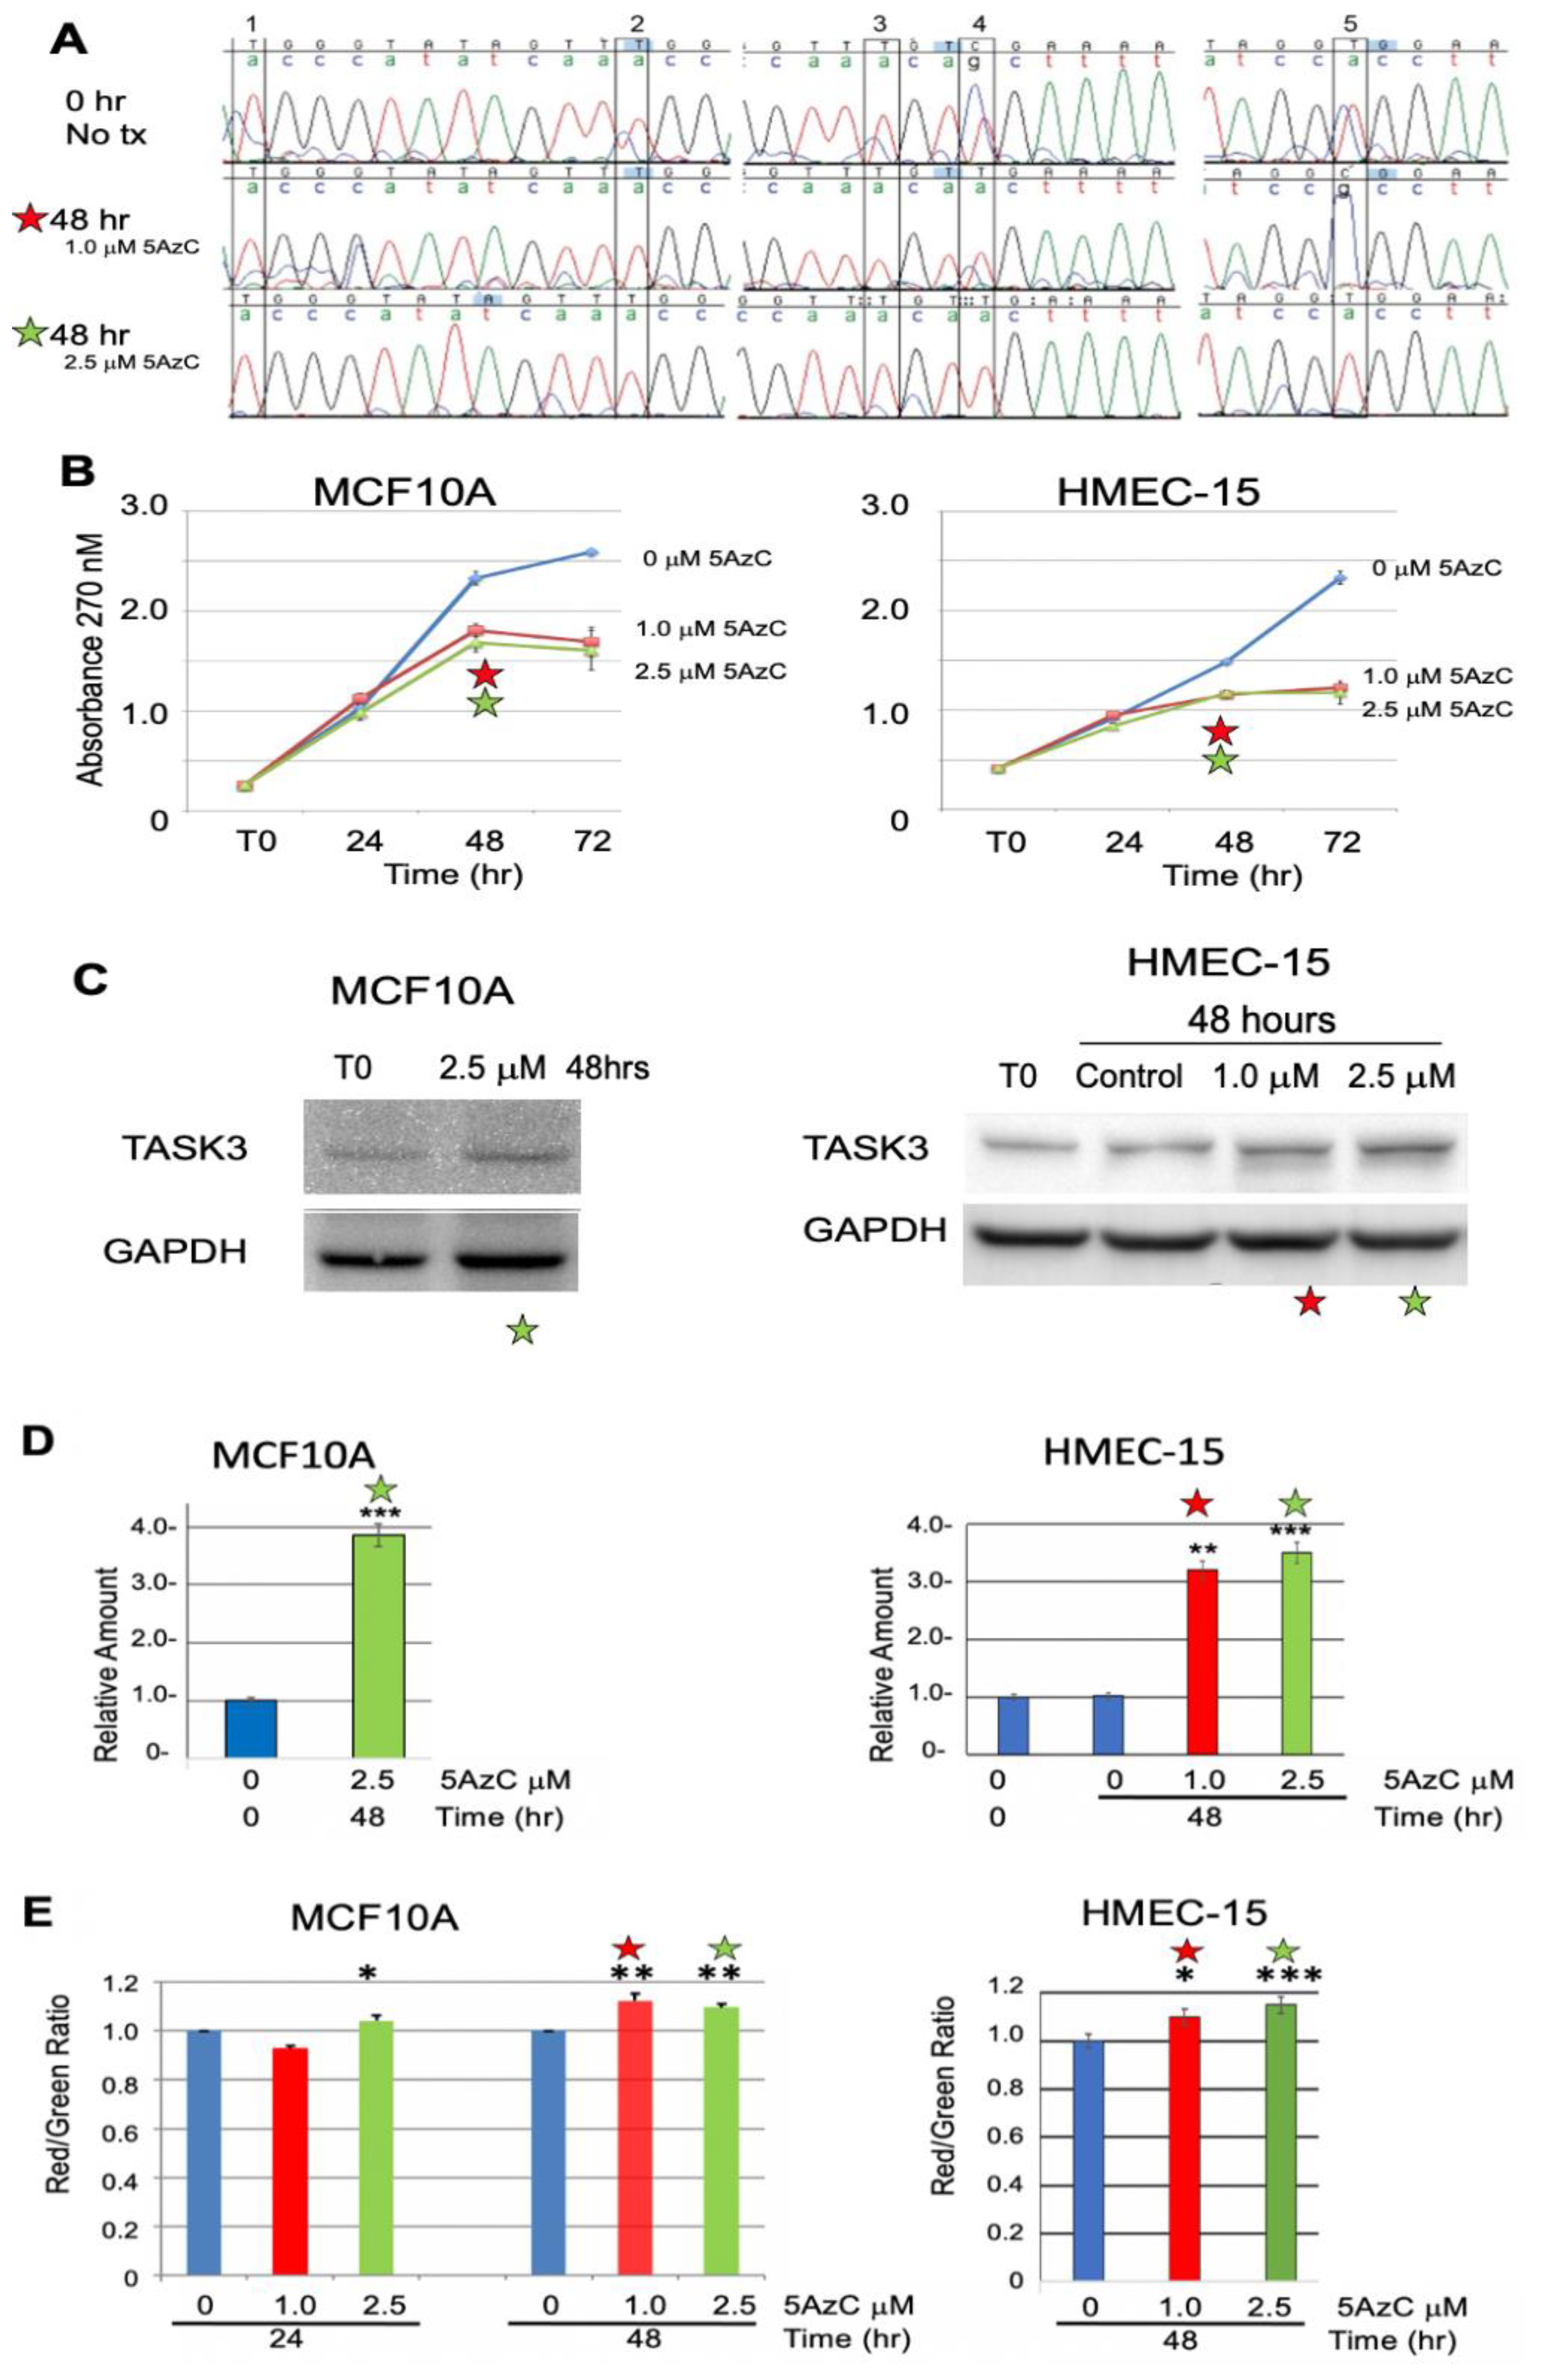
3.2.2. Chemical Demethylation of the KCNK9 DMR Increases Expression of the KCNK9 Gene Product, TASK3

Treatment of TASK3-low expressing MCF10A cells for 48 hrs with 1.0 and 2.5 µM of the demethylating agent 5-aza-2′-deoxycytidine (5AzC) resulted in KCNK9-US1 DMR demethylation at both concentrations (Figure 4A). There was no significant difference in cell viability at 24 h in MCF10A cells or normal mammary epithelial cell strain HMEC-15 treated with either 1.0 or 2.5 µM 5AzC (Figure 4B). At 48 h there was a decrease in cell proliferation (versus untreated control cells) after treatment of MCF10A cells and HMEC15 with either 1.0 or 2.5 µM 5AzC (Figure 4B). After treatment of MCF10A cells with 2.5 µM 5AzC for 48 h, there was a 3.2-fold increase in TASK3 protein; after treatment of HMEC-15 with 0, 1.0, or 2.5 µM 5AzC there was, respectively, a 3.2 and 3.4-fold increase in TASK3 protein relative to T0 control (Figure 4C,D; 4D is a quantitation of results in 4C, including triplicate blots not shown in this figure). There was a statistically significant increase in mitochondrial membrane potential as measured by JC1 R/G ratio after 24 and 48 h treatment of MCF10A cells with 1.0 and 2.5 µM 5AzC; similar results were observed for HMEC-15 strain treated with 1.0 and 2.5 µM 5AzC for 48 h (Figure 4E).

3.3. Exogenous Expression of TASK3 Increases Mitochondrial Expression of TASK3, ΔΨM, and Promotes Resistance to Staurosporine-Induced Apopotosis

TASK3 protein expression was compared in breast cancer cell lines. The SUM225 cell line, HMEC-15 strain, and non-cancerous immortalized MCF10A cell line had lower expression of TASK3 protein relative to the breast cancer cell lines MDA231, DKAT, SUM149, SUM190, and HEK293 (Figure 5A).
Transient transfection using a FLAG-tagged construct was used to overexpress TASK3 (Figure 5B) in the TASK3-low expressing MCF10A cells (Figure 5A). The overexpressed FLAG-tagged TASK3 localized to the mitochondria as demonstrated by western analysis (Figure 5B). Immunohistochemistry demonstration of the FLAG-tagged construct is shown in Figure 5C.
We tested whether TASK3 expression had an impact on mitochondrial membrane potential (ΔΨM) and apoptosis-sensitivity using a knock-in/knock-out approach (Figure 5D,E and Figure 6). Overexpression of wild-type TASK3 significantly increased ΔΨM relative to controls in the TASK3-low expressing cells, MCF10A (p = 0.0003), and SUM225 (p = 0.0037) (Figure 6C). These observations are also consistent with ΔΨM after treatment of the TASK3-low expressing MCF10A cells with 5-aza-2′-deoxycytidine (Figure 4C).
The LXSN retroviral vector was used to (1) stably express the dominant–negative TASK3-G95E construct in the TASK3-expressing cells, HEK293, MDA231, and DKAT (Figure 6A) and to (2) overexpress wild-type TASK3 in TASK3-low expressing cell line SUM225 (Figure 6B). To ensure that our results were neither cell line- nor construct-dependent, we also tested the FLAG-tagged TASK3 construct expressed in MCF10A cells above in Figure 5. The voltage sensitive dye JC-1 was used to test ΔΨM relative to TASK3 expression and function. In TASK3-G95E-expressing cells, ΔΨM was significantly decreased relative to controls in HEK293 (p = 0.0076) and MDA231 (p < 0.0001) (Figure 6C). These results show that TASK3 expression regulates ΔΨM.
Apoptosis sensitivity was tested by treatment with staurosporine. Staurosporine is known to promote apoptosis and is used as an apoptosis-control. Expression of TASK3-G95E significantly increased apoptosis-sensitivity of HEK293 (p = 0.006), MDA231 (p = 0.0091), and DKAT (p = 0.0003) cells (Figure 6D), while overexpression of TASK3 in MCF10A (p = 0.0016) and SUM225 (p = 0.0067) cells resulted in apoptosis-resistance relative to controls, as measured by caspase-3 activity, an indicator of the early stages of apoptosis (Figure 5E and Figure 6D). These results are consistent with a study by Nagy et al. who showed that, in melanoma, TASK3 regulated apoptosis and mitochondrial function [30].

3.4. Hypomethylation of the KCNK9 DMR Is Most Frequently Observed in African-American Women with TNBC versus Caucasians with TNBC

3.4.1. High-Risk Sample Set

In Table 2 and Table 3, we performed detailed methylation sequencing in biopsies obtained in a highly annotated group of high-risk women. Table 3 includes subjects from Table 2; subjects were only counted once. All women were followed by Dr. Victoria Seewaldt while at Duke University and were part of her high-risk cohort. High-risk was defined as (1) greater than 20% lifetime risk for breast cancer or (2) the presence of a deleterious germline mutation (e.g., mutation in BRCA1, BRCA2, etc.).

3.4.2. Hypomethylation of the KCNK9 DMR Was Most Frequently Observed TNBC

We tested for hypomethylation at the KCNK9-US1 DMR in 53 primary human breast cancers (Table 2). TNBCs had the highest frequency of DMR hypomethylation. There was not a significant association between breast cancer subtype and DMR methylation status, with hypomethylation present in 27% of HER2+ cancer, 39% of ER+ cancer, and 63% of TNBC (p = 0.11), with borderline significant association in TNBC, p = 0.06.

3.4.3. KCNK9 DMR Hypomethylation Is Observed in Our Dataset More Frequently in High-Risk African-American Women with TNBC

Hypomethylation at the KCNK9 DMR in TNBC tumors was (1) much more frequently observed in African-Americans with TNBC than in European-American with TNBC and 2) was highly significant in African-Americans, but not in European-Americans (Table 2).
In African-Americans, hypomethylation at the KCNK9 DMR was seen in 20%, 40%, and 92% of ER+, Her2+, and TNBC, respectively (p = 0.006). In European-Americans, hypomethylation at the KCNK9 DMR was seen in 46%, 17%, and 27% of ER+, Her2+, and TNBC, respectively (p = 0.42) (Table 2).
We also attempted to test for hypomethylation of KCNK9 DMR imprinting in a methylation dataset from cBioportal.org, generated from Illumina 450 chip analysis of CpG sites (1500 bp upstream of the transition start site of KCNK9). Unfortunately, the KCNK9 imprint DMR lies significantly upstream of this region, and we were not able to test whether hypomethylation of KCNK9 DMR methylation occurred at a higher frequency in African-American women in this expanded dataset.

3.5. Hypomethylation of the KCNK9 DMR Is Observed in Both TNBC and Non-Cancerous Breast Tissue, but Not in WBCs

Hypomethylation of the KCNK9 DMR Methylation Is Observed in Non-Cancerous Tissue

To determine the utility of KCNK9-US1 DMR methylation as an early breast cancer diagnostic, we tested whether hypomethylation was detectable prior to cancer diagnosis in high-risk women in morphologically normal breast tissue, or WBCs in women with invasive breast cancer. Hypomethylation of the KCNK9-US1 DMR methylation was assessed in matched WBCs and non-cancerous breast tissue from 15 high-risk women and 18 women with invasive cancer (Table 3). Of the 14 women for whom RPFNA DNA was available for both breasts, 14% (2/14) of the women had KCNK9-US1 DMR partial or full hypomethylation in both samples; 57% (8/14) showed partial or full DMR hypomethylation in one or both breast samples (Table 3). Methylation was variable, with some individuals showing hypomethylation at sites 3–5, and others showing hypomethylation at sites 1–5 (Figure 3C). The observed hypomethylation of the KCNK9-US1 DMR in breast tissue, but not in WBC, is consistent with epigenetic alterations at the KCNK9 locus occurring after embryonic implantation and the establishment of three fetal germ layers (i.e., mesoderm, ectoderm, and endoderm).

3.6. KCNK9 DMR Hypomethylation Is Not Associated with the Degree of Cytologic Abnormality, but Is Associated with Increased Mitochondrial Membrane Potential

The relationships between KCNK9-US1 DMR methylation and ΔΨM (measured by JC-1 R/G ratio) or Masood Score (a measure of cytologic abnormality) [36] were investigated in aspirated human mammary epithelial cells. Quantitative DNA methylation analysis was performed and KCNK9-US1 DMR methylation was classified as methylation (75–125% methylation), partial hypomethylation (20–74%), or hypomethylation (0–20% methylation). Mammary epithelial cell cytology was classified by the Masood Score [36].
When samples were grouped by methylation status, KCNK9-US1 DMR methylation was not significantly associated with the Masood Score (p = 0.3) (Figure 7A). In contrast, ΔΨM was significantly higher in mammary epithelial cells with a hypomethylated KCNK9-US1 DMR than in those where it was methylated (p < 0.001) (Figure 7B). Thus, hypomethylation of the KCNK9-US1 DMR predicts ΔΨM independent of the degree of cytologic abnormality.

4. Discussion

Loss of normal imprinting (1) occurs due to poor prenatal nutrition or exposure to heavy metals (e.g., cadmium, lead, arsenic) and (2) is linked to obesity, autism, and cancer [1,2,5,8,9,10,11,12,13,14,15]. The KCNK9 gene-product TASK3 is a pH-regulated, potassium channel membrane protein that we, and others [29,30,31], show regulates mitochondrial membrane potential and apoptosis. This study provides the first demonstration that KCNK9 is imprinted and monoallelically expressed in mammary epithelial cells. It also identifies a DMR that likely regulates imprinting at this locus in human breast tissue. In addition to the DMR identification, we demonstrated, by NOMe-Seq, a region of differential chromatin structure related to the methylation status of the DMR. The relationship between DNA methylation and condensed chromatin structure is consistent with a model in which methylation at the DMR silences gene expression by impacting chromatin accessibility and preventing transcription factor binding. This model also supports an epigenetic mechanism for KCNK9/TASK3 overexpression in breast cancer.
Hypomethylation of the KCNK9 DMR was observed more frequently in African-American women with TNBC (p = 0.006) and less frequently in European-American women with TNBC (p = 0.70). Hypomethylation of the KCNK9 DMR was observed concurrently in TNBC and normal-appearing adjacent breast tissue. Abnormal KCNK9 imprinting was associated with increased mitochondrial membrane potential in live TNBC cells and non-cancerous mammary epithelial cells from high-risk women (p < 0.001). These results are consistent with a study by Nagy et al. who showed that, in melanoma, TASK3 regulates apoptosis and mitochondrial function [30]. The finding that KCNK9-US1 DMR hypomethylation occurs preferentially in African-Americans suggests that KCNK9/TASK3 may provide a new target for prevention of TNBC.
While 50% of Ashkenazi European women with TNBC have a germline mutation of BRCA1, only 20% of African-American women with TNBC have a BRCA1 mutation [42]. This indicates that other mechanism(s) beyond germline mutation of BRCA1 are responsible for the etiology of TNBC in African-American women. African-American women experience disparities in income, access to care, and an unequal burden of environmental exposures [43]. Given that imprinting is dysregulated by poor nutrition and environmental toxicants, our findings provide a potential mechanistic link between disparities and TNBC in African-American women who do not have germline BRCA1 mutations. A limitation of this study is that it was conducted in a single institution in a restricted number of women; multi-institutional testing with an expanded test set and validation set is required to validate KCNK9/TASK3 as a potential risk biomarker.
The hypomethylation at the KCNK9 DMR was observed in both non-cancerous and cancerous breast tissue, but it is rare in the WBC of at-risk individuals. These findings indicate that epigenetic alterations occurring at the KCNK9 locus do not typically form at the time of fertilization and implantation. In contrast, they are consistent with alterations occurring in later epigenetically vulnerable developmental windows. These windows include during tissue differentiation, early childhood, or puberty. Identification of hypomethylation of the KCNK9 DMR in both breasts of at-risk individuals is indicative of a relatively early developmental change with large spatial distribution. Hypomethylation seen in only one breast would indicate epigenetic alteration occurring later in development, in a more specific location or cell type. The epialleles identified here are quantifiable markers for association studies between the environmental factors and the critical exposure timing that contribute to breast cancer risk.
The DMR methylation and NOMe-Seq chromatin data provide intriguing targets for future studies to better understand the origins and progression of TNBC. This will include further investigation of DMR methylation, chromatin structure, transcription factor binding, and gene/protein expression in this aggressive form of breast cancer. As TNBC has rapid-onset, aggressive growth, and resistance to treatment, patient survival could be improved through better classification of risk status, early detection, and better treatment targets. Furthermore, since genomic imprinting is dysregulated by poor nutrition and exposure to environmental toxicants, the results here provide support for the importance of good nutrition and a healthy environment in the prevention of TNBC.
Other recent work into the epigenetic regulation of KCNK9 has identified long distance cis-interactions between the promoter CpG island of KCNK9, which was found to be hypomethylated, and the PEG13 DMR [44]. As mentioned previously, parent-of-origin specific methylation in the KCNK9 CpG island was not detected (Table A1), so any parental-specific regulation by this interaction would be due solely to the PEG13 DMR. Thus, it will be important to determine how CpG methylation and chromatin structure in the KCNK9 promoter influence long-range interactions with PEG13. Furthermore, it will be of interest to determine whether interactions between the KCNK9-US1 DMR and the KCNK9 promoter are involved in gene regulation. Such increased understanding of the epigenetic regulation of KCNK9 will be of great value in determining the role that expression of this gene has in the development and progression of cancers and in developing new treatment methods.
Our studies highlight the importance of therapeutically targeting TASK3. While there has been a recent emphasis on precision medicine, it is unclear whether the benefits of precision medicine will impact women of color. Here we identify a target that has specific promise for African-American women. TASK3 can be targeted by natural products such as hydroxy-α-sanshool (active agent in Szechuan peppers) [45]. Most promising, a recent study showed that antibodies targeting the KCNK9 protein inhibited 410.4 cell breast cancer cell metastasis in the mouse [46]. The high frequency of abnormal KCNK9 imprinting in both TNBC and adjacent non-cancerous breast tissue provides evidence that KNCK9 may serve both as a target for precision therapy and chemoprevention of TNBC in African-American women.

5. Conclusions

TASK3 is overexpressed in >40% of breast cancers, but genomic amplification of KCNK9 is reported to occur in <10% of breast cancers [24], indicating that epigenetic mechanisms may play a key role in TASK3 overexpression. Herein, we show that KCNK9 is imprinted and monoallelically expressed in mammary epithelial cells. We identify (1) a DMR that likely regulates imprinting at this locus and (2) by NOMe-Seq a region of differential chromatin structure that is determined by methylation status of the DMR. The relationship between DNA methylation and condensed chromatin structure is consistent with a model in which methylation at the DMR silences gene expression by impacting chromatin accessibility and preventing transcription factor binding.
Less than 20% of African-American women with TNBC have a BRCA1 mutation [42]. This indicates that other mechanism(s) beyond germline mutation of BRCA1 may be responsible for the etiology of TNBC in African-American women. Given that imprinting is dysregulated by poor nutrition and environmental toxins, our findings provide a potential mechanistic link between disparities and TNBC in African-American women who do not have germline BRCA1 mutations. Hypomethylation at the DMR, coupled with biallelic expression of KCNK9, occurred in 75% of TNBC. The association between hypomethylation and TNBC status was highly significant in African-Americans (p = 0.006), but not in Caucasians (p = 0.70). KCNK9 hypomethylation was also found in non-cancerous tissue from women at high risk of developing breast cancer. The high frequency of abnormal KCNK9 imprinting in both TNBC and adjacent non-cancerous breast tissue provides evidence that KNCK9 has the potential to serve both as a target for precision therapy and chemoprevention of TNBC in African-American women.

Supplementary Materials

The following are available online at https://www.mdpi.com/article/10.3390/cancers13236031/s1, The uncropped blots and molecular weight markers are shown in Supplementary Materials.

Author Contributions

Conceptualization, D.A.S., E.C.D., R.L.J. and V.L.S.; Formal analysis, D.A.S., E.C.D., J.A.A.-O., T.H., R.L.J. and V.L.S.; Funding acquisition, V.L.S.; Investigation, D.A.S., E.C.D., J.A.A.-O., C.S., C.Z., A.A., K.K and O.I.; Methodology, D.A.S., E.C.D., J.A.A.-O., D.A., D.E.S., T.H., C.S., C.Z., M.N.G., R.L.J. and V.L.S.; Project administration, A.A., K.K., O.I. and G.M.C.; Supervision, V.L.S.; Writing—original draft, D.A.S. and E.C.D.; Writing—review and editing, D.A.S., E.C.D., R.L.J. and V.L.S. All authors have read and agreed to the published version of the manuscript.

Funding

Funding sources include National Institutes of Health/National Cancer Institute (NIH/NCI) grants R01CA170851 (VLS), P20CA24619 (VLS), R01CA192914 (VLS), and U01CA189283 (VLS, GMC), the Ester B. O’Keeffe Foundation, and Fred and Alice Stanback, as well as the City of Hope Biomarkers Core. The funders had no role in study design, data collection and analysis, decision to publish, or preparation of the manuscript.

Institutional Review Board Statement

The study was conducted according to the guidelines of the Declaration of Helsinki and approved by the Institutional Review Board of Duke University School of Medicine (protocol code Pro00011258 approved 5 May 2003).

Informed Consent Statement

Informed consent was obtained from all subjects involved in the study.

Data Availability Statement

Data are contained within this article and in Supplementary Materials.

Conflicts of Interest

The authors declare no conflict of interest. The funders had no role in the design of the study; in the collection, analyses, or interpretation of data; in the writing of the manuscript, or in the decision to publish the results.

Appendix A

Materials and Methods

Methylation Primers: Primers used for analysis of the KCNK9-US1 upstream methylation site were KCNK9-US1f, KCNK9-US1r, KCNK9-US2f, and KCNK9-US2r, which were used for DMR screening. Clone amplification and sequencing were performed using KCNK9-US0 and KCNK9-US4. All primers were synthesized by Sigma–Aldrich (St. Louis, MO, USA). Primer sequences were:
  • KCNK9-US1f: 5′-AGGAAGAGAGATATTTAAATGGTAAGGGTAGAG-3′;
  • KCNK9-US1r:5′-CAGTAATACGACTCACTATAGGGAGAAGGCTAACCCCCAAAAAACTAAT- AA-3′;
  • KCNK9-US2f: 5′-AGGAAGAGAGGGTTTGGGTTAAGATTTTTAAGAT-3′;
  • KCNK9-US2r:5′-CAGTAATACGACTCACTATAGGGAGAAGGCTAAAAATTCTTCCTTCCTTC- CA-3′;
  • KCNK9-US0: 5′-TATGGGAAAGGCTAAGGGAA-3′;
  • KCNK9-US4: 5′-AAATTCTTCCTTCCTTCCACCTTTA-3′.
Primers for Sequencing of KCNK9 Amplicons. Primers were synthesized by Sigma–Aldrich. Primer sequences were:
  • TM1R: 5′-ATGCAGTCGCTATAGCCTGACATGGTCAAGAACCTGAGGAC-3′;
  • KCDX-1F: 5′-CCTTCTACTTTGCGATCACGGTCATCACCAC-3′;
  • KCDX-3F: 5′-TCATCACCACCATAGGTTATGGGCACGCTGCACC-3′;
  • KCDX-3R: 5′-CCAGGATATACATAAAGCTAAAGGCCACGTAGAGC-3′;
  • KC-S2: 5′-CAAGGCCTTCTGCATGTTCTA-3′.
KCNK9 Cloning Primers: (IDT, Coralville, IA, USA) with BamHI ends were:
  • F: 5′-GGATCCGCCATGAAGAGGCAGAACGTG-3′
  • R: 5′-GGATCCCACGGACGCCTCTCTTGAATG-3′.
KCNK9-G95E site-directed mutagenesis primers (IDT) were:
  • F: 5′-CACCACCATAGAGTATGGGCACGC-3′
  • R: 5′-GCGTGCCCATACTCTATGGTGGTG-3′.
KCNK9 mRNA quantitation primers (Sigma–Aldrich) were:
  • KCNK9-F: 5′-GCTCCTTCTACTTTGCGATCACG-3′;
  • KCNK9-R: 5′-CTGGAACATGACCAGTGTCAGC-3′;
  • 18S rRNA-F: 5′-GTAACCCGTTGAACCCCATT-3′;
  • 18S rRNA-R: 5′-CCATCCAATCGGTAGTAGCG-3′.
Methylation analysis: CpG methylation was measured by analysis of bisulfite converted DNA. Sodium bisulfite modification of DNA was performed using EpiTect Bisulfite Kits (Qiagen) according to the manufacturer’s instructions, converting unmethylated cytosines to uracil. Quantitative methylation for DMR identification was measured by Sequenom MassARRAY with EpiTYPER analysis software (Sequenom, San Diego, CA, USA). Sequenom EpiDesigner software was used for primer design, incorporating a T7 promoter site to forward primers, and tags to the reverse primers, to balance the annealing temperatures. PCR was performed using HotStarTaq (Qiagen). PCR products were processed using Sequenom MassCLEAVE reagents to deactivate unincorporated dNTPS, transcribe the amplicons from the T7 promoters, and cleave the transcripts with RNAse A. Incorporation of dTTP in the transcription reactions restricts RNase A cleavage to cytosines. The fragmented transcripts were spotted onto SpectroCHIPS for mass spectrometry analysis on the MassARRAY instrument. EpiTYPER software identified fragments based on predicted mass, calculating ratios for fragments of different mass resulting from conversion/non-conversion of cytosines at CpG sites, reporting this ratio as the methylation fraction.
Semiquantitative methylation analysis in screening patient samples for methylation changes was completed using dye terminator sequencing (BigDye, Applied Biosystems, ThermoFisher Scientific, Waltham, MA, United States) on amplicons of the DMR region. For CpG sites 3 and 4, signal intensities of the overlapping C and T peaks were compared to classify the methylation level: C intensity at 75–125% of the T signal was designated “full methylation” (+), C intensity ranging from undetectable to 20% of the T signal was designated “full hypomethylated” (−), peak intensity from 20–74% was designated “partial hypomethylation” (+/−), and peak intensity greater than 125% was designated “hypermethylated” (++).
Contiguous and allele specific methylation were determined by sequencing the clone’s bisulfite DNA PCR products. Amplicons were cloned using a TOPO-TA cloning kit, with the pCR4 sequencing vector and Top 10 chemically competent cells (Life Technologies). Single transformed colonies were chosen and the inserts amplified and sequenced by BigDye 3.1 sequencing reagents (Applied Biosystems).
DNA extraction: Total DNA was isolated from RPFNA samples and enzymatically dispersed normal mammary epithelial cell samples by washing and resuspending the cells in 500 µL 10 mM Tris (pH 7.4), 10 mM NaCl, 3 mM MgCl2, and 0.1 mM EDTA [47,48]. The cells were then incubated overnight with 50 µL proteinase K (Qiagen) at 55 °C, followed by phenol-chloroform extraction and ammonium acetate/isopropanol precipitation of the DNA with glycoblue coprecipitant (Life Technologies).
Total DNA was isolated from conceptus tissues using buffer ATL, proteinase K, and RNase A (Qiagen), followed by phenol–chloroform extraction and ethanol precipitation.
NOMe-Seq: For in vitro methylation, tissues were homogenized in a nuclei homogenization buffer (approximately 50 mg tissue in 500 µL 10 mM Tris (pH 7.4), 10 mM NaCl, 3 mM MgCl2, and 0.1 mM EDTA) plus protease inhibitors (Protease Inhibitor Cocktail and PMSF, Sigma–Aldrich). Samples were kept on ice for 10 min, Igepal (Sigma–Aldrich) was added to 1%, samples were vortexed, and nuclei collected by centrifugation. Nuclei were then resuspended in 500 µL M.cviPI reaction buffer and incubated with 100 U M.cviPI at 37 °C for 15 min (New England Biolabs, Ipswich, MA, USA). Then, 50 µL proteinase K (Qiagen) was added and samples incubated overnight at 55 °C. Samples were extracted with phenol:chloroform:isoamyl alcohol and DNA precipitated with ammonium acetate and isopropanol.
Monoallelic expression analysis: Determination of mono- and biallelic gene expression was performed by cDNA sequencing. Commercially obtained breast genomic DNA (Biochain, Newark, CA, USA) was obtained for analysis. Tissues were genotyped at rs2615374 using Applied Biosystems components and equipment, according to the manufacturer’s standard protocols; TaqMan Made to Order Assay C_2776566_20, TaqMan Genotyping Master Mix, and amplification and analysis were performed on an Applied Biosystems 7900HT Fast Real-Time PCR System (Applied Biosystems). Informative samples heterozygous at rs2615374 were selected for expression analysis. Commercially purified, matched DNAs and RNAs from normal breast tissue were purchased from Biochain (Hayward, CA, USA). RNAs from tissues were purified using RNA-Stat 60 (Tel-Test, Inc., Friendswood, TX, USA), according to the manufacturer’s instructions. Reverse transcription was performed using Quantitect-RT kits (Qiagen), according to the manufacturer’s modified protocol for gene specific primers, using primer TM1R at a final concentration of 0.7 µM. TM1R is based on M1R from Luedi et al. [21], using the M1R transcript specific sequence with the addition of a non-genomic sequence as an amplification tag. Using primers specific to this non-genomic tag controls against amplification of contaminating genomic DNA or aberrantly primed anti-sense RNA.
KCNK9 cDNA was amplified from brain tissue with a single round of amplification using TM1R and M1F primers. Amplification from breast tissue required two rounds of amplification with nested primers, using the TwistDX recombinase amplification kit (TwistDX, Ltd., Cambridge, UK). The first round used primers TM1R and KCDX-1F primers, and the second, primers KCDX-3F and KCDX-3R. All primer pairs used span the ~85 kb single intron of KCNK9 (Figure 1B).
Sequencing of the amplicons was performed using ABI BigDye 3.1 (Applied Biosystems), primers M1R and M1F for brain cDNA, and primers KCDX-3R and KC-S2 for breast cDNA.
Cell Lines: Cell lines were obtained from either the American Type Culture Collection (Manassas, VA, USA) or the Duke Cell Culture Facility (Durham, NC, USA). Cells were validated by short tandem repeat DNA profile analysis and used within 15 passages. MDA231 and HEK293 cells were grown in Dulbecco’s modified eagle medium (DMEM) and the media was supplemented with 10% fetal bovine serum. SUM149 and SUM225 cells were grown in F12 media supplemented with 5% fetal bovine serum, 10 mM HEPES, 1 µg/mL of hydrocortisone (Sigma–Aldrich), and 5 µg/mL of human insulin. SUM190 cells were grown in the same media without fetal bovine serum. HMEC15 cells (Lonza, Walkersville, MD, USA) were immortalized with human telomerase. The hTERT immortalized HMEC15 and DKAT cells were grown in HuMEC media supplemented with bovine pituitary extract and HuMEC supplement. MCF10A cells were grown in F12/DMEM media supplemented with 5% horse serum, 20 ng/mL EGF, 10 µg/mL insulin, 0.5 µg/mL hydrocortisone, and 100 ng/mL cholera toxin (Sigma–Aldrich). All media and supplements were from GIBCO (Life Technologies) unless otherwise noted. All cell lines were tested for mycoplasma prior to the initiation of these studies.
SDS-PAGE and western analysis: SDS-PAGE was performed using Novex precast 4–12% Bis-TRIS gels and the MES running buffer system (Life Technologies). Separated proteins were transferred to a PVDF membrane (BioRad, Hercules, CA, USA), the membrane blocked with 5% BSA in 0.1% TTBS and then incubated with the primary antibody indicated in blocking solution overnight at 4 °C. The membrane was then washed with 0.1% TTBS, incubated for 1 h with secondary antibody, rewashed with 0.1% TTBS, and imaged with a Kodak IS 2000MM (Carestream, Norwalk, CT, USA) using Pierce SuperSignal Dura reagent (Thermo Fisher).
KCNK9 mRNA quantitation: The HMEC15 cell line was seeded at a density of 4.2 × 10⁴ cells/well in a six-well plate with complete media. After 24 h, cells were treated with 1.0 or 2.5 µM of 5-aza-2′-deoxycytidine or vehicle for up to 72 h. After treatment, cells were harvested for real-time qPCR analysis. Total RNA was isolated using the RNeasy Mini Kit (Qiagen) and included an on column DNase digestion treatment according to the manufacturer’s protocol. Total RNA was converted to cDNA using the qPCRBIO cDNA synthesis kit (PCR Biosystems, Wayne, PA, USA) according to the manufacturer’s protocol. QPCR was performed using the Apex qPCR Green Master Mix (Apex Bioresearch) on the QuantStudio 5 Real-Time PCR system (Applied Biosystems). Experiments were performed three times.
MTT assay: Cells were seeded at a density of 2.5 × 10³ cells/well (five wells/treatment) in a 96-well plate with complete media. After 24 h, cells were treated with 1.0 or 2.5 µM of 5-aza-2′-deoxycytidine (Sigma–Aldrich) or vehicle control for up to 72 h with fresh medium added after 24 h. After treatment, cell supernatant was replaced with MTT (.5 mg/mL, Invitrogen) and incubated for an additional 4 h at 37 °C. MTT was replaced with DMSO and incubated for 20 min at room temperature on a shaker. Absorbance was measured at 560 nm and 750 nm using a microplate reader. Experiments were performed three times.
Apoptosis Assays: Cells were plated on day one and allowed to attach and resume growth. On day zero, cells were treated with staurosporine (0.25 µg/mL or 0.50 µg/mL) (Sigma–Aldrich), or an equal volume of dimethylsulfoxide (DMSO), and incubated for 4 h at 37 °C. Subsequently, the media was removed, and the cells were incubated for 30 min with 300 µL lysis buffer (AnaSpec, Fremont, CA, USA). Cells were then scraped and the supernatant collected and centrifuged at 2500× g for 10 min at 4 °C. The supernatant was assayed for caspase-3 activity by mixing 170 µL of supernatant with 57 µL of caspase-3 substrate solution (AnaSpec), and then incubating the mixture for 1 h at room temperature with shaking. Following incubation, fluorescence was measured with a Shimadzu 1501 fluorimeter (Shimadzu USA, Columbia, MD, USA) at λex = 490 nm and λem = 520 nm with a 20 nm bandwidth. Experiments were performed in triplicate.
ΔΨM analysis of cell lines and live RPFNA cytology: The relationships between KCNK9-US1 DMR methylation and ΔΨM (measured by JC-1 R/G ratio) or Masood Score (a measure of cytologic abnormality) [36] were investigated in aspirated human TNBC cells from seven women and non-cancerous mammary epithelial cells from ten high-risk women. Seven women, including TNBC and high-risk women, were BRCA1 mutation carriers; bilateral breast tissue was available from 59% (10/17) of these women (Table A2). Quantitative DNA methylation analysis was performed and KCNK9-US1 DMR methylation was classified as methylation (75–125% methylation), partial hypomethylation (20–74%), or hypomethylation (0–20% methylation). Mammary epithelial cell cytology was classified by the Masood Score [36]. One-way ANOVA was used to determine the association between KCNK9-US1 DMR methylation status, and the continuous variables of ΔΨM and Masood Score.
On day -1, cells were seeded in a black 96 well microtiter plate at 20,000 cells per well in triplicate. On day 0, the media was removed and replaced with media containing 0.5 ug/mL JC-1 (ThermoFisher), and then the cells were incubated in the dark for 30 min at 37 °C. Next, the JC-1 containing media was removed, the cells were washed three times with warm PBS, and 200 mL of warm PBS was added to each well. Epithelial cells were identified by morphology. Red (λex = 525 nm, λem = 580–640 nm) and green (λex = 490 nm, λem = 510–570 nm) fluorescence were measured, and the ratio of red to green fluorescence was determined as a measure of ΔΨM.
Human subjects and tissue collection: Informed consent was obtained from women at high risk for breast cancer who were scheduled for a breast surgical procedure in the operating room. RPFNA samples were obtained from the patient and transferred from the operating room to the laboratory within 5 min and immediately processed for analysis. RPFNA cytology samples were washed with phosphate buffered saline (PBS) and resuspended in 1 mL DMEM. Then, they were incubated with either JC-1 (final concentration: 1 µg/mL) or vehicle control at 37 °C for 30 min. After incubation, the cells were centrifuged, and the staining solutions were decanted. Each sample was washed twice with warm PBS and resuspended in 200 µL of warm PBS. The cell suspension was transferred to a black flat-bottom 96-well plate and measured as above. Epithelial cells were identified by morphology. DAPI (4′,6-diamidino-2-phenylindole) was used as a control and its fluorescence was measured (λex = 365 nm, λem = 410–460 nm).
High risk was defined by (1) known BRCA mutation carrier, (2) a Gail Model Risk of >1.66% over five years, or (3) a strong family history of breast and/or ovarian cancer. A strong family history of breast and/or ovarian cancer risk was defined as having at least one of the following: (a) two or more first-degree relatives with breast cancer before the age of 50 years, (b) one first degree relative with bilateral breast cancer or ovarian cancer, (c) two or more first-degree relatives with breast cancer, (d) one first degree relative and two or more second or third degree relatives with breast cancer, (e) one first-degree relative with breast cancer and one or more relatives with ovarian cancer, (f) two second or third degree relatives with either breast cancer and one or more with ovarian cancer, (g) one second or third degree relative with breast cancer and two or more with ovarian cancer, or (h) three or more second or third degree relatives with breast cancer.
To control for hormonal effects on mammary cell proliferation, menstruating women were aspirated between days 1 and 12 of their cycle. The breast was anesthetized with 5 mL of 1% lidocaine, immediately adjacent to the areola, at ~3 and 9 o’clock positions. Eight to ten aspirations were performed per breast for random sampling of epithelial cells. After the aspiration, cold packs were applied to the breasts for 10 min, and both breasts were bound in kerlex gauze for 12 to 24 h. Epithelial cells were pooled and placed in modified CytoLyt (Cytyc Co., Boxborough, MA, USA) with 1% formalin for 24 h. Cells from the right and left breast were processed independently, so as to obtain one specimen per aspirated breast. Epithelial cells were split into two samples, with half designated for cytology and half designated for DNA extraction.
Cytology preparations were also given a semiquantitative index score through evaluation by the Masood cytology index. As previously described, cells were given a score of one to four points for each of six morphologic characteristics that include cell arrangement, pleomorphism, number of myoepithelial cells, anisonucleosis, nucleoli, and chromatin clumping.
Table A1. Methylation levels for CpG sites in the KCNK9 promoter CpG island.
KCNK9 Promoter TF-Binding SiteSampleC KdC LvC BrAd BrstAd LvAd Br
Chr8:140717586-140718423CpG sites353737353737
Forward – ATTTAGGTGACACTATAGAAATTTTAGTTAAGGAAGGGATGGAGAMean0.0690.0930.080.0620.0740.058
Reverse – CAGTAATACGACTCACTATAGGGAGAAGGCTCATCTCAAAAATCCTTCCAATACTCSD0.0440.0540.0780.0640.100.059
Median0.060.090.050.040.040.04
Range0–0.150–0.230–0.320–0.340–0.580–0.29
KCNK9 CpG island Promoter-Exon 1SampleC KdC LvC BrAd BrstAd LvAd Br
Chr8:140715033-140715433CpG sites44NDNDNDND
Reverse – CAGTAATACGACTCACTATAGGGAGAAGGCTTACAAAATCACCAACTCCAACTACCSD0.0120.052NDNDNDND
Median0.0050NDNDNDND
Range0–0.030–0.11NDNDNDND
KCNK9 CpG island Exon 1-Intron 1SampleC KdC LvC BrAd BrstAd LvAd Br
Chr 8: 140714363-140714967CpG sites141414NDNDND
Forward – ATTTAGGTGACACTATAGAAGTTTTAGAATTGGAATTTAGGGGAAMean0.0290.0430.034NDNDND
Reverse – CAGTAATACGACTCACTATAGGGAGAAGGCTTCATCACCACCATAAATAAAAACTAAASD0.0210.0540.036NDNDND
Median0.0290.0430.034NDNDND
Range0–0.070–0.20–0.12NDNDND
Reverse – CAGTAATACGACTCACTATAGGGAGAAGGCTTACAAAATCACCAACTCCAACTACCSD0.0120.052NDNDNDND
Methylation levels were measured by Sequenom MassArray with a possible value range from 0.0 to 1.0 (i.e., hypomethylated to hypermethylated); primers and amplicon positions are listed (GRCh37/hg19). Measurements were made in conceptus kidney (C Kd), liver (C Lv), brain (C Br) and adult breast (Ad Brst), liver (Ad Lv), and brain (Ad Br) tissues. The number of CpG sites listed per amplicon were those readable by MassArray analysis, with mean, standard deviation, median, and range of methylation given for each tissue. (ND) Not Determined.
Table A2. Association between Masood Cytology Index, R/G ratio, and KCNK9-US1 DMR methylation in mammary epithelial cells.
NumberAge (Years)RaceBRCA Mut.MutationCancer SubtypeMasood R-MECMasood
L-MEC
Methylation
R-MEC
Methylation
L-MEC
Methylation WBC
147CND ER+1313+++++
253CND NO1214++++
339CND HER2+2018++/−+
452C1IVS5-11T > GTNBC1522++
543AAND NO1614++
638C1M1775RTNBC1512+/−+/−+
752CND NO1915++
852CND NO1113ND++
939C0 TNBC1615+ND+
1034H26872del4ER+2115+ND+
1152CND TNBC16ND+/−ND++
1236CND HER2+1818+ND+/−
1355A2UVG2961SNOND15ND+/−+/−
1455C1exon 22 del 510 bpNO1413ND+/−
1551AAND ER+14NDND+/−
1649AA0 TNBC18NDND+/−
1734AA0 TNBC1423ND+
1843AA0 TNBC1420ND+
1946C0 NO915NDND++
2048CND ER+16NDNDND++
2150CND TNBC14NDNDND++
2240CND NO1213NDND+
2353CND NO1013NDND+
2451CND NO99NDND+
2551CND NO1311NDND+
2639AAND NOND9NDND+
2749AAND HER2+1718NDND+
2847AAND HER2+18NDNDND+
2949CND ER+23NDNDND+
3040CND NO1615NDND+
3141AAND NO1413NDND+
3227C0Rad50-R365Q (1094G > A) TNBC15NDNDND+/−
3345AAND NO13NDNDND
3435CND ER+1515+++ND
3542C0 NO1211+ND
3647C1MissingNO1413+/−ND
3751C1MissingNO1214ND
3841AA0 TNBC1617ND
3947AA0 TNBC1519ND
4042AAND TNBC1816ND
4145CND TNBC1919 +ND
4236CND TNBC16ND+/−NDND
4342AAND ER+1620++/−ND
4449CND ER+1620NDND
4553C0 ER+1623NDND
(AA) African-American, (C) Caucasian, (0) No BRCA1/2 mutation, (1) BRCA1 mutation, (2) BRCA2 mutation, (ND) Not determined, (TNBC) Triple-negative breast cancer, (ER+) Estrogen receptor positive breast cancer, (HER2+) HER2/NEU overexpressing breast cancer, (NO) No cancer, (R) Right breast, (L) Left breast, (DMR) Differentially methylated region, (−) Full hypomethylation of KCNK9 DMR (0–20% methylation), (+/−) Partial hypomethylation KCNK9 DMR (20–74% methylation), (+) Normal KCNK9 DMR methylation (75–125% methylation), (++) Hypermethylation of KCNK9 DMR (>125% methylation), (MEC) Mammary epithelial cells from breast RPFNA, (R/G Ratio) JC-1 red/green fluorescent ratio.

References

  1. Jirtle, R.L. How Genes and Environment Interact. In Environmental Epigenomics in Health and Disease: Epigenetics and Disease Origins; Jirtle, R.L., Tyson, F.L., Eds.; Springer: Berlin/Heidelberg, Germany, 2013; pp. 3–30. [Google Scholar]
  2. Jirtle, R.L.; Skinner, M.K. Environmental epigenomics and disease susceptibility. Nat. Rev. Genet. 2007, 8, 253–262. [Google Scholar] [CrossRef]
  3. Bartolomei, M.S.; Ferguson-Smith, A.C. Mammalian genomic imprinting. Cold Spring Harb. Perspect. Biol. 2011, 3, a002592. [Google Scholar] [CrossRef] [Green Version]
  4. Hochberg, Z.; Feil, R.; Constancia, M.; Fraga, M.; Junien, C.; Carel, J.C.; Boileau, P.; Le Bouc, Y.; Deal, C.L.; Lillycrop, K.; et al. Child health, developmental plasticity, and epigenetic programming. Endocr. Rev. 2011, 32, 159–224. [Google Scholar] [CrossRef] [PubMed]
  5. Murphy, S.K.; Hoyo, C. Sculpting Our Future: Environmental Nudging of the Imprintome. In Environmental Epigenomics in Health and Disease: Epigenetics and Disease Origins; Jirtle, R.L., Tyson, F.L., Eds.; Springer: Berlin/Heidelberg, Germany, 2013; pp. 3–30. [Google Scholar]
  6. Das, R.; Hampton, D.D.; Jirtle, R.L. Imprinting evolution and human health. Mamm. Genome 2009, 20, 563–572. [Google Scholar] [CrossRef] [PubMed]
  7. Ishida, M.; Moore, G.E. The role of imprinted genes in humans. Mol. Aspects Med. 2013, 34, 826–840. [Google Scholar] [CrossRef]
  8. Soubry, A.; Hoyo, C.; Jirtle, R.L.; Murphy, S.K. A paternal environmental legacy: Evidence for epigenetic inheritance through the male germ line. Bioessays 2014, 36, 359–371. [Google Scholar] [CrossRef]
  9. Murphy, S.K.; Huang, Z.; Hoyo, C. Differentially methylated regions of imprinted genes in prenatal, perinatal and postnatal human tissues. PLoS ONE 2012, 7, e40924. [Google Scholar] [CrossRef] [PubMed] [Green Version]
  10. Hoyo, C.; Daltveit, A.K.; Iversen, E.; Benjamin-Neelon, S.E.; Fuemmeler, B.; Schildkraut, J.; Murtha, A.P.; Overcash, F.; Vidal, A.C.; Wang, F.; et al. Erythrocyte folate concentrations, CpG methylation at genomically imprinted domains, and birth weight in a multiethnic newborn cohort. Epigenetics 2014, 9, 1120–1130. [Google Scholar] [CrossRef] [Green Version]
  11. Vidal, A.C.; Benjamin Neelon, S.E.; Liu, Y.; Tuli, A.M.; Fuemmeler, B.F.; Hoyo, C.; Murtha, A.P.; Huang, Z.; Schildkraut, J.; Overcash, F.; et al. Maternal stress, preterm birth, and DNA methylation at imprint regulatory sequences in humans. Genet. Epigenet. 2014, 6, 37–44. [Google Scholar] [CrossRef]
  12. Plass, C.; Soloway, P.D. DNA methylation, imprinting and cancer. Eur. J. Hum. Genet. 2002, 10, 6–16. [Google Scholar] [CrossRef] [PubMed] [Green Version]
  13. Ferguson-Smith, A.C. Genomic imprinting: The emergence of an epigenetic paradigm. Nat. Rev. Genet. 2011, 12, 565–575. [Google Scholar] [CrossRef]
  14. Feinberg, A.P.; Cui, H.; Ohlsson, R. DNA methylation and genomic imprinting: Insights from cancer into epigenetic mechanisms. Semin. Cancer Biol. 2002, 12, 389–398. [Google Scholar] [CrossRef]
  15. Feinberg, A.P. Phenotypic plasticity and the epigenetics of human disease. Nature 2007, 447, 433–440. [Google Scholar] [CrossRef] [PubMed]
  16. Varrault, A.; Gueydan, C.; Delalbre, A.; Bellmann, A.; Houssami, S.; Aknin, C.; Severac, D.; Chotard, L.; Kahli, M.; Le Digarcher, A.; et al. Zac1 regulates an imprinted gene network critically involved in the control of embryonic growth. Dev. Cell 2006, 11, 711–722. [Google Scholar] [CrossRef] [PubMed]
  17. Small, K.S.; Hedman, A.K.; Grundberg, E.; Nica, A.C.; Thorleifsson, G.; Kong, A.; Thorsteindottir, U.; Shin, S.Y.; Richards, H.B.; Soranzo, N.; et al. Identification of an imprinted master trans regulator at the KLF14 locus related to multiple metabolic phenotypes. Nat. Genet. 2011, 43, 561–564. [Google Scholar] [CrossRef] [Green Version]
  18. Jirtle, R.L. Epigenome: The program for human health and disease. Epigenomics 2009, 1, 13–16. [Google Scholar] [CrossRef] [Green Version]
  19. Szyf, M. The early life environment and the epigenome. Biochim. Biophys. Acta 2009, 1790, 878–885. [Google Scholar] [CrossRef]
  20. Ho, S.M.; Johnson, A.; Tarapore, P.; Janakiram, V.; Zhang, X.; Leung, Y.K. Environmental epigenetics and its implication on disease risk and health outcomes. ILAR J. 2012, 53, 289–305. [Google Scholar] [CrossRef] [Green Version]
  21. Luedi, P.P.; Dietrich, F.S.; Weidman, J.R.; Bosko, J.M.; Jirtle, R.L.; Hartemink, A.J. Computational and experimental identification of novel human imprinted genes. Genome Res. 2007, 17, 1723–1730. [Google Scholar] [CrossRef] [Green Version]
  22. Ruf, N.; Bähring, S.; Galetzka, D.; Pliushch, G.; Luft, F.C.; Nürnberg, P.; Haaf, T.; Kelsey, G.; Zechner, U. Sequence-based bioinformatic prediction and QUASEP identify genomic imprinting of the KCNK9 potassium channel gene in mouse and human. Hum. Mol. Genet. 2007, 16, 2591–2599. [Google Scholar] [CrossRef] [Green Version]
  23. Patel, A.J.; Lazdunski, M. The 2P-domain K+ channels: Role in apoptosis and tumorigenesis. Pflug. Arch. 2004, 448, 261–273. [Google Scholar] [CrossRef] [PubMed]
  24. Mu, D.; Chen, L.; Zhang, X.; See, L.H.; Koch, C.M.; Yen, C.; Tong, J.J.; Spiegel, L.; Nguyen, K.C.; Servoss, A.; et al. Genomic amplification and oncogenic properties of the KCNK9 potassium channel gene. Cancer Cell 2003, 3, 297–302. [Google Scholar] [CrossRef] [Green Version]
  25. Barel, O.; Shalev, S.A.; Ofir, R.; Cohen, A.; Zlotogora, J.; Shorer, Z.; Mazor, G.; Finer, G.; Khateeb, S.; Zilberberg, N.; et al. Maternally inherited Birk Barel mental retardation dysmorphism syndrome caused by a mutation in the genomically imprinted potassium channel KCNK9. Am. J. Hum. Genet. 2008, 83, 193–199. [Google Scholar] [CrossRef] [PubMed] [Green Version]
  26. Pei, L.; Wiser, O.; Slavin, A.; Mu, D.; Powers, S.; Jan, L.Y.; Hoey, T. Oncogenic potential of TASK3 (Kcnk9) depends on K+ channel function. Proc. Natl. Acad. Sci. USA 2003, 100, 7803–7807. [Google Scholar] [CrossRef] [PubMed] [Green Version]
  27. Innamaa, A.; Jackson, L.; Asher, V.; Van Shalkwyk, G.; Warren, A.; Hay, D.; Bali, A.; Sowter, H.; Khan, R. Expression and prognostic significance of the oncogenic K2P potassium channel KCNK9 (TASK-3) in ovarian carcinoma. Anticancer Res. 2013, 33, 1401–1408. [Google Scholar] [PubMed]
  28. Rusznak, Z.; Bakondi, G.; Kosztka, L.; Pocsai, K.; Dienes, B.; Fodor, J.; Telek, A.; Gonczi, M.; Szucs, G.; Csernoch, L. Mitochondrial expression of the two-pore domain TASK-3 channels in malignantly transformed and non-malignant human cells. Virchows Arch. 2008, 452, 415–426. [Google Scholar] [CrossRef]
  29. Kosztka, L.; Rusznak, Z.; Nagy, D.; Nagy, Z.; Fodor, J.; Szucs, G.; Telek, A.; Gonczi, M.; Ruzsnavszky, O.; Szentandrassy, N.; et al. Inhibition of TASK-3 (KCNK9) channel biosynthesis changes cell morphology and decreases both DNA content and mitochondrial function of melanoma cells maintained in cell culture. Melanoma Res. 2011, 21, 308–322. [Google Scholar] [CrossRef]
  30. Nagy, D.; Gonczi, M.; Dienes, B.; Szoor, A.; Fodor, J.; Nagy, Z.; Toth, A.; Fodor, T.; Bai, P.; Szucs, G.; et al. Silencing the KCNK9 potassium channel (TASK-3) gene disturbs mitochondrial function, causes mitochondrial depolarization, and induces apoptosis of human melanoma cells. Arch. Dermatol. Res. 2014, 306, 885–902. [Google Scholar] [CrossRef]
  31. Bachmann, M.; Rossa, A.; Antoniazzi, G.; Biasutto, L.; Carrer, A.; Campagnaro, M.; Leanza, L.; Gonczi, M.; Csernoch, L.; Paradisi, C.; et al. Synthesis and cellular effects of a mitochondria-targeted inhibitor of the two-pore potassium channel TASK-3. Pharmacol. Res. 2021, 164, 105326. [Google Scholar] [CrossRef]
  32. Bean, G.R.; Scott, V.; Yee, L.; Ratliff-Daniel, B.; Troch, M.M.; Seo, P.; Bowie, M.L.; Marcom, P.K.; Slade, J.; Kimler, B.F.; et al. Retinoic acid receptor-beta2 promoter methylation in random periareolar fine needle aspiration. Cancer Epidemiol. Prev. Biomark. 2005, 14, 790–798. [Google Scholar] [CrossRef] [Green Version]
  33. You, J.S.; Kelly, T.K.; De Carvalho, D.D.; Taberlay, P.C.; Liang, G.; Jones, P.A. OCT4 establishes and maintains nucleosome-depleted regions that provide additional layers of epigenetic regulation of its target genes. Proc. Natl. Acad. Sci. USA 2011, 108, 14497–14502. [Google Scholar] [CrossRef] [PubMed] [Green Version]
  34. Dietze, E.C.; Caldwell, L.E.; Grupin, S.L.; Mancini, M.; Seewaldt, V.L. Tamoxifen but not 4-hydroxytamoxifen initiates apoptosis in p53(-) normal human mammary epithelial cells by inducing mitochondrial depolarization. J. Biol. Chem. 2001, 276, 5384–5394. [Google Scholar] [CrossRef] [PubMed] [Green Version]
  35. Seewaldt, V.L.; Kim, J.H.; Caldwell, L.E.; Johnson, B.S.; Swisshelm, K.; Collins, S.J. All-trans-retinoic acid mediates G(1) arrest but not apoptosis of normal human mammary epithelial cells. Cell Growth Differ. 1997, 8, 631–641. [Google Scholar] [PubMed]
  36. Ibarra-Drendall, C.; Wilke, L.G.; Zalles, C.; Scott, V.; Archer, L.E.; Lem, S.; Yee, L.D.; Lester, J.; Kulkarni, S.; Murekeyisoni, C.; et al. Reproducibility of random periareolar fine needle aspiration in a multi-institutional Cancer and Leukemia Group B (CALGB) cross-sectional study. Cancer Epidemiol. Prev. Biomark. 2009, 18, 1379–1385. [Google Scholar] [CrossRef] [PubMed] [Green Version]
  37. Holm, S. A simple sequentially rejective multiple test procedure. Scand. J. Stat. 1979, 6, 65–70. [Google Scholar]
  38. Rosenbloom, K.R.; Sloan, C.A.; Malladi, V.S.; Dreszer, T.R.; Learned, K.; Kirkup, V.M.; Wong, M.C.; Maddren, M.; Fang, R.; Heitner, S.G.; et al. ENCODE data in the UCSC Genome Browser: Year 5 update. Nucleic Acids Res. 2013, 41, D56–D63. [Google Scholar] [CrossRef]
  39. Kent, W.J. BLAT--the BLAST-like alignment tool. Genome Res. 2002, 12, 656–664. [Google Scholar] [CrossRef] [Green Version]
  40. Kent, W.J.; Sugnet, C.W.; Furey, T.S.; Roskin, K.M.; Pringle, T.H.; Zahler, A.M.; Haussler, D. The human genome browser at UCSC. Genome Res. 2002, 12, 996–1006. [Google Scholar] [CrossRef] [Green Version]
  41. Han, H.; Cortez, C.C.; Yang, X.; Nichols, P.W.; Jones, P.A.; Liang, G. DNA methylation directly silences genes with non-CpG island promoters and establishes a nucleosome occupied promoter. Hum. Mol. Genet. 2011, 20, 4299–4310. [Google Scholar] [CrossRef] [Green Version]
  42. Greenup, R.; Buchanan, A.; Lorizio, W.; Rhoads, K.; Chan, S.; Leedom, T.; King, R.; McLennan, J.; Crawford, B.; Kelly Marcom, P.; et al. Prevalence of BRCA mutations among women with triple-negative breast cancer (TNBC) in a genetic counseling cohort. Ann. Surg. Oncol. 2013, 20, 3254–3258. [Google Scholar] [CrossRef]
  43. Newman, L.A. Breast cancer disparities: High-risk breast cancer and African ancestry. Surg. Oncol. Clin. 2014, 23, 579–592. [Google Scholar] [CrossRef]
  44. Court, F.; Camprubi, C.; Garcia, C.V.; Guillaumet-Adkins, A.; Sparago, A.; Seruggia, D.; Sandoval, J.; Esteller, M.; Martin-Trujillo, A.; Riccio, A.; et al. The PEG13-DMR and brain-specific enhancers dictate imprinted expression within the 8q24 intellectual disability risk locus. Epigenet. Chromatin 2014, 7, 5. [Google Scholar] [CrossRef] [PubMed] [Green Version]
  45. Bautista, D.M.; Sigal, Y.M.; Milstein, A.D.; Garrison, J.L.; Zorn, J.A.; Tsuruda, P.R.; Nicoll, R.A.; Julius, D. Pungent agents from Szechuan peppers excite sensory neurons by inhibiting two-pore potassium channels. Nat. Neurosci. 2008, 11, 772–779. [Google Scholar] [CrossRef] [Green Version]
  46. Sun, H.; Luo, L.Q.; Lal, B.; Ma, X.R.; Chen, L.P.; Hann, C.L.; Fulton, A.M.; Leahy, D.J.; Laterra, J.; Li, M. A monoclonal antibody against KCNK9 K+ channel extracellular domain inhibits tumour growth and metastasis. Nat. Commun. 2016, 7, 10339. [Google Scholar] [CrossRef] [PubMed] [Green Version]
  47. Stampfer, M.; Hallowes, R.C.; Hackett, A.J. Growth of normal human mammary cells in culture. In Vitro 1980, 16, 415–425. [Google Scholar] [CrossRef] [PubMed]
  48. Eldridge, S.R.; Martens, T.W.; Sattler, C.A.; Gould, M.N. Association of decreased intercellular communication with the immortal but not the tumorigenic phenotype in human mammary epithelial cells. Cancer Res. 1989, 49, 4326–4331. [Google Scholar] [PubMed]
Figure 1. KCNK9 is imprinted in human breast tissue. (A) Sequencing of KCNK9 coding single nucleotide polymorphism (SNP) rs2615374 from breast tissue. Individuals S1 and S2 were heterozygous for this SNP (A/G), but only one allele (G) was expressed. The position of rs2615374 used to determine allelic expression is indicated by the arrows. (B) Exon 1 (E1), exon 2 (E2). Bars indicate the regions of differential methylation (DMR), open chromatin (NOMe-Seq) determined in this study, regions of cross species conserved sequence (human GRCh37/hg19 compared to mouse GRCm38/mm 10), DNase hypersensitivity (ENCODE), and transcription factor binding (ENCODE). Transcription factors binding in this region include NRSF, GATA3, and AP-2. (C) Sequencing of cloned methyl-PCR products from the upstream DMR (KCNK9-US1 DMR) in adult human brain and breast, and the orthologous KCNK9 upstream sequence in mouse liver, open circle, unmethylated cytosine; black filled circle, methylated cytosine in the differentially methylated region (DMR). (D) NOMe-Seq of cloned methyl-PCR products from KCNK9-US1 DMR in conceptus brain, showing an inverse relation between CpG methylation and open chromatin structure. Upper circles—CpG sites (in vivo methylation: open circle, unmethylated cytosine; black filled circle, methylated cytosine). Lower circles—GpC sites (in vitro methylation, chromatin structure dependent: open circle, unmethylated cytosine, closed chromatin; gray filled circle, methylated cytosine, open chromatin). Boxed region—area of transcription factor binding from ENCODE data (Figure 1B).
Cancers 13 06031 g001
Figure 2. Representative DNA methylation of KCNK9-US1 DMR in non-cancerous breast tissue. Commercially obtained breast genomic DNA (Biochain, Newark, CA, USA) was obtained for analysis. The results are shown from six women, ranging in age from 21 to 83 years old.
Cancers 13 06031 g002
Figure 3. DNA methylation of KCNK9-US1 DMR in breast cancer and microdissected mammary epithelial cells aspirates from women at high risk for breast cancer. (A) NOMe-Seq of the cloned KCNK9-US1 DMR from breast cancer cores (166, 220, and 436). Upper circles—CpG sites (in vivo methylation: open circle, unmethylated cytosine; black filled circle, methylated cytosine). Lower circles—GpC sites (in vitro methylation, chromatin structure dependent: open circle, unmethylated cytosine, closed chromatin; gray filled circle, methylated cytosine, open chromatin). Boxed region—area of transcription factor binding from ENCODE data. (B) Sequences of coding SNP rs2615374 (A/G) in cDNA from tumor cores (1284A12, 436, 1684A, 692, and 166) and normal epithelial cells (B134) heterozygous for the SNP. The position of rs2615374 used to determine allelic expression is indicated by the arrows. (C) Hypomethylation at CpG sites 1 to 5 (boxes) in the KCNK9-US1 DMR in DNA from non-cancerous mammary epithelial cell aspirates from women who are at high risk for developing breast cancer. Differentially methylated region (DMR).
Cancers 13 06031 g003
Figure 4. TASK3 expression and mitochondrial membrane potential as a function of KCNK9-US1 DMR demethylation in MCF10A cells and HMEC-15 normal cell strain. The optimal treatment conditions are 48 h for either 1.0 (red star) or 2.5 µM (green star) 5-aza-2′-deoxycytidine (5AzC) (A) Effect of 1.0 and 2.5 µM 5AzC on the DNA methylation of CpG sites 1–5 (boxes) in the KCNK9-US1 DMR in MCF10A. (B) Cell proliferation (viability) was tested using the MTT assay at 0–72 h; MCF10A cells and HMEC-15 normal cell strain were treated with 0 (blue line), 1.0 (red line), and 2.5 µM (green line) 5-AzC. Experiments were performed in triplicate. (C) Expression of TASK3 protein analyzed by western blotting at 0 and 48 h in MCF10A after treatment with 2.5 µM 5AzC and HMEC-15 normal cell strain after treatment with 1.0 and 2.5 µM 5AzC. GAPDH is used as the loading control. (D) Relative TASK3 expression in MCF10A after treatment with 2.5 µM 5AzC for 0 and 48 h and HMEC-15 normal breast cell strain after treatment with 1.0 and 2.5 µM 5AzC for 0 and 48 h. TASK3 expression was normalized to 0 h treatment (Control). Expression is for the western blots performed in triplicate for panel Figure 4C. Significant levels relative to 0 h control: *** p < 0.001. (E) JC-1 R/G ratio in MCF10A cells treated with 0, 1.0, and 2.5 µM 5AzC for 0, 24, and 48 h normalized to 0 h treatment (Control). JC-1 R/G ratio in HMEC-15 normal cell strain was treated with 0, 1.0, and 2.5 µM 5AzC for 0 and 48 h normalized to 0 h treatment (Control). Significant levels relative to 0 h control: * p < 0.05, ** p < 0.01, *** p < 0.001. Experiments were performed in triplicate. The uncropped blots and molecular weight markers are shown in Supplementary Materials.
Cancers 13 06031 g004
Figure 5. TASK3 expression and localization in breast cancer cell lines and mammary epithelial cell lines and cell strains. (A) Endogenous total TASK3 protein expression in human breast cell lines. TASK3 exhibited relatively increased expression in MDA231, DKAT, SUM149, SUM190, and HEK293 cells, but had lower expression in SUM225, HMEC15, and MCF10A cells. GAPDH serves as a loading control (n = 3 experiments). (B) Transient overexpression of TASK3-FLAG tag in the breast cancer cell line MCF10A results in expression of the exogenous construct in the mitochondria, as shown by western blotting. VDAC was used as a loading control for the mitochondrial fraction. Control untreated cells (Control), cells treated with transfection reagent alone (Txf), cells transfected with empty FLAG tag plasmid (Vec), and cells transfected with TASK3-FLAG tag plasmid. (C) Expression of the TASK3-FLAG construct by immunofluorescence. Control untreated cells (Control), cells transfected with empty FLAG tag plasmid (Vector Control), and cells transfected with TASK3-FLAG tag plasmid (TASK3-FLAG). TASK expression was detected by immunofluorescence using anti-FLAG tag antibody (Sigma-Aldrich, St. Louis, MO, USA). TASK3 transfected cells (TASK3-FLAG) were compared with those transfected with an empty vector control. (D) JC-1 Red/Green Ratio (R/G Ratio) in untreated MCF10A cells (Control), cells treated with transfection reagent alone (Txf), cells transfected with empty FLAG tag plasmid (Vec), and cells transfected with TASK3-FLAG tag plasmid (TK3). The R/G Ratio is a measure of mitochondrial membrane potential (ΔΨm), (n = 3 experiments). Significant levels relative to control: * p < 0.05, ** p < 0.01. (E) Caspase-3 activity, a measure of apoptosis initiation, normalized to DNA content in untreated MCF10A cells (Control); cells treated with transfection reagent alone (Txf); cells transfected with empty FLAG tag plasmid (Vec); and cells transfected with TASK3-FLAG tag plasmid (TK3). Cells were exposed for 4 h to either 0.0 µg/mL (grey bar) or 0.50 µg/mL (black bar) of staurosporine. Significant levels relative to cells not exposed to staurosporine: * p < 0.05, ** p < 0.01. The uncropped blots and molecular weight markers are shown in Supplementary Materials.
Cancers 13 06031 g005
Figure 6. TASK3 expression regulates mitochondrial membrane potential and sensitivity to staurosporine-induced apoptosis. (A) Expression of the dominant negative TASK3-G95E construct in TASK3-expressing cell lines HEK293, MDA231, and DKAT. TASK3 was detected by SDS-PAGE and western analysis in LSXN vector controls (LX) and cells transduced with the dominant negative construct (DNTK3). GAPDH serves as a loading control (n = 3 experiments). (B) Overexpression of TASK3 in SUM225 cells. TASK3 was detected in vector control cells (LX) and cells transduced with TASK3 (TK3) by SDS-PAGE and western analysis. GAPDH serves as a loading control (n = 3 experiments). (C) JC-1 R/G ratio in LX transfected breast cancer cell lines, and cell lines transfected with either the dominant negative TASK3-G95E (DNTK3) or the TASK3 (TK3) construct (n = 4 experiments). Significant levels relative to LX control: *** p < 0.001, **** p < 0.0001. (D) TASK3 expression and apoptosis sensitivity in breast cancer cell lines. Cells were exposed for 4 h to 0.0 µg/mL (white bar), 0.25 µg/mL (grey bar), and 0.50 µg/mL (black bar) of staurosporine. Normalized caspase-3 activity, as a measure of apoptosis, in HEK293, MDA231, and DKAT cell lines expressing the dominant-negative TASK3-G95E construct (DNTK3). Normalized caspase-3 activity was also determined in MCF10A and SUM225 cells overexpressing TASK3 (TK3). Caspase-3 expression in these cell lines was also determined in their respective LXSN vector controls (LX) (n = 3 experiments). Significant levels relative to exposed cells: * p < 0.05, ** p < 0.01, *** p < 0.001, **** p < 0.0001. The uncropped blots and molecular weight markers are shown in Supplementary Materials.
Cancers 13 06031 g006
Figure 7. KCNK9-US1 DMR methylation in breast epithelial cells aspirated from women at high risk for developing breast cancer. (A) Box plot of Masood Cytology Index Score versus KCNK9-US1 DMR methylation status. (B) Box plot of R/G ratio versus KCNK9-US1 DMR methylation status: methylation, partial hypomethylation, hypomethylation.
Cancers 13 06031 g007
Table 1. Methylation of the 5 consecutive CpG sites in the KCNK9-US1 DMR.
Individual—Tissue TypeCpG Site 1CpG Site 2CpG Sites 3 and 4CpG Site 5
Ind1—Brain0.660.70.320.34
Ind2—Brain0.680.840.340.45
Ind3—Breast0.580.570.330.35
Ind4—Breast0.30.50.230.2
Ind5—Breast0.550.660.270.3
Ind6—Liver0.420.480.570.5
Ind7—Liver0.410.460.480.34
Ind8—Testis0.670.740.50.44
Values indicate the proportion of methylated cytosines, as measured by Sequenom MassArray. The value for sites 3 and 4 is an average of both cytosines, as they are in the same cleavage fragment.
Table 2. Association between breast cancer subtype and KCNK9-US1 DMR methylation in mammary epithelial cells and white blood cells.
Patient NumberAge (Years)RaceBRCA MutationCancer SubtypeMethylation MEC Methylation WBC
139C0TNBC++
241AA0TNBCND
334AA0TNBC+
447AA0TNBCND
542AANDTNBCND
652C1TNBC+
738AA1TNBC+
849CNDTNBCND
952CNDTNBC+
1052AA0TNBC+ND
1143AA0TNBC+
1249CNDTNBC+ND
1342AANDTNBCND
1446CNDTNBC+/−ND
1550AANDTNBCND
1650AANDTNBCND
1738C1TNBC+/−+
1839C0TNBC++
1955CNDTNBC+/−++
2041AA0TNBCND
2147AA0TNBCND
2242AANDTNBCND
2345C0TNBC+ND
2436C0TNBC+/−ND
2536CNDHER2+++/−
2640CNDHER2+++
2742C0HER2++
2849AA0HER2+++
2942AANDHER2++ND
3050CNDHER2++/−ND
3153AANDHER2++/−ND
3239CNDHER2+++
3336CNDHER2+++/−
3449AANDHER2+ND
3547AANDHER2+ND
3647CNDER++++
3735L/C2ER+++
3852CNDER+++
3934AANDER++++
4042AANDER++ND
4151AANDER++/−
4248CNDER+++ND
4335C0ER+++
4448CNDER+ND
4536CNDER+ND
4628CNDER++ND
4750AANDER++ND
4853CNDER+ND
4947CNDER++++
5035CNDER+++ND
5142AANDER++ND
5249CNDER+ND
5353CNDER+ND
(AA) African-American/Black, (C) European-American/White/Caucasian, (L) Latina, (0) No BRCA1/2 mutation, (1) BRCA1 mutation, (2) BRCA2 mutation, (ND) Not Determined, (TNBC) Triple-negative breast cancer, (ER+) Estrogen receptor positive breast cancer, (HER2+) HER2/NEU overexpressing breast cancer, (DMR) Differentially methylated region, (−) Hypomethylation of KCNK9 DMR methylation (0–20% methylation), (+/−) Partial hypomethylation of KCNK9 DMR methylation (20–74% methylation), (+) Normal KCNK9 DMR methylation (75–125% methylation), (++) Hypermethylation of KCNK9 DMR (>125% methylation), (MEC) Microdissected mammary epithelial cells from breast cancer biopsy specimens, (WBC) White blood cells. Subjects are grouped by breast cancer subtype. Different colored backgrounds are used to group data.
Table 3. Analysis of KCNK9-US1 DMR methylation in mammary epithelial cells and white blood cells obtained from women ranging in age from 36 to 53.
#Age (Years)RaceBRCA MtMutationCancer SubtypeMasood R-MECMasood L-MECMethylation R-MECMethylation L-MECMethylation WBC
147CND ER+1313+++++
253CND NO1214++++
339CND HER2+2018++/−+
452C1IVS5-11T > GTNBC1522++
543AAND NO1614++
638C1M1775RTNBC1512+/−+/−+
752CND NO1915++
852CND NO1113ND++
939C0 TNBC1615+ND+
1034L/C26872del4ER+2115+ND+
1152CND TNBC16ND+/−ND++
1236CND HER2+1818+ND+/−
1355A2UVG2961SNOND15ND+/−+/−
1455C1exon 22 del 510 bpNO1413ND+/−
1551AAND ER+14NDND+/−
1649AA0 TNBC18NDND+/−
1734AA0 TNBC1423ND+
1843AA0 TNBC1420ND+
1946C0 NO915NDND++
2048CND ER+16NDNDND++
2150CND TNBC14NDNDND++
2240CND NO1213NDND+
2353CND NO1013NDND+
2451CND NO99NDND+
2551CND NO1311NDND+
2639AAND NOND9NDND+
2749AAND HER2+1718NDND+
2847AAND HER2+18NDNDND+
2949CND ER+23NDNDND+
3040CND NO1615NDND+
3141AAND NO1413NDND+
3227C0Rad50/R365Q (1094G > A) TNBC15NDNDND+/−
3345AAND NO13NDNDND
3435CND ER+1515+++ND
3542C0 NO1211+ND
3647C1MissingNO1413+/−ND
3751C1MissingNO1214ND
3841AA0 TNBC1617ND
3947AA0 TNBC1519ND
4042AAND TNBC1816ND
4145CND TNBC1919 +ND
4236CND TNBC16ND+/−NDND
4342AAND ER+1620++/−ND
4449CND ER+1620NDND
4553C0 ER+1623NDND
Number of samples available for analysis: 1–7: MEC from both breasts and WBC; 8–18: MEC from one breast and WBC; 19–33: WBC only; 34–45: MEC only, from one or both breasts. (AA) African-American, (C) Caucasian, (L) Latina, (A) Asian, (0) No BRCA1/2 mutation, (1) BRCA1 mutation, (2) BRCA2 mutation, (ND) Not Determined, (TNBC) Triple-negative breast cancer, (ER+) Estrogen receptor positive breast cancer, (HER2+) HER2/NEU overexpressing breast cancer, (NO) No cancer, (R) Right breast, (L) Left breast, (DMR) Differentially methylated region, (−) Hypomethylation of KCNK9-US1 DMR (0–20% methylation), (+/−) Partial hypomethylation of KCNK9-US1 DMR (20–74% methylation), (+) methylation of the KCNK9-US1 DMR (75–125% methylation), (++) Hypermethylation of the KCNK9-US1 DMR (>125% methylation), (MEC) Microdissected mammary epithelial cells from breast cancer biopsy, (WBC) White blood cells. Different colored backgrounds are used to group data.
Publisher’s Note: MDPI stays neutral with regard to jurisdictional claims in published maps and institutional affiliations.

