Article

Multi-Marker Immunofluorescent Staining and PD-L1 Detection on Circulating Tumour Cells from Ovarian Cancer Patients

1
School of Medical and Health Sciences, Edith Cowan University, Perth, WA 6027, Australia
2
Centre for Precision Health, Edith Cowan University, Perth, WA 6027, Australia
3
Hollywood Private Hospital, Perth, WA 6009, Australia
4
Harry Perkins Institute of Medical Research, Perth, WA 6009, Australia
5
Western Oncology, Perth, WA 6008, Australia
6
School of Biomedical Science, University of Western Australia, Perth, WA 6009, Australia
7
School of Medicine, University of Western Australia, Perth, WA 6009, Australia
8
Department of Medical Oncology, Sir Charles Gairdner Hospital, Perth, WA 6009, Australia
*
Author to whom correspondence should be addressed.
Cancers 2021, 13(24), 6225; https://doi.org/10.3390/cancers13246225
Submission received: 4 November 2021 / Revised: 5 December 2021 / Accepted: 8 December 2021 / Published: 10 December 2021

Abstract

:

Simple Summary

Circulating tumour cells (CTCs) have the potential to serve as a rich source of information for cancer diagnostic and therapeutic decisions. To fully exploit this minimally invasive diagnostic resource requires techniques that aid in enriching heterogenous populations of CTCs and markers to efficiently characterise these cells as tumour derived. In the present study we eva-luated the microfluidic enrichment of CTCs and a multi-marker staining methodology for the identification of heterogeneous CTCs in ovarian cancer (OC) patients and evaluation of PD-L1 expression. We showed, for the first time, the existence of hybrid CTCs with an epithelial/mesenchymal phenotype and their association with PD-L1 in OC. Incorporation of this method in future clinical trials can help predict immunotherapy responsiveness in OC patients.

Abstract

Detection of ovarian cancer (OC) circulating tumour cells (CTCs) is primarily based on targeting epithelial markers, thus failing to detect mesenchymal tumour cells. More importantly, the immune checkpoint inhibitor marker PD-L1 has not been demonstrated on CTCs from OC patients. An antibody staining protocol was developed and tested using SKOV-3 and OVCA432 OC cell lines. We targeted epithelial (cytokeratin (CK) and EpCAM), mesenchymal (vimentin), and OC-specific (PAX8) markers for detection of CTCs, and CD45/16 and CD31 were used for the exclusion of white blood and vascular endothelial cells, respectively. PD-L1 was used for CTC characterisation. CTCs were enriched using the Parsortix™ system from 16 OC patients. Results revealed the presence of CTCs in 10 (63%) cases. CTCs were heterogeneous, with 113/157 (72%) cells positive for CK/EpCAM (epithelial marker), 58/157 (37%) positive for vimentin (mesenchymal marker), and 17/157 (11%) for both (hybrid). PAX8 was only found in 11/157 (7%) CTCs. In addition, 62/157 (39%) CTCs were positive for PD-L1. Positivity for PD-L1 was significantly associated with the hybrid phenotype when compared with the epithelial (p = 0.007) and mesenchymal (p = 0.0009) expressing CTCs. Characterisation of CTC phenotypes in relation to clinical outcomes is needed to provide insight into the role that epithelial to mesenchymal plasticity plays in OC and its relationship with PD-L1.

1. Introduction

Circulating tumour cells (CTCs) are rare neoplastic cells found in the circulatory system, thought to be shed from primary, metastatic, or recurrent tumours. CTCs, or a proportion of them, can form micro-metastases in other organs beyond the original tumour site [1,2]. Their rarity in whole blood means that efficient methods for both enrichment and detection of CTCs are needed. The advent of new and user-friendly technologies is crucial to advancing the application of CTCs as a liquid biopsy for precision medicine [3].
The U.S. Food and Drug Administration (FDA)-approved CellSearch® system uses immunoaffinity for the capture of CTCs that express the epithelial cell adhesion molecule (EpCAM) [4]. As a result, this method may fail to isolate CTCs with a mesenchymal phenotype [5], thought to be more metastatic, and have been reported to be associated with therapy resistance and poor patient outcomes [6,7]. Epitope-independent isolation platforms have become more prevalent in recent years as they allow for enrichment of a broad spectrum of CTCs that may not express cognate antigens [3]. For example, the Parsortix™ microfluidic system isolates rare cells from bodily fluids based on cell size and compressibility [8,9].
Traditionally, detection of CTCs is restricted to 3–4 fluorescent channels using fluorescence microscopy. Consequently, CTCs are identified as nucleated cells (DAPI/Hoechst), positive for the epithelial markers EpCAM and cytokeratin, and negative for the leucocytic marker CD45 as exemplified by the CellSearch® protocol [4]. This limits the phenotypic characterisation of detected CTCs. CTCs can be phenotypically and genotypically heterogeneous, with each cell detected, representing characteristics of the tumour of origin [10]. Because of intra- and inter-tumoural heterogeneity, CTCs from cancer patients may carry epithelial traits, which can be detected by EpCAM and cytokeratin, or mesenchymal traits such as N-cadherin and vimentin [7]. Additionally, these two phenotypes are generally mutually exclusive [11]. Thus, using only epithelial markers for staining may fail to identify mesenchymal CTCs [12]. For instance, in a recent ovarian cancer (OC) study, adding anti-N-cadherin to anti-EpCAM antibodies enhanced the isolation and subsequent detection of mesenchymal CTCs [13].
A multi-marker subtyping of CTCs employing sequential fluorescent quenching and re-staining (FQR) of isolated CTCs on CellSieve® has been reported recently. The researchers used a combination of borohydride (BH4) and Tris solution as quenching agents to reduce fluorescence to a dark state, allowing subsequent fluorescence staining targeting different markers for a second [7] and third time [14]. This method allows for the detection of phenotypically heterogeneous subpopulations of rare cells and thereby, screening of multiple clinically actionable biomarkers on captured CTCs. However, although this technique is inexpensive and simple, it is time consuming, and CTCs need to be captured on specialised CellSieve® as opposed to the conventional glass slides that are usually used in routine clinical laboratories.
Ovarian cancer (OC) is histologically heterogeneous, with epithelial ovarian carcinoma making up about 90% of all cases of the disease. Epithelial ovarian carcinoma consists of four distinct histological subtypes, namely, clear cell, serous, mucinous, and endometrioid. The high grade serous ovarian carcinoma (HGSOC) subtype is the most clinically aggressive and common form of the disease [15]. Thus, techniques that enhance efficient detection of CTCs with markers of biological importance in this lethal OC subtype are warranted.
Here we describe a methodology that affords multiple rounds of FQR on enriched cells on a glass slide in a single day protocol. Using this protocol, we identified CTCs isolated using the Parsortix™ cell separation system from predominantly HGSOC patients. Moreover, we evaluated the expression of epithelial and mesenchymal markers, as well as PD-L1 on the isolated CTCs.

2. Materials and Methods

2.1. Cell Lines

The OC cell lines SKOV-3 and OVCA432 [16] were provided by Prof. Sai Wah Tsao (Li Ka Shing Faculty of Medicine, Pokfulam, HK). MCF-7 (breast cancer cell line) was obtained from the Melanoma Research Group, Edith Cowan University, WA, Australia. Cell lines were cultured in RPMI-1640 medium (Thermo Fisher Scientific, Waltham, MA, USA), supplemented with 5% foetal bovine serum (FBS) (Thermo Fisher Scientific).
The cultures were maintained at 37 °C in a humidified atmosphere containing 5% (v/v) CO2 until 80% confluence. Cell lines were trypsinised using 0.5% trypsin-EDTA (Thermo Fisher Scientific) diluted to 0.05% with 1X phosphate-buffered saline (PBS) solution (Thermo Fisher Scientific). The mean cell diameter of the two cell lines was measured using the Countess® II FL automated cell counter (Thermo Fisher Scientific).

2.2. Optimisation of Antibodies for Immunostaining

For optimisation of antibodies, cell lines were cultured for 24 h on coverslips in 6-well plates (5 to 7 passages were done after thawing from liquid nitrogen before growing cells on the coverslip). Cells were washed with PBS and immediately fixed with 4% paraformaldehyde for 10 min. Cells were then permeabilised and blocked with antibody buffer containing 3% Bovine Serum Albumin (BSA) (Bovogen Biologicals Pty Ltd., East Keilor, VIC, Australia), 0.2% Triton X-100 (Sigma Aldrich, St. Louis, MO, USA) in PBS, 1 M glycine, 10% normal donkey serum (NDS) (Sigma Aldrich), and FcR blocking reagent (Miltenyi Biotech, Bergisch Gladbach, Germany) for 15 min at room temperature. The following antibodies were tested and optimised individually on the cell lines in a staining buffer containing 10% NDS, 3% BSA, 0.2% Triton X-100 PBS solution: FITC-labelled anti-Cytokeratin (1:50) (CK3-6H5, Miltenyi Biotec), FITC-labelled anti-EpCAM (1:100) (VU-1D9, Thermo Fisher Scientific), AlexaFluor 647-labelled anti-PD-L1 (1:100) (clone 28-8, Abcam, Cambridge, UK), AlexaFluor 488-labelled anti-PAX8 (1:100) (clone EPR18715, Abcam) and AlexaFluor 647-labelled anti-vimentin (1:1000) (clone V9, Abcam). Anti-PAX8 is an ovarian cancer-specific antibody with a nuclear staining pattern that has been used to stain carcinomas of the ovary [17,18]. Optimisation of the nuclear stain (PAX8 antibody) was done using SKOV-3 as a positive cell line and MCF-7 as the negative control (Figure S1).
For testing PD-L1 expression, the cell lines (SKOV-3 and OVCA432) were incubated with 100 ng/mL interferon-gamma (IFN-γ) (Shenandoah Biotechnology, Warwick, PA, USA) for 24 h to induce the expression of PD-L1 [19]. Additionally, we employed a combination of PE-labelled anti-CD45 (1:50) (clone HI30, BD Biosciences, San Jose, CA, USA), the traditional negative selection marker, and PE-labelled anti-CD16 (1:50) (clone 3G8, Biolegend, San Diego, CA, USA) for white blood cell (WBC) staining. The additive effect of these two markers improved the staining coverage of WBCs [20] compared to their individual use (Figure S2). PE-labelled anti-CD31 (1:50) (clone WM59, BD Biosciences) was also used to exclude vascular endothelial cells in the enriched samples.

2.3. Spiking Experiment and Enrichment Platform

We tested the recovery rate (capture efficiency) of the OC cell lines (SKOV-3 and OVCA432) spiked into 7.5 mL fresh blood from female healthy control subjects using the semi-automated microfluidic device Parsortix™ (Angle plc, Guildford, Surrey, UK). The separation was run at the default pressure setting of 99 mbar. The isolation of the spiked cell lines in the blood occurred in a disposable microscope slide-sized cassette with a final separation size of 6.5 µm. Firstly, 50 cells (each from SKOV-3 and OVCA432) were harvested from culture flasks using 0.5% trypsin-EDTA and were manually counted and directly spiked into fresh whole blood samples from healthy female volunteers. The spiking experiment was carried out in duplicate for both cell lines. After enrichment with the Parsortix™, captured cells were re-suspended in PBS containing 2% paraformaldehyde (fixation) for 10 min, cytospun (Cytospin™ 4, Thermo Fisher Scientific) onto glass slides (Shandon™ Single Cytoslides™, Thermo Fisher Scientific) at a speed of 2000 rpm for 5 min. The glass slides were immune-stained, and the recovery rate of cells determined.

2.4. Immunostaining of Spiked Cells and CTCs on Glass Slides Using the Fluorescent Quenching and Re-Staining Method

We employed the sequential FQR method adapted from Adams et al. [14,21] for detection of spiked cell lines and subsequently extended this approach for the staining of CTCs isolated from HGSOC patient samples. Briefly, enriched cells on glass slides were first permeabilised and blocked with 3% BSA, 0.2% Triton X-100, PBS, 1 M glycine, 10% NDS, FcR blocking reagent solution for 15 min at room temperature. Cells were then incubated for 60 min with the first antibody panel consisting of FITC-labelled anti-Cytokeratin and anti-EpCAM, Phycoerythrin (PE)-labelled anti-CD45 and anti-CD16, and Alexa Fluor 647-labelled anti-PD-L1. The antibodies were removed and 2 µg/mL of the nuclei staining dye, Hoechst 33342 (Thermo Fisher Scientific), was added for 15 min. Cells were washed with 1% BSA-PBS and then finally with PBS.
For fluorescent imaging, a wet mounting approach was used instead of the traditional resinous/adhesive mountants (Figures S3 and S4). Briefly, a silicone isolator was immediately placed on the glass slide encircling the area marked on the slide where the cells were located. PBS (200 µL) was put in the circular space containing the cells, enabling immediate or same-day imaging of stained slides. Cells were immediately visualised and scanned using the inverted fluorescent microscope (Eclipse Ti-E, Nikon®, Tokyo, Japan), and analysed using the NIS-Elements High Content Analysis software (version 4.2).
After microscopy, the silicone isolator was removed and fluorescent markers on the cells quenched using 1 mg/mL BH4 solution followed by 100 mM Tris (pH = 9.0) as reported earlier [21] using the FQR method, with few modifications. Briefly, the silicone isolator was removed, and the glass slides were incubated (room temperature) in freshly prepared BH4 solution for 90 min (two times). Slides were then washed in changes of PBS (5 min, six times). It was then incubated in Tris solution for 60 min and washed in changes of PBS (2 min, three times). Cells were re-stained using the second antibody panel comprising Alexa Fluor 488-labelled anti-PAX8, PE-labelled CD31 and Alexa Fluor 647-labelled anti-vimentin in the staining solution. The silicone isolator was placed on the slide and PBS added as done earlier, and the slide re-imaged.
During fluorescent imaging, x/y placement of cells was recorded in the first staining panel to aid the relocation of previously imaged cells in the second staining after quenching. Morphologically intact nucleated cells (Hoechstpos) that are CKpos/EpCAMpos/vimentinpos/PAX8pos, with or without PD-L1 expression, and CD45neg/CD16neg/CD31neg were interpreted as recovered cell lines or CTCs. The SKOV-3 cell line was used for the optimisation of the quenching method (Figure S5). For final image processing of the first and second staining, ImageJ (Version 1.52a, National Institutes of Health, Bethesda, MD, USA) was used to overlay the individual channels into a final merged image of cell lines and CTCs.
After re-imaging, the slides were mounted with Fluoromount GoldTM with DAPI (Thermo Fisher Scientific), covered with a coverslip, and stored at 4 °C for future use.

2.5. Isolation and Detection of CTCs from the Blood of Patients and Healthy Controls

A total of 16 whole blood samples from 16 OC patients were collected for this study. Fifteen (15) were of the HGSOC subtype, while one patient had mucinous borderline (Table 1). Five (5) healthy female volunteers (age: 28–55) donated blood for the study. Both healthy volunteers and HGSOC patients signed consent forms approved by the Human Research Ethics Committees at Edith Cowan University (No. 18957) and Sir Charles Gairdner Hospital (No. 2013-246 and RGS0000003289). For each participant, an SST (BD Biosciences) was used to draw approximately 4 mL of blood as a discard to avoid contamination from epithelial and endothelial cells from the skin and blood vessels, respectively. Then, 7 to 10 mL of whole blood was collected in BD Vacutainer K2 EDTA tubes (BD Biosciences). Blood samples were processed within 6 h post collection. CTCs were enriched from whole blood samples using the Parsortix™ and subsequently stained using the immunostaining protocol described above.
The total number of WBCs (CD16pos/45pos) in the Parsortix™-enriched cell fractions were quantified in samples from healthy volunteers and patients (Figure S6).

2.6. Statistical Analysis

Cell sizes were compared using Student’s t-test. The frequency of PD-L1-expressing CTCs across different subpopulations was compared using Fisher’s exact test. All graphs and statistical analyses were done using the GraphPad Prism (version 6.01, San Diego, CA, USA).

3. Results

3.1. Phenotypic Characterisation of OC Cell Lines

Immunocytochemistry (ICC) staining of the OC cell lines SKOV-3 and OVCA432 cultured on coverslips showed differential expression of EpCAM, CK, and vimentin (Figure 1). Both cell lines were positive for the OC-specific nuclei marker PAX-8. The more cluster forming cell line, OVCA432, showed high expression of the epithelial markers EpCAM and CK, while the less cluster forming and larger cell line, SKOV-3, generally demonstrated very weak expression for EpCAM and strong expression of the mesenchymal marker vimentin [22]. CK expression, however, was present in a few highly stained cells studded among numerous weakly stained SKOV-3 cells. Thus, the ICC staining categorised the two OC cell lines into a more epithelial (OVCA432) and a more mesenchymal (SKOV-3) phenotype.
Following 24-h induction with IFN-γ, SKOV-3 cells also demonstrated moderate expression of PD-L1. However, OVCA432 cells showed very weak to negative expression of PD-L1, even in the presence of IFN-γ. These results suggested a high association of PD-L1 expression to the more mesenchymal cell line, SKOV-3, in agreement with an earlier report [23]. On the other hand, prior information on PD-L1 expression post-IFN-γ induction in OVCA432 was lacking.

3.2. Immunocytochemistry of Spiked Cell Lines

We spiked the two OC cell lines into 7.5 mL of whole blood from healthy female individuals, enriched with the Parsortix™ system and subsequently detected by ICC. Spiked cell lines (Figure 2) demonstrated similar staining patterns as those cultured and stained on the coverslip (Figure 1). SKOV-3 was found to have moderate to low expression of the epithelial markers (CK/EpCAM), moderate expression of PD-L1, and high expression of the mesenchymal marker (vimentin). By contrast, OVCA432 showed high expression of CK/EpCAM and a lack of PD-L1 and vimentin expression. Both cell lines, however, showed moderate to high expression of nuclear marker PAX8.
Of note, the microfluidic device isolated clusters of cells spiked into the healthy control blood (Figure 2). Overall, the combination of our staining protocol and the use of the microfluidic device appeared to be useful in isolating and detecting single or clustered cells; this method could potentially be extended to the enrichment and detection of these heterogeneous subpopulations of cells in patient blood samples.

3.3. Recovery Rate of Spiked Cells

To determine the efficiency of the microfluidic Parsortix™ device to isolate OC CTCs of different cell sizes, blood samples from healthy controls were spiked with 50 cells (each from SKOV-3 and OVCA432). The spiking experiment was carried out in duplicate for both cell lines. Following enrichment with the Parsortix™ system, cells were then cytospun onto the glass slides and stained. In addition, blood samples (no spike) from three healthy females were used as negative controls. The control together with the spiked samples were stained and analysed. The healthy control slides were negative for the tumour markers (CK/EpCAM, PAX8 and vimentin), but a few WBCs showed co-expression of PD-L1 and CD16/45.
SKOV-3 and OVCA432 had a mean recovery rate of 89 and 71%, respectively, depicting a lower capture rate for OVCA432 relative to SKOV-3 cells. Comparing the mean diameters of the two cell lines (n = 10), OVCA432 was considered the smallest with a mean cell diameter of 13 μm versus 17 μm for SKOV-3. The mean cell diameter significantly differed between these two OC cell lines (p = 0.0019) (Figure 3). The difference in the cell diameter combined with deformability could account for the difference in the recovery rates observed earlier. Obermayr et al. worked with a final separating cassette gap size of 10 µm, which will not be able to capture as many spiked cells [24]. Alternative cassette sizes (6.5 and 8 µm) have been developed by the manufacturer (Angle plc). Comparing the 6.5 and 10 µm cassettes, the 6.5 µm demonstrated a significantly higher capture rate than the latter when spiked in whole blood in EDTA tubes (discussed in [25]). We used a 6.5 µm final cassette gap size, which had a higher capture rate (~66–92%) [8], thus our results.

3.4. CTC Detection from Patient Blood

Following successful immunostaining of the OC cell lines, the methodology was applied to the analysis of blood samples obtained from OC patients. We enrolled a total of 16 women with OC, mostly newly diagnosed. Their characteristics are shown in Table 1. The median age at diagnosis was 68 years (range 50–83 years). All but one patient had a HGSOC histology, with one patient having a mucinous borderline tumour. The FIGO stages were predominantly IIIC and IV, with two stage I (IA and IC). Ten (10) newly diagnosed OC patients had three cycles of platinum-taxane-based neoadjuvant chemotherapy (NACT), and the others underwent upfront debulking surgery. Interval debulking surgery and evaluation of chemotherapy response score (CRS) was performed for eight individuals. Three (3) of the NACT group (OC 1362, 1364, and 1458) did not undergo interval debulking surgery. OC 1362 and 1364 had progressive disease (PD) after 1st line NACT, while OC 1458, on the other hand, died before the completion of the NACT.
Our immunostaining method successfully aided in the identification of CTCs in 63% (10/16) of the patients, with numbers ranging from 2–49 CTCs (median = 4) in 8 mL of blood. A total of 157 CTCs were identified in the blood of the 10 CTC-positive cases. Table 2 summarises the CTCs detected using each of the markers.
Figure 4 shows the differential expression of markers from representative CTCs detected in these patients. CTCs were heterogenous, 113 cells were CKpos/EpCAMpos and 58 cells were vimentinpos (Table 2). Of these, 17 (11%) cells were positive for both epithelial and mesenchymal markers (Hybrid CTCs: H-CTCs), while 96 (61%) were exclusively epithelial CTCs (E-CTCs) and 41 (26%) mesenchymal CTCs (M-CTCs). Eleven cells expressed the marker PAX8, with only three (2%) cells expressing PAX8 alone. Samples from recurrence HGSOC patients (OC 714 and 1388) had more M-CTCs (4 and 6) as compared to E-CTCs (2 and 3) (Table 2). Samples from newly diagnosed patients, however, showed no preference for either M- or E-CTCs; some cases (OC 1362, 1364, and 1382) showed enrichment of predominantly E-CTCs, while others (OC 1251 and 1423) showed CTCs that were M-CTCs. In one case (OC 1423), we identified two CTC clusters, ranging from 6–11 cell per cluster. All the clusters were vimentinpos, belonging to the M-CTC phenotype (Figure 5).

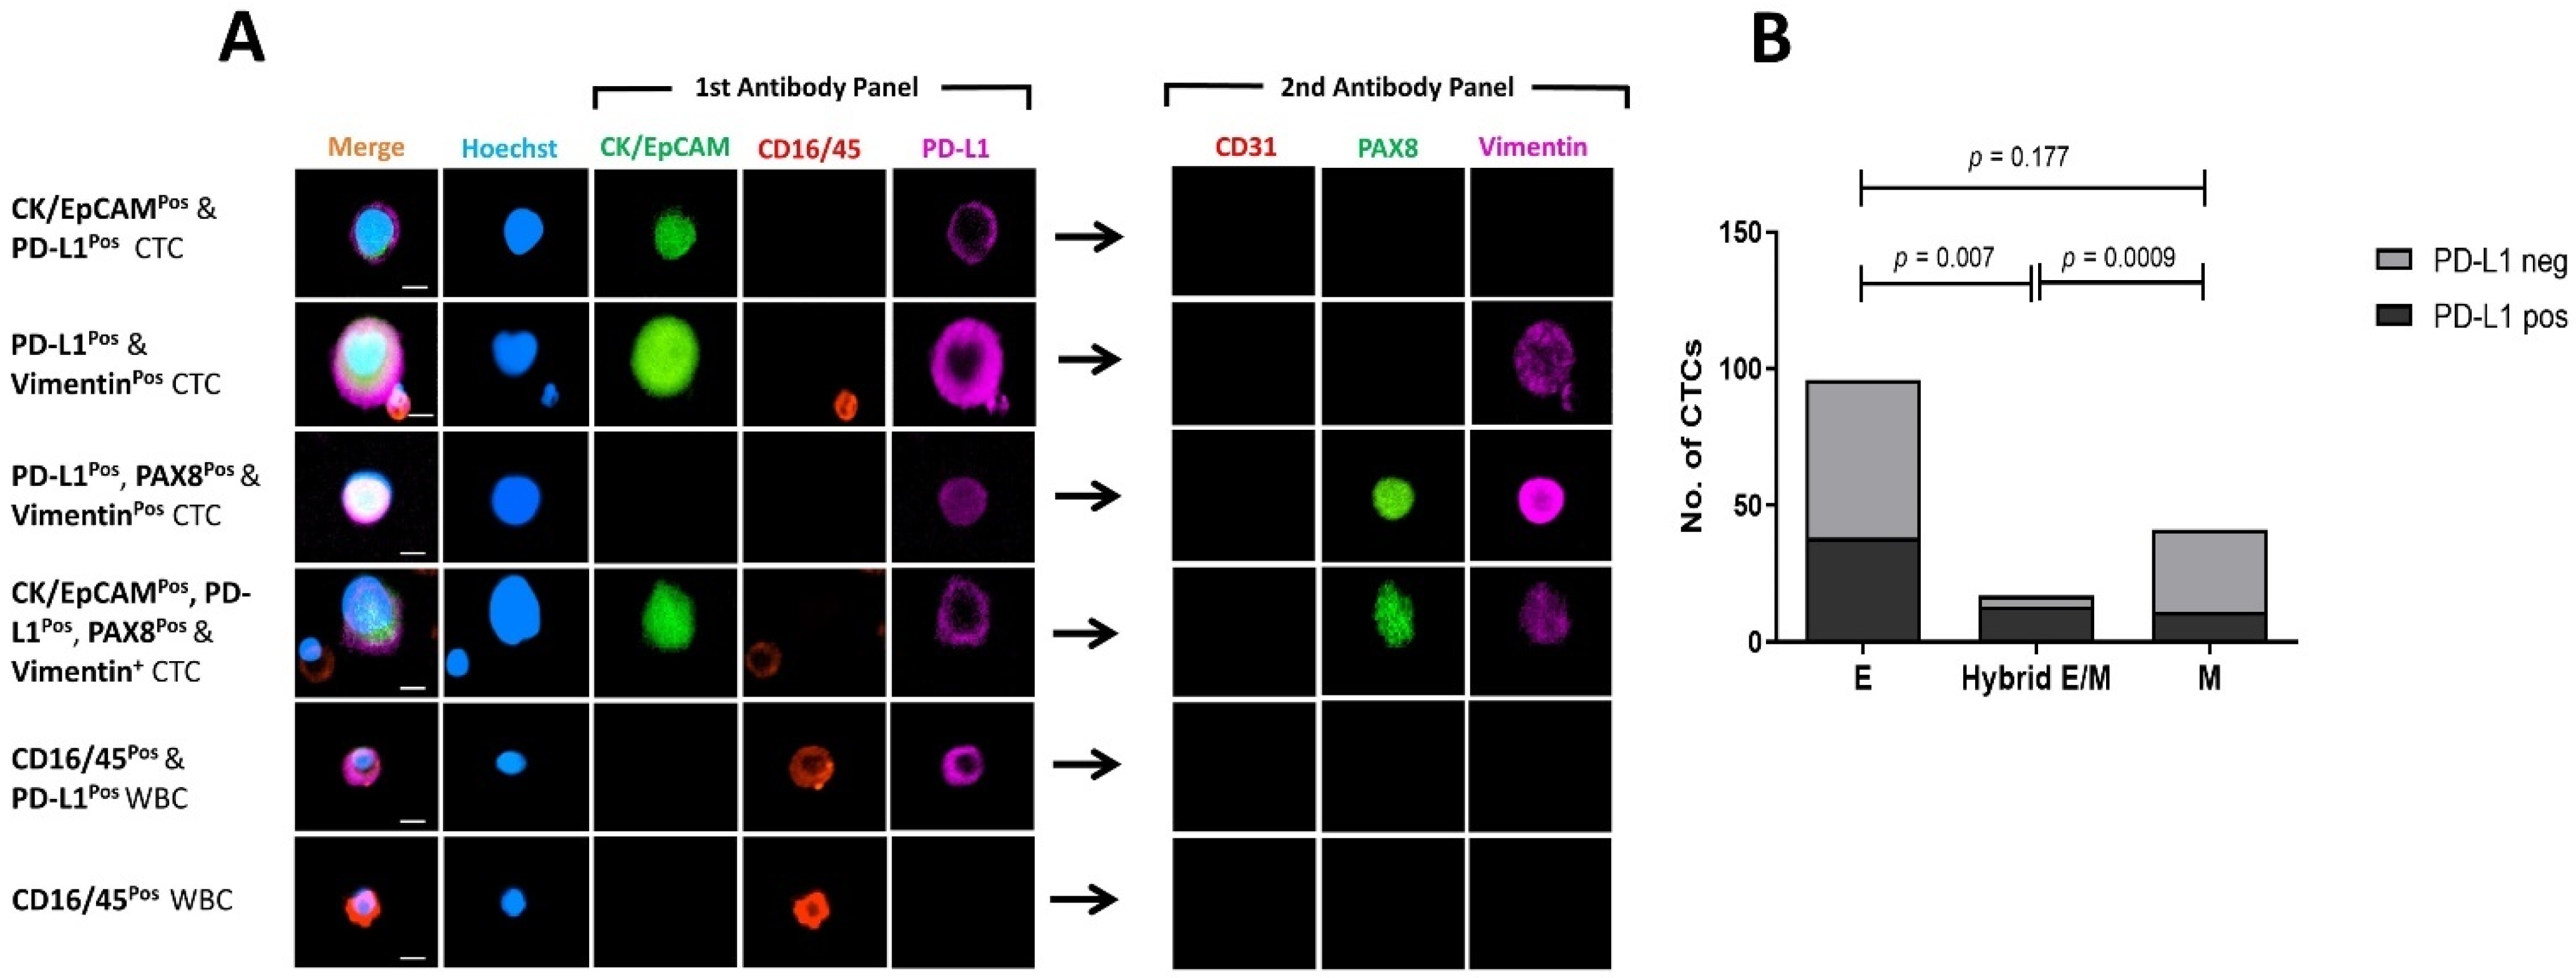
3.5. Marker Co-Expression and Exclusion of CD31pos Endothelial Cells

Double positive cells comprising CKpos/EpCAMpos and CD16pos/45pos, vimentinpos and CD16pos/45pos, CKpos/EpCAMpos and CD31pos, or vimentinpos and CD31pos were not considered as CTCs, thus are not included in Table 2. The number of CD31pos endothelial cells identified in OC patients and healthy volunteers and the marker they expressed are tabulated in Table S1. Notably, expression of CK/EpCAM was identified in 13 (39%) of these cells. This finding was unexpected and highly relevant, as CD45neg/CKpos/EpCAMpos cells are always defined as CTCs, and CD31 is uncommonly used as an exclusion marker in CTC studies.
The combined expression of both CK/EpCAM and vimentin (CTC markers) on the endothelial cells were seen in 22 (67%) (Table S1) of the cells, thus reducing potential false positives of our CTC markers. Normally, classical vascular endothelial cells should have the expression of CD31 and vimentin (Figure 6a,b). In our study, most vascular endothelial cells identified from the OC patients that were CK/EpCAM and PD-L1 positive had no expression of vimentin (Figure 6c–e).

3.6. Comparing PD-L1 Expression on Mesenchymal and Epithelial CTCs

PD-L1 was predominantly expressed on single CTCs as shown in Figure 4, Figure 6 and Figure 7. Of the 157 CTCs detected in 10 OC patients, 62 were found to express PD-L1. Only five patients had PD-L1pos CTCs (Table 2), representing 50% of the patients with detectable CTCs. PD-L1pos CTCs predominantly showed moderate expression of the PD-L1 marker, whether membranous or cytoplasmic (Figure 7A).
We further analysed PD-L1 expression relative to its epithelial or mesenchymal phenotype (Figure 7B). PD-L1pos CTCs accounted for 11/41 (27%) M-CTCs and 38/96 (40%) E-CTCs (Fisher’s exact test, p = 0.177). PD-L1pos CTCs were more common among H-CTCs, representing 13/17 (76%) of these cells. Positivity for PD-L1 was significantly associated with H-CTCs when compared with epithelial (p = 0.007) and mesenchymal (p = 0.0009) CTCs (Fisher’s exact test). Overall, our results suggested an association between PD-L1 expression and a hybrid phenotype in OC-derived CTCs.

4. Discussion

The evolution of new technologies to aid efficient enrichment and subsequent detection of CTCs has been key to the recent advancement in the analysis of these rare blood cells [26]. Nonetheless, the lack of standardised protocols necessitates more robust and user-friendly technologies, which are paramount to galvanising CTC analysis into a reliable diagnostic and prognostic tool. This pilot study affirmed the potential use of label-free CTC enrichment and sequential multi-marker staining methods to effectively detect heterogeneous epithelial (CK/EpCAMpos) and mesenchymal (vimentinpos) CTCs in OC patients.
Assessment of markers for enumeration and phenotypic characterisation of CTCs derived from OC patients demonstrated that CTCs are indeed heterogeneous, bearing markers of either the epithelial (CKpos/EpCAMpos) [27,28,29,30] and/or mesenchymal [13,31] phenotype. Expression of CK and EpCAM can be downregulated or entirely lost during epithelial–mesenchymal transition (EMT), thus, M-CTCs can be missed by enrichment platforms that are EpCAM-based [5]. Hence, the isolation platform and the panel of markers used for CTC detection must be carefully considered to ensure accurate detection of these heterogeneous subsets of CTCs in patient’s blood.
Enrichment of CTCs has been daunting, given their extreme rarity in the circulatory system compared with WBCs. The platform used in the current study, Parsortix™, enriches CTCs based on cell size and deformability. Reports from multiple studies have demonstrated the potential of this microfluidic device to enrich CTCs with both epithelial and mesenchymal characteristics, detected either by immunocytochemistry [32] or by downstream transcripts analysis [24,33], to evaluate disease burden, progression, recurrence, and therapy responsiveness.
In a recent study employing the FQR method, the authors reported that CTCs must necessarily be positive for either of the epithelial markers, EpCAM or cytokeratin, before qualifying for analysis in the second round of re-staining [7]. We argue that important CTC subpopulations such as the M-CTCs could potentially be missed. Thus, CD45neg/CD16neg cells should be scrutinised for mesenchymal markers in the second-round staining. We recommend the use of both CD16 and CD45 for detecting enriched WBCs, as the additive effect of these two markers has been reported to improve the staining coverage of WBCs [20], re-enforcing the accuracy and reliability of the CTC results obtained, whether E-CTCs or M-CTCs.
Moreover, additional exclusion markers should be considered when assessing CTCs. As shown in the current study, a couple of CD45neg/CD16neg cells expressed CD31. Some of these cells would have been deemed as CTCs owing to their expression of CK/EpCAM and/or vimentin. Hence, the inclusion of vascular endothelial markers for the exclusion of circulating endothelial cells is crucial, thus reducing false positivity [13].
Our multi-marker approach allowed for efficient detection of E-CTCs, M-CTCs, and H-CTCs in the blood of HGSOC patients. E-CTCs as well as M-CTCs were found in most CTCpos newly diagnosed OC patients. Notably both patients with recurrent OC also had M-CTCs. Although in a very low number of cases, this observation corresponded with a previous study result in OC, where samples from patients who underwent platinum-based chemotherapeutic regimens were found to be enriched for CTCs with mesenchymal traits [6]. The association of M-CTCs with therapy resistance has also been demonstrated previously in CTCs from breast [34] and prostate cancer patients [35].
Multiple studies have consistently demonstrated that the addition of the mesenchymal marker, N-cadherin, increases the capture rate of CTCs in OC CTC studies [13,36]. Furthermore, recent studies in OC have demonstrated the presence of mesenchymal CTCs by the expression of vimentin and their association with a poor clinical outcome [37,38].
In this study, we observed clusters of CTCs in one of the samples. Similar to an earlier report on breast cancer [34], CTC clusters were predominantly M-CTCs. Moreover, CTC clusters have been consistently demonstrated to be associated with poor patient outcome and higher metastatic potential than single CTCs in breast cancer patients [39,40]. Clusters of CTCs have also been detected in patients with OC using a conductive nano-roughened microfluidic device and were significantly associated with shorter progression-free survival (PFS) and platinum drug resistance [41].
In recent years, much attention has been given to PD-L1 because of its major role in sustaining an immunosuppressive tumour microenvironment by negatively regulating anti-tumour responses and causing anergy or exhaustion of program death receptor 1 (PD-1)-expressing T cells [42,43]. Current antibody therapies have been developed to block PD-1/PD-L1 immune interaction, to boost endogenous anti-tumour activity [44]. Anti-PD1 and anti-PDL1 targeted therapies have significantly improved the clinical outcome of patients (especially those with PD-L1-positive tumour cells, or tumour and immune cells) afflicted by various type of cancers and are currently undergoing clinical trials for patients with OC [45,46].
PD-L1 expression on CTCs from patients with multiple cancer types has been reported [47,48,49,50]. The use of different anti-PD-L1 antibody clones in these studies may explain the result discrepancies, also observed on tumour tissue staining. Thus, careful consideration was given to the selection of the 28-8 clone for our study, based on results from phase II of the Blueprint PD-L1 IHC assay (BP2) demonstrating the clinical validity and interchangeability of three different antibody clones (22C3, 28-8, and SP263) [51].
Our results revealed a significant number of PD-L1pos CTCs from HGSOC patients. This study will be useful to investigate PD-L1 expression as a biomarker for inclusion in future immunotherapy clinical trials in OC as well as other cancers, to evaluate its utility to select for patients who can respond better to immunotherapeutic regimens.
Multiple studies have demonstrated the association of PD-L1 with tumours bearing a mesenchymal phenotype and its link with malignant progression [52,53,54]. Notably, in our study, PD-L1 expression was found to be associated with the H-CTCs. A similar observation was reported in a study using non-small cell lung cancer patients, where PD-L1pos mesenchymal CTCs were associated with poor survival outcomes [7]. Moreover, PD-L1 expression on vascular endothelial cells has also been an area of interest in oncology [55]. For example, the expression of PD-L1 in circulating endothelial cells from patients with non-small cell lung cancer undergoing immunotherapy has been associated with poor outcomes [56], thus highlighting the idea of a potential combined anti-angiogenic agent and immunotherapy prescription for these individuals. Hence, the detection of CD31pos cells expressing PD-L1 in the current study may be of relevance and warrant further scrutiny in future OC CTC studies. Type-specific antigens have been targeted for the detection of CTCs in breast cancer (HER-2) [57], melanoma (MEL and MCSP) [58], and OC (HE4) [31], and their detection rates (low to high) vary with each cancer type. The expression of OC-specific marker PAX8 was found at very low frequency on the CTCs detected in our study, although it is highly expressed in OC with serous tumours [17,18]. PAX8 is a transcription factor, and its expression levels may vary during the cell cycle. In addition, low PAX8 expression may partly be explained by the downregulation or total loss of tumour markers with time in the circulatory system, as reported earlier [11,59]. Furthermore, transcriptomic analysis has revealed that disseminated tumour cells and CTCs after reaching a new metastatic site may undergo an organ-specific mimetism and may leave that site with a new organ-specific signature [60,61]. Organ-specific mimetism has the potential to affect the expression of known markers associated with the primary tumour of origin, thus partially explaining the low PAX8 expression levels detected in the CTCs from the OC cases used in the current research.
One limitation of the study is that downstream molecular analysis was not carried out for the validation of the detected CTCs, especially those that were vimentinpos. Future work should involve the retrieval of these cells from the glass slides for analysis of tumour-associated genomic aberration by adapting reported methodologies [62,63]. Also, the inclusion of other markers of invasiveness, such as CD44 and E-cadherin [64], could be added to the panel for further characterisation of the CTCs in future studies.

5. Conclusions

Our immunostaining protocol shows the feasibility of carrying out multiple rounds of fluorescence immunostaining of CTCs on a glass slide enriched from HGSOC patients. We propose that beyond simple quantification of CTCs, future studies on OC CTCs should focus on the phenotypic heterogeneity of CTCs. Importantly, our results underscore the need to understand the biological and clinical implications of hybrid epithelial–mesenchymal CTCs in OC patients and their association with PD-L1 expression.

Supplementary Materials

The following are available online at https://www.mdpi.com/article/10.3390/cancers13246225/s1, Figure S1: Micrograph showing MCF-7 showing no expression of the nuclei marker PAX8. PAX8 antibody conjugated with AF488, Figure S2: Photomicrograph depicting WBCs stained with CD45 conjugated to PE (red) and CD16 conjugated to Cy5 (purple), Figure S3: Photomicrograph of a slide with SKOV-3 cells after fluorescent quenching and re-staining with vimentin using the prolong GoldTM mountant, Figure S4: Photomicrograph of a slide with SKOV-3 cells after fluorescent quenching and re-staining with vimentin and subsequently mounting with Fluoromount GoldTM with DAPI, Figure S5: Photomicrograph showing evidence of quenching the 1st fluorescent markers (CK/EpCAM and PD-L1) and re-staining post-quenching with new markers (PAX8 and Vimentin), Figure S6: WBC count in cancer patients and healthy female blood donors, Table S1: Frequency of detected CD31pos cells and co-expression of the CTC markers in the OC patients and female healthy volunteers.

Author Contributions

Conceptualisation: D.-B.A., E.S.G. Patient recruitment and data collection: T.M.M., G.R.K.A.M., S.G. Data curation and analysis: D.-B.A. Method optimisation: D.-B.A., W.L., I.S., P.v.M., E.A., A.B.B., M.M. Funding acquisition: L.C., T.M.M., M.Z., E.S.G. Writing—original draft: D.-B.A. Study supervision: E.S.G., T.M.M., L.C., A.B.B., M.Z. Writing—review and editing. All authors have read and agreed to the published version of the manuscript.

Funding

D.-B.A. is supported by an Edith Cowan University Scholarship. E.S.G. is supported by a fellowship from the Cancer Council, Western Australia. This study was funded by a grant from the Australia New Zealand Gynaecological Oncology Group (ANZGOG) to T.M.M., E.S.G. and L.C.

Institutional Review Board Statement

The study was conducted according to the guidelines of the Declaration of Helsinki and approved by the Institutional Ethics Committee of Edith Cowan University (protocol code/No. 18957; 01/28/2019).

Informed Consent Statement

Informed consent was obtained from all subjects involved in the study. Both healthy volunteers and HGSOC patients signed consent forms approved by the Human Research Ethics Committees at Edith Cowan University (HREC No. 18957) and Sir Charles Gairdner Hospital (No. 2013-246 and RGS0000003289).

Data Availability Statement

All relevant data has been presented in the article. Raw images of reported results have been stored at the School of Medical and Health Sciences and at the Centre for Precision Health, Edith Cowan University.

Acknowledgments

The authors wish to acknowledge Daniel L. Adams (Creatv Microtech, Inc.), who originally reported the quenching method on CTCs, for his advice on the quenching method used in our study. We wish to thank Sai Wah Tsao for providing the ovarian cancer cell lines used in this study. We also wish to acknowledge the input of Maria Bailin and Afaf Abed, who helped in the taking of samples and recruitment of patients, respectively. A big thank you goes to Ashleigh McAvoy, who helped in the collection of clinical information from patients. We also wish to extend our sincere gratitude to all the patients and healthy female volunteers who contributed to this study.

Conflicts of Interest

The authors declare no conflict of interest.

References

  1. Pantel, K.; Brakenhoff, R.H. Dissecting the metastatic cascade. Nat. Rev. Cancer 2004, 4, 448–456. [Google Scholar] [CrossRef]
  2. Pantel, K.; Alix-Panabières, C. Liquid biopsy and minimal residual disease—latest advances and implications for cure. Nat. Rev. Clin. Oncol. 2019, 16, 409–424. [Google Scholar] [CrossRef]
  3. Alix-Panabières, C.; Pantel, K. Challenges in circulating tumour cell research. Nat. Rev. Cancer 2014, 14, 623–631. [Google Scholar] [CrossRef]
  4. Allard, W.J.; Matera, J.; Miller, M.C.; Repollet, M.; Connelly, M.C.; Rao, C.; Tibbe, A.G.; Uhr, J.W.; Terstappen, L.W. Tumor cells circulate in the peripheral blood of all major carcinomas but not in healthy subjects or patients with nonmalignant diseases. Clin. Cancer Res. 2004, 10, 6897–6904. [Google Scholar] [CrossRef] [PubMed] [Green Version]
  5. Wang, L.; Balasubramanian, P.; Chen, A.P.; Kummar, S.; Evrard, Y.A.; Kinders, R.J. Promise and limits of the CellSearch platform for evaluating pharmacodynamics in circulating tumor cells. Semin Oncol. 2016, 43, 464–475. [Google Scholar] [CrossRef] [Green Version]
  6. Chebouti, I.; Kasimir-Bauer, S.; Buderath, P.; Wimberger, P.; Hauch, S.; Kimmig, R.; Kuhlmann, J.D. EMT-like circulating tumor cells in ovarian cancer patients are enriched by platinum-based chemotherapy. Oncotarget 2017, 8, 48820. [Google Scholar] [CrossRef] [PubMed] [Green Version]
  7. Manjunath, Y.; Upparahalli, S.V.; Avella, D.M.; Deroche, C.B.; Kimchi, E.T.; Staveley-O’Carroll, K.F.; Smith, C.J.; Li, G.; Kaifi, J.T. PD-L1 expression with epithelial mesenchymal transition of circulating tumor cells is associated with poor survival in curatively resected non-small cell lung cancer. Cancers 2019, 11, 806. [Google Scholar] [CrossRef] [PubMed] [Green Version]
  8. Miller, M.C.; Robinson, P.S.; Wagner, C.; O’Shannessy, D.J. The Parsortix™ cell separation system—A versatile liquid biopsy platform. Cytom. Part A 2018, 93, 1234–1239. [Google Scholar] [CrossRef]
  9. Hvichia, G.; Parveen, Z.; Wagner, C.; Janning, M.; Quidde, J.; Stein, A.; Müller, V.; Loges, S.; Neves, R.; Stoecklein, N. A novel microfluidic platform for size and deformability based separation and the subsequent molecular characterization of viable circulating tumor cells. Int. J. Cancer 2016, 138, 2894–2904. [Google Scholar] [CrossRef]
  10. Scher, H.I.; Graf, R.P.; Schreiber, N.A.; McLaughlin, B.; Jendrisak, A.; Wang, Y.; Lee, J.; Greene, S.; Krupa, R.; Lu, D. Phenotypic heterogeneity of circulating tumor cells informs clinical decisions between AR signaling inhibitors and taxanes in metastatic prostate cancer. Cancer Res. 2017, 77, 5687–5698. [Google Scholar] [CrossRef] [Green Version]
  11. Gorges, T.M.; Tinhofer, I.; Drosch, M.; Röse, L.; Zollner, T.M.; Krahn, T.; Von Ahsen, O. Circulating tumour cells escape from EpCAM-based detection due to epithelial-to-mesenchymal transition. BMC Cancer 2012, 12, 178. [Google Scholar] [CrossRef] [PubMed] [Green Version]
  12. Asante, D.-B.; Calapre, L.; Ziman, M.; Meniawy, T.M.; Gray, E.S. Liquid biopsy in ovarian cancer using circulating tumor DNA and cells: Ready for prime time? Cancer Lett. 2020, 468, 59–71. [Google Scholar] [CrossRef] [PubMed]
  13. Po, J.W.; Roohullah, A.; Lynch, D.; DeFazio, A.; Harrison, M.; Harnett, P.R.; Kennedy, C.; de Souza, P.; Becker, T.M. Improved ovarian cancer EMT-CTC isolation by immunomagnetic targeting of epithelial EpCAM and mesenchymal N-cadherin. J. Circ. Biomark. 2018, 7, 1849454418782617. [Google Scholar] [CrossRef] [PubMed] [Green Version]
  14. Adams, D.L.; Alpaugh, R.K.; Tsai, S.; Tang, C.-M.; Stefansson, S. Multi-Phenotypic subtyping of circulating tumor cells using sequential fluorescent quenching and restaining. Sci. Rep. 2016, 6, 33488. [Google Scholar] [CrossRef] [PubMed] [Green Version]
  15. Lisio, M.-A.; Fu, L.; Goyeneche, A.; Gao, Z.-h.; Telleria, C. High-grade serous ovarian cancer: Basic sciences, clinical and therapeutic standpoints. Int. J. Mol. Sci. 2019, 20, 952. [Google Scholar] [CrossRef] [Green Version]
  16. Tsao, S.-W.; Mok, S.C.; Fey, E.G.; Fletcher, J.A.; Wan, T.S.; Chew, E.-C.; Muto, M.G.; Knapp, R.C.; Berkowitz, R.S. Characterization of human ovarian surface epithelial cells immortalized by human papilloma viral oncogenes (HPV-E6E7 ORFs). Exp. Cell Res. 1995, 218, 499–507. [Google Scholar] [CrossRef]
  17. Adler, E.; Mhawech-Fauceglia, P.; Gayther, S.A.; Lawrenson, K. PAX8 expression in ovarian surface epithelial cells. Hum. Pathol. 2015, 46, 948–956. [Google Scholar] [CrossRef] [PubMed] [Green Version]
  18. Wang, Y.; Wang, Y.; Li, J.; Yuan, Z.; Yuan, B.; Zhang, T.; Cragun, J.M.; Kong, B.; Zheng, W. PAX8: A sensitive and specific marker to identify cancer cells of ovarian origin for patients prior to neoadjuvant chemotherapy. J. Hematol. Oncol. 2013, 6, 60. [Google Scholar] [CrossRef] [Green Version]
  19. Gowrishankar, K.; Gunatilake, D.; Gallagher, S.J.; Tiffen, J.; Rizos, H.; Hersey, P. Inducible but not constitutive expression of PD-L1 in human melanoma cells is dependent on activation of NF-κB. PLoS ONE 2015, 10, e0123410. [Google Scholar] [CrossRef] [PubMed] [Green Version]
  20. Cherian, S.; Levin, G.; Lo, W.Y.; Mauck, M.; Kuhn, D.; Lee, C.; Wood, B.L. Evaluation of an 8-color flow cytometric reference method for white blood cell differential enumeration. Cytom. B Clin. Cytom. 2010, 78, 319–328. [Google Scholar] [CrossRef]
  21. Adams, D.L.; Adams, D.K.; He, J.; Kalhor, N.; Zhang, M.; Xu, T.; Gao, H.; Reuben, J.M.; Qiao, Y.; Komaki, R. Sequential tracking of PD-L1 expression and RAD50 induction in circulating tumor and stromal cells of lung cancer patients undergoing radiotherapy. Clin. Cancer Res. 2017, 23, 5948–5958. [Google Scholar] [CrossRef] [PubMed] [Green Version]
  22. Pakuła, M.; Mikuła-Pietrasik, J.; Witucka, A.; Kostka-Jeziorny, K.; Uruski, P.; Moszyński, R.; Naumowicz, E.; Sajdak, S.; Tykarski, A.; Książek, K. The epithelial-mesenchymal transition initiated by malignant ascites underlies the transmesothelial invasion of ovarian cancer cells. Int. J. Mol. Sci. 2019, 20, 137. [Google Scholar] [CrossRef] [Green Version]
  23. Oyer, J.L.; Gitto, S.B.; Altomare, D.A.; Copik, A.J. PD-L1 blockade enhances anti-tumor efficacy of NK cells. Oncoimmunology 2018, 7, e1509819. [Google Scholar] [CrossRef] [PubMed]
  24. Obermayr, E.; Maritschnegg, E.; Agreiter, C.; Pecha, N.; Speiser, P.; Helmy-Bader, S.; Danzinger, S.; Krainer, M.; Singer, C.; Zeillinger, R. Efficient leukocyte depletion by a novel microfluidic platform enables the molecular detection and characterization of circulating tumor cells. Oncotarget 2018, 9, 812. [Google Scholar] [CrossRef] [PubMed] [Green Version]
  25. Koch, C.; Joosse, S.A.; Schneegans, S.; Wilken, O.J.; Janning, M.; Loreth, D.; Müller, V.; Prieske, K.; Banys-Paluchowski, M.; Horst, L.J. Pre-analytical and analytical variables of label-independent enrichment and automated detection of circulating tumor Cells in cancer patients. Cancers 2020, 12, 442. [Google Scholar] [CrossRef] [PubMed] [Green Version]
  26. Kelley, S.O.; Pantel, K. A new era in liquid biopsy: From genotype to phenotype. Clin. Chem. 2020, 66, 89–96. [Google Scholar] [CrossRef]
  27. Kim, M.; Suh, D.H.; Choi, J.Y.; Bu, J.; Kang, Y.-T.; Kim, K.; No, J.H.; Kim, Y.B.; Cho, Y.-H. Post-debulking circulating tumor cell as a poor prognostic marker in advanced stage ovarian cancer: A prospective observational study. Medicine 2019, 98, e15354. [Google Scholar] [CrossRef] [PubMed]
  28. Suh, D.H.; Kim, M.; Choi, J.Y.; Bu, J.; Kang, Y.-T.; Kwon, B.S.; Lee, B.; Kim, K.; No, J.H.; Kim, Y.-B. Circulating tumor cells in the differential diagnosis of adnexal masses. Oncotarget 2017, 8, 77195. [Google Scholar] [CrossRef] [Green Version]
  29. Pearl, M.L.; Dong, H.; Tulley, S.; Zhao, Q.; Golightly, M.; Zucker, S.; Chen, W.-T. Treatment monitoring of patients with epithelial ovarian cancer using invasive circulating tumor cells (iCTCs). Gynecol. Oncol. 2015, 137, 229–238. [Google Scholar] [CrossRef] [Green Version]
  30. Liu, J.F.; Kindelberger, D.; Doyle, C.; Lowe, A.; Barry, W.T.; Matulonis, U.A. Predictive value of circulating tumor cells (CTCs) in newly-diagnosed and recurrent ovarian cancer patients. Gynecol. Oncol. 2013, 131, 352–356. [Google Scholar] [CrossRef]
  31. Guo, Y.-X.; Neoh, K.H.; Chang, X.-H.; Sun, Y.; Cheng, H.-Y.; Ye, X.; Ma, R.-Q.; Han, R.P.; Cui, H. Diagnostic value of HE4+ circulating tumor cells in patients with suspicious ovarian cancer. Oncotarget 2018, 9, 7522. [Google Scholar] [CrossRef]
  32. Xu, L.; Mao, X.; Guo, T.; Chan, P.Y.; Shaw, G.; Hines, J.; Stankiewicz, E.; Wang, Y.; Oliver, R.T.D.; Ahmad, A.S. The novel association of circulating tumor cells and circulating megakaryocytes with prostate cancer prognosis. Clin. Cancer Res. 2017, 23, 5112–5122. [Google Scholar] [CrossRef] [Green Version]
  33. Morrison, G.J.; Cunha, A.T.; Jojo, N.; Xu, Y.; Xu, Y.; Kwok, E.; Robinson, P.; Dorff, T.; Quinn, D.; Carpten, J. Cancer transcriptomic profiling from rapidly enriched circulating tumor cells. Int. J. Cancer 2020, 146, 2845–2854. [Google Scholar] [CrossRef]
  34. Yu, M.; Bardia, A.; Wittner, B.S.; Stott, S.L.; Smas, M.E.; Ting, D.T.; Isakoff, S.J.; Ciciliano, J.C.; Wells, M.N.; Shah, A.M. Circulating breast tumor cells exhibit dynamic changes in epithelial and mesenchymal composition. Science 2013, 339, 580–584. [Google Scholar] [CrossRef] [Green Version]
  35. Lindsay, C.; Le Moulec, S.; Billiot, F.; Loriot, Y.; Ngo-Camus, M.; Vielh, P.; Fizazi, K.; Massard, C.; Farace, F. Vimentin and Ki67 expression in circulating tumour cells derived from castrate-resistant prostate cancer. BMC Cancer 2016, 16, 168. [Google Scholar] [CrossRef] [PubMed] [Green Version]
  36. Jou, H.-J.; Chou, L.-Y.; Chang, W.-C.; Ho, H.-C.; Zhang, W.-T.; Ling, P.-Y.; Tsai, K.-H.; Chen, S.-H.; Chen, T.-H.; Lo, P.-H. An automatic platform based on nanostructured microfluidic chip for isolating and identification of circulating tumor cells. Micromachines 2021, 12, 473. [Google Scholar] [CrossRef] [PubMed]
  37. Yang, J.; Ma, J.; Jin, Y.; Cheng, S.; Huang, S.; Zhang, N.; Wang, Y. Development and validation for prognostic nomogram of epithelial ovarian cancer recurrence based on circulating tumor cells and epithelial–mesenchymal transition. Sci. Rep. 2021, 11, 6540. [Google Scholar] [CrossRef]
  38. Gening, S.O.; Abakumova, T.V.; Gafurbaeva, D.U.; Rizvanov, A.A.; Antoneeva, I.I.; Miftakhova, R.R.; Peskov, A.B.; Gening, T.P. The Detection of Stem-Like Circulating Tumor Cells Could Increase the Clinical Applicability of Liquid Biopsy in Ovarian Cancer. Life 2021, 11, 815. [Google Scholar] [CrossRef]
  39. Gkountela, S.; Castro-Giner, F.; Szczerba, B.M.; Vetter, M.; Landin, J.; Scherrer, R.; Krol, I.; Scheidmann, M.C.; Beisel, C.; Stirnimann, C.U. Circulating tumor cell clustering shapes DNA methylation to enable metastasis seeding. Cell 2019, 176, 98–112.e114. [Google Scholar] [CrossRef] [Green Version]
  40. Costa, C.; Muinelo-Romay, L.; Cebey-López, V.; Pereira-Veiga, T.; Martínez-Pena, I.; Abreu, M.; Abalo, A.; Lago-Lestón, R.M.; Abuín, C.; Palacios, P. Analysis of a Real-World Cohort of Metastatic Breast Cancer Patients Shows Circulating Tumor Cell Clusters (CTC-clusters) as Predictors of Patient Outcomes. Cancers 2020, 12, 1111. [Google Scholar] [CrossRef] [PubMed]
  41. Lee, M.; Kim, E.J.; Cho, Y.; Kim, S.; Chung, H.H.; Park, N.H.; Song, Y.-S. Predictive value of circulating tumor cells (CTCs) captured by microfluidic device in patients with epithelial ovarian cancer. Gynecol. Oncol. 2017, 145, 361–365. [Google Scholar] [CrossRef] [Green Version]
  42. Bonome, T.; Lee, J.-Y.; Park, D.-C.; Radonovich, M.; Pise-Masison, C.; Brady, J.; Gardner, G.J.; Hao, K.; Wong, W.H.; Barrett, J.C. Expression profiling of serous low malignant potential, low-grade, and high-grade tumors of the ovary. Cancer Res. 2005, 65, 10602–10612. [Google Scholar] [CrossRef] [Green Version]
  43. Ostrand-Rosenberg, S.; Horn, L.A.; Haile, S.T. The programmed death-1 immune-suppressive pathway: Barrier to antitumor immunity. J. Immunol. 2014, 193, 3835–3841. [Google Scholar] [CrossRef] [PubMed]
  44. Havel, J.J.; Chowell, D.; Chan, T.A. The evolving landscape of biomarkers for checkpoint inhibitor immunotherapy. Nat. Rev. Cancer 2019, 19, 133–150. [Google Scholar] [CrossRef] [PubMed]
  45. Doo, D.W.; Norian, L.A.; Arend, R.C. Checkpoint inhibitors in ovarian cancer: A review of preclinical data. Gynecol. Oncol. Rep. 2019, 29, 48–54. [Google Scholar] [CrossRef]
  46. Arend, R.C.; Jackson-Fisher, A.; Jacobs, I.A.; Chou, J.; Monk, B.J. Ovarian cancer: New strategies and emerging targets for the treatment of patients with advanced disease. Cancer Biol. Ther. 2021, 22, 89–105. [Google Scholar] [CrossRef]
  47. Khattak, M.A.; Reid, A.; Freeman, J.; Pereira, M.; McEvoy, A.; Lo, J.; Frank, M.H.; Meniawy, T.; Didan, A.; Spencer, I. PD-L1 Expression on Circulating Tumor Cells May Be Predictive of Response to Pembrolizumab in Advanced Melanoma: Results from a Pilot Study. Oncologist 2020, 25, e520. [Google Scholar] [CrossRef] [Green Version]
  48. Guibert, N.; Delaunay, M.; Lusque, A.; Boubekeur, N.; Rouquette, I.; Clermont, E.; Mourlanette, J.; Gouin, S.; Dormoy, I.; Favre, G. PD-L1 expression in circulating tumor cells of advanced non-small cell lung cancer patients treated with nivolumab. Lung Cancer 2018, 120, 108–112. [Google Scholar] [CrossRef]
  49. Anantharaman, A.; Friedlander, T.; Lu, D.; Krupa, R.; Premasekharan, G.; Hough, J.; Edwards, M.; Paz, R.; Lindquist, K.; Graf, R. Programmed death-ligand 1 (PD-L1) characterization of circulating tumor cells (CTCs) in muscle invasive and metastatic bladder cancer patients. BMC Cancer 2016, 16, 744. [Google Scholar] [CrossRef] [PubMed] [Green Version]
  50. Yue, C.; Jiang, Y.; Li, P.; Wang, Y.; Xue, J.; Li, N.; Li, D.; Wang, R.; Dang, Y.; Hu, Z. Dynamic change of PD-L1 expression on circulating tumor cells in advanced solid tumor patients undergoing PD-1 blockade therapy. Oncoimmunology 2018, 7, e1438111. [Google Scholar] [CrossRef]
  51. Tsao, M.S.; Kerr, K.M.; Kockx, M.; Beasley, M.B.; Borczuk, A.C.; Botling, J.; Bubendorf, L.; Chirieac, L.; Chen, G.; Chou, T.Y.; et al. PD-L1 Immunohistochemistry Comparability Study in Real-Life Clinical Samples: Results of Blueprint Phase 2 Project. J. Thorac. Oncol. 2018, 13, 1302–1311. [Google Scholar] [CrossRef] [Green Version]
  52. Alsuliman, A.; Colak, D.; Al-Harazi, O.; Fitwi, H.; Tulbah, A.; Al-Tweigeri, T.; Al-Alwan, M.; Ghebeh, H. Bidirectional crosstalk between PD-L1 expression and epithelial to mesenchymal transition: Significance in claudin-low breast cancer cells. Mol. Cancer 2015, 14, 149. [Google Scholar] [CrossRef] [Green Version]
  53. Lou, Y.; Diao, L.; Cuentas, E.R.P.; Denning, W.L.; Chen, L.; Fan, Y.H.; Byers, L.A.; Wang, J.; Papadimitrakopoulou, V.A.; Behrens, C. Epithelial–mesenchymal transition is associated with a distinct tumor microenvironment including elevation of inflammatory signals and multiple immune checkpoints in lung adenocarcinoma. Clin. Cancer Res. 2016, 22, 3630–3642. [Google Scholar] [CrossRef] [Green Version]
  54. Chen, L.; Gibbons, D.L.; Goswami, S.; Cortez, M.A.; Ahn, Y.-H.; Byers, L.A.; Zhang, X.; Yi, X.; Dwyer, D.; Lin, W. Metastasis is regulated via microRNA-200/ZEB1 axis control of tumour cell PD-L1 expression and intratumoral immunosuppression. Nat. Commun. 2014, 5, 5241. [Google Scholar] [CrossRef]
  55. Georganaki, M.; van Hooren, L.; Dimberg, A. Vascular targeting to increase the efficiency of immune checkpoint blockade in cancer. Front. Immunol. 2018, 9, 3081. [Google Scholar] [CrossRef] [PubMed]
  56. Zhang, L.; Zhang, X.; Liu, Y.; Zhang, T.; Wang, Z.; Gu, M.; Li, Y.; Wang, D.D.; Li, W.; Lin, P.P. PD-L1+ aneuploid circulating tumor endothelial cells (CTECs) exhibit resistance to the checkpoint blockade immunotherapy in advanced NSCLC patients. Cancer Lett. 2020, 469, 355–366. [Google Scholar] [CrossRef] [PubMed]
  57. Vetter, M.; Landin, J.; Szczerba, B.M.; Castro-Giner, F.; Gkountela, S.; Donato, C.; Krol, I.; Scherrer, R.; Balmelli, C.; Malinovska, A. Denosumab treatment is associated with the absence of circulating tumor cells in patients with breast cancer. Breast Cancer Res. 2018, 20, 141. [Google Scholar] [CrossRef]
  58. Aya-Bonilla, C.A.; Morici, M.; Hong, X.; McEvoy, A.C.; Sullivan, R.J.; Freeman, J.; Calapre, L.; Khattak, M.A.; Meniawy, T.; Millward, M. Detection and prognostic role of heterogeneous populations of melanoma circulating tumour cells. Br. J. Cancer 2020, 122, 1059–1067. [Google Scholar] [CrossRef]
  59. Chaves-Moreira, D.; Morin, P.J.; Drapkin, R. Unraveling the mysteries of PAX8 in reproductive tract cancers. Cancer Res. 2021, 81, 806–810. [Google Scholar] [CrossRef] [PubMed]
  60. Bellahcene, A.; Bachelier, R.; Detry, C.; Lidereau, R.; Clezardin, P.; Castronovo, V. Transcriptome analysis reveals an osteoblast-like phenotype for human osteotropic breast cancer cells. Breast Cancer Res. Treat. 2007, 101, 135–148. [Google Scholar] [CrossRef]
  61. Tan, C.-C.; Li, G.-X.; Tan, L.-D.; Du, X.; Li, X.-Q.; He, R.; Wang, Q.-S.; Feng, Y.-M. Breast cancer cells obtain an osteomimetic feature via epithelial-mesenchymal transition that have undergone BMP2/RUNX2 signaling pathway induction. Oncotarget 2016, 7, 79688. [Google Scholar] [CrossRef] [PubMed] [Green Version]
  62. Nelep, C.; Eberhardt, J. Automated rare single cell picking with the ALS cellcelector™. Cytom. Part A 2018, 93, 1267–1270. [Google Scholar] [CrossRef] [Green Version]
  63. Beasley, A.; Isaacs, T.; Khattak, M.A.; Freeman, J.B.; Allcock, R.; Chen, F.K.; Pereira, M.R.; Yau, K.; Bentel, J.; Vermeulen, T. Clinical application of circulating tumor cells and circulating tumor DNA in uveal melanoma. JCO Precis. Oncol. 2018, 2, 1–12. [Google Scholar] [CrossRef] [PubMed]
  64. Mao, M.; Zheng, X.; Jin, B.; Zhang, F.; Zhu, L.; Cui, L. Effects of CD44 and E-cadherin overexpression on the proliferation, adhesion and invasion of ovarian cancer cells. Exp. Ther. Med. 2017, 14, 5557–5563. [Google Scholar] [CrossRef] [PubMed] [Green Version]
Figure 1. Fluorescent photomicrographs of two OC cell lines, OVCA432 and SKOV-3, stained with antibodies against EpCAM (FITC, green), Cytokeratin (FITC, green), PAX8 (AF488, green), vimentin (AF647, purple) and PD-L1 (AF647, purple). Nuclei were stained with DAPI (blue). PD-L1 expression was assessed in cells treated with IFN-γ and non-induced controls. Scale Bar = 50 µm.
Cancers 13 06225 g001
Figure 2. Representative images of IFN-γ-treated cell lines spiked into blood obtained from female healthy controls (n = 2, for each cell line). Photomicrographs show the differential expressions of the markers for CTC identification CK/EpCAM (FITC, green) and CD45/16 (PE, red), together with PD-L1 (AF647, purple) in the first antibody panel, followed by CD31 (PE, red), PAX8 (FITC, green) and vimentin (AF647, purple) in the second antibody panel post fluorescent quenching. Nuclei were stained with DAPI (blue). Merge shows overlay of channels from first and second antibody panels. Scale Bar = 10 µm.
Cancers 13 06225 g002
Figure 3. (A) Recovery rate of the OC cell lines after enrichment with Parsortix™ and subsequent detection by immunostaining. (B) Comparison of the cell diameters of the two OC cell lines (n = 10).
Cancers 13 06225 g003
Figure 4. Photomicrographs of representative individual CTC phenotypes detected in the HGSOC patients. Images indicate expression of CK/EpCAM (FITC, green) and CD45/16 (PE, red), together with PD-L1 (AF647, purple) in the first antibody panel, followed by CD31 (PE, red), PAX8 (FITC, green) and vimentin (AF647, purple) in the second antibody panel post fluorescent quenching. Merge shows overlay of channels from first and second antibody panels. Nuclei were stained with DAPI (blue). Scale Bar = 10 µm.
Cancers 13 06225 g004
Figure 5. Photomicrographs showing CTC clusters expressing vimentinpos (AF647, purple) in patient OC1423. Nuclei were stained with DAPI (blue). Scale Bar= 10 µm (Upper cluster), and 20 µm (Lower cluster).
Cancers 13 06225 g005
Figure 6. Photomicrographs showing co-expression of markers on CD31pos cells in the enriched samples from the OC patients. Images indicate expression of CK/EpCAM (FITC, green) and CD45/16 (PE, red), together with PD-L1 (AF647, purple) in the first antibody panel, followed by CD31 (PE, red), PAX8 (FITC, green) and vimentin (AF647, purple) in the second antibody panel post fluorescent quenching. Merge shows overlay of channels from first and second antibody panels. Nuclei were stained with DAPI (blue). Scale = 20 µm for top row, and 10 µm for the rest.
Cancers 13 06225 g006
Figure 7. PD-L1 expression on mesenchymal and epithelial CTCs. (A) Photomicrograph of PD-L1pos CTCs. Scale Bar = 10 µm. (B) Comparison of PD-L1 expression in CTCs with epithelial (E), hybrid epithelial/mesenchymal (Hybrid E/M), or mesenchymal (M) phenotype. p-value of Fisher’s exact test comparing E-CTCs, M-CTCs, and hybrid E/M for PD-L1 expression.
Cancers 13 06225 g007
Table 1. Summary of clinical parameters and detected CTCs.
PIDDisease StatusAge (Years)FIGO StageCA-125 (kU/L)BRCA StatusTumour PAX8TreatmentLymphovascular InvolvementCRS/Patient OutcomeAscites (Volume)CTC Count
OC 714Recurrent50IIIC114WTPositiveSurgery/ACNRNAAbsent5
OC 1248ND71IVA354WTPositiveNACTNoCRS 3Large0
OC 1251ND68IIIC1858WTPositiveNACTYesCRS 2Large 10
OC 1313ND55IIIC51WTPositiveNACTYesCRS 1Small 0
OC 1350ND72IIIC554WTPositive (Diffuse)NACTYesCRS 3Small 0
OC 1354ND74IIIC169WTPositiveNACTYesCRS 1Absent3
OC 1362ND68IVA1001WTPositive (Diffuse)NACTNoPD1stAbsent8
OC 1409ND66IIIC429MutantPositiveNACTYesCSR 2Small 49
OC 1418ND73IVB1200WTPositiveNACTYesCRS 2Medium 0
OC 1423ND53IVB313WTPositive (Patchy)NACTNoCRS 2Small 19
OC 1382ND68IC570WTNRSurgeryYesGoodSmall41
OC 1388Recurrent79IIIA10WTPositiveSurgery/ACNRPDNR13
OC 1400ND65IA #27WTNegativeSurgeryNoGoodAbsent0
OC 1436ND82IIIC125WTPositiveSurgeryYesNAAbsent2
OC 1458ND83IVA1056WTPositiveNACTNRPD†aSmall0
OC 1364ND58IIIC576WTNRNACTNRPD1stNR7
AC: Adjuvant chemotherapy; CRS: Chemotherapy response score; FIGO: International Federation of Gynaecology and Obstetrics; ND: Newly Diagnosed; # Mucinous borderline; NA: Not available; NR: Not reported; PD1st: Progressive disease with first line NACT and patient was moved out of clinical trial; PD: Progressive disease after surgery and death of patient has ensued. PD†a: Progressive disease with patient death occurring after 3rd round of NACT, thus, CRS was not done; WT: Wild type. Criteria for volume of ascites: Large volume (ascitic fluid > 1000 mL); medium volume (between 500 and 1000 mL); small volume (<500 mL).
Table 2. Summary of the markers detected on the OC patients CTCs.
PIDDisease StatusCK/EpCAMVimentinPAX8Total Count (CTCs)PD-L1
OC 714Recurrent24350
OC 1248ND00000
OC 1251ND571103
OC 1313ND00000
OC 1350ND00000
OC 1354ND33030
OC 1362ND53086
OC 1409ND471424945
OC 1418ND00000
OC 1423ND2171190
OC 1382ND3931410
OC 1388Recurrent361137
OC 1400ND00000
OC 1436ND20020
OC 1458ND00000
OC 1364ND51271
TOTAL 113581115762
ND: Newly diagnosed.
Publisher’s Note: MDPI stays neutral with regard to jurisdictional claims in published maps and institutional affiliations.

