Simple Summary
Cancer is associated with metabolic changes related to increased cell proliferation and growth. These cancer-related metabolic features are largely dictated by specific oncogenes that are activated by chromosomal aberrations and epigenetic alterations in cancer cells. Multiple myeloma is an incurable plasma cell malignancy, which is characterized by recurrent chromosomal aberrations that drive the expression of established oncogenes such as MYC, Cyclin D1, FGFR3/MMSET and MAF/MAFB. In this review, we discuss the specific metabolic features of multiple myeloma plasma cells, and focus on the metabolic consequences of recurrent chromosomal aberrations, thereby providing an outline for the metabolic alterations that characterize multiple myeloma.
Abstract
Oncogene activation and malignant transformation exerts energetic, biosynthetic and redox demands on cancer cells due to increased proliferation, cell growth and tumor microenvironment adaptation. As such, altered metabolism is a hallmark of cancer, which is characterized by the reprogramming of multiple metabolic pathways. Multiple myeloma (MM) is a genetically heterogeneous disease that arises from terminally differentiated B cells. MM is characterized by reciprocal chromosomal translocations that often involve the immunoglobulin loci and a restricted set of partner loci, and complex chromosomal rearrangements that are associated with disease progression. Recurrent chromosomal aberrations in MM result in the aberrant expression of MYC, cyclin D1, FGFR3/MMSET and MAF/MAFB. In recent years, the intricate mechanisms that drive cancer cell metabolism and the many metabolic functions of the aforementioned MM-associated oncogenes have been investigated. Here, we discuss the metabolic consequences of recurrent chromosomal translocations in MM and provide a framework for the identification of metabolic changes that characterize MM cells.
1. Introduction
Multiple myeloma (MM) is a neoplastic disease that manifests itself by the accumulation of clonal plasma cells in the bone marrow. MM has a yearly global incidence of about ~5/100,000 individuals, and mainly affects the elderly. Despite recent clinical improvements due to the development of novel drugs, the outcome for MM patients remains dismal. The stepwise malignant transformation of plasma cells leading up to MM is accompanied by genetic and epigenetic changes that have been well studied over the recent years (reviewed in [1,2,3,4]). Additionally, it is becoming increasingly evident that cancer cells display altered metabolic features related to increased demands and rewired regulation of metabolic genes, often caused by oncogene activation. MM plasma cells originate from post-germinal center B cells and are characterized by a number of recurrent genetic aberrations. The presence of chromosomal aberrations that involve the immunoglobulin loci and a restricted set of partner chromosomes/loci constitutes an almost universal event in MM [5,6]. Full-blown MM may be preceded by a premalignant condition termed monoclonal gammopathy of undetermined significance (MGUS) and an asymptomatic phase known as smoldering MM (sMM). Importantly, many of the recurrent chromosomal aberrations can already be detected in the premalignant and asymptomatic conditions, indicating that these are important drivers of malignant transformation in MM [7]. The most recurrently encountered structural genetic abnormalities in MM affect well-known cancer-associated genes such as MYC and cyclin D1 (CCND1), that supposedly primarily drive malignant proliferation. In addition, translocations involving the fibroblast growth factor receptor 3 (FGFR3), the histone methyltransferase multiple myeloma SET domain (MMSET) and the musculoaponeurotic fibrosarcoma (MAF) oncogene homolog transcription factors are often found. The biological sequelae of these latter translocations are complex and less well understood. The oncogenic consequences of the genes dysregulated by recurrent chromosomal translocations in MM have been studied extensively in recent years; however, their impact on cellular metabolism have received relatively little attention. In this review, we discuss the metabolic characteristics of normal plasma and MM plasma cells, with a particular focus on the metabolic consequences of the dysregulated MM-associated oncogenes CCND1, MYC, FGFR3, MMSET and MAF.
1.1. Metabolic Characteristics of Plasma Cells
Plasma cells are highly specialized cells that play a crucial role in humoral immunity by producing and secreting antibodies. Plasma cells generated in a primary immune response develop in a T-cell-independent fashion, are short-lived and secrete mostly low-affinity IgM. These cells and antibodies are part of a first line of immune defense that precedes the emergence of higher-affinity antibodies and long-lived plasma cells, which are generated in a T-cell dependent germinal center (GC) response. Long-lived plasma cells migrate to the bone marrow where they reside to provide lifelong protection by constitutive antibody secretion. It must be noted that the heterogeneity in plasma cells based on longevity is not strict and many characteristics between short-lived and long-lived plasma cells overlap [8]. Regardless, the specialized function of plasma cells to produce and secrete antibodies, and their limited proliferative capacity, poses specific demands on nutrient uptake and synthesis of biomolecules. Plasma cell differentiation initiates with the activation of naïve B cells, which results in the increase of glucose uptake, driving glycolysis and oxidative phosphorylation (OXPHOS) [9]. Antigen-receptor engagement activates the phosphatidylinositol 3-kinase (PI3K) and protein kinase B (AKT) pathway that is of pivotal importance for the orchestration of metabolic changes in B cells [9,10,11]. AKT is known to increases glucose uptake and glycolysis, while inhibiting fatty acid oxidation. At the same time, it increases lipid synthesis, activity of the pentose phosphate pathway (PPP), glutaminolysis and nucleotide synthesis and there is evidence that AKT promotes mitochondrial respiration [12,13,14,15]. In the GC, antigen-activated B cells undergo vigorous proliferation and diversify their antibody repertoire by somatic hypermutation (SHM) of their antibody genes, which requires the expression of activation-induced cytidine deaminase (AID) [16,17]. AID is a B-cell specific enzyme that deaminates cytosines in immunoglobulin gene segments that code for the antigen-binding domains of antibodies. Cytosine deamination results in genomic uracils, which are processed in an error-prone fashion by the base excision repair and mismatch repair pathways, resulting in mutations, thereby creating antibody variants with altered affinity for antigen. Ensuing T-cell dependent positive selection in the GC based on antigen binding results in affinity maturation and the generation of long-lived plasma cells that secrete high affinity antibodies. Next to SHM, AID is also crucial for class switch recombination (CSR) as processing of AID-instigated genomic uracils in the switch (S) regions of the immunoglobulin heavy chain (IGH) locus primarily results in the formation of DNA double-strand breaks (DSB) that are required for CSR [18,19]. Of interest, AID has been firmly implicated in the generation of recurrent chromosomal translocations and the acquisition of driver mutations in MM, implicating a GC origin for MM [20,21]. Clonal B-cell expansion in the GC requires the mammalian target of rapamycin complex 1 (mTORC1) and the glycogen synthase kinase 3 (GSK3), which drive glycolysis and mitochondrial biogenesis [22,23]. The relative sparsity of oxygen in the GC microenvironment would suggest that GC B cells primarily rely on glycolysis [24,25], since OXPHOS requires oxygen. However, a recent study suggests that highly proliferative GC B cells are not glycolytic but instead use fatty acid oxidation for OXPHOS [26]. The latter results would be in line with a rather modest glucose uptake that was reported for GC B cells [22]. Next to utilization of fatty acids for energetic demands, activated B cells evidently also synthesize fatty acids to prepare for the expansion of the endoplasmatic reticulum (ER) during plasma cell differentiation [27]. Antibody production requires an extensive ER machinery, associated with increased demands of fatty acid and amino acids. Furthermore, high level antibody production saturates the protein folding capacity of the ER, resulting in an ER stress response in plasma cells [28,29]. Protein synthesis is regulated by the nutrient sensor mTORC1 that is activated by amino acids. Rapamycin treatment abrogated plasma cell differentiation in mice, indicating that mTORC1 is of crucial importance for the generation of plasma cells. Moreover, antibody production was decreased by rapamycin treatment, whereas the frequency of long-lived plasma cells in the bone marrow was not affected [30]. These results indicate that mTORC1 primarily functions to regulate antibody biosynthesis in plasma cells. The metabolic reprogramming that takes place in plasma cells is transcriptionally dictated by the transcription factors B lymphocyte-induced maturation protein-1 (BLIMP1) and the interferon regulatory factor 4 (IRF4), which silence the paired-box 5 (PAX5) transcription factor that is involved in the suppression of glycolysis [31]. Using ex vivo lipopolysaccharide (LPS)-induced differentiation of murine B cells it was demonstrated that OXPHOS is increased upon T-cell-independent plasma cell differentiation. However, LPS-induced plasma cells still rely on glycolysis, likely because it produces pyruvate that fuels OXPHOS. BLIMP1 was required for this rise in OXPHOS [32], perhaps by preventing PAX5-mediated suppression of glycolysis. Pyruvate derived from glycolysis also crucially fuels OXPHOS in long-lived plasma cells in vivo, as shown by the specific loss of these cells in mice with a deletion of the mitochondrial pyruvate carrier 2 (MPC2) [33]. Additionally, these results suggest that glutaminolysis can not compensate to maintain OXPHOS when glycolysis is hampered in plasma cells. Concomitantly, inhibition of glycolysis by treatment with 2-deoxyglucose (2-DG) impaired LPS-induced plasma cell differentiation, whereas retroviral overexpression of the rate-limiting glycolysis enzyme hexokinase 2 (HK2) drove plasma cell differentiation, accompanied by PAX5 downregulation [34].
The crucial impact of metabolic features on plasma cells was recently demonstrated in a direct comparison of long-lived versus short-lived plasma cells. Single cell transcriptomics of these different plasma cell populations revealed few differences, whereas glucose and amino acid uptake was clearly increased in long-lived plasma cells. These results suggest that lifespan of plasma cells is largely determined by metabolic features and is not transcriptionally regulated. Importantly, these metabolic alterations were not related to the ER stress response, as this was comparable in both plasma cell populations. It was demonstrated that long-lived plasma cells express higher levels of CD98 (SLC3A2), a common subunit of several amino acid transporters, which may be at the basis of the metabolic differences between short-lived and long-lived plasma cells [35]. In addition, we speculate that differential signaling characteristics dependent on microenvironmental niche variation and nutrient availability may underlie the functional metabolic differences between long-lived and short-lived plasma cells. In activated B cells, glucose is primarily used for glycolysis; however, in plasma cells, glucose also has a different fate and is generally used for the glycosylation of antibodies, which involves the hexosamine biosynthesis pathway (HBP). This pathway siphons the glycolysis intermediate fructose 6-phosphate off to produce uridine diphosphate-N-acetylglucosamine (UDP-GlcNac) that is used as a glycosylation substrate. The HBP converges with glutamine, fatty acid and nucleotide metabolism, requiring several intermediates derived from these pathways. The X-box binding protein-1 (XBP1) transcription factor is activated by the ER stress response in plasma cells and directly activates the HBP by transcriptional regulation of several rate-limiting enzymes [36]. This illustrates that increased protein production crucially impinges on metabolic pathways in plasma cells. Interestingly, low adenosine triphosphate (ATP) conditions in long-lived plasma cells may force glucose down the glycolysis pathway to generate pyruvate to fuel OXPHOS for energetic demands [33]. These observations indicate that plasma cells display some degree of metabolic plasticity.
1.2. Metabolic Characteristics of MM Cells
The activation of oncogenes triggers malignant cellular transformation, which is often associated with the dramatic reprogramming of metabolic pathways in cancer cells. An altered metabolic state is apparent in all types of cancer, including MM, and can be considered as one of the hallmarks of cancer [37]. The marked increase in glucose uptake in cancer cells was described by Otto von Warburg in 1927 [38], a phenomenon that was later dubbed the “Warburg effect”. The prevailing thought was that cancer cells ferment glucose in the presence of oxygen, termed aerobic glycolysis, at the expense of OXPHOS. However, this concept was challenged by the finding that many tumors in vivo exhibit sufficient or even elevated OXPHOS [39,40,41]. MM cells were reported to be particularly reliant on glycolysis, as shown by the specific sensitivity for the glycolysis inhibitor dichloroacetate [42]. Moreover, the glycolysis rate-limiting enzyme HK2 is highly expressed in newly diagnosed MM cases, increases with disease progression and is associated with poor prognosis [43,44,45]. Of interest, the end product of glycolysis, lactate, is typically secreted by cells; however, MM cells also take up exogenous lactate through the monocarboxylate transporter 1 (MCT1) to fuel OXPHOS [46]. Furthermore, lactate dehydrogenase A (LDHA), the enzyme that converts lactate into pyruvate, is highly expressed in MM cells [44]. However, MM cells clearly also utilize OXPHOS, since co-treatment with the OXPHOS inhibitor metformin and the glucose uptake inhibitor ritonavir synergized to induce cell death in MM cells, indicating that OXPHOS may compensate when glycolysis is limiting. Furthermore, when glycolysis was inhibited, MM cells became increasingly dependent on glutamine, demonstrating that under these conditions OXPHOS was primarily fueled by glutaminolysis [47]. MM cells clearly differ from normal plasma cells in this regard [33], and these results underscore that MM cells possess noticeable metabolic plasticity that may be exploited therapeutically.
Transcriptional rewiring caused by oncogene dysregulation in combination with clonal selection towards the effective acquisition and utilization of various nutrients from a relatively nutrient-starved microenvironment, shapes the metabolic features of cancer cells. Not surprisingly, this is also the case for MM cells that typically reside in the sparsely oxygenated bone marrow environment. Next to the increased metabolic demands associated with antibody secretion, MM plasma cells also have specific demands towards oncogene-driven cellular proliferation, which is not the case for normal plasma cells. These increased metabolic demands represent attractive therapeutic targets that are being explored in a clinical setting. In general, MM cells are characterized by the increased metabolism of glucose, glutamine, fatty acid and nucleotides, largely dictated by the activation of specific oncogenes (Figure 1), which we will discuss in the ensuing chapters of this review.
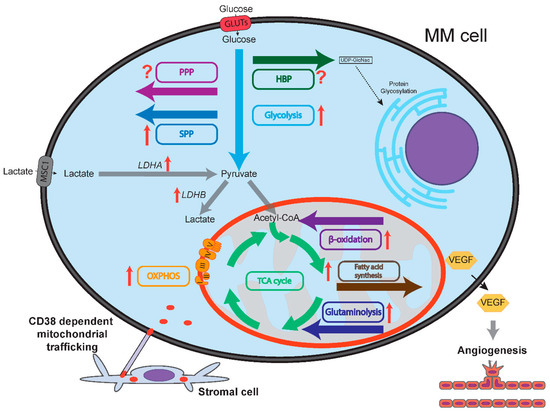
Figure 1.
Schematic representation of multiple myeloma (MM) cell metabolism compared to normal plasma cells. Flow of metabolites is shown by colored arrows. Glycolysis, OXPHOS, serine synthesis pathway (SSP), glutaminolysis, fatty acid synthesis and fatty acid oxidation (β-oxidation) are all upregulated in MM cells compared to normal plasma cells, as indicated by red arrows. Lactate dehydrogenase A (LDHA) and B (LDHB) are upregulated in MM cells. It is unclear whether the pentose phosphate pathway (PPP) and the hexosamine biosynthesis pathway (HBP) are up/downregulated in MM cells compared to normal plasma cells, as designated by question marks. MM cells express vascular endothelial growth factor (VEGF) that increases bone marrow oxygenation by inducing angiogenesis. Increased bone marrow oxygenation may stimulate oxidative phosphorylation (OXPHOS) in MM cells. CD38-dependent nanotubes transport mitochondria from stromal cells to MM cells, mitochondrial fusion further sustains OXPHOS.
2. C-MYC Deregulation in MM
The transcription factor c-MYC (MYC) was originally identified as the cellular homolog of the avian retrovirus-encoded v-MYC oncogene that is responsible for viral transforming activity [48,49]. MYC forms heterodimers with its ubiquitously expressed binding partner MYC associated protein X (MAX), which is essential for the gene regulatory function of MYC that predominantly impinges on genes involved in cell growth and proliferation. Interestingly, MYC does not appear to function as a classical on/off determinant for gene transcription, but rather as an amplifier of active genes, partly explaining its highly context-dependent transcriptional effects [50,51]. MYC is an established oncogene that is deregulated in the majority of human cancers [52]. In solid tumors, the MYC locus at 8q24 is often amplified, whereas in hematological cancers, MYC dysregulation is often a result of chromosomal translocations. The chromosomal translocation that places the MYC gene in close proximity to the immunoglobulin heavy chain (IGH) enhancer regions is the hallmark feature of Burkitt lymphoma [53], and is also frequently observed in other mature B-cell lymphomas, most prominently in diffuse large B-cell lymphoma (DLBCL), where it is associated with disease aggressiveness and adverse prognosis [54]. Chromosomal breakpoint analysis has revealed that illegitimate immunoglobulin class switch recombination (CSR) is responsible for majority of the chromosomal translocations involving MYC in B-cell lymphomas, as these are often located in the IGH switch (S) regions that are targeted by activation-induced cytidine deaminase (AID) during CSR [55]. In MM, structural variants (SV) involving the MYC locus are recurrently observed [5]. A recent report identified MYC SVs in 42% of newly diagnosed MM, and in 24% of smoldering MM (sMM) cases, whereas these were absent in monoclonal gammopathy of undetermined significance (MGUS) cases. MGUS and sMM are considered as the premalignant and asymptomatic phases of MM, respectively, suggesting that MYC SVs are acquired as secondary genetic events. In MM, the IGH enhancer regions are involved in approximately one third of the MYC SV cases. The IGH MYC rearrangements in MM are characterized by chromosomal duplications of the breakpoint regions and often involve other genes in addition to IGH and MYC [56]. Initially, it was reported that MYC aberrations confer adverse prognosis in MM [57,58], which appeared to be the case, particularly for MYC translocations involving the immunoglobulin lambda light chain (IGL) [59]. However, in a more recent study the association between MYC SVs and poor prognosis in MM could not be corroborated [56].
It is important to note that MYC deregulation does not occur in isolation but requires additional oncogenic changes for its tumor-promoting activities. For instance, it was shown recently that the combined expression of an oncogenic NRAS variant (NRASQ61R) and a MYC transgene in germinal center B cells was sufficient to drive myelomagenesis in a conditional mouse model [60]. Moreover, in non-transformed cells, several checkpoints prevent the deregulation of MYC expression. Acute elevated MYC expression was shown to activate ARF and BIM, resulting in p53-dependent apoptosis and cell cycle arrest [61,62]. The activation of ARF was demonstrated to require the FOXO3 transcription factor, and it was shown that loss of FOXO activity accelerated the development of MYC-driven lymphomas [63]. The AKT kinase is the pivotal negative regulator of FOXO and is constitutively active in MM [64]. Importantly, we have recently demonstrated that activation of FOXO induces cell cycle arrest and cell death of MM cells. In agreement, inhibition of AKT in MM cells decreased MYC expression and activity [65]. MYC-driven lymphomas in experimental mouse models almost uniformly lose ARF or p53 expression [61], and in human Burkitt lymphoma TP53 is lost in a large fraction of the cases [66]. Additionally, the posttranslational regulation of MYC may also be affected by oncogenic events. For instance, MYC protein stability is increased by ERK activation and/or oncogenic KRAS [67,68], which are frequently implicated in MM [69,70]. In MM, MYC SVs did not show any significant association with other genetic events, and it appears that activation of MYC, RAS or NFKB are complementary, showing functional redundancy [56]. Strikingly, MYC SV did not correlate with MYC expression level nor with proliferation gene expression index in MM, in contrast to most other cancers. These results indicate that the role of MYC in MM might be different from that in other cancers, perhaps it is not primarily involved in proliferation, but rather in the regulation of the cellular metabolism. As the transcriptional consequences of MYC activation are highly context-dependent, the effects of MYC deregulation in cancer cells with regards to cellular metabolism are also highly heterogeneous and depend on the cell of origin and microenvironmental factors.
2.1. MYC and Glucose Metabolism in MM
Importantly, MYC is a key player in the regulation of aerobic glycolysis, which is a hallmark metabolic feature of almost all cancers, as mentioned earlier. MYC-induced cellular transformation was shown to be accompanied by increased consumption and utilization of glucose and glutamine [71,72,73]. MYC was demonstrated to directly activate the expression of many genes involved in glycolysis by binding to the E-box sequence (CACTGT) present in the promoters of key glycolysis genes (Figure 2, Table A1). It was shown by chromatin immunoprecipitation (ChIP) that the major rate-limiting enzymes in glycolysis, such as HK2, LDHA and enolase 1 (ENO1), as well as the glucose transporter gene SLC2A1, may be directly regulated by MYC, whereas glyceraldehyde-3-phosphate dehydrogenase (GAPDH) and triose isomerase (TPI) appeared to be indirectly regulated by MYC [74]. Interestingly, p53 directly represses the expression of glycolysis genes [75,76], which may in part underlie the selection for loss of p53 function in MYC deregulated cancers that rely heavily on glycolysis for energetic demands and anabolic precursors, including MM. The p53-inducible gene TIGAR (TP53-induced glycolysis and apoptosis regulator) is a major determinant downstream of p53, lowering the levels of reactive oxygen species (ROS) and of fructose-2,6-biphosphate, thereby inhibiting glycolysis [77]. Interestingly, TIGAR was shown to be expressed in human MM cell lines, and loss of TIGAR expression resulted in cell death, likely related to increased ROS levels, which could emanate from deregulated MYC expression [78,79]. Whether TIGAR is involved in the regulation of glycolysis in MM cells is unknown.
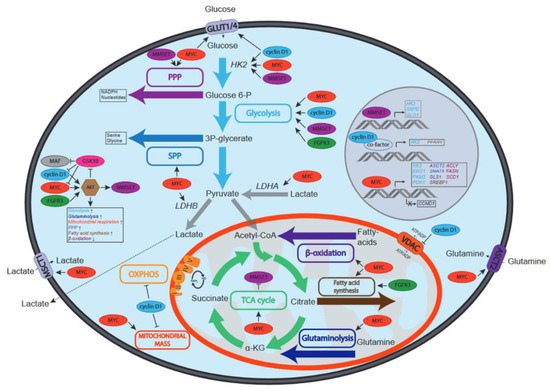
Figure 2.
Schematic overview of the effects of recurrent genetic aberrations on metabolic pathways in MM. Depicted are MYC, cyclin D1, MMSET, FGFR3 and MAF and the effects they have on the activity of metabolic pathways (depicted by colored boxes and arrows) and/or metabolite transporters (MSCT1, VDAC, ASCT2, GLUT1 and GLUT4). Increased or decreased activation can be due to regulation of the activity, protein stability or expression of enzymes involved in specified pathways. In the middle left the effects of MYC, cyclin D1, MMSET, FGFR3 and MAF on AKT, a central regulator of metabolism, are depicted. Due to the key roles HK2, LDHA and LDHB play in glucose and lactate metabolism, the effects of oncogenes on these enzymes are also shown.
Of note, MYC has also been described to regulate glycolysis by its specific effect on the alternative splicing of the pyruvate kinase muscle isozyme (PKM), increasing the expression of PKM2 isoform that promotes glycolysis, at the expense of PKM1, which primarily drives OXPHOS [80]. Mechanistically, MYC drives the expression of never in mitosis gene A-related kinase 2 (NEK2), which interacts with heterogeneous ribonucleoproteins A1/2 (hnRNPA1/2) that bind PKM transcripts and regulates splicing [81]. The expression of PKM2 was found to be associated with MM cell proliferation, and knockdown of PKM2 increased adhesion to stromal cells and drug resistance [82]. Moreover, analysis of several gene expression datasets indicated that PKM2 expression was associated with poor prognosis in MM, as was also the case for several other key glycolysis genes, including pyruvate dehydrogenase kinase 1 (PDK1), monocarboxylate transporter 1 (MCT1, SLC16A1) and the extracellular matrix metalloproteinase inducer (EMMPRIN, CD147), of which the latter two are involved in lactate efflux, thereby regulating glycolytic flux in MM [83,84] (Figure 2). Recently, several single nucleotide polymorphisms in the MCT1 and CD147 genes were identified in MM patients, which were associated with poor prognosis factors such as elevated beta-2-microglobulin and creatinine levels [85].
Additional evidence for the importance of glycolysis in MM is provided by (18)F-fluorodeoxyglucose (FDG) positron emission tomography (PET), which determines glucose uptake by tumor cells in patients. It was demonstrated that (18)-FDG-PET is an important predictor for outcome in MM patients [86], which is likely associated with the expression of glycolysis genes. Moreover, the (18)-FDG PET metabolic tumor burden was shown to be associated with high-risk gene expression in MM [87]; however, a direct comparison between (18)-FDG-PET status, the expression of glycolysis genes, and MYC aberrations has not been reported yet. Notwithstanding, the crucial dependence of MM cells on glycolysis was revealed in several studies that show that inhibition of glycolysis enzymes, or knockdown of glycolysis genes, resulted in apoptosis [42,44,88,89].
The bone marrow in which MM cells reside is a hypoxic microenvironment [90], which may also drive glycolysis, as it does not rely on oxygen consumption. The hypoxia-inducible transcription factors HIF1α and HIF2α are the predominant regulators of the cellular response to hypoxia, acting in concert with other transcriptional coactivators, including MYC. The crosstalk between HIF1/2 and MYC is complex; HIF1α was shown to antagonize MYC by binding and sequestering MAX, and by inducing FOXO3 expression, whereas HIF2α promotes MYC-MAX activity [91]. However, when MYC is overexpressed it can bypass HIF1α mediated repression, and instead cooperate to drive the expression of PDK1 and HK2 [92]. It was found that MYC deregulation in MM resulted in the hypoxia-independent constitutive activation of HIF1α, driving the expression of vascular endothelial growth factor (VEGF) and angiogenesis [93], which could perhaps contribute to increased metabolic flexibility of MM cells due to increased oxygenation of the BM microenvironment, thereby making the tumor cells less reliant on glycolysis (Figure 1).
MYC-driven glycolysis may also critically contribute to other metabolic pathways by providing crucial intermediates. For instance, the glycolysis intermediate 3-phosphoglycerate is also used to synthesize serine, which is a major one-carbon source for methylation of DNA, RNA and proteins, and thus involved in epigenetic regulation [94]. Furthermore, oncogenic MYC increases the expression of multiple enzymes involved in serine biosynthesis and glutathione production, which counteracts oxidative stress [95]. In addition, MYC was shown to divert glucose to the PPP by upregulating the expression of enzymes of this pathway [96]. The PPP uses the glycolysis intermediate glucose-6-phosphate, yielding ribose-5-phosphate, which is an important precursor for de novo nucleotide synthesis and thus of major importance for dividing cells (Figure 2). A recent report indicated that the long noncoding RNA (lncRNA) protein disulfide isomerase family A pseudogene 1 (PDIA3P), which is highly expressed in MM, interacts with MYC and enhances the transactivation of glucose-6-phosphate dehydrogenase (G6PD) promoter, upregulating this rate-limiting PPP enzyme [97]. Moreover, pyruvate is the product of glycolysis that enters the tricarboxylic acid (TCA) cycle and is oxidized to generate reduced electron carriers such as nicotinamide adenine dinucleotide (NADH) and flavin adenine dinucleotide (FADH), which donate electrons for the production of ATP during OXPHOS in the mitochondria. In the presence of glucose and oxygen, MYC was shown to drive the TCA cycle by ramping up pyruvate production [98]. However, it appears that MYC predominantly impacts on the TCA cycle by upregulating glutaminolysis [72] (Figure 2, Table A1).
2.2. MYC and Glutaminolysis in MM
Early work on the metabolic profiling of mouse myeloma cells has revealed that at steady state primarily glucose and glutamine are consumed, where the rate of glutamine consumption was highest under limiting glucose conditions [99]. Furthermore, in vitro growth of MM cells was severely blunted by the depletion of glutamine [100,101], suggesting that glutaminolysis is of essential importance for energetic demands and anaplerotic reactions. In agreement, it was demonstrated that MM patients have significantly lower serum glutamine levels compared to healthy controls, whereas serum glutamine levels normalized upon achieving complete remission after treatment [102]. MYC plays a central role in the regulation of glutaminolysis at several levels (Figure 2, Table A1). Similar to glycolysis, MYC drives the expression of glutaminolytic genes as shown by expression profiling and ChIP-seq analysis of the Burkitt lymphoma cell line P493-6 that harbors an inducible MYC expression system [51]. The glutamine transporters alanine-serine-cysteine transporter 2 (ASCT2, encoded by the SLC1A5 gene) and sodium-coupled neutral amino acid transporter 5 (SNAT5, encoded by the SLC38A5 gene) are under direct transcriptional control of MYC [72]. Moreover, MYC enhances the expression of glutaminase 1 (GLS1) by repressing the expression of the microRNA miR-23a/b, which inhibits GLS1 translation [103]. It was shown that ASCT2 is overexpressed in MM compared to healthy donors, sMM and MGUS, with highest expression in secondary plasma cell leukemia and MM cell lines representing aggressive end-stage disease, whereas the expression of SNAT5 and GLS1 was comparable in MGUS, sMM and MM [104]. In agreement, miR-23a/b was found to be downregulated in MM, and enforced expression of miR-23a/b in MM cell lines suppressed proliferation and survival [105]. Whether this growth suppressive effect is related to its impact on GLS1 expression has not been studied. MM cells primarily depend on ASCT2 for glutamine transport, and shRNA-mediated ASCT2 knockdown impaired growth of MM cell lines in vitro and in an in vivo mouse xenograft model. In addition, the GLS1 inhibitors CB-839 and BPTES were shown to induce cell death in MM cell lines [104].
Glutamine can also be synthesized de novo from glutamate and ammonia by a reverse reaction catalyzed by glutamine synthetase (GS). Next to GLS1, MYC is also involved in the regulation of GS by transcriptional activation of the base excision repair protein thymine DNA glycosylase (TDG), which promotes active demethylation of the GS promoter [106]. Glutamine synthesis primarily takes place in the cytoplasm and contributes to the production of cytoplasmic proteins and nucleotides, whereas GLS1 is found in the mitochondria. Interestingly, GS was not detected in MM cell lines, even when glutamine is depleted, suggesting that MM cells are incapable of performing de novo glutamine synthesis and rely on glutamine uptake for anabolism. It was reported that the TDG gene is aberrantly methylated in human MM cell lines [107], which may underlie the inability of MM cells to perform glutamine synthesis, and perhaps in part explain the glutamine dependence of MM cells, but this remains untested. Ammonia is the toxic byproduct of glutamine breakdown. Conversely, ammonia is consumed during glutamine synthesis. In support of the notion that glutamine synthesis is impaired in MM cells, it was demonstrated that MM cells produce ammonia in the presence of glutamine [104,108]. In agreement, several studies report on the occurrence of hyperammonemia in MM patients, which causes serious clinical complications such as encephalopathy [109,110,111]. Whether this phenomenon is more prominent in MM cells that harbor MYC SVs is unknown.
Glutamine is converted into glutamate by GLS1 and subsequently converted into the TCA intermediate alpha-ketoglutarate (αKG) by glutamate dehydrogenase (GDH). Alternatively, transaminases such as glutamic oxaloacetic transaminase 1 and 2 (GOT1, GOT2) may convert glutamate in αKG. In mammary epithelial cells it was demonstrated that proliferating cells predominantly use transaminases to generate αKG, whereas in quiescent cells GDH dominates [112]. The αKG enters the TCA cycle to generate energy. Additionally, in MM cells αKG is converted into the oncometabolite 2-hydroxyglutamate (2-HG). Elevated 2-HG levels were associated with disease progression in MM, whereas this was not the case for the glutamate and αKG levels. Interestingly, MYC expression correlated with 2-HG levels, which may be related to MYC-driven glutamine anaplerosis [113]. Typically, 2-HG production is catalyzed by mutant isocitrate dehydrogenase 1/2 (IDH1/2), which is a hallmark feature of gliomas and secondary glioblastomas [114], but is very rare in MM [115]. The exact mechanism of 2-HG production in MM remains unknown. It was demonstrated that 2-HG activates the mammalian target of rapamycin (mTOR) by decreasing the protein stability of the DEP domain-containing mTOR-interacting protein (DEPTOR), which is a negative regulator of mTOR [116]. Activation of mTOR is associated with AKT kinase activity and downstream FOXO inactivation. Based on these observations we speculate that elevated 2-HG in MM may be part of a positive feedback mechanism. Oncogenic MYC drives the expression of 2-HG, which results in mTOR/AKT-mediated downmodulation of FOXO that enables further MYC deregulation [63]. In addition, in gliomas it was shown that 2-HG is an inhibitor of αKG-dependent dioxygenases, including histone demethylases, and was associated with histone and DNA methylation changes [117]. It is conceivable that 2-HG may have a similar impact on the epigenome in MM cells and thereby contribute to gene deregulation.
In several cancer cell lines it was demonstrated that glutamine promotes proliferation independently of glutaminolysis, as the effects of glutamine depletion could not be rescued by supplementation with the glutaminolysis intermediates glutamate or 2-oxoglutarate. Glutamine was shown to activate signal transducer and activator of transcription 3 (STAT3), which was not affected by inhibition of glutaminolysis, suggesting that glutamine may be directly involved in transmembrane receptor engagement [118]. The Janus activated kinase (JAK)/STAT3 signaling pathway plays a prominent role in MM, which is activated by interleukin-6 and by loss of Src homology phosphatase -1 (SHP-1) [119,120,121]. In a murine retroviral transduction model, it was shown that expression of a constitutive active IL-6 signal transduction chain induced an MM-like disease that closely mimicked human MM pathology. Importantly, these tumors harbored Myc aberrations indicating that STAT3 activation and MYC collaborate to induce MM [122]. Perhaps in MM, glutamine does not only fulfil metabolic demands that are imposed and regulated by MYC, but may also act in a direct fashion by deregulating oncogenic signaling.
2.3. MYC and Lipid Metabolism in MM
Proliferation poses an increased demand on lipid synthesis for biogenesis, and fatty acids play a crucial role in the generation of signaling intermediates and fulfil an important function as catabolic reservoir in normal and in cancer cells. MYC is involved in several aspects of fatty acid synthesis and oxidation as shown by metabolic tracing experiments in Myc−/− and Myc+/+ rat fibroblasts [123]. Furthermore, metabolomic studies in MYC-driven lymphomas identified specific alterations in lipid composition compared to normal tissue [124]. Interestingly, in a comparative study on the fatty acid composition in plasma from MM patients and healthy controls it was demonstrated that saturated and n-6 polyunsaturated fatty acids were increased in MM patients, likely reflecting elevated endogenous production by MM cells. Through its effects on the TCA cycle, MYC promotes the production of citrate and drives the expression of ATP citrate lyase (ACLY) [125], which catalyzes the formation of acetyl-CoA, an important step in fatty acid synthesis. Moreover, MYC also regulates the expression of acetyl-CoA carboxylase 1 (ACC1), fatty acid synthetase (FASN) and stearoyl-CoA desaturase 1 (SCD1), which are involved in fatty acid synthesis [123,126]. Of interest, an RNAi-based loss of function screen showed that ACC1 is required for MM cell survival, and ChIP-seq experiments showed that MYC was bound to the ACC1 promoter in MM cells [127]. The expression of SCD1 was found to be upregulated in MM patients and correlated with a proliferation gene signature dictated by MYC, underscoring the functional association between fatty acid synthesis and MYC in MM (Figure 2, Table A1). Small molecule inhibitors for SCD1 decreased proliferation but had a moderate effect on MM cell survival [128]. In addition, inhibition of fatty acid oxidation using the carnitine palmitoyl-transferase 1a (CPT1a) inhibitor etomoxir induced cell death in MM cell lines, indicating that MM cells could also use fatty acids to fuel mitochondrial respiration [129].
The central role of MYC in fatty acid synthesis requires the nutrient-sensing transcription factor MondoA, and knockdown of MondoA induced cell death in several cancer cell lines, showing a synthetic lethal interaction with the expression of MYC [130]. These results indicate that MondoA may also be part of the cellular response to tolerate MYC deregulation. Whether MondoA is involved in the increased fatty acid synthesis in MM remains to be established. MYC also induces the expression of sterol-response element-binding protein 1 (SREBP1), which participates in the regulation of genes involved in fatty acid synthesis [126]. SREBP1 is activated by AKT signaling, which is constitutively active in MM. Downstream of AKT signaling, SREBP1 coordinates the metabolic flux from glycolysis to fatty acid synthesis and is critically involved in cell growth [131]. The regulation of SREBP1 is another example of how both AKT and MYC orchestrate the metabolic demands imposed by increased (oncogenic) proliferation and growth, emphasizing the interdependency of AKT and MYC for malignant transformation and maintenance.
In addition to fatty acid regulation, MYC plays a pivotal role in the mevalonate pathway that is responsible for the production of cholesterol and protein prenylation, including geranylgeranylation and farnesylation. MYC increases the expression of the rate-limiting hydroxymethylglutaryl coenzyme A reductase (HMGCR), which is involved in several cancer types [132]. Similar as for fatty acid synthesis, MYC acts in concert with SREBP1 to drive HMGCR expression [126]. HMGCR is the target of statins that act to lower cholesterol levels, and statins were shown to induce cell death in several different cancer types, including MM [133,134,135]. It was recently reported that the mevalonate pathway is of crucial importance for survival of the t(4;14)-positive subset of MM, which is characterized by FGFR3 and MMSET expression. Statins specifically induced apoptosis of t(4;14)-positive MM cells; however, the effect appeared to be independent of FGFR3 or MMSET expression, but was related to the activation of an integrated stress response resulting from loss of protein prenylation. MYC may be involved in this phenotype, since it was shown that MMSET stimulated MM cell growth by repressing mIR-126*, which targets MYC [136].
2.4. MYC and Nucleotide Metabolism in MM
To sustain increased proliferation, cancer cells are characterized by an increased demand on nucleotide synthesis. In addition here, MYC was shown to be a central regulator that drives the expression of several genes involved in pyrimidine and purine synthesis [137,138] (Figure 2). Nucleotide synthesis requires glycine and aspartate, which may be derived from glucose and glutamine. Glycine is generated from glucose by phosphoglycerate dehydrogenase (PHGDH) and phosphoserine aminotransferase 1 (PSAT1), and the expression of both enzymes is upregulated through MYC [95]. Interestingly, inhibition of PHGDH was recently shown to reduce MM cell growth and was involved in resistance to the proteasome inhibitor bortezomib in MM [139]. The carbamoyl-phosphate synthetase 2, aspartate transcarbamylase, dihydroorotase (CAD) enzyme is involved in initial steps of pyrimidine biosynthesis and was found to be a direct target of MYC [140]. In addition, MYC regulates dihydroorotate dehydrogenase (DHODH), which catalyzes the subsequent step in pyrimidine synthesis. Furthermore, oxidation of dihydroorotate by DHODH provides electrons for the mitochondrial electron transport chain, coupling nucleotide synthesis to ATP production. DHODH is expressed in MM cells and is essential for cell growth, as it was demonstrated that the specific DHODH inhibitor A771726 induced a G1 cell cycle arrest in MM cell lines. Interestingly, A771726 also inhibited AKT signaling [141], which could potentially interfere with MYC expression and activity in MM cells by activating FOXO [65]. In agreement, DHODH inhibitors and DHODH knockdown downregulated MYC expression in MM cells [142].
Purine synthesis critically hinges on the activity of the phosphoribosylformylglycinamide synthetase (PFAS) enzyme. Induced MYC expression in the engineered P493-6 cell line strongly activated the expression of PFAS [137]. Furthermore, ChIP-seq experiments confirmed direct MYC binding to this gene [143]. It was recently shown that de novo purine synthesis is stimulated by the extracellular signal-related kinase (ERK), which phosphorylates PFAS and is required for tumor growth [144]. ERK is constitutively activated in MM and stabilizes MYC protein by direct phosphorylation and by controlling the PI3K pathway [67]. We speculate that by these means ERK and MYC are part of a positive feedback mechanism that drives purine synthesis in MM cells. As described above, MYC is also important for the generation of ribose-5-phosphate, which is the scaffold for purine synthesis.
2.5. MYC and Mitochondrial Biogenesis in MM
Glycolysis, glutaminolysis and fatty acid oxidation primarily drive the TCA cycle for anaplerosis and to generate ATP, which takes place in the mitochondria, and are critically controlled by MYC in cancer cells. Mitochondrial mass is subject to homeostatic control, and during cell growth mitochondrial biogenesis is increased. In resting cells, mitochondrial biogenesis is coordinated by peroxisome proliferator-activated receptor gamma coactivator 1-alpha (PGC1α), whereas this is controlled by MYC in proliferating cells [145,146,147]. Furthermore, mitochondrial activity is associated with altered rates of mitochondrial fusion and fission, which were also found to be regulated by MYC. It was shown that re-expression of Myc in Myc−/− fibroblasts resulted in the increase in mitochondrial mass by favoring mitochondrial fusion over fission [148]. In MM cells, the expression of several genes involved in mitochondrial biogenesis were found to be upregulated compared to normal plasma cells [149]. Of interest, a recent report described an alternate mechanism by which MM cells may fulfil metabolic demands; in co-culture studies it was shown that mitochondria are transferred from bone marrow stromal cells to MM cells, which involved the formation of CD38-dependent nanotubes [150]. It was suggested that the transferred mitochondria might stimulate the function of the MM cell mitochondria, perhaps through mitochondrial fusion regulated by MYC [151]. In addition, the mitochondrial fission factor (MFF) was identified as a transcriptional target of MYC, and was found to be overexpressed in cancer cells. MFF was shown to associate with the voltage-dependent anion channel-1 (VDAC1) and to be of crucial importance for mitochondrial fitness. MMF silencing resulted in the loss of mitochondrial membrane potential and apoptosis [152].
The broad scale effects of MYC overexpression on metabolic genes in MM and the fact that knockdown of these genes, or inhibition of these enzymes, are generally lethal suggests that MYC overexpression results in a metabolic Achilles’ heel that could be exploited therapeutically.
3. Cyclin D1 Regulation in MM
Cyclin D1 (CCND1) was originally identified as an oncogene in parathyroid tumors and is upregulated in lymphoid malignancies, including MM. Cyclin D1 is a member of the D-type cyclin family, with other members being cyclin D2 and cyclin D3 [153], which are well known for their canonical functions in regulating the G1 to S phase transition of the cell cycle. D-type cyclins form a complex with either cyclin-dependent kinase 4 (CDK4) or CDK6 and phosphorylate the retinoblastoma protein (RB). This leads to the inactivation of RB, which then releases E2 factor (E2F) transcription factors from its repressive function, promoting cell cycle progression. As such, cyclin D1 expression is tightly regulated during the cell cycle in somatic cells, and uncontrolled expression of cyclin D1 results in bypassing of the cell cycle checkpoints and can eventually lead to neoplastic growth [154]. RAS- and JAK/STAT-mediated signaling pathways both increase CCND1 transcription during the G1 phase under the influence of growth factors, hormones and cytokines [155]. Phosphorylation of cyclin D1 on residue threonine 286 triggers nuclear exclusion, ubiquitination and proteasomal degradation. Glycogen synthase kinase 3b (GSK3B) and p38 mitogen-activated kinase (MAPK) in combination with ERK are known to phosphorylate cyclin D1 on this residue [156,157]. Cyclin D1 degradation is required before the cell can enter S phase as it interacts with proliferating cell nuclear antigen (PCNA) and in this way inhibits DNA replication [158]. GSK3b is negatively regulated downstream of RAS through AKT and ERK, and MAPK is directly downstream of RAS signaling. As such, RAS activation indirectly inhibits cyclin D1 proteolysis [159].
Next to its canonical role in the cell cycle by interacting with CDK4/6, there is evidence that cyclin D1 influences transcription of other genes. Cyclin D1 is known to bind to more than 30 different transcriptional regulators, amongst which are nuclear receptors, chromatin modifying proteins and transcription factors [160]. One interesting example is STAT3, which induces cyclin D1 expression, although cyclin D1 in turn represses STAT3 function [161]. A genetic-proteomic screen in mice revealed that cyclin D1 was found on more than 900 promoter regions and physically interacted with transcription factors that target these regions [162]. As such, cyclin D1 can influence transcriptional regulation, the DNA damage response pathway, tumor migration and several metabolic pathways [163].
Cyclin D1 expression is frequently elevated in cancer, usually through amplification of the CCND1 locus, which is associated with a poor prognosis in solid tumors [164]. In B-cell lymphomas, cyclin D1 overexpression is often due to the t(11;14)(q13;q32) translocation, juxtaposing the IGH locus to the CCND1 locus. This translocation is found in nearly 100% of mantle cell lymphomas (MCL), but is also one of the most recurrent translocations in MM, where it is found in 15–25% of all cases. In MCL, this translocation arises during VDJ recombination in developing B cells, whereas illegitimate CSR is responsible for this translocation in MM [165]. Regardless of the t(11;14) translocation, nearly 50% of MM cases show cyclin D1 expression, whereas it is not expressed in normal plasma cells. In the remaining 50% of MM cases cyclin D2 or D3 are often overexpressed, usually as a consequence of FGFR3/MMSET and/or MAF dysregulation, suggesting that D-type cyclin overexpression is one of the hallmarks of MM [166,167]. Of interest, MYC was shown to inhibit cyclin D1 through repression of its promotor [168,169]. The dysregulated expression of D-type cyclins in MM appears to be an early event in MM pathogenesis and seems to drive proliferation, as is observed in many other cancers [167,170]. However, there is some debate whether cyclin D1 overexpression impacts prognosis in MM, whereas cyclin D2 overexpression was found to be associated with a worse outcome [171,172,173,174]. There is some evidence that cyclin D1 expression affects cellular metabolism. For instance, it was recently shown that cyclin D1 can augment AKT serine 473 phosphorylation, thereby promoting AKT activation, which is critically involved in the regulation of several metabolic pathways [175]. Interestingly, AKT negatively regulates GSK3β kinase and FOXO transcription factors through phosphorylation, which both inhibit Cyclin D1 expression, essentially creating a feed forward loop [176].
3.1. Cyclin D1 and Glucose Metabolism in MM
Cyclin D1 has been implicated in the regulation of glucose metabolism (Figure 2, Table A1). For instance, in an in vivo breast cancer mouse model, it was demonstrated that CCND1 silencing enhanced glycolysis and mitochondrial activity, whereas CCND1 overexpression in the mammary glands inhibited not only glycolysis, but also fatty acid synthesis and the expression of several key mitochondrial genes [177]. In B cells, the ectopic expression of cyclin D1 was shown to decrease OXPHOS through a CDK4/6-independent mechanism where cyclin D1 competes with HK2 for binding to the VDAC1, which regulates OXPHOS [178] (Figure 2). This may indicate that cyclin D1 helps to facilitate the shift from OXPHOS to glycolysis observed in MM. This notion is supported by Caillot et al., who suggest that HK2, VDAC1 and cyclin D1 colocalize in the cytosol of the LP-1 MM cell line. In their experiments, overexpression of cyclin D1 in LP-1 cells led to a shift from OXPHOS to glycolysis via increased expression of HK2 [45]. The augmented activation of AKT by cyclin D1 may also drive glycolysis, as was observed in other cancer types [179]. Interestingly, the glycolysis enzyme PKM2 was shown to drive cyclin D1 expression by an epigenetic mechanism involving the release of histone deacetylase 3 (HDAC3) from the CCND1 promoter [180]. It is conceivable that cyclin D1 and PKM2 constitute a feedforward loop that contributes to the metabolic shift towards glycolysis. Whether such a feedforward loop is operable in cyclin D1-expressing MM cells remains to be established.
Little is known of the effects of cyclin D2 on glucose metabolism, although a clear effect of cyclin D3 has been described. In T-cell acute leukemia (T-ALL) cells, inhibition of the cyclin D3-CDK6 complex resulted in inhibition of phosphofructokinase 1 (PFK1) and PKM2, which redirected glucose metabolites into the PPP and the serine biogenesis pathway [181]. Both these pathways were implicated in resistance to bortezomib treatment in MM patients [167,182]. However, whether cyclin D3 expression in MM is associated with bortezomib sensitivity is unknown.
3.2. Cyclin D1 and OXPHOS in MM
Cyclin D1 has also been implicated in the regulation of OXPHOS. In hepatocytes it was shown that insulin activated the cyclin D1/CDK4 complex to phosphorylate the general control non-repressed 5 protein (GCN5), which is an acetyltransferase that targets PGC1α and inhibits its function, resulting in the repression of gluconeogenesis and OXPHOS [183] (Figure 2, Table A1). The cyclin D1-dependent repression of PGC1α was abrogated in the presence of a CDK4 inhibitor, or upon expression of mutant cyclin D1 mutant that could no longer activate CDK4 [184]. PGC1α has been shown to be upregulated in MM cell lines under conditions of high glucose and/or treatment with dexamethasone [185]. Furthermore, PGC1α knockdown in the RPMI-8226 MM cell line resulted in increased expression of the GLUT4 glucose transporter (SLC2A4), which may drive glycolysis and OXPHOS due to increased glucose uptake [186]. PGC1A expression is increased in MM compared to normal plasma cells and high expression of PGC1A in MM was associated with a modest but significant survival disadvantage [177]. These observations could be explained by the effect that cyclin D1 has on PGC1α, possibly by enhancing CDK4-mediated inhibition of PGC1α. Interestingly, Ccnd1−/− mice showed a two- to three-fold increase in mitochondrial size and activity in hepatocytes and mammary gland adipocytes. Mitochondrial activity was also increased in hepatocytes, mouse embryonic fibroblasts (MEFs) and macrophages from the Ccnd1−/− mice. It was demonstrated that cyclin D1 inhibited the expression and the activity of the nuclear respiratory factor 1 (NRF1), which indirectly controls mitochondrial DNA replication [187]. Treatment of MM cells with proteasome inhibitors resulted in NRF1 upregulation, which was shown to be involved in resistance to proteasome inhibitors by ramping up proteasome subunit gene expression and potentially mitochondrial biogenesis [188]. Whether this has consequences for OXPHOS in MM cells remains to be established. However, in agreement, it was found that the expression of mitochondrial biogenesis and OXPHOS signature genes were increased in MM cells compared to normal plasma cells. Furthermore, relapsed and drug-resistant MM patients had higher expression of mitochondrial biogenesis signature genes than newly diagnosed patients [149].
3.3. Cyclin D1 and Lipid Metabolism in MM
Cyclin D1 has been described to influence fatty acid metabolism. Knockdown and overexpression experiments in hepatocytes and breast cancer cells demonstrated that cyclin D1 represses fatty acid oxidation by inhibiting peroxisome proliferator-activated receptor alpha (PPARα) activity, a nuclear receptor that induces fatty acid oxidation. By use of a cyclin D1 mutant that is unable to activate CDK4, it was shown that CDK4 was not involved in the regulation of fatty acid oxidation [189]. In addition, PPARγ was also reported to be negatively regulated by cyclin D1 [190,191]. PPARγ is mainly expressed in adipose tissue where it stimulates lipid uptake and storage upon activation through binding polyunsaturated fatty acids [192]. Interestingly, PPARγ is also expressed in MM and overexpression of PPARγ, or exposure of MM cells to its ligands, provoked apoptosis in MM cell lines [193,194]. The mechanism of this apoptotic effect remains poorly understood and whether this is particularly toxic for cyclin D1-expressing MM, or involves lipid metabolism, is unknown.
In addition to fatty acid oxidation, cyclin D1 also appears to regulate de novo fatty acid synthesis. In hepatocytes it was shown that cyclin D1 inhibited the expression of several key genes involved in fatty acid synthesis such as FASN, pyruvate kinase L/R (PKLR) and thyroid hormone responsive (THRSP), by inhibiting promoter recruitment of the carbohydrate response element binding protein (chREBP) and hepatocyte nuclear factor 4a (HNF4A), which both critically regulate lipid metabolism [195]. Of interest, activation of HNF4A expression was shown to be associated with proteasome inhibitor resistance in MM cell lines, but whether this impacted on lipid metabolism is unknown [196]. Importantly, serum metabolomics indicated a significant change in lipid composition in MM patients compared with healthy donors [197,198], but the potential relation with cyclin D1 expression was not explored. From these results it is clear that next to its canonical role in the regulation of cell cycle progression cyclin D1 also has a role in the regulation of cellular metabolism, similar to MYC, albeit to a lesser extent, and with some striking differences.
4. FGFR3 Deregulation in MM
Around 10–15% of MM patients harbor the t(4;14)(p16;q32) translocation that results in overexpression of the receptor tyrosine kinase FGFR3 and the histone methyltransferase MMSET [1,2]. Although overexpression of MMSET is universal in t(4;14) [199], approximately 30% of t(4;14) patients is FGFR3 negative [4,5]. Interestingly, the t(4;14) translocation is associated with poor prognosis in MM regardless of FGFR3 expression [6,7]. FGFR3 is a receptor tyrosine kinase that belongs to the FGFR-family of growth factor receptors. Twenty-two members of the FGF family have been identified in humans and a large part of the functional specificity of FGFR activity is determined by binding of distinct FGFs. In accordance, knockout of different Fgf family members has diverse and distinct consequences in mice and some Fgf knockouts are embryonic lethal (reviewed in [200]). FGFs can function in an autocrine and/or paracrine fashion, but can also mediate FGFR-activation over longer distances [200]. In addition to FGFR3 overexpression in t(4;14) MM, mutations in the FGFR3 gene have also been reported in several cancers, including MM [201,202,203,204]. The most common mutations found in FGFR3 occur in the regions coding for the extracellular and transmembrane parts of the protein, resulting in increased receptor dimerization and ligand-independent signaling [205]. Regardless of mode of activation, FGFR engagement results in activation of MAPK-signaling through FGFR-substrate 2 (FRS2) mediated recruitment of son of sevenless (SOS) and growth factor receptor-bound 2 (GRB2). Recruitment of GRB2-associated binding protein 1 (GAB1) to the FRS2 complex results in activation of the PI3K/AKT pathway. Furthermore, binding of phospholipase Cγ (PLCγ) to the carboxy-terminal tail of autophosphorylated FGFR stimulates the release of intracellular calcium which results in activation of the protein kinase C (PKC) family of proteins. Moreover, FGFRs can activate the JAK-STAT pathway, further diversifying FGFR signaling [14,15].
4.1. FGF/FGFR and Glucose Metabolism in MM
Although MMSET and FGFR3 overexpression are not likely to be directly linked in t(4;14) MM, activity of either protein can influence MM cell metabolism. Interestingly, FGFR-amplified cells were dependent on glucose instead of glutamine for growth, a trait shared with epithelial growth factor receptor (EGFR)-amplified cells. Wildtype cells lacking these gene alterations showed variable dependency on glucose or glutamine for sustaining growth [206]. Similar to most RTKs, FGFR3 can activate the MAPK-ERK [207] signaling pathway and the PI3K-AKT pathway [208,209], sustained signaling through which can influence metabolic flux by the canonical metabolic master regulators MYC and mTORC, respectively (Figure 3). However, the FGF/FGFR axis exerts metabolic control beyond the regular signaling functions of a receptor tyrosine kinase. Indeed, FGF signaling is a critical regulator of vascular development through regulation of HK2 [210]. In this context, loss of FGFR signaling resulted in hampered HK2 levels, decreased glycolysis and impaired proliferation and migration of endothelial cells. Additional evidence that FGFR may be involved rewiring glucose metabolism was provided by overexpression of FGFR in the Ba/F3 mouse pro-B cell line. Functional metabolomics showed that FGFR overexpression enhanced glycolysis and at the same time upregulated consumption of extracellular lactate to fuel OXPHOS (Figure 2, Table A1). Interestingly, glucose and lactate had an equal contribution in fueling OXPHOS in FGFR-overexpressing cells. Moreover, several glycolysis genes such as LDHA, HK2, GLUT1, and ATP-dependent 6-phosphofructokinase (PFKL) were shown to be upregulated in FGFR-overexpressing cells, resulting in an increased dependence on glycolysis. Mechanistically, these metabolic changes involved HIF1α and MYC, as both were found to be upregulated in FGFR-overexpressing cells, and conversely, downregulated when FGFR was inhibited [206]. Based on these results we speculate that MYC and FGFR3 aberrations have overlapping functions in MM, and may collaborate to skew the metabolic features of MM cells. In agreement, it was shown that Fgfr3 and Myc collaborated to drive mouse lymphomagenesis in a transgenic model [211]. The potential functional connection between FGFR3 and MYC in MM is also apparent from a recent study where it was shown that autocrine FGF/FGFR signaling was shown to protect MM cells from oxidative-stress induced apoptosis [212]. In this paper, the authors show that blocking FGF/FGFR3 signaling through trapping of FGF ligands or by inhibiting the FGFRs leads to proteasomal degradation of MYC through activation of GSK3, which is negatively regulated by AKT. The authors confirmed the role of MYC in this process by overexpressing a non-degradable MYC mutant, which prevented FGF-trapping induced production of mitochondrial reactive oxygen species (mtROS) and apoptosis.
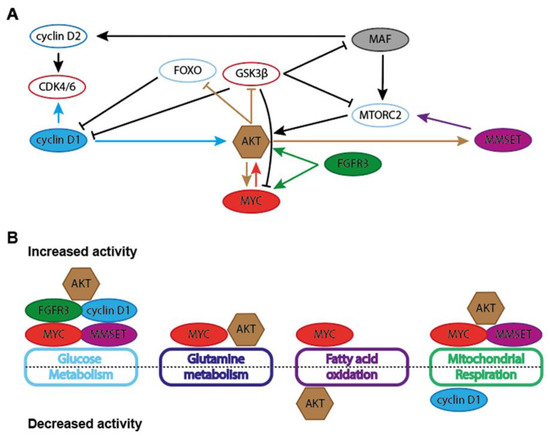
Figure 3.
Schematic representation of general metabolic effects of MM-associated oncogenes. (A) Interdependencies and functional associations between MYC, cyclin D1, MMSET, FGFR3, AKT and MAF in the regulation of metabolic features in cancer cells. (B) Schematic depiction of general effect MM-asociated oncogenes on the activity of several metabolic pathways. Glucose metabolism entails glycolysis, pentose phosphate pathway (PPP), serine synthesis pathway (SSP) and hexosamine biosynthesis pathway (HBP). Mitochondrial respiration includes the tricarboxylic acid (TCA) cycle and oxidative phosphorylation (OXPHOS).
Based on these observations it is likely that FGFR3 signaling in MM cells would also result in increased glutaminolysis by upregulation of MYC expression and activity, although this was not apparent in FGFR-overexpressing Ba/F3 cells [206].
4.2. FGFR3 and Lipid Metabolism in MM
FGFR3 was shown to play a specific role in de novo fatty acid and sterol biosynthesis and metabolism [213] (Figure 2, Table A1). FGFR3 knockdown and gene expression profiling in bladder cancer cells revealed a gene signature linking FGFR3 signaling to fatty acid synthesis. Signaling through FGFR3 led to the cleavage and activation of SREBP1 in a PI3K/AKT/mTORC1 dependent manner. SREBP1 regulates the expression of several lipogenic enzymes, including SCD1. Knockdown of SCD1 reduced cell cycle progression and proliferation and induced apoptosis in a bladder cancer xenograft model [213]. Thus, FGFR3 steers the biosynthesis of monounsaturated fatty acids in bladder cancer, suggesting that FGFR3 may potentially also regulate lipid homeostasis in MM. Recent insights into lipid metabolism in MM indicate an important role for altered lipid homeostasis, as increased acid sphingomyelinase (ASM, which converts sphingomyelin to ceramide) expression contributes to drug resistance to melphalan and bortezomib, a drug-resistance phenotype that could be transferred to chemosensitive cells through exosomes [214]. Of note, ASM activity in MM cells can be stimulated by epigallocatechin-3-O-gallate-induced production of cyclic guanosine monophosphate (cGMP), leading to activation of PLCγ and subsequent activation of protein kinase Cδ (PKCδ), suggesting FGF/FGFR signaling can induce ASM activity through PLCγ [215]. Indeed, FGFR3 mutants with reduced capacity for PLCγ activation strongly attenuated, but not abolished, transformative capacity in Ba/F3 cells and in a bone marrow murine leukemia transplant model, underling the importance of PLCγ for oncogenesis downstream of FGFR3 [216]. Interestingly, PLCγ can activate AMPK in a Ca2+-dependent manner that involves mTOR, providing an additional layer of metabolic control to FGF/FGFR signaling [217,218]. Importantly, FGF2 and FGF8, two principal ligands for FGFR3, potently enhanced PLCγ phosphorylation and downstream signaling in MM cells, showing that FGFR3-mediated PLCγ activation is operable in MM cells [219]. Whether AMPK may be activated upon FGFR3 engagement on MM cells remains to be established, but it must be noted that AMPK activation inhibited the growth of MM cell lines by negatively regulating AKT [220], making it unlikely that AMPK signaling is involved in the oncogenic effects of FGFR3 in MM cells.
Next to fatty acid synthesis, the mevalonate pathway was also implicated in t(4;14) MM. It was demonstrated that inhibition of the rate-limiting enzyme HMGCR by statin treatment is preferentially toxic to t(4;14) MM cells [221]. Inhibition of HMGCR through fluvastatin activated the integrated stress response (ISR), a stress response induced by ER stress and nutrient deprivation, amongst other things. Activation of this response resulted in phosphorylation of the eukaryotic translation initiation factor 2A (eIF2a) and subsequent attenuation of global mRNA translation. Simultaneously, phosphorylation of eIF2a allows for the selective translation of proteins involved in cell survival and recovery, such at ATF4. Experiments assessing glucose regulated protein 78 (GRP78) and XBP1 splicing (integral parts of the UPR) showed that fluvastatin treatment induced ATF4 target gene expression in an ER-stress independent manner, as treatment with fluvastatin treatment had no effect on GRP78 and XBP1 levels. Statin-induced apoptosis could be prevented by addition of the mevalonate pathway product geranylgeranyl pyrophosphate (GGPP) but not by supplementation with farnesyl pyrophosphate (FPP). Treatment of t(4;14) MM cells with geranylgeranylation inhibitor induced ISR-related gene expression, but this response was absent in non-t(4;14) MM cells. The authors speculate that t(4;14) MM cells require the mevalonate pathway activity, in part, for protein prenylation.
5. MMSET Deregulation in MM
MMSET, also known as nuclear receptor-binding SET domain 2 (NSD2) and Wolf-Hirschorn Syndrome Candidate 1 (WHSC1), regulates chromatin integrity and gene expression through methylation of histone lysine residues [222] and the its primary chromatin-regulating catalytic activity is dimethylation of histone H3 at lysine 36 (H3K36me2), resulting in a more open chromatin state [223,224]. Another consequence of increased MMSET expression is a global reduction of trimethylation of lysine 27 on Histone H3 (H3K27me3) [225]. Accordingly, the t(4;14) translocation in MM induces increased lysine 36 and decreased lysine 27 methylation across the genome, resulting in a more accessible chromatin state and changes in expression of proteins involved in integrin signaling, p53 signaling and cell cycle regulation [225,226,227,228]. Interestingly, certain genomic loci actually show an increase in H3K27 methylation and enhanced recruitment of enhancer of zeste homolog 2 (EZH2), leading to transcriptional repression of genes located on these loci. MMSET overexpressing cells showed high sensitivity to compounds inhibiting EZH2, suggesting that repression of these genes is important for MMSET overexpressing tumors [229]. Hemizygous loss of Mmset caused a significant decrease in B- and T-lymphocyte numbers in aging mice [230]. Competitive fetal liver transplant experiments showed that all types of Mmset−/− blood cells were outcompeted compared to wildtype cells, indicating a developmental disadvantage in Mmset−/− lineage cells. Serial transplants of Mmset−/− cells showed reduced repopulation potential after tertiary transplants as compared to wildtype cells. Furthermore, secondary transplant recipients had very few T cells and no B cells, suggesting severe B-cell developmental deficiency upon Mmset deletion. Moreover, immunoglobulin class switching efficiency was reduced in MMSET null cells due to a proliferative defect and an increase in apoptosis. Further analysis showed cell-cycle progression defects, defects in ribosome synthesis, splicing defects and decreased DNA-damage repair capacity [230]. Moreover, MMSET was reported to increase AID-mediated DNA breaks in donor switch regions during CSR, underlining the importance of functional MMSET in B-cell development as a critical mediator of antibody diversification and immune function [231]. MMSET was found to be involved in DNA repair through its histone methylation activity that stimulates non-homologous end-joining and by promoting AID-instigated DNA breaks, which are both required for class switching [231,232]. Knockdown of MMSET in U2OS cells led to decreased protein expression of the DNA repair proteins RAD51 and 53BP1, suggesting that MMSET may also play a role in the transcriptional control of DDR proteins. Finally, knocking down MMSET in a mouse MM xenograft model strongly increased melphalan sensitivity. MMSET thus drives increased DDR, thereby increasing resistance to chemotherapeutic drugs [233].
Metabolic Consequences of MMSET Deregulation in MM
MMSET also modulates a diverse range of metabolic processes, often in a context-dependent manner. Tamoxifen-resistant breast cancer cell lines showed increased MMSET expression and concomitant elevated expression of key glycolytic enzymes HK2, G6PD and TIGAR as a consequence of promoter dimethylation at H3K36 by MMSET [234]. The MMSET-mediated increase in glycolysis concomitantly heightened the activity of the PPP, which is of vital importance for cellular redox balance in B cells [235,236] (Table A1). Another interesting feature of MMSET transcriptional control is prevention of senescence, which is linked to profound metabolic changes. An siRNA based screen of chromatin regulators uncovered that MMSET knockdown induced senescence in primary human fibroblasts and increased mitochondrial mass and OXPHOS [237]. Interestingly, reduced expression of MMSET was observed in oncogene-induced and replicative-senescent cells, coupled with diminished H3K36me3 levels. Interestingly, MMSET expression levels were correlated with cell-cycle related genes and expression of MMSET was upregulated by serum stimulation, due to direct phosphorylation of MMSET by AKT [237]. AKT stabilized MMSET protein expression and provoked the MMSET-dependent expression of RICTOR, an important component of mTORC2, thereby further enhancing AKT-activity [238].
A truncated isoform of MMSET (MMSET I) was shown to possess a specific metabolic function in t(4;14). MM [239]. MMSET I drives expression of glyoxalase 1 (GLO1), a crucial enzyme in the detoxification of the aldehydes that are normal byproducts of cellular metabolism [240]. ChIP analysis showed that GLO1 is a direct transcriptional MMSET I target. Interestingly, GLO1 knockdown induced apoptosis and reduced colony formation potential of t(4;14) myeloma cells, mainly by reducing the levels of the antiapoptotic proteins MCL1 and BCL-2. Furthermore, MMSET I knockdown reduced glycolysis, which was partially rescued by ectopic overexpression of GLO1 [239]. Taken together, these results indicate that MMSET activity drives glycolysis and PPP-activity, while inhibiting OXPHOS.
6. MAF Deregulation in MM
The t(14;16) and t(14;20) translocations deregulate c-MAF and MAFB and are relatively rare events in MM [241,242,243]. In t(14;16) MM, this results in overexpression of the transcription factor MAF and in overexpression of transcription factor MAF homolog B (MAFB) in t(14;20) MM. An even smaller group of MM cases harbor a translocation juxtaposing the MAFA gene, leading to aberrant expression of MAFA [241,244]. Different MAF translocations confer a similar prognosis in newly diagnosed MM patients, possibly due to functional redundancy of MAF proteins in MM [245]. The MAF transcription factors belong to the AP1 -super-family of basic leucine zipper proteins, a family that also includes the transcription factor families FOS, JUN, CREB and ATF [244]. Transcription activation by large MAF proteins is achieved by recruiting p300/CBP-associated factor (P/CAF) [246], p300 (also known as EP300) [247] or tata-box binding protein (TBP) [248]. Transcriptional activation by the large MAF proteins (MAFA, MAFB, c-MAF and NRL) is negatively regulated by homodimers of the small MAF proteins (MAFF, MAFG and MAFK) through competitive binding [244], indicating that the ratio of small/large MAF proteins is an important determinator of MAF-mediated gene regulation [249]. Under physiological circumstances and during development, expression of MAF proteins is restricted and tightly regulated [244,250,251]. Stringent spatio-temporal regulation of expression is important, since MAF proteins play important roles in tissue specification and differentiation [252,253]. Several posttranslational modifications also play a role in controlling MAF protein activity, such as phosphorylation by GSK3 [246,254], through FGFR/ERK signaling [255] and by p38 MAP kinase [256]. Phosphorylation by GSK3 promotes ubiquitination and degradation of MAF but also stimulates recruitment of co-activator P/CAF, enhancing transactivation activity of MAF and protecting the protein from degradation [246,254]. Stability of MAF proteins in MM is further regulated by the deubiquitinases ubiquitin-specific peptidase 5 (USP5), which prevents degradation of c-MAF and MAFB [257], and USP7, which can deubiquitinate c-MAF, MAFA and MAFB [258].
The large MAF genes are oncogenes and have transformative capabilities in a wide range of tissue backgrounds, such as in primary fibroblasts [259,260]. Moreover, c-MAF is overexpressed in 60% of angioimmunoblastic T-cell lymphomas in humans [261] and expression of c-MAF in the T-cell compartment in transgenic mice results in development of T-cell lymphomas [262]. Transgenic mice with Maf expression targeted to B cells develop B-cell lymphoma with features resembling MM but fail to fully recapitulate human-like MM [263]. However, expressing MAFB in hematopoietic stem/progenitor cells caused the development of plasma cell neoplasia that recapitulated human disease [264], a phenotype that was accelerated by loss of Tp53 [265]. Interestingly, overexpression of c-MAF is not exclusive to MM cases that harbor t(14;16), and the percentage of MM cases that overexpress MAF is around 50%, mainly because of high expression in the t(4;14) and the t(11;14) MM cases [266,267,268], although the transcriptional consequences of MAF expression in non-translocated MM are modest as judged by gene expression-based clustering [269]. Interestingly, the MMSET and MAF groups show similar gene expression profiles [269]. Overexpression of MAF in MM that is not attributable to a translocation can be driven by TNFRSF13B (also known as TACI) and/or XBP1, as high expression of TNFRSF13B is associated with high expression of MAF and lymphoid-specific XBP1 transgenic mice show deregulated c-MAF and MAFB expression [270,271]. Expression of MAF proteins can also be regulated by MEK/ERK activity, as inhibition of MEK induced downregulation of MAF mRNA in MMSET/MAF translocated MM [272]. Of note, t(14;16) and t(14;20) were strongly associated with an apolipoprotein B mRNA editing enzyme (APOBEC) mutational signature and knockdown of c-MAF or MAFB resulted in downregulation of apolipoprotein B mRNA editing enzyme (APOBEC) proteins, suggesting a reciprocal relation between MAF and APOBEC that drives ongoing mutagenesis in these MM subsets [273,274].
Another important oncogenic role of MAF proteins in MM is attenuating proteasome inhibitor toxicity. Patients with t(14;16) MM do not benefit from the addition of bortezomib to standard therapy regimens when compared to other MM subsets [275]. Indeed, high expression of MAF is associated with innate resistance to proteasome inhibitor treatment [276,277,278] and silencing MAF sensitized MM cells to proteasome inhibitors, while proteasome inhibition abrogated GSK3β-mediated degradation of c-MAF, effectively stabilizing MAF activity [276,278]. In accordance, overexpression of c-MAF induced resistance to proteasome inhibitor treatment [276].
6.1. MAF Target Genes, Associated Mutations, and Metabolic Effects of MAF
MM cases that carry MAF translocations share a distinct gene expression signature that is similar between different MAF proteins [115,279]. In a cohort of 1273 newly diagnosed patients, the t(14;16) translocation was associated with mutations BRAF, TRAF2 and DIS3 (mutations that affect MAPK-signaling, NFKB signaling and exosome formation), deletion of 13q, gain of 1q and the aforementioned APOBEC signature [115]. Genes strongly associated with MAF overexpression in MM include CCND2, integrin-β7 (ITGB7), C-C chemokine receptor-1 (CCR1) [266,280], AMPK-related protein kinase 5 (ARK5) [281] and DEPTOR [268]. MAF can therefore directly regulate proteins involved in cell cycle regulation (CCND2), MM cell homing, migration and adhesion (ITGB7, CCR1), insulin growth Factor-1 (IGF1) mediated invasion (ARK5) and PI3K/AKT/mTORC signaling (DEPTOR) (Figure 3). This suggests a potentially multifaceted role for MAF family members in metabolic control.
6.2. MAF and Glucose Metabolism in MM
MAF proteins play an important role in the regulation of insulin secretion. MAFA, in conjunction with the insulin promoter factor 1 (PDX1) transcription factor, can stimulate production and secretion of insulin in response to glucose by reprogramming islet non-β-cells [282]. High levels of glucose, but not pyruvate, can stimulate MAFA expression in pancreatic β-cell lines in a mechanism dependent on the HBP, a pathway linked to glycolysis via fructose-6-phosphate [283]. As such, the HBP links nutrient sensing and energy metabolism to posttranslational protein modifications, indicating that HBP flux and cellular metabolism are tightly associated [284]. Treatment with the chemotherapeutic drugs doxorubicin and camptothecin activated the HBP in an AKT/XBP1 dependent manner [285]. Interestingly, increased activity of the HBP is associated with resistance to proteasome inhibitors through differing mechanisms. Stabilization of NRF1 by O-linked N-acetylglucosamine transferase (OGT), a protein that catalyzes the addition of GlcNAc moieties, elevated the expression of several proteasomal subunit genes, leading to proteasome inhibitor resistance in breast cancer and non-small cell lung cancer cell lines [286]. In another study, bortezomib-resistant U266 MM cells were shown to have increased numbers of mitochondria and elevated levels of the mitochondrial biogenesis markers PGC1α and the NAD-dependent deacetylase sirtuin 1 (SIRT1) [287]. Quantification of glycosylated UDP-containing compounds revealed the increased presence of glycosylated products in the bortezomib-resistant cells, indicating increased HBP activity. Bortezomib treatment did not induce mitochondrial depolarization in resistant cells indicating that retaining mitochondrial function is important for bortezomib resistance, a process possibly mediated by increased protein glycosylation, although critical downstream determinants of this process remain unclear [287]. Based on these findings, coupled with the clinical observation that MAF translocated MM shows innate resistance to proteasome inhibition, we speculate that increased activity of the hexosamine pathway can stabilize MAF proteins, a function that could be important regardless of overexpression through translocation, and that activity of the HBP through glycolytic intermediates is associated with stabilization of NRF1 and increased mitochondrial fitness.
Another aspect of glucose metabolism in relation to MAF proteins is coupled to the nutrient sensing functions of the cell cycle machinery. Glucose was shown to regulate CCND2 mRNA levels in quiescent and replicating pancreatic β-cells through glycolysis and calcium channel metabolism [288]. Stimulation of glycolysis by activating glucokinase increased Cyclin D2 levels as did calcium-influx. Experiments with Mafa knockout mice shows that MAFA controls expression of the calcium channel subunit gamma-4 in β-cells, which is vital for glucose-induced insulin exocytosis [289]. Of note, Ccnd2 knockout mice show a diabetic phenotype due to dysfunctional β-cell outgrowth [290]. Although evidence in MM is lacking, this raises the possibility that abundant glucose or increased glycolytic flux can activate cyclin D2 in MM cells through activity of MAF proteins, perhaps in conjunction with the HBP.
ARK5 is an important downstream target of MAF proteins in MM as it regulates invasion of cancers cells downstream of AKT by upregulating several matrix metalloproteases [291] and in MM, ARK5 mediates invasion through IGF1 [281]. The MAF target gene ARK5 was implicated in maintaining mitochondrial function in neuronal cells and could therefore be involved in the regulation of OXPHOS. In agreement, deletion of ARK5 in neuronal cultures decreased both the basal and maximal respiratory rate but did not affect glycolysis, indicating a defect in OXPHOS [292]. Interestingly, ARK5 possesses distinct cytosolic and nuclear functions, and subcellular localization of the protein differs between cell lines and redox state, as oxidative stress can induce cytosolic accumulation of ARK5 [293]. Cytosolic ARK5 maintained ATP levels in hepatocarcinoma cells by increasing mitochondrial respiration and by regulating mitochondrial morphology [294]. Chemical inhibition of ARK5 decreased the maximal respiration and spare respiratory capacity of MCF-7 breast cancer cells and inhibition or knockdown of ARK5 led to an increase of in the mitochondrial membrane potential [294]. ARK5 represents an interesting clinical target in MM, as dual inhibition of ARK5 and CDK4 in MM by the inhibitor ON123300 led to swift induction of cell cycle arrest, followed by apoptosis. Treatment with ON123300 or knockdown of ARK5 using siRNA induced activation of AMPK and the deacetylase SIRT, while downregulating mTOR/AKT signaling. A functional consequence of this was the downregulation of key cell cycle regulators like cyclin D1, cyclin E, CDK4 and MYC. However, translocations in MAF were not predictive for sensitivity to ARK5/CDK4 inhibition [295]. Although metabolic effects of ARK5/CDK4 inhibition were not investigated here, we speculate that this can lead to diminished OXPHOS activity through abrogated activity of ARK5, possibly through altered mitochondrial morphology, and increased activation of PGC1α through diminished CDK4-dependent activition of GCN5 (Table A1).
High level of serum interleukin-10 (IL-10) is a predictor of poor prognosis in MM [296], and IL-10 was shown to induce proliferation and angiogenesis in MM [297]. Interestingly, MAF is critical for the regulation of IL-10 in immune cells [298,299,300,301]. IL-10 abrogates lipopolysaccharide-induced glucose uptake and glycolysis and promotes OXPHOS in macrophages. Importantly, IL-10 was shown to increase OXPHOS in B cells activated with TLR ligands [302]. Based on these observations we speculate that MAF-driven production of IL-10 in MM cells may constitute an auto- and paracrine feedback loop that broadly inhibits protein synthesis through mTOR, downregulates glycolysis and stimulates OXPHOS [303].
6.3. MAF and Glutamine Metabolism in MM
MAF-regulated ARK5 expression could also have consequences for glutamine metabolism, since glutamine was increased upon depletion of ARK5. Metabolic flux assays using 13C-glucose and 13C-glutamine revealed that the flow of glucose into the TCA-cycle was low and that most glucose was instead converted to lactate, indicating a shift towards glycolysis. In this context, depletion of ARK5 had little effect on glycolysis, but rather increased flow from 13C-glutamine to αKG, consistent with increased consumption of glutamine. However, ARK5 depletion prevented αKG entry into the TCA-cycle, as indicated by diminished levels of succinate, fumarate and malate. Proteomic analysis of ARK5 depleted cells showed downregulation of multiple subunits of respiratory chain complexes I, III and IV. As a consequence, ARK5 depletion led to decreased oxygen consumption. Taken together, this shows an important role for ARK5 in sustaining glutamine metabolism by maintaining sufficient respiratory capacity [304]. Functionally, inhibition of ARK5 in the context of deregulated MYC leads to global accumulation of RNA polymerase II (RNAPII) at the pause site and the first intron-exon boundary, but does not increase mRNA synthesis, indicating a defect in MYC-regulated gene expression upon loss of ARK5 functionality [305]. This gene regulation defect could explain the eventual failure of ARK5 depleted cells in sustaining TCA-cycle driven metabolism through failure of glutamine utilization. As MYC deregulation is a hallmark of MM, overexpression of MAF proteins and downstream upregulation of ARK5 can ensure MM cell survival through maintenance of glutamine metabolism.
6.4. MAF and Lipid Metabolism in MM
The MAF-dependent regulation of IL-10 expression in immune cells was reported to be dependent on the cholesterol biosynthesis pathway. Inhibition of cholesterol biosynthesis through statin treatment or supplementation of 25-hydroxycholesterol induced a significant decrease in IL-10 expression. [306]. Of note, physiological levels of 25-hydroxycholesterol significantly decreased MAF expression in these cells, suggesting that careful balancing of cholesterol synthesis is important for MM cells that require high MAF activity. However, whether cholesterol metabolism converges with MAF deregulation in MM remains to be established.
7. Concluding Remarks and Future Perspective
MM is a genetically heterogeneous disease, which is reflected by an equally heterogeneous clinical course and prognosis. The differential behavior and specific therapeutic vulnerabilities of MM cells are in large part dictated by a handful of recurrent chromosomal aberrations that to a sizeable extent demarcate prognostic patient subgroups. Recent progress in the molecular characterization of MM allows the deep interrogation of oncogenic mutations and (epi)genetic changes, which will further forward the elucidation of the etiology, pathobiology, and furthermore, provide new means to stratify patients for personalized therapy. From that point of view, integration of knowledge on the potential metabolic consequences of oncogenic events will provide an even more fine-grained understanding of the altered biology of MM cells in comparison to its normal counterparts, and perhaps uncover novel dependencies that may be amenable to therapeutic targeting. In that respect, an effort towards the comprehensive metabolic profiling of the MM genetic subgroups would be both timely and insightful to obtain a more holistic view on the cellular consequences of oncogenic events in MM. In comparison to most other cancer types, the secretory nature of MM cells stands out. In contrast to normal plasma cells, MM cells are characterized by antibody secretion (in most cases) and increased proliferation, whereas normal plasma cells show very limited proliferative capacity. The chromosomal aberration involving cyclin D1 and MYC are firmly associated with increased proliferation in MM, but strikingly, are also involved in metabolic changes that may not be directly linked to proliferation. It appears that MYC is a dominant factor in altering or amplifying metabolic features of MM plasma cells (Figure 3). Even in MM cells that do not carry MYC aberrations, other chromosomal events may indirectly result in the activation of stabilization of MYC and thereby influence metabolism. As is the case for most others cancers, MM is associated with the increased uptake of glucose and glutamine, which are metabolized by glycolysis and glutaminolysis, respectively, to provide precursors for anaplerotic reactions and to fuel OXPHOS for energetic demands. Glucose and glutamine are also required for antibody glycosylation, which further increases the demands of these nutrients. Both glycolysis and glutaminolysis are critically driven by MYC, but cyclin D1, FGFR3/MMSET and MAF also appear to enhance these metabolic pathways. It is clear that there is a considerable degree of redundancy between these oncogenes with regards to their metabolic effects (Figure 3). The fast rate by which glycolysis can provide both energy and biosynthetic precursors may underlie the increased reliance of MM cells on this pathway. The constitutive activation of the AKT pathway, which is characteristic of MM cells, may be a crucial metabolic driver in this context, as it ramps up most metabolic pathways, while at the same time allowing the full activation of oncogenes such as MYC, thereby further boosting the metabolic activity of MM cells. Additionally, OXPHOS is clearly also increased in MM cells, as it is linked to mitochondrial activity and apoptotic thresholds of MM cells. This is exemplified by the observation that proteasome inhibitors, which can be considered breakthrough drugs for the treatment of MM, provoke changes in mitochondrial integrity. Furthermore, resistance to proteasome inhibitors is associated with metabolic rewiring that increases OXPHOS capacity. As treatment efficacy and resistance are linked to metabolic plasticity of cancer cells, it will be of importance to carefully map the metabolic flexibility in the context of therapy. MM cells display a striking degree of clonal heterogeneity, which may cause metabolic plasticity and could potentially allow MM cells to become resistant to treatment. Characterization of (epi)genetic changes and accompanying metabolic alterations in treatment resistant MM cells will provide further insight into how mutagenic events shape the metabolic features of these cells.
Author Contributions
T.A.B., G.d.W. and J.E.J.G. drafted, edited and wrote the manuscript. T.A.B. prepared the figures. All authors contributed to the article and approved the submitted version. All authors have read and agreed to the published version of the manuscript.
Funding
This work was supported by the Dutch Cancer Society, grant AMC 2018-11597 (to J.E.J.G).
Institutional Review Board Statement
Not applicable.
Informed Consent Statement
Not applicable.
Data Availability Statement
No new data were created or analyzed in this study. Data sharing is not applicable to this article.
Acknowledgments
The authors apologize to researchers whose work could not be cited due to space constrictions. We would like to thank all members of the Guikema laboratory for helpful suggestions.
Conflicts of Interest
The authors have no potential conflicts of interest to disclose.
Appendix A

Table A1.
General metabolic consequences of recurrent chromosomal aberrations in multiple myeloma.
Table A1.
General metabolic consequences of recurrent chromosomal aberrations in multiple myeloma.
| MYC | Cyclin D1 | FGFR3 | MMSET | MAF/MAFB | |
|---|---|---|---|---|---|
| Chromosomal aberration | 42% Structural variants (~30% involve IgH) [5,56] | t(11;14)(q13;q32) | t(4;14)(p16;q32) | t(4;14)(p16;q32) | t(14;16)(q32;q23) t(14;20)(q32;q12) |
| Glucose metabolism | Glycolysis↑ HK2, LDHA, ENO1, SLC2A1, GAPDH, TPI [74] and PKM2 [80,81] ↑ Pentose Phosphate Pathway [96] ↑ G6PD [97] ↑ | Glycolysis↑ HK2 [45] ↑ | Glycolysis↑ LDHA, HK2, GLUT1 and PFKL [206] ↑ | Glycolysis [239,240] ↑ HK2, G6PD and TIGAR [234] ↑ Pentose Phosphate Pathway [235,236] ↑ | |
| Mitochondrial respiration | Mitochondrial biogenesis [145,146,147] ↑ MFF [152] ↑ | Mitochondrial mass [183] ↓ PGC1α [183,184] and NRF1 [187] ↓ | Lactate uptake, fueling OXPHOS [206] ↑ | Mitochondrial mass [237] ↑ | OXHPOS [292,293,294,300] ↓ (ARK5 dependent) |
| Glutamine metabolism | Glutaminolysis [51] ↑ SLC1A5, SLC38A5 [72] and GLS1 [103] ↑ | Glutamine uptake [304] ↑ (ARK5 dependent) | |||
| Lipid metabolism | Fatty acid synthesis↑ ACLY, ACC1, FASN, SCD1 and SREBP1 [123,126] ↑ | Lipid uptake and storage↑ PPARγ [190,191] ↑ Fatty acid synthesis ↓ FASN, PLKR and THRSRP [195] ↓ | Fatty acid synthesis↑ SREBP1 [213], PLCγ [219] and ASM [215] ↑ Cholesterol synthesis [221] ↑ | Cholesterol synthesis [221] ↑ | |
| Miscellaneous | Nucleotide synthesis [137,138] ↑ PHGDH, PSAT1 [95] and PFAS [137]↑ Serine & Gluthatione synthesis [95] ↑ |
Arrows indicate up or downregulation of gene expression or metabolic activity.
References
- Caprio, C.; Sacco, A.; Giustini, V.; Roccaro, A.M. Epigenetic Aberrations in Multiple Myeloma. Cancers 2020, 12, 2996. [Google Scholar] [CrossRef] [PubMed]
- Anderson, K.C.; Carrasco, R.D. Pathogenesis of Myeloma. Annu. Rev. Pathol. 2011, 6, 249–274. [Google Scholar] [CrossRef] [PubMed]
- van Nieuwenhuijzen, N.; Spaan, I.; Raymakers, R.; Peperzak, V. From MGUS to Multiple Myeloma, a Paradigm for Clonal Evolution of Premalignant Cells. Cancer Res. 2018, 78, 2449–2456. [Google Scholar] [CrossRef] [PubMed]
- Barwick, B.G.; Gupta, V.A.; Vertino, P.M.; Boise, L.H. Cell of Origin and Genetic Alterations in the Pathogenesis of Multiple Myeloma. Front. Immunol. 2019, 10, 1121. [Google Scholar] [CrossRef]
- Bergsagel, P.L.; Kuehl, W.M. Chromosome Translocations in Multiple Myeloma. Oncogene 2001, 20, 5611–5622. [Google Scholar] [CrossRef] [PubMed]
- Bergsagel, P.L.; Kuehl, W.M. Molecular Pathogenesis and a Consequent Classification of Multiple Myeloma. J. Clin. Oncol. 2005, 23, 6333–6338. [Google Scholar] [CrossRef]
- López-Corral, L.; Gutiérrez, N.C.; Vidriales, M.B.; Mateos, M.V.; Rasillo, A.; García-Sanz, R.; Paiva, B.; San Miguel, J.F. The Progression from MGUS to Smoldering Myeloma and Eventually to Multiple Myeloma Involves a Clonal Expansion of Genetically Abnormal Plasma Cells. Clin. Cancer Res. 2011, 17, 1692–1700. [Google Scholar] [CrossRef]
- Halliley, J.L.; Tipton, C.M.; Liesveld, J.; Rosenberg, A.F.; Darce, J.; Gregoretti, I.V.; Popova, L.; Kaminiski, D.; Fucile, C.F.; Albizua, I.; et al. Long-Lived Plasma Cells Are Contained within the CD19(−)CD38(Hi)CD138(+) Subset in Human Bone Marrow. Immunity 2015, 43, 132–145. [Google Scholar] [CrossRef]
- Doughty, C.A.; Bleiman, B.F.; Wagner, D.J.; Dufort, F.J.; Mataraza, J.M.; Roberts, M.F.; Chiles, T.C. Antigen Receptor-Mediated Changes in Glucose Metabolism in B Lymphocytes: Role of Phosphatidylinositol 3-Kinase Signaling in the Glycolytic Control of Growth. Blood 2006, 107, 4458–4465. [Google Scholar] [CrossRef]
- Astoul, E.; Watton, S.; Cantrell, D. The Dynamics of Protein Kinase B Regulation during B Cell Antigen Receptor Engagement. J. Cell Biol. 1999, 145, 1511–1520. [Google Scholar] [CrossRef]
- Jellusova, J.; Rickert, R.C. The PI3K Pathway in B Cell Metabolism. Crit. Rev. Biochem. Mol. Biol. 2016, 51, 359–378. [Google Scholar] [CrossRef] [PubMed]
- Whiteman, E.L.; Cho, H.; Birnbaum, M.J. Role of Akt/Protein Kinase B in Metabolism. Trends Endocrinol. Metab. 2002, 13, 444–451. [Google Scholar] [CrossRef]
- Goo, C.K.; Lim, H.Y.; Ho, Q.S.; Too, H.-P.; Clement, M.-V.; Wong, K.P. PTEN/Akt Signaling Controls Mitochondrial Respiratory Capacity through 4E-BP1. PLoS ONE 2012, 7, e45806. [Google Scholar] [CrossRef] [PubMed]
- Zhu, Z.; Shukla, A.; Ramezani-Rad, P.; Apgar, J.R.; Rickert, R.C. The AKT Isoforms 1 and 2 Drive B Cell Fate Decisions during the Germinal Center Response. Life Sci. Alliance 2019, 2. [Google Scholar] [CrossRef] [PubMed]
- Deberardinis, R.J.; Lum, J.J.; Thompson, C.B. Phosphatidylinositol 3-Kinase-Dependent Modulation of Carnitine Palmitoyltransferase 1A Expression Regulates Lipid Metabolism during Hematopoietic Cell Growth. J. Biol. Chem. 2006, 281, 37372–37380. [Google Scholar] [CrossRef]
- Muramatsu, M.; Kinoshita, K.; Fagarasan, S.; Yamada, S.; Shinkai, Y.; Honjo, T. Class Switch Recombination and Hypermutation Require Activation-Induced Cytidine Deaminase (AID), a Potential RNA Editing Enzyme. Cell 2000, 102, 553–563. [Google Scholar] [CrossRef]
- Revy, P.; Muto, T.; Levy, Y.; Geissmann, F.; Plebani, A.; Sanal, O.; Catalan, N.; Forveille, M.; Dufourcq-Labelouse, R.; Gennery, A.; et al. Activation-Induced Cytidine Deaminase (AID) Deficiency Causes the Autosomal Recessive Form of the Hyper-IgM Syndrome (HIGM2). Cell 2000, 102, 565–575. [Google Scholar] [CrossRef]
- Stratigopoulou, M.; van Dam, T.P.; Guikema, J.E.J. Base Excision Repair in the Immune System: Small DNA Lesions With Big Consequences. Front. Immunol. 2020, 11, 1084. [Google Scholar] [CrossRef]
- Bahjat, M.; Guikema, J.E.J. The Complex Interplay between DNA Injury and Repair in Enzymatically Induced Mutagenesis and DNA Damage in B Lymphocytes. Int. J. Mol. Sci. 2017, 18, 1876. [Google Scholar] [CrossRef]
- Rustad, E.H.; Yellapantula, V.; Leongamornlert, D.; Bolli, N.; Ledergor, G.; Nadeu, F.; Angelopoulos, N.; Dawson, K.J.; Mitchell, T.J.; Osborne, R.J.; et al. Timing the Initiation of Multiple Myeloma. Nat. Commun. 2020, 11, 1917. [Google Scholar] [CrossRef]
- Bergsagel, P.L.; Chesi, M.; Nardini, E.; Brents, L.A.; Kirby, S.L.; Kuehl, W.M. Promiscuous Translocations into Immunoglobulin Heavy Chain Switch Regions in Multiple Myeloma. Proc. Natl. Acad. Sci. USA 1996, 93, 13931–13936. [Google Scholar] [CrossRef] [PubMed]
- Jellusova, J.; Cato, M.H.; Apgar, J.R.; Ramezani-Rad, P.; Leung, C.R.; Chen, C.; Richardson, A.D.; Conner, E.M.; Benschop, R.J.; Woodgett, J.R.; et al. Gsk3 Is a Metabolic Checkpoint Regulator in B Cells. Nat. Immunol. 2017, 18, 303–312. [Google Scholar] [CrossRef] [PubMed]
- Ersching, J.; Efeyan, A.; Mesin, L.; Jacobsen, J.T.; Pasqual, G.; Grabiner, B.C.; Dominguez-Sola, D.; Sabatini, D.M.; Victora, G.D. Germinal Center Selection and Affinity Maturation Require Dynamic Regulation of MTORC1 Kinase. Immunity 2017, 46, 1045–1058.e6. [Google Scholar] [CrossRef] [PubMed]
- Abbott, R.K.; Thayer, M.; Labuda, J.; Silva, M.; Philbrook, P.; Cain, D.W.; Kojima, H.; Hatfield, S.; Sethumadhavan, S.; Ohta, A.; et al. Germinal Center Hypoxia Potentiates Immunoglobulin Class Switch Recombination. J. Immunol. 2016, 197, 4014–4020. [Google Scholar] [CrossRef] [PubMed]
- Cho, S.H.; Raybuck, A.L.; Stengel, K.; Wei, M.; Beck, T.C.; Volanakis, E.; Thomas, J.W.; Hiebert, S.; Haase, V.H.; Boothby, M.R. Germinal Centre Hypoxia and Regulation of Antibody Qualities by a Hypoxia Response System. Nature 2016, 537, 234–238. [Google Scholar] [CrossRef] [PubMed]
- Weisel, F.J.; Mullett, S.J.; Elsner, R.A.; Menk, A.V.; Trivedi, N.; Luo, W.; Wikenheiser, D.; Hawse, W.F.; Chikina, M.; Smita, S.; et al. Germinal Center B Cells Selectively Oxidize Fatty Acids for Energy While Conducting Minimal Glycolysis. Nat. Immunol. 2020, 21, 331–342. [Google Scholar] [CrossRef]
- Dufort, F.J.; Gumina, M.R.; Ta, N.L.; Tao, Y.; Heyse, S.A.; Scott, D.A.; Richardson, A.D.; Seyfried, T.N.; Chiles, T.C. Glucose-Dependent de Novo Lipogenesis in B Lymphocytes: A Requirement for Atp-Citrate Lyase in Lipopolysaccharide-Induced Differentiation. J. Biol. Chem. 2014, 289, 7011–7024. [Google Scholar] [CrossRef]
- Ma, Y.; Shimizu, Y.; Mann, M.J.; Jin, Y.; Hendershot, L.M. Plasma Cell Differentiation Initiates a Limited ER Stress Response by Specifically Suppressing the PERK-Dependent Branch of the Unfolded Protein Response. Cell Stress Chaperones 2010, 15, 281–293. [Google Scholar] [CrossRef]
- Gass, J.N.; Gifford, N.M.; Brewer, J.W. Activation of an Unfolded Protein Response during Differentiation of Antibody-Secreting B Cells. J. Biol. Chem. 2002, 277, 49047–49054. [Google Scholar] [CrossRef]
- Jones, D.D.; Gaudette, B.T.; Wilmore, J.R.; Chernova, I.; Bortnick, A.; Weiss, B.M.; Allman, D. MTOR Has Distinct Functions in Generating versus Sustaining Humoral Immunity. J. Clin. Investig. 2016, 126, 4250–4261. [Google Scholar] [CrossRef]
- Chan, L.N.; Chen, Z.; Braas, D.; Lee, J.-W.; Xiao, G.; Geng, H.; Cosgun, K.N.; Hurtz, C.; Shojaee, S.; Cazzaniga, V.; et al. Metabolic Gatekeeper Function of B-Lymphoid Transcription Factors. Nature 2017, 542, 479–483. [Google Scholar] [CrossRef] [PubMed]
- Price, M.J.; Patterson, D.G.; Scharer, C.D.; Boss, J.M. Progressive Upregulation of Oxidative Metabolism Facilitates Plasmablast Differentiation to a T-Independent Antigen. Cell Rep. 2018, 23, 3152–3159. [Google Scholar] [CrossRef] [PubMed]
- Lam, W.Y.; Becker, A.M.; Kennerly, K.M.; Wong, R.; Curtis, J.D.; Llufrio, E.M.; McCommis, K.S.; Fahrmann, J.; Pizzato, H.A.; Nunley, R.M.; et al. Mitochondrial Pyruvate Import Promotes Long-Term Survival of Antibody-Secreting Plasma Cells. Immunity 2016, 45, 60–73. [Google Scholar] [CrossRef] [PubMed]
- Adams, W.C.; Chen, Y.-H.; Kratchmarov, R.; Yen, B.; Nish, S.A.; Lin, W.-H.W.; Rothman, N.J.; Luchsinger, L.L.; Klein, U.; Busslinger, M.; et al. Anabolism-Associated Mitochondrial Stasis Driving Lymphocyte Differentiation over Self-Renewal. Cell Rep. 2016, 17, 3142–3152. [Google Scholar] [CrossRef] [PubMed]
- Lam, W.Y.; Jash, A.; Yao, C.-H.; D’Souza, L.; Wong, R.; Nunley, R.M.; Meares, G.P.; Patti, G.J.; Bhattacharya, D. Metabolic and Transcriptional Modules Independently Diversify Plasma Cell Lifespan and Function. Cell Rep. 2018, 24, 2479–2492.e6. [Google Scholar] [CrossRef]
- Wang, Z.V.; Deng, Y.; Gao, N.; Pedrozo, Z.; Li, D.L.; Morales, C.R.; Criollo, A.; Luo, X.; Tan, W.; Jiang, N.; et al. Spliced X-Box Binding Protein 1 Couples the Unfolded Protein Response to Hexosamine Biosynthetic Pathway. Cell 2014, 156, 1179–1192. [Google Scholar] [CrossRef]
- Pavlova, N.N.; Thompson, C.B. The Emerging Hallmarks of Cancer Metabolism. Cell Metab. 2016, 23, 27–47. [Google Scholar] [CrossRef]
- Warburg, O.; Wind, F.; Negelein, E. The metabolism of tumors in the body. J. Gen. Physiol. 1927, 8, 519–530. [Google Scholar] [CrossRef]
- Hensley, C.T.; Faubert, B.; Yuan, Q.; Lev-Cohain, N.; Jin, E.; Kim, J.; Jiang, L.; Ko, B.; Skelton, R.; Loudat, L.; et al. Metabolic Heterogeneity in Human Lung Tumors. Cell 2016, 164, 681–694. [Google Scholar] [CrossRef]
- Yuneva, M.O.; Fan, T.W.M.; Allen, T.D.; Higashi, R.M.; Ferraris, D.V.; Tsukamoto, T.; Matés, J.M.; Alonso, F.J.; Wang, C.; Seo, Y.; et al. The Metabolic Profile of Tumors Depends on Both the Responsible Genetic Lesion and Tissue Type. Cell Metab. 2012, 15, 157–170. [Google Scholar] [CrossRef]
- Weinberg, S.E.; Chandel, N.S. Targeting Mitochondria Metabolism for Cancer Therapy. Nat. Chem. Biol. 2015, 11, 9–15. [Google Scholar] [CrossRef] [PubMed]
- Sanchez, W.Y.; McGee, S.L.; Connor, T.; Mottram, B.; Wilkinson, A.; Whitehead, J.P.; Vuckovic, S.; Catley, L. Dichloroacetate Inhibits Aerobic Glycolysis in Multiple Myeloma Cells and Increases Sensitivity to Bortezomib. Br. J. Cancer 2013, 108, 1624–1633. [Google Scholar] [CrossRef] [PubMed]
- Xu, S.; Zhou, T.; Doh, H.M.; Trinh, K.R.; Catapang, A.; Lee, J.T.; Braas, D.; Bayley, N.A.; Yamada, R.E.; Vasuthasawat, A.; et al. An HK2 Antisense Oligonucleotide Induces Synthetic Lethality in HK1-HK2+ Multiple Myeloma. Cancer Res. 2019, 79, 2748–2760. [Google Scholar] [CrossRef] [PubMed]
- Maiso, P.; Huynh, D.; Moschetta, M.; Sacco, A.; Aljawai, Y.; Mishima, Y.; Asara, J.M.; Roccaro, A.M.; Kimmelman, A.C.; Ghobrial, I.M. Metabolic Signature Identifies Novel Targets for Drug Resistance in Multiple Myeloma. Cancer Res. 2015, 75, 2071–2082. [Google Scholar] [CrossRef]
- Caillot, M.; Bourgeais, J.; Dakik, H.; Costé, É.; Mazure, N.M.; Lelièvre, É.; Coqueret, O.; Hérault, O.; Mazurier, F.; Sola, B. Cyclin D1 Targets Hexokinase 2 to Control Aerobic Glycolysis in Myeloma Cells. Oncogenesis 2020, 9, 68. [Google Scholar] [CrossRef] [PubMed]
- Fujiwara, S.; Wada, N.; Kawano, Y.; Okuno, Y.; Kikukawa, Y.; Endo, S.; Nishimura, N.; Ueno, N.; Mitsuya, H.; Hata, H. Lactate, a Putative Survival Factor for Myeloma Cells, Is Incorporated by Myeloma Cells through Monocarboxylate Transporters 1. Exp. Hematol. Oncol. 2015, 4, 12. [Google Scholar] [CrossRef]
- Dalva-Aydemir, S.; Bajpai, R.; Martinez, M.; Adekola, K.U.A.; Kandela, I.; Wei, C.; Singhal, S.; Koblinski, J.E.; Raje, N.S.; Rosen, S.T.; et al. Targeting the Metabolic Plasticity of Multiple Myeloma with FDA-Approved Ritonavir and Metformin. Clin. Cancer Res. 2015, 21, 1161–1171. [Google Scholar] [CrossRef]
- Duesberg, P.H.; Bister, K.; Vogt, P.K. The RNA of Avian Acute Leukemia Virus MC29. Proc. Natl. Acad. Sci. USA 1977, 74, 4320–4324. [Google Scholar] [CrossRef]
- Sheiness, D.; Fanshier, L.; Bishop, J.M. Identification of Nucleotide Sequences Which May Encode the Oncogenic Capacity of Avian Retrovirus MC29. J. Virol. 1978, 28, 600–610. [Google Scholar] [CrossRef]
- Nie, Z.; Hu, G.; Wei, G.; Cui, K.; Yamane, A.; Resch, W.; Wang, R.; Green, D.R.; Tessarollo, L.; Casellas, R.; et al. C-Myc Is a Universal Amplifier of Expressed Genes in Lymphocytes and Embryonic Stem Cells. Cell 2012, 151, 68–79. [Google Scholar] [CrossRef]
- Lin, C.Y.; Lovén, J.; Rahl, P.B.; Paranal, R.M.; Burge, C.B.; Bradner, J.E.; Lee, T.I.; Young, R.A. Transcriptional Amplification in Tumor Cells with Elevated C-Myc. Cell 2012, 151, 56–67. [Google Scholar] [CrossRef] [PubMed]
- Zack, T.I.; Schumacher, S.E.; Carter, S.L.; Cherniack, A.D.; Saksena, G.; Tabak, B.; Lawrence, M.S.; Zhsng, C.-Z.; Wala, J.; Mermel, C.H.; et al. Pan-Cancer Patterns of Somatic Copy Number Alteration. Nat. Genet. 2013, 45, 1134–1140. [Google Scholar] [CrossRef] [PubMed]
- Dalla-Favera, R.; Bregni, M.; Erikson, J.; Patterson, D.; Gallo, R.C.; Croce, C.M. Human C-Myc Onc Gene Is Located on the Region of Chromosome 8 That Is Translocated in Burkitt Lymphoma Cells. Proc. Natl. Acad. Sci. USA 1982, 79, 7824–7827. [Google Scholar] [CrossRef] [PubMed]
- Barrans, S.; Crouch, S.; Smith, A.; Turner, K.; Owen, R.; Patmore, R.; Roman, E.; Jack, A. Rearrangement of MYC Is Associated with Poor Prognosis in Patients with Diffuse Large B-Cell Lymphoma Treated in the Era of Rituximab. J. Clin. Oncol. 2010, 28, 3360–3365. [Google Scholar] [CrossRef]
- Kuppers, R.; Dalla-Favera, R. Mechanisms of Chromosomal Translocations in B Cell Lymphomas. Oncogene 2001, 20, 5580–5594. [Google Scholar] [CrossRef]
- Misund, K.; Keane, N.; Stein, C.K.; Asmann, Y.W.; Day, G.; Welsh, S.; Van Wier, S.A.; Riggs, D.L.; Ahmann, G.; Chesi, M.; et al. MYC Dysregulation in the Progression of Multiple Myeloma. Leukemia 2020, 34, 322–326. [Google Scholar] [CrossRef]
- Walker, B.A.; Wardell, C.P.; Brioli, A.; Boyle, E.; Kaiser, M.F.; Begum, D.B.; Dahir, N.B.; Johnson, D.C.; Ross, F.M.; Davies, F.E.; et al. Translocations at 8q24 Juxtapose MYC with Genes That Harbor Superenhancers Resulting in Overexpression and Poor Prognosis in Myeloma Patients. Blood Cancer J. 2014, 4, e191. [Google Scholar] [CrossRef]
- Weinhold, N.; Kirn, D.; Seckinger, A.; Hielscher, T.; Granzow, M.; Bertsch, U.; Egerer, G.; Salwender, H.; Blau, I.W.; Weisel, K.; et al. Concomitant Gain of 1q21 and MYC Translocation Define a Poor Prognostic Subgroup of Hyperdiploid Multiple Myeloma. Haematologica 2016, 101, e116. [Google Scholar] [CrossRef]
- Barwick, B.G.; Neri, P.; Bahlis, N.J.; Nooka, A.K.; Dhodapkar, M.V.; Jaye, D.L.; Hofmeister, C.C.; Kaufman, J.L.; Gupta, V.A.; Auclair, D.; et al. Multiple Myeloma Immunoglobulin Lambda Translocations Portend Poor Prognosis. Nat. Commun. 2019, 10, 1911. [Google Scholar] [CrossRef]
- Wen, Z.; Rajagopalan, A.; Flietner, E.; Yun, G.; Chesi, M.; Furumo, Q.; Burns, R.T.; Papadas, A.; Ranheim, E.A.; Pagenkopf, A.C.; et al. Expression of NrasQ61R and MYC Transgene in Germinal Center B Cells Induces a Highly Malignant Multiple Myeloma in Mice. Blood 2020. [Google Scholar] [CrossRef]
- Zindy, F.; Eischen, C.M.; Randle, D.H.; Kamijo, T.; Cleveland, J.L.; Sherr, C.J.; Roussel, M.F. Myc Signaling via the ARF Tumor Suppressor Regulates P53-Dependent Apoptosis and Immortalization. Genes Dev. 1998, 12, 2424–2433. [Google Scholar] [CrossRef] [PubMed]
- Hemann, M.T.; Bric, A.; Teruya-Feldstein, J.; Herbst, A.; Nilsson, J.A.; Cordon-Cardo, C.; Cleveland, J.L.; Tansey, W.P.; Lowe, S.W. Evasion of the P53 Tumour Surveillance Network by Tumour-Derived MYC Mutants. Nature 2005, 436, 807–811. [Google Scholar] [CrossRef] [PubMed]
- Bouchard, C.; Lee, S.; Paulus-Hock, V.; Loddenkemper, C.; Eilers, M.; Schmitt, C.A. FoxO Transcription Factors Suppress Myc-Driven Lymphomagenesis via Direct Activation of Arf. Genes Dev. 2007, 21, 2775–2787. [Google Scholar] [CrossRef] [PubMed]
- Hsu, J.; Shi, Y.; Krajewski, S.; Renner, S.; Fisher, M.; Reed, J.C.; Franke, T.F.; Lichtenstein, A. The AKT Kinase Is Activated in Multiple Myeloma Tumor Cells. Blood 2001, 98, 2853–2855. [Google Scholar] [CrossRef] [PubMed]
- Bloedjes, T.A.; de Wilde, G.; Maas, C.; Eldering, E.; Bende, R.J.; van Noesel, C.J.M.; Pals, S.T.; Spaargaren, M.; Guikema, J.E.J. AKT Signaling Restrains Tumor Suppressive Functions of FOXO Transcription Factors and GSK3 Kinase in Multiple Myeloma. Blood Adv. 2020, 4, 4151–4164. [Google Scholar] [CrossRef] [PubMed]
- Gaidano, G.; Ballerini, P.; Gong, J.Z.; Inghirami, G.; Neri, A.; Newcomb, E.W.; Magrath, I.T.; Knowles, D.M.; Dalla-Favera, R. P53 Mutations in Human Lymphoid Malignancies: Association with Burkitt Lymphoma and Chronic Lymphocytic Leukemia. Proc. Natl. Acad. Sci. USA 1991, 88, 5413–5417. [Google Scholar] [CrossRef] [PubMed]
- Sears, R.; Leone, G.; DeGregori, J.; Nevins, J.R. Ras Enhances Myc Protein Stability. Mol. Cell 1999, 3, 169–179. [Google Scholar] [CrossRef]
- Sears, R.; Nuckolls, F.; Haura, E.; Taya, Y.; Tamai, K.; Nevins, J.R. Multiple Ras-Dependent Phosphorylation Pathways Regulate Myc Protein Stability. Genes Dev. 2000, 14, 2501–2514. [Google Scholar] [CrossRef]
- Hu, L.; Shi, Y.; Hsu, J.; Gera, J.; Van Ness, B.; Lichtenstein, A. Downstream Effectors of Oncogenic Ras in Multiple Myeloma Cells. Blood 2003, 101, 3126–3135. [Google Scholar] [CrossRef]
- Platanias, L.C. Map Kinase Signaling Pathways and Hematologic Malignancies. Blood 2003, 101, 4667–4679. [Google Scholar] [CrossRef]
- Shim, H.; Dolde, C.; Lewis, B.C.; Wu, C.S.; Dang, G.; Jungmann, R.A.; Dalla-Favera, R.; Dang, C.V. C-Myc Transactivation of LDH-A: Implications for Tumor Metabolism and Growth. Proc. Natl. Acad. Sci. USA 1997, 94, 6658–6663. [Google Scholar] [CrossRef] [PubMed]
- Wise, D.R.; DeBerardinis, R.J.; Mancuso, A.; Sayed, N.; Zhang, X.-Y.; Pfeiffer, H.K.; Nissim, I.; Daikhin, E.; Yudkoff, M.; McMahon, S.B.; et al. Myc Regulates a Transcriptional Program That Stimulates Mitochondrial Glutaminolysis and Leads to Glutamine Addiction. Proc. Natl. Acad. Sci. USA 2008, 105, 18782–18787. [Google Scholar] [CrossRef] [PubMed]
- Osthus, R.C.; Shim, H.; Kim, S.; Li, Q.; Reddy, R.; Mukherjee, M.; Xu, Y.; Wonsey, D.; Lee, L.A.; Dang, C.V. Deregulation of Glucose Transporter 1 and Glycolytic Gene Expression by C-Myc. J. Biol. Chem. 2000, 275, 21797–21800. [Google Scholar] [CrossRef] [PubMed]
- Kim, J.; Zeller, K.I.; Wang, Y.; Jegga, A.G.; Aronow, B.J.; O’Donnell, K.A.; Dang, C.V. Evaluation of Myc E-Box Phylogenetic Footprints in Glycolytic Genes by Chromatin Immunoprecipitation Assays. Mol. Cell. Biol. 2004, 24, 5923–5936. [Google Scholar] [CrossRef] [PubMed]
- Kondoh, H.; Lleonart, M.E.; Gil, J.; Wang, J.; Degan, P.; Peters, G.; Martinez, D.; Carnero, A.; Beach, D. Glycolytic Enzymes Can Modulate Cellular Life Span. Cancer Res. 2005, 65, 177–185. [Google Scholar] [PubMed]
- Matoba, S.; Kang, J.-G.; Patino, W.D.; Wragg, A.; Boehm, M.; Gavrilova, O.; Hurley, P.J.; Bunz, F.; Hwang, P.M. P53 Regulates Mitochondrial Respiration. Science 2006, 312, 1650–1653. [Google Scholar] [CrossRef] [PubMed]
- Bensaad, K.; Tsuruta, A.; Selak, M.A.; Vidal, M.N.C.; Nakano, K.; Bartrons, R.; Gottlieb, E.; Vousden, K.H. TIGAR, a P53-Inducible Regulator of Glycolysis and Apoptosis. Cell 2006, 126, 107–120. [Google Scholar] [CrossRef]
- Yin, L.; Kosugi, M.; Kufe, D. Inhibition of the MUC1-C Oncoprotein Induces Multiple Myeloma Cell Death by down-Regulating TIGAR Expression and Depleting NADPH. Blood 2012, 119, 810–816. [Google Scholar] [CrossRef]
- Vafa, O.; Wade, M.; Kern, S.; Beeche, M.; Pandita, T.K.; Hampton, G.M.; Wahl, G.M. C-Myc Can Induce DNA Damage, Increase Reactive Oxygen Species, and Mitigate P53 Function: A Mechanism for Oncogene-Induced Genetic Instability. Mol. Cell 2002, 9, 1031–1044. [Google Scholar] [CrossRef]
- David, C.J.; Chen, M.; Assanah, M.; Canoll, P.; Manley, J.L. HnRNP Proteins Controlled by C-Myc Deregulate Pyruvate Kinase MRNA Splicing in Cancer. Nature 2010, 463, 364–368. [Google Scholar] [CrossRef]
- Gu, Z.; Xia, J.; Xu, H.; Frech, I.; Tricot, G.; Zhan, F. NEK2 Promotes Aerobic Glycolysis in Multiple Myeloma Through Regulating Splicing of Pyruvate Kinase. J. Hematol. Oncol. 2017, 10, 17. [Google Scholar] [CrossRef] [PubMed]
- He, Y.; Wang, Y.; Liu, H.; Xu, X.; He, S.; Tang, J.; Huang, Y.; Miao, X.; Wu, Y.; Wang, Q.; et al. Pyruvate Kinase Isoform M2 (PKM2) Participates in Multiple Myeloma Cell Proliferation, Adhesion and Chemoresistance. Leuk. Res. 2015, 39, 1428–1436. [Google Scholar] [CrossRef] [PubMed]
- Panchabhai, S.; Schlam, I.; Sebastian, S.; Fonseca, R. PKM2 and Other Key Regulators of Warburg Effect Positively Correlate with CD147 (EMMPRIN) Gene Expression and Predict Survival in Multiple Myeloma. Leukemia 2017, 31, 991–994. [Google Scholar] [CrossRef] [PubMed]
- Walters, D.K.; Arendt, B.K.; Jelinek, D.F. CD147 Regulates the Expression of MCT1 and Lactate Export in Multiple Myeloma Cells. Cell Cycle 2013, 12, 3175–3183. [Google Scholar] [CrossRef]
- Łacina, P.; Butrym, A.; Mazur, G.; Bogunia-Kubik, K. BSG and MCT1 Genetic Variants Influence Survival in Multiple Myeloma Patients. Genes 2018, 9, 226. [Google Scholar] [CrossRef]
- Fonti, R.; Larobina, M.; Del Vecchio, S.; De Luca, S.; Fabbricini, R.; Catalano, L.; Pane, F.; Salvatore, M.; Pace, L. Metabolic Tumor Volume Assessed by 18F-FDG PET/CT for the Prediction of Outcome in Patients with Multiple Myeloma. J. Nucl. Med. 2012, 53, 1829–1835. [Google Scholar] [CrossRef]
- Waheed, S.; Mitchell, A.; Usmani, S.; Epstein, J.; Yaccoby, S.; Nair, B.; van Hemert, R.; Angtuaco, E.; Brown, T.; Bartel, T.; et al. Standard and Novel Imaging Methods for Multiple Myeloma: Correlates with Prognostic Laboratory Variables Including Gene Expression Profiling Data. Haematologica 2013, 98, 71–78. [Google Scholar] [CrossRef]
- Fujiwara, S.; Kawano, Y.; Yuki, H.; Okuno, Y.; Nosaka, K.; Mitsuya, H.; Hata, H. PDK1 Inhibition Is a Novel Therapeutic Target in Multiple Myeloma. Br. J. Cancer 2013, 108, 170–178. [Google Scholar] [CrossRef]
- Ray, A.; Song, Y.; Du, T.; Chauhan, D.; Anderson, K.C. Preclinical Validation of Alpha-Enolase (ENO1) as a Novel Immunometabolic Target in Multiple Myeloma. Oncogene 2020, 39, 2786–2796. [Google Scholar] [CrossRef]
- Pennathur-Das, R.; Levitt, L. Augmentation of in Vitro Human Marrow Erythropoiesis under Physiological Oxygen Tensions Is Mediated by Monocytes and T Lymphocytes. Blood 1987, 69, 899–907. [Google Scholar] [CrossRef]
- Gordan, J.D.; Bertout, J.A.; Hu, C.-J.; Diehl, J.A.; Simon, M.C. HIF-2alpha Promotes Hypoxic Cell Proliferation by Enhancing c-Myc Transcriptional Activity. Cancer Cell 2007, 11, 335–347. [Google Scholar] [CrossRef] [PubMed]
- Kim, J.; Gao, P.; Liu, Y.-C.; Semenza, G.L.; Dang, C.V. Hypoxia-Inducible Factor 1 and Dysregulated c-Myc Cooperatively Induce Vascular Endothelial Growth Factor and Metabolic Switches Hexokinase 2 and Pyruvate Dehydrogenase Kinase 1. Mol. Cell Biol. 2007, 27, 7381–7393. [Google Scholar] [CrossRef] [PubMed]
- Zhang, J.; Sattler, M.; Tonon, G.; Grabher, C.; Lababidi, S.; Zimmerhackl, A.; Raab, M.S.; Vallet, S.; Zhou, Y.; Cartron, M.-A.; et al. Targeting Angiogenesis via a C-Myc/Hypoxia-Inducible Factor-1alpha-Dependent Pathway in Multiple Myeloma. Cancer Res. 2009, 69, 5082–5090. [Google Scholar] [CrossRef] [PubMed]
- Kalhan, S.C.; Hanson, R.W. Resurgence of Serine: An Often Neglected but Indispensable Amino Acid. J. Biol. Chem. 2012, 287, 19786–19791. [Google Scholar] [CrossRef] [PubMed]
- Sun, L.; Song, L.; Wan, Q.; Wu, G.; Li, X.; Wang, Y.; Wang, J.; Liu, Z.; Zhong, X.; He, X.; et al. CMyc-Mediated Activation of Serine Biosynthesis Pathway Is Critical for Cancer Progression under Nutrient Deprivation Conditions. Cell Res. 2015, 25, 429–444. [Google Scholar] [CrossRef] [PubMed]
- Morrish, F.; Isern, N.; Sadilek, M.; Jeffrey, M.; Hockenbery, D.M. C-Myc Activates Multiple Metabolic Networks to Generate Substrates for Cell-Cycle Entry. Oncogene 2009, 28, 2485–2491. [Google Scholar] [CrossRef] [PubMed]
- Yang, X.; Ye, H.; He, M.; Zhou, X.; Sun, N.; Guo, W.; Lin, X.; Huang, H.; Lin, Y.; Yao, R.; et al. LncRNA PDIA3P Interacts with C-Myc to Regulate Cell Proliferation via Induction of Pentose Phosphate Pathway in Multiple Myeloma. Biochem. Biophys. Res. Commun. 2018, 498, 207–213. [Google Scholar] [CrossRef]
- Le, A.; Lane, A.N.; Hamaker, M.; Bose, S.; Gouw, A.; Barbi, J.; Tsukamoto, T.; Rojas, C.J.; Slusher, B.S.; Zhang, H.; et al. Glucose-Independent Glutamine Metabolism via TCA Cycling for Proliferation and Survival in B Cells. Cell Metab. 2012, 15, 110–121. [Google Scholar] [CrossRef]
- Vriezen, N.; van Dijken, J.P. Fluxes and Enzyme Activities in Central Metabolism of Myeloma Cells Grown in Chemostat Culture. Biotechnol. Bioeng. 1998, 59, 28–39. [Google Scholar] [CrossRef]
- Roberts, R.S.; Hsu, H.W.; Lin, K.D.; Yang, T.J. Amino Acid Metabolism of Myeloma Cells in Culture. J. Cell Sci. 1976, 21, 609–615. [Google Scholar]
- Mercille, S.; Massie, B. Induction of Apoptosis in Nutrient-Deprived Cultures of Hybridoma and Myeloma Cells. Biotechnol. Bioeng. 1994, 44, 1140–1154. [Google Scholar] [CrossRef] [PubMed]
- Puchades-Carrasco, L.; Lecumberri, R.; Martínez-López, J.; Lahuerta, J.-J.; Mateos, M.-V.; Prósper, F.; San-Miguel, J.F.; Pineda-Lucena, A. Multiple Myeloma Patients Have a Specific Serum Metabolomic Profile That Changes after Achieving Complete Remission. Clin. Cancer Res. 2013, 19, 4770–4779. [Google Scholar] [CrossRef] [PubMed]
- Gao, P.; Tchernyshyov, I.; Chang, T.-C.; Lee, Y.-S.; Kita, K.; Ochi, T.; Zeller, K.I.; De Marzo, A.M.; Van Eyk, J.E.; Mendell, J.T.; et al. C-Myc Suppression of MiR-23a/b Enhances Mitochondrial Glutaminase Expression and Glutamine Metabolism. Nature 2009, 458, 762–765. [Google Scholar] [CrossRef] [PubMed]
- Bolzoni, M.; Chiu, M.; Accardi, F.; Vescovini, R.; Airoldi, I.; Storti, P.; Todoerti, K.; Agnelli, L.; Missale, G.; Andreoli, R.; et al. Dependence on Glutamine Uptake and Glutamine Addiction Characterize Myeloma Cells: A New Attractive Target. Blood 2016, 128, 667–679. [Google Scholar] [CrossRef] [PubMed]
- Fulciniti, M.; Amodio, N.; Bandi, R.L.; Cagnetta, A.; Samur, M.K.; Acharya, C.; Prabhala, R.; D’Aquila, P.; Bellizzi, D.; Passarino, G.; et al. MiR-23b/SP1/c-Myc Forms a Feed-Forward Loop Supporting Multiple Myeloma Cell Growth. Blood Cancer J. 2016, 6, e380. [Google Scholar] [CrossRef]
- Bott, A.J.; Peng, I.-C.; Fan, Y.; Faubert, B.; Zhao, L.; Li, J.; Neidler, S.; Sun, Y.; Jaber, N.; Krokowski, D.; et al. Oncogenic Myc Induces Expression of Glutamine Synthetase through Promoter Demethylation. Cell Metab. 2015, 22, 1068–1077. [Google Scholar] [CrossRef] [PubMed]
- Peng, B.; Hurt, E.M.; Hodge, D.R.; Thomas, S.B.; Farrar, W.L. DNA Hypermethylation and Partial Gene Silencing of Human Thymine- DNA Glycosylase in Multiple Myeloma Cell Lines. Epigenetics 2006, 1, 138–145. [Google Scholar] [CrossRef][Green Version]
- Otsuki, T.; Yamada, O.; Sakaguchi, H.; Ichiki, T.; Kouguchi, K.; Wada, H.; Hata, H.; Yawata, Y.; Ueki, A. In Vitro Excess Ammonia Production in Human Myeloma Cell Lines. Leukemia 1998, 12, 1149–1158. [Google Scholar] [CrossRef]
- Kwan, L.; Wang, C.; Levitt, L. Hyperammonemic Encephalopathy in Multiple Myeloma. N. Engl. J. Med. 2002, 346, 1674–1675. [Google Scholar] [CrossRef]
- Pham, A.; Reagan, J.L.; Castillo, J.J. Multiple Myeloma-Induced Hyperammonemic Encephalopathy: An Entity Associated with High in-Patient Mortality. Leuk. Res. 2013, 37, 1229–1232. [Google Scholar] [CrossRef]
- Pérez Retortillo, J.A.; Marco, F.; Amutio, E.; Conde, E.; Iriondo, A.; Zubizarreta, A. Hyperammonemic Encephalopathy in Multiple Myeloma. Haematologica 1998, 83, 956–957. [Google Scholar] [PubMed]
- Coloff, J.L.; Murphy, J.P.; Braun, C.R.; Harris, I.S.; Shelton, L.M.; Kami, K.; Gygi, S.P.; Selfors, L.M.; Brugge, J.S. Differential Glutamate Metabolism in Proliferating and Quiescent Mammary Epithelial Cells. Cell Metab. 2016, 23, 867–880. [Google Scholar] [CrossRef] [PubMed]
- Gonsalves, W.I.; Ramakrishnan, V.; Hitosugi, T.; Ghosh, T.; Jevremovic, D.; Dutta, T.; Sakrikar, D.; Petterson, X.-M.; Wellik, L.; Kumar, S.K.; et al. Glutamine-Derived 2-Hydroxyglutarate Is Associated with Disease Progression in Plasma Cell Malignancies. JCI Insight 2018, 3. [Google Scholar] [CrossRef] [PubMed]
- Parsons, D.W.; Jones, S.; Zhang, X.; Lin, J.C.-H.; Leary, R.J.; Angenendt, P.; Mankoo, P.; Carter, H.; Siu, I.-M.; Gallia, G.L.; et al. An Integrated Genomic Analysis of Human Glioblastoma Multiforme. Science 2008, 321, 1807–1812. [Google Scholar] [CrossRef] [PubMed]
- Walker, B.A.; Mavrommatis, K.; Wardell, C.P.; Ashby, T.C.; Bauer, M.; Davies, F.E.; Rosenthal, A.; Wang, H.; Qu, P.; Hoering, A.; et al. Identification of Novel Mutational Drivers Reveals Oncogene Dependencies in Multiple Myeloma. Blood 2018, 132, 587–597. [Google Scholar] [CrossRef] [PubMed]
- Carbonneau, M.; Gagné, M.L.; Lalonde, M.-E.; Germain, M.-A.; Motorina, A.; Guiot, M.-C.; Secco, B.; Vincent, E.E.; Tumber, A.; Hulea, L.; et al. The Oncometabolite 2-Hydroxyglutarate Activates the MTOR Signalling Pathway. Nat. Commun. 2016, 7, 12700. [Google Scholar] [CrossRef] [PubMed]
- Xu, W.; Yang, H.; Liu, Y.; Yang, Y.; Wang, P.; Kim, S.-H.; Ito, S.; Yang, C.; Wang, P.; Xiao, M.-T.; et al. Oncometabolite 2-Hydroxyglutarate Is a Competitive Inhibitor of α-Ketoglutarate-Dependent Dioxygenases. Cancer Cell 2011, 19, 17–30. [Google Scholar] [CrossRef]
- Cacace, A.; Sboarina, M.; Vazeille, T.; Sonveaux, P. Glutamine Activates STAT3 to Control Cancer Cell Proliferation Independently of Glutamine Metabolism. Oncogene 2017, 36, 2074–2084. [Google Scholar] [CrossRef]
- Catlett-Falcone, R.; Landowski, T.H.; Oshiro, M.M.; Turkson, J.; Levitzki, A.; Savino, R.; Ciliberto, G.; Moscinski, L.; Fernández-Luna, J.L.; Nuñez, G.; et al. Constitutive Activation of Stat3 Signaling Confers Resistance to Apoptosis in Human U266 Myeloma Cells. Immunity 1999, 10, 105–115. [Google Scholar] [CrossRef]
- Bharti, A.C.; Shishodia, S.; Reuben, J.M.; Weber, D.; Alexanian, R.; Raj-Vadhan, S.; Estrov, Z.; Talpaz, M.; Aggarwal, B.B. Nuclear Factor-KappaB and STAT3 Are Constitutively Active in CD138+ Cells Derived from Multiple Myeloma Patients, and Suppression of These Transcription Factors Leads to Apoptosis. Blood 2004, 103, 3175–3184. [Google Scholar] [CrossRef]
- Beldi-Ferchiou, A.; Skouri, N.; Ben Ali, C.; Safra, I.; Abdelkefi, A.; Ladeb, S.; Mrad, K.; Ben Othman, T.; Ben Ahmed, M. Abnormal Repression of SHP-1, SHP-2 and SOCS-1 Transcription Sustains the Activation of the JAK/STAT3 Pathway and the Progression of the Disease in Multiple Myeloma. PLoS ONE 2017, 12, e0174835. [Google Scholar] [CrossRef] [PubMed]
- Dechow, T.; Steidle, S.; Götze, K.S.; Rudelius, M.; Behnke, K.; Pechloff, K.; Kratzat, S.; Bullinger, L.; Fend, F.; Soberon, V.; et al. GP130 Activation Induces Myeloma and Collaborates with MYC. J. Clin. Investig. 2014, 124, 5263–5274. [Google Scholar] [CrossRef]
- Edmunds, L.R.; Sharma, L.; Kang, A.; Lu, J.; Vockley, J.; Basu, S.; Uppala, R.; Goetzman, E.S.; Beck, M.E.; Scott, D.; et al. C-Myc Programs Fatty Acid Metabolism and Dictates Acetyl-CoA Abundance and Fate. J. Biol. Chem. 2014, 289, 25382–25392. [Google Scholar] [CrossRef]
- Eberlin, L.S.; Gabay, M.; Fan, A.C.; Gouw, A.M.; Tibshirani, R.J.; Felsher, D.W.; Zare, R.N. Alteration of the Lipid Profile in Lymphomas Induced by MYC Overexpression. Proc. Natl. Acad. Sci. USA 2014, 111, 10450–10455. [Google Scholar] [CrossRef] [PubMed]
- Singh, K.B.; Hahm, E.-R.; Kim, S.-H.; Wendell, S.G.; Singh, S.V. A Novel Metabolic Function of Myc in Regulation of Fatty Acid Synthesis in Prostate Cancer. Oncogene 2020. [Google Scholar] [CrossRef]
- Gouw, A.M.; Margulis, K.; Liu, N.S.; Raman, S.J.; Mancuso, A.; Toal, G.G.; Tong, L.; Mosley, A.; Hsieh, A.L.; Sullivan, D.K.; et al. The MYC Oncogene Cooperates with Sterol-Regulated Element-Binding Protein to Regulate Lipogenesis Essential for Neoplastic Growth. Cell Metab. 2019, 30, 556–572.e5. [Google Scholar] [CrossRef] [PubMed]
- Morelli, E.; Fulciniti, M.; Samur, M.K.; Ribeiro, C.; Wert-Lamas, L.; Gulla, A.; Aktas Samur, A.; Federico, C.; Scionti, F.; Yao, Y.; et al. Targeting Myeloma Cell Metabolism via Disruption of the Lnc-17-92 Transcriptional Program: Druggable New Vulnerability in Multiple Myeloma. Blood 2019, 134, 317. [Google Scholar] [CrossRef]
- Venkateshaiah, S.U.; Khan, S.; Ling, W.; John, L.S.; Bam, R.; Li, X.; Yaccoby, S. Stearoyl CoA Desaturase 1 (SCD1) Is Upregulated in Rapidly Growing Myeloma Cells and Is Required for Cell Proliferation. Blood 2011, 118, 3943. [Google Scholar] [CrossRef]
- Tirado-Vélez, J.M.; Joumady, I.; Sáez-Benito, A.; Cózar-Castellano, I.; Perdomo, G. Inhibition of Fatty Acid Metabolism Reduces Human Myeloma Cells Proliferation. PLoS ONE 2012, 7, e46484. [Google Scholar] [CrossRef]
- Carroll, P.A.; Diolaiti, D.; McFerrin, L.; Gu, H.; Djukovic, D.; Du, J.; Cheng, P.F.; Anderson, S.; Ulrich, M.; Hurley, J.B.; et al. Deregulated Myc Requires MondoA/Mlx for Metabolic Reprogramming and Tumorigenesis. Cancer Cell 2015, 27, 271–285. [Google Scholar] [CrossRef]
- Porstmann, T.; Santos, C.R.; Griffiths, B.; Cully, M.; Wu, M.; Leevers, S.; Griffiths, J.R.; Chung, Y.-L.; Schulze, A. SREBP Activity Is Regulated by MTORC1 and Contributes to Akt-Dependent Cell Growth. Cell Metab. 2008, 8, 224–236. [Google Scholar] [CrossRef] [PubMed]
- Zhong, C.; Fan, L.; Yao, F.; Shi, J.; Fang, W.; Zhao, H. HMGCR Is Necessary for the Tumorigenecity of Esophageal Squamous Cell Carcinoma and Is Regulated by Myc. Tumour Biol. 2014, 35, 4123–4129. [Google Scholar] [CrossRef] [PubMed]
- Wong, W.W.-L.; Clendening, J.W.; Martirosyan, A.; Boutros, P.C.; Bros, C.; Khosravi, F.; Jurisica, I.; Stewart, A.K.; Bergsagel, P.L.; Penn, L.Z. Determinants of Sensitivity to Lovastatin-Induced Apoptosis in Multiple Myeloma. Mol. Cancer Ther. 2007, 6, 1886–1897. [Google Scholar] [CrossRef] [PubMed]
- Xia, Z.; Tan, M.M.; Wong, W.W.; Dimitroulakos, J.; Minden, M.D.; Penn, L.Z. Blocking Protein Geranylgeranylation Is Essential for Lovastatin-Induced Apoptosis of Human Acute Myeloid Leukemia Cells. Leukemia 2001, 15, 1398–1407. [Google Scholar] [CrossRef] [PubMed]
- Matusewicz, L.; Meissner, J.; Toporkiewicz, M.; Sikorski, A.F. The Effect of Statins on Cancer Cells—Review. Tumour Biol. 2015, 36, 4889–4904. [Google Scholar] [CrossRef]
- Min, D.-J.; Ezponda, T.; Kim, M.K.; Will, C.M.; Martinez-Garcia, E.; Popovic, R.; Basrur, V.; Elenitoba-Johnson, K.S.; Licht, J.D. MMSET Stimulates Myeloma Cell Growth through MicroRNA-Mediated Modulation of c-MYC. Leukemia 2013, 27, 686–694. [Google Scholar] [CrossRef]
- Liu, Y.-C.; Li, F.; Handler, J.; Huang, C.R.L.; Xiang, Y.; Neretti, N.; Sedivy, J.M.; Zeller, K.I.; Dang, C.V. Global Regulation of Nucleotide Biosynthetic Genes by C-Myc. PLoS ONE 2008, 3, e2722. [Google Scholar] [CrossRef]
- Schmidt, E.V. The Role of C-Myc in Cellular Growth Control. Oncogene 1999, 18, 2988–2996. [Google Scholar] [CrossRef]
- Wu, X.; Xia, J.; Zhang, J.; Zhu, Y.; Wu, Y.; Guo, J.; Chen, S.; Lei, Q.; Meng, B.; Kuang, C.; et al. Phosphoglycerate Dehydrogenase Promotes Proliferation and Bortezomib Resistance through Increasing Reduced Glutathione Synthesis in Multiple Myeloma. Br. J. Haematol. 2020, 190, 52–66. [Google Scholar] [CrossRef]
- Miltenberger, R.J.; Sukow, K.A.; Farnham, P.J. An E-Box-Mediated Increase in Cad Transcription at the G1/S-Phase Boundary Is Suppressed by Inhibitory c-Myc Mutants. Mol. Cell Biol. 1995, 15, 2527–2535. [Google Scholar] [CrossRef]
- Baumann, P.; Mandl-Weber, S.; Völkl, A.; Adam, C.; Bumeder, I.; Oduncu, F.; Schmidmaier, R. Dihydroorotate Dehydrogenase Inhibitor A771726 (Leflunomide) Induces Apoptosis and Diminishes Proliferation of Multiple Myeloma Cells. Mol. Cancer Ther. 2009, 8, 366–375. [Google Scholar] [CrossRef] [PubMed]
- Dorasamy, M.S.; Choudhary, B.; Nellore, K.; Subramanya, H.; Wong, P.-F. Dihydroorotate Dehydrogenase Inhibitors Target C-Myc and Arrest Melanoma, Myeloma and Lymphoma Cells at S-Phase. J. Cancer 2017, 8, 3086–3098. [Google Scholar] [CrossRef] [PubMed]
- Zeller, K.I.; Zhao, X.; Lee, C.W.H.; Chiu, K.P.; Yao, F.; Yustein, J.T.; Ooi, H.S.; Orlov, Y.L.; Shahab, A.; Yong, H.C.; et al. Global Mapping of C-Myc Binding Sites and Target Gene Networks in Human B Cells. Proc. Natl. Acad. Sci. USA 2006, 103, 17834–17839. [Google Scholar] [CrossRef] [PubMed]
- Ali, E.S.; Sahu, U.; Villa, E.; O’Hara, B.P.; Gao, P.; Beaudet, C.; Wood, A.W.; Asara, J.M.; Ben-Sahra, I. ERK2 Phosphorylates PFAS to Mediate Posttranslational Control of De Novo Purine Synthesis. Mol. Cell 2020, 78, 1178–1191.e6. [Google Scholar] [CrossRef]
- Li, F.; Wang, Y.; Zeller, K.I.; Potter, J.J.; Wonsey, D.R.; O’Donnell, K.A.; Kim, J.-W.; Yustein, J.T.; Lee, L.A.; Dang, C.V. Myc Stimulates Nuclearly Encoded Mitochondrial Genes and Mitochondrial Biogenesis. Mol. Cell. Biol. 2005, 25, 6225–6234. [Google Scholar] [CrossRef]
- Morrish, F.; Noonan, J.; Perez-Olsen, C.; Gafken, P.R.; Fitzgibbon, M.; Kelleher, J.; VanGilst, M.; Hockenbery, D. Myc-Dependent Mitochondrial Generation of Acetyl-CoA Contributes to Fatty Acid Biosynthesis and Histone Acetylation during Cell Cycle Entry. J. Biol. Chem. 2010, 285, 36267–36274. [Google Scholar] [CrossRef]
- Zhang, H.; Gao, P.; Fukuda, R.; Kumar, G.; Krishnamachary, B.; Zeller, K.I.; Dang, C.V.; Semenza, G.L. HIF-1 Inhibits Mitochondrial Biogenesis and Cellular Respiration in VHL-Deficient Renal Cell Carcinoma by Repression of C-MYC Activity. Cancer Cell 2007, 11, 407–420. [Google Scholar] [CrossRef]
- Graves, J.A.; Wang, Y.; Sims-Lucas, S.; Cherok, E.; Rothermund, K.; Branca, M.F.; Elster, J.; Beer-Stolz, D.; Van Houten, B.; Vockley, J.; et al. Mitochondrial Structure, Function and Dynamics Are Temporally Controlled by c-Myc. PLoS ONE 2012, 7, e37699. [Google Scholar] [CrossRef]
- Zhan, X.; Yu, W.; Franqui-Machin, R.; Bates, M.L.; Nadiminti, K.; Cao, H.; Amendt, B.A.; Jethava, Y.; Frech, I.; Zhan, F.; et al. Alteration of Mitochondrial Biogenesis Promotes Disease Progression in Multiple Myeloma. Oncotarget 2017, 8, 111213–111224. [Google Scholar] [CrossRef]
- Marlein, C.R.; Piddock, R.E.; Mistry, J.J.; Zaitseva, L.; Hellmich, C.; Horton, R.H.; Zhou, Z.; Auger, M.J.; Bowles, K.M.; Rushworth, S.A. CD38-Driven Mitochondrial Trafficking Promotes Bioenergetic Plasticity in Multiple Myeloma. Cancer Res. 2019, 79, 2285–2297. [Google Scholar] [CrossRef]
- Boise, L.H.; Shanmugam, M. Stromal Support of Metabolic Function through Mitochondrial Transfer in Multiple Myeloma. Cancer Res. 2019, 79, 2102–2103. [Google Scholar] [CrossRef] [PubMed]
- Seo, J.H.; Agarwal, E.; Chae, Y.C.; Lee, Y.G.; Garlick, D.S.; Storaci, A.M.; Ferrero, S.; Gaudioso, G.; Gianelli, U.; Vaira, V.; et al. Mitochondrial Fission Factor Is a Novel Myc-Dependent Regulator of Mitochondrial Permeability in Cancer. EBioMedicine 2019, 48, 353–363. [Google Scholar] [CrossRef] [PubMed]
- Motokura, T.; Bloom, T.; Kim, H.G.; Jüppner, H.; Ruderman, J.V.; Kronenberg, H.M.; Arnold, A. A Novel Cyclin Encoded by a Bcl1-Linked Candidate Oncogene. Nature 1991, 350, 512–515. [Google Scholar] [CrossRef] [PubMed]
- Fu, M.; Wang, C.; Li, Z.; Sakamaki, T.; Pestell, R.G. Minireview: Cyclin D1: Normal and Abnormal Functions. Endocrinology 2004, 145, 5439–5447. [Google Scholar] [CrossRef] [PubMed]
- Klein, E.A.; Assoian, R.K. Transcriptional Regulation of the Cyclin D1 Gene at a Glance. J. Cell Sci. 2008, 121, 3853–3857. [Google Scholar] [CrossRef] [PubMed]
- Diehl, J.A.; Cheng, M.; Roussel, M.F.; Sherr, C.J. Glycogen Synthase Kinase-3beta Regulates Cyclin D1 Proteolysis and Subcellular Localization. Genes Dev. 1998, 12, 3499–3511. [Google Scholar] [CrossRef]
- Densham, R.M.; Todd, D.E.; Balmanno, K.; Cook, S.J. ERK1/2 and P38 Cooperate to Delay Progression through G1 by Promoting Cyclin D1 Protein Turnover. Cell Signal 2008, 20, 1986–1994. [Google Scholar] [CrossRef]
- Fukami-Kobayashi, J.; Mitsui, Y. Cyclin D1 Inhibits Cell Proliferation through Binding to PCNA and Cdk2. Exp. Cell Res. 1999, 246, 338–347. [Google Scholar] [CrossRef]
- Alao, J.P. The Regulation of Cyclin D1 Degradation: Roles in Cancer Development and the Potential for Therapeutic Invention. Mol. Cancer 2007, 6, 24. [Google Scholar] [CrossRef]
- Pestell, R.G. New Roles of Cyclin D1. Am. J. Pathol. 2013, 183, 3–9. [Google Scholar] [CrossRef]
- Bienvenu, F.; Gascan, H.; Coqueret, O. Cyclin D1 Represses STAT3 Activation through a Cdk4-Independent Mechanism. J. Biol. Chem. 2001, 276, 16840–16847. [Google Scholar] [CrossRef] [PubMed]
- Bienvenu, F.; Jirawatnotai, S.; Elias, J.E.; Meyer, C.A.; Mizeracka, K.; Marson, A.; Frampton, G.M.; Cole, M.F.; Odom, D.T.; Odajima, J.; et al. Transcriptional Role of Cyclin D1 in Development Revealed by a Genetic-Proteomic Screen. Nature 2010, 463, 374–378. [Google Scholar] [CrossRef] [PubMed]
- Hydbring, P.; Malumbres, M.; Sicinski, P. Non-Canonical Functions of Cell Cycle Cyclins and Cyclin-Dependent Kinases. Nat. Rev. Mol. Cell Biol. 2016, 17, 280–292. [Google Scholar] [CrossRef] [PubMed]
- Chen, Y.; Huang, Y.; Gao, X.; Li, Y.; Lin, J.; Chen, L.; Chang, L.; Chen, G.; Guan, Y.; Pan, L.K.; et al. CCND1 Amplification Contributes to Immunosuppression and Is Associated With a Poor Prognosis to Immune Checkpoint Inhibitors in Solid Tumors. Front. Immunol. 2020, 11, 1620. [Google Scholar] [CrossRef] [PubMed]
- Hoyer, J.D.; Hanson, C.A.; Fonseca, R.; Greipp, P.R.; Dewald, G.W.; Kurtin, P.J. The (11;14)(Q13;Q32) Translocation in Multiple Myeloma. A Morphologic and Immunohistochemical Study. Am. J. Clin. Pathol. 2000, 113, 831–837. [Google Scholar] [CrossRef]
- Padhi, S.; Varghese, R.G.; Ramdas, A. Cyclin D1 Expression in Multiple Myeloma by Immunohistochemistry: Case Series of 14 Patients and Literature Review. Indian J. Med. Paediatr. Oncol. 2013, 34, 283–291. [Google Scholar] [CrossRef]
- Bergsagel, P.L.; Kuehl, W.M.; Zhan, F.; Sawyer, J.; Barlogie, B.; Shaughnessy, J. Cyclin D Dysregulation: An Early and Unifying Pathogenic Event in Multiple Myeloma. Blood 2005, 106, 296–303. [Google Scholar] [CrossRef]
- Jansen-Dürr, P.; Meichle, A.; Steiner, P.; Pagano, M.; Finke, K.; Botz, J.; Wessbecher, J.; Draetta, G.; Eilers, M. Differential Modulation of Cyclin Gene Expression by MYC. Proc. Natl. Acad. Sci. USA 1993, 90, 3685–3689. [Google Scholar] [CrossRef]
- Philipp, A.; Schneider, A.; Väsrik, I.; Finke, K.; Xiong, Y.; Beach, D.; Alitalo, K.; Eilers, M. Repression of Cyclin D1: A Novel Function of MYC. Mol. Cell Biol. 1994, 14, 4032–4043. [Google Scholar] [CrossRef]
- Tchakarska, G.; Le Lan-Leguen, A.; Roth, L.; Sola, B. The Targeting of the Sole Cyclin D1 Is Not Adequate for Mantle Cell Lymphoma and Myeloma Therapies. Haematologica 2009, 94, 1781–1782. [Google Scholar] [CrossRef][Green Version]
- Sewify, E.M.; Afifi, O.A.; Mosad, E.; Zaki, A.H.; El Gammal, S.A. Cyclin D1 Amplification in Multiple Myeloma Is Associated with Multidrug Resistance Expression. Clin. Lymphoma Myeloma Leuk. 2014, 14, 215–222. [Google Scholar] [CrossRef] [PubMed]
- Cook, J.R.; Hsi, E.D.; Worley, S.; Tubbs, R.R.; Hussein, M. Immunohistochemical Analysis Identifies Two Cyclin D1+ Subsets of Plasma Cell Myeloma, Each Associated with Favorable Survival. Am. J. Clin. Pathol. 2006, 125, 615–624. [Google Scholar] [CrossRef] [PubMed]
- Hoechtlen-Vollmar, W.; Menzel, G.; Bartl, R.; Lamerz, R.; Wick, M.; Seidel, D. Amplification of Cyclin D1 Gene in Multiple Myeloma: Clinical and Prognostic Relevance. Br. J. Haematol. 2000, 109, 30–38. [Google Scholar] [CrossRef] [PubMed]
- Glassford, J.; Kassen, D.; Quinn, J.; Stengel, C.; Kallinikou, K.; Khwaja, A.; Yong, K.L. Inhibition of Cell Cycle Progression by Dual Phosphatidylinositol-3-Kinase and MTOR Blockade in Cyclin D2 Positive Multiple Myeloma Bearing IgH Translocations. Blood Cancer J. 2012, 2, e50. [Google Scholar] [CrossRef]
- Chen, K.; Jiao, X.; Di Rocco, A.; Shen, D.; Xu, S.; Ertel, A.; Yu, Z.; Di Sante, G.; Wang, M.; Li, Z.; et al. Endogenous Cyclin D1 Promotes the Rate of Onset and Magnitude of Mitogenic Signaling via Akt1 Ser473 Phosphorylation. Cell Rep. 2020, 32, 108151. [Google Scholar] [CrossRef]
- Schmidt, M.; Fernandez de Mattos, S.; van der Horst, A.; Klompmaker, R.; Kops, G.J.P.L.; Lam, E.W.-F.; Burgering, B.M.T.; Medema, R.H. Cell Cycle Inhibition by FoxO Forkhead Transcription Factors Involves Downregulation of Cyclin D. Mol. Cell. Biol. 2002, 22, 7842–7852. [Google Scholar] [CrossRef]
- Sakamaki, T.; Casimiro, M.C.; Ju, X.; Quong, A.A.; Katiyar, S.; Liu, M.; Jiao, X.; Li, A.; Zhang, X.; Lu, Y.; et al. Cyclin D1 Determines Mitochondrial Function in Vivo. Mol. Cell. Biol. 2006, 26, 5449–5469. [Google Scholar] [CrossRef]
- Tchakarska, G.; Roussel, M.; Troussard, X.; Sola, B. Cyclin D1 Inhibits Mitochondrial Activity in B Cells. Cancer Res. 2011, 71, 1690–1699. [Google Scholar] [CrossRef]
- Elstrom, R.L.; Bauer, D.E.; Buzzai, M.; Karnauskas, R.; Harris, M.H.; Plas, D.R.; Zhuang, H.; Cinalli, R.M.; Alavi, A.; Rudin, C.M.; et al. Akt Stimulates Aerobic Glycolysis in Cancer Cells. Cancer Res. 2004, 64, 3892–3899. [Google Scholar] [CrossRef]
- Yang, W.; Xia, Y.; Hawke, D.; Li, X.; Liang, J.; Xing, D.; Aldape, K.; Hunter, T.; Alfred Yung, W.K.; Lu, Z. PKM2 Phosphorylates Histone H3 and Promotes Gene Transcription and Tumorigenesis. Cell 2012, 150, 685–696. [Google Scholar] [CrossRef]
- Wang, H.; Nicolay, B.N.; Chick, J.M.; Gao, X.; Geng, Y.; Ren, H.; Gao, H.; Yang, G.; Williams, J.A.; Suski, J.M.; et al. The Metabolic Function of Cyclin D3-CDK6 Kinase in Cancer Cell Survival. Nature 2017, 546, 426–430. [Google Scholar] [CrossRef]
- Zaal, E.A.; Wu, W.; Jansen, G.; Zweegman, S.; Cloos, J.; Berkers, C.R. Bortezomib Resistance in Multiple Myeloma Is Associated with Increased Serine Synthesis. Cancer Metab. 2017, 5, 7. [Google Scholar] [CrossRef]
- Lee, Y.; Dominy, J.E.; Choi, Y.J.; Jurczak, M.; Tolliday, N.; Camporez, J.P.; Chim, H.; Lim, J.-H.; Ruan, H.-B.; Yang, X.; et al. Cyclin D1-Cdk4 Controls Glucose Metabolism Independently of Cell Cycle Progression. Nature 2014, 510, 547–551. [Google Scholar] [CrossRef]
- Bhalla, K.; Liu, W.-J.; Thompson, K.; Anders, L.; Devarakonda, S.; Dewi, R.; Buckley, S.; Hwang, B.-J.; Polster, B.; Dorsey, S.G.; et al. Cyclin D1 Represses Gluconeogenesis via Inhibition of the Transcriptional Coactivator PGC1α. Diabetes 2014, 63, 3266–3278. [Google Scholar] [CrossRef]
- Yu, W.; Cao, D.; Zhou, H.; Hu, Y.; Guo, T. PGC-1α Is Responsible for Survival of Multiple Myeloma Cells under Hyperglycemia and Chemotherapy. Oncol. Rep. 2015, 33, 2086–2092. [Google Scholar] [CrossRef]
- Cao, D.; Zhou, H.; Zhao, J.; Jin, L.; Yu, W.; Yan, H.; Hu, Y.; Guo, T. PGC-1α Integrates Glucose Metabolism and Angiogenesis in Multiple Myeloma Cells by Regulating VEGF and GLUT-4. Oncol. Rep. 2014, 31, 1205–1210. [Google Scholar] [CrossRef]
- Wang, C.; Li, Z.; Lu, Y.; Du, R.; Katiyar, S.; Yang, J.; Fu, M.; Leader, J.E.; Quong, A.; Novikoff, P.M.; et al. Cyclin D1 Repression of Nuclear Respiratory Factor 1 Integrates Nuclear DNA Synthesis and Mitochondrial Function. Proc. Natl. Acad. Sci. USA 2006, 103, 11567–11572. [Google Scholar] [CrossRef]
- Tomlin, F.M.; Gerling-Driessen, U.I.M.; Liu, Y.-C.; Flynn, R.A.; Vangala, J.R.; Lentz, C.S.; Clauder-Muenster, S.; Jakob, P.; Mueller, W.F.; Ordoñez-Rueda, D.; et al. Inhibition of NGLY1 Inactivates the Transcription Factor Nrf1 and Potentiates Proteasome Inhibitor Cytotoxicity. ACS Cent. Sci. 2017, 3, 1143–1155. [Google Scholar] [CrossRef]
- Kamarajugadda, S.; Becker, J.R.; Hanse, E.A.; Mashek, D.G.; Mashek, M.T.; Hendrickson, A.M.; Mullany, L.K.; Albrecht, J.H. Cyclin D1 Represses Peroxisome Proliferator-Activated Receptor Alpha and Inhibits Fatty Acid Oxidation. Oncotarget 2016, 7, 47674–47686. [Google Scholar] [CrossRef]
- Wang, C.; Pattabiraman, N.; Zhou, J.N.; Fu, M.; Sakamaki, T.; Albanese, C.; Li, Z.; Wu, K.; Hulit, J.; Neumeister, P.; et al. Cyclin D1 Repression of Peroxisome Proliferator-Activated Receptor Gamma Expression and Transactivation. Mol. Cell. Biol. 2003, 23, 6159–6173. [Google Scholar] [CrossRef]
- Fu, M.; Rao, M.; Bouras, T.; Wang, C.; Wu, K.; Zhang, X.; Li, Z.; Yao, T.-P.; Pestell, R.G. Cyclin D1 Inhibits Peroxisome Proliferator-Activated Receptor Gamma-Mediated Adipogenesis through Histone Deacetylase Recruitment. J. Biol. Chem. 2005, 280, 16934–16941. [Google Scholar] [CrossRef]
- Dreyer, C.; Keller, H.; Mahfoudi, A.; Laudet, V.; Krey, G.; Wahli, W. Positive Regulation of the Peroxisomal Beta-Oxidation Pathway by Fatty Acids through Activation of Peroxisome Proliferator-Activated Receptors (PPAR). Biol. Cell 1993, 77, 67–76. [Google Scholar] [CrossRef]
- Garcia-Bates, T.M.; Bernstein, S.H.; Phipps, R.P. Peroxisome Proliferator-Activated Receptor Gamma Overexpression Suppresses Growth and Induces Apoptosis in Human Multiple Myeloma Cells. Clin. Cancer Res. 2008, 14, 6414–6425. [Google Scholar] [CrossRef]
- Ray, D.M.; Bernstein, S.H.; Phipps, R.P. Human Multiple Myeloma Cells Express Peroxisome Proliferator-Activated Receptor Gamma and Undergo Apoptosis upon Exposure to PPARgamma Ligands. Clin. Immunol. 2004, 113, 203–213. [Google Scholar] [CrossRef]
- Hanse, E.A.; Mashek, D.G.; Becker, J.R.; Solmonson, A.D.; Mullany, L.K.; Mashek, M.T.; Towle, H.C.; Chau, A.T.; Albrecht, J.H. Cyclin D1 Inhibits Hepatic Lipogenesis via Repression of Carbohydrate Response Element Binding Protein and Hepatocyte Nuclear Factor 4α. Cell Cycle 2012, 11, 2681–2690. [Google Scholar] [CrossRef]
- Mitra, A.K.; Kumar, H.; Ramakrishnan, V.; Chen, L.; Baughn, L.; Kumar, S.; Rajkumar, S.V.; Van Ness, B.G. In Vitro and Ex Vivo Gene Expression Profiling Reveals Differential Kinetic Response of HSPs and UPR Genes Is Associated with PI Resistance in Multiple Myeloma. Blood Cancer J. 2020, 10, 78. [Google Scholar] [CrossRef]
- Steiner, N.; Müller, U.; Hajek, R.; Sevcikova, S.; Borjan, B.; Jöhrer, K.; Göbel, G.; Pircher, A.; Gunsilius, E. The Metabolomic Plasma Profile of Myeloma Patients Is Considerably Different from Healthy Subjects and Reveals Potential New Therapeutic Targets. PLoS ONE 2018, 13, e0202045. [Google Scholar] [CrossRef]
- Gonsalves, W.I.; Broniowska, K.; Jessen, E.; Petterson, X.-M.; Bush, A.G.; Gransee, J.; Lacy, M.Q.; Hitosugi, T.; Kumar, S.K. Metabolomic and Lipidomic Profiling of Bone Marrow Plasma Differentiates Patients with Monoclonal Gammopathy of Undetermined Significance from Multiple Myeloma. Sci. Rep. 2020, 10, 10250. [Google Scholar] [CrossRef]
- Keats, J.J.; Maxwell, C.A.; Taylor, B.J.; Hendzel, M.J.; Chesi, M.; Bergsagel, P.L.; Larratt, L.M.; Mant, M.J.; Reiman, T.; Belch, A.R.; et al. Overexpression of Transcripts Originating from the MMSET Locus Characterizes All t(4;14)(P16;Q32)-Positive Multiple Myeloma Patients. Blood 2005, 105, 4060–4069. [Google Scholar] [CrossRef]
- Itoh, N.; Ornitz, D.M. Fibroblast Growth Factors: From Molecular Evolution to Roles in Development, Metabolism and Disease. J. Biochem. 2011, 149, 121–130. [Google Scholar] [CrossRef]
- Cappellen, D.; De Oliveira, C.; Ricol, D.; de Medina, S.; Bourdin, J.; Sastre-Garau, X.; Chopin, D.; Thiery, J.P.; Radvanyi, F. Frequent Activating Mutations of FGFR3 in Human Bladder and Cervix Carcinomas. Nat. Genet. 1999, 23, 18–20. [Google Scholar] [CrossRef]
- Soverini, S.; Terragna, C.; Testoni, N.; Ruggeri, D.; Tosi, P.; Zamagni, E.; Cellini, C.; Cavo, M.; Baccarani, M.; Tura, S.; et al. Novel Mutation and RNA Splice Variant of Fibroblast Growth Factor Receptor 3 in Multiple Myeloma Patients at Diagnosis. Haematologica 2002, 87, 1036–1040. [Google Scholar]
- Intini, D.; Baldini, L.; Fabris, S.; Lombardi, L.; Ciceri, G.; Maiolo, A.T.; Neri, A. Analysis of FGFR3 Gene Mutations in Multiple Myeloma Patients with t(4;14). Br. J. Haematol. 2001, 114, 362–364. [Google Scholar] [CrossRef]
- Ronchetti, D.; Greco, A.; Compasso, S.; Colombo, G.; Dell’Era, P.; Otsuki, T.; Lombardi, L.; Neri, A. Deregulated FGFR3 Mutants in Multiple Myeloma Cell Lines with t(4;14): Comparative Analysis of Y373C, K650E and the Novel G384D Mutations. Oncogene 2001, 20, 3553–3562. [Google Scholar] [CrossRef]
- Bernard-Pierrot, I.; Brams, A.; Dunois-Lardé, C.; Caillault, A.; Diez de Medina, S.G.; Cappellen, D.; Graff, G.; Thiery, J.P.; Chopin, D.; Ricol, D.; et al. Oncogenic Properties of the Mutated Forms of Fibroblast Growth Factor Receptor 3b. Carcinogenesis 2006, 27, 740–747. [Google Scholar] [CrossRef]
- Jin, N.; Bi, A.; Lan, X.; Xu, J.; Wang, X.; Liu, Y.; Wang, T.; Tang, S.; Zeng, H.; Chen, Z.; et al. Identification of Metabolic Vulnerabilities of Receptor Tyrosine Kinases-Driven Cancer. Nat. Commun. 2019, 10, 2701. [Google Scholar] [CrossRef]
- Bluemn, E.G.; Coleman, I.M.; Lucas, J.M.; Coleman, R.T.; Hernandez-Lopez, S.; Tharakan, R.; Bianchi-Frias, D.; Dumpit, R.F.; Kaipainen, A.; Corella, A.N.; et al. Androgen Receptor Pathway-Independent Prostate Cancer Is Sustained through FGF Signaling. Cancer Cell 2017, 32, 474–489.e6. [Google Scholar] [CrossRef]
- Babina, I.S.; Turner, N.C. Advances and Challenges in Targeting FGFR Signalling in Cancer. Nat. Rev. Cancer 2017, 17, 318–332. [Google Scholar] [CrossRef]
- Li, L.; Zhang, S.; Li, H.; Chou, H. FGFR3 Promotes the Growth and Malignancy of Melanoma by Influencing EMT and the Phosphorylation of ERK, AKT, and EGFR. BMC Cancer 2019, 19, 963. [Google Scholar] [CrossRef]
- Yu, P.; Wilhelm, K.; Dubrac, A.; Tung, J.K.; Alves, T.C.; Fang, J.S.; Xie, Y.; Zhu, J.; Chen, Z.; De Smet, F.; et al. FGF-Dependent Metabolic Control of Vascular Development. Nature 2017, 545, 224–228. [Google Scholar] [CrossRef]
- Zingone, A.; Cultraro, C.M.; Shin, D.-M.; Bean, C.M.; Morse, H.C., III; Janz, S.; Kuehl, W.M. Ectopic Expression of Wild-Type FGFR3 Cooperates with MYC to Accelerate Development of B-Cell Lineage Neoplasms. Leukemia 2010, 24, 1171–1178. [Google Scholar] [CrossRef] [PubMed]
- Ronca, R.; Ghedini, G.C.; Maccarinelli, F.; Sacco, A.; Locatelli, S.L.; Foglio, E.; Taranto, S.; Grillo, E.; Matarazzo, S.; Castelli, R.; et al. FGF Trapping Inhibits Multiple Myeloma Growth through C-Myc Degradation–Induced Mitochondrial Oxidative Stress. Cancer Res. 2020, 80, 2340. [Google Scholar] [CrossRef] [PubMed]
- Du, X.; Wang, Q.-R.; Chan, E.; Merchant, M.; Liu, J.; French, D.; Ashkenazi, A.; Qing, J. FGFR3 Stimulates Stearoyl CoA Desaturase 1 Activity to Promote Bladder Tumor Growth. Cancer Res. 2012, 72, 5843–5855. [Google Scholar] [CrossRef]
- Faict, S.; Oudaert, I.; D’Auria, L.; Dehairs, J.; Maes, K.; Vlummens, P.; De Veirman, K.; De Bruyne, E.; Fostier, K.; Vande Broek, I.; et al. The Transfer of Sphingomyelinase Contributes to Drug Resistance in Multiple Myeloma. Cancers 2019, 11, 1823. [Google Scholar] [CrossRef] [PubMed]
- Bae, J.; Kumazoe, M.; Takeuchi, C.; Hidaka, S.; Fujimura, Y.; Tachibana, H. Epigallocatechin-3-O-Gallate Induces Acid Sphingomyelinase Activation through Activation of Phospholipase C. Biochem. Biophys. Res. Commun. 2019, 520, 186–191. [Google Scholar] [CrossRef]
- Chen, J.; Williams, I.R.; Lee, B.H.; Duclos, N.; Huntly, B.J.P.; Donoghue, D.J.; Gilliland, D.G. Constitutively Activated FGFR3 Mutants Signal through PLCgamma-Dependent and -Independent Pathways for Hematopoietic Transformation. Blood 2005, 106, 328–337. [Google Scholar] [CrossRef]
- Jiang, L.-B.; Cao, L.; Yin, X.-F.; Yasen, M.; Yishake, M.; Dong, J.; Li, X.-L. Activation of Autophagy via Ca(2+)-Dependent AMPK/MTOR Pathway in Rat Notochordal Cells Is a Cellular Adaptation under Hyperosmotic Stress. Cell Cycle 2015, 14, 867–879. [Google Scholar] [CrossRef]
- Zhou, L.; Deepa, S.S.; Etzler, J.C.; Ryu, J.; Mao, X.; Fang, Q.; Liu, D.D.; Torres, J.M.; Jia, W.; Lechleiter, J.D.; et al. Adiponectin Activates AMP-Activated Protein Kinase in Muscle Cells via APPL1/LKB1-Dependent and Phospholipase C/Ca2+/Ca2+/Calmodulin-Dependent Protein Kinase Kinase-Dependent Pathways. J. Biol. Chem. 2009, 284, 22426–22435. [Google Scholar] [CrossRef]
- Krejci, P.; Mekikian, P.B.; Wilcox, W.R. The Fibroblast Growth Factors in Multiple Myeloma. Leukemia 2006, 20, 1165–1168. [Google Scholar] [CrossRef]
- Baumann, P.; Mandl-Weber, S.; Emmerich, B.; Straka, C.; Schmidmaier, R. Activation of Adenosine Monophosphate Activated Protein Kinase Inhibits Growth of Multiple Myeloma Cells. Exp. Cell Res. 2007, 313, 3592–3603. [Google Scholar] [CrossRef]
- Longo, J.; Smirnov, P.; Li, Z.; Branchard, E.; van Leeuwen, J.E.; Licht, J.D.; Haibe-Kains, B.; Andrews, D.W.; Keats, J.J.; Pugh, T.J.; et al. The Mevalonate Pathway Is an Actionable Vulnerability of t(4;14)-Positive Multiple Myeloma. Leukemia 2020, 1–13. [Google Scholar] [CrossRef]
- Bennett, R.L.; Swaroop, A.; Troche, C.; Licht, J.D. The Role of Nuclear Receptor-Binding SET Domain Family Histone Lysine Methyltransferases in Cancer. Cold Spring Harb. Perspect. Med. 2017, 7. [Google Scholar] [CrossRef] [PubMed]
- Kuo, A.J.; Cheung, P.; Chen, K.; Zee, B.M.; Kioi, M.; Lauring, J.; Xi, Y.; Park, B.H.; Shi, X.; Garcia, B.A.; et al. NSD2 Links Dimethylation of Histone H3 at Lysine 36 to Oncogenic Programming. Mol. Cell 2011, 44, 609–620. [Google Scholar] [CrossRef] [PubMed]
- Li, Y.; Trojer, P.; Xu, C.-F.; Cheung, P.; Kuo, A.; Drury, W.J., III; Qiao, Q.; Neubert, T.A.; Xu, R.-M.; Gozani, O.; et al. The Target of the NSD Family of Histone Lysine Methyltransferases Depends on the Nature of the Substrate. J. Biol. Chem. 2009, 284, 34283–34295. [Google Scholar] [CrossRef]
- Popovic, R.; Martinez-Garcia, E.; Giannopoulou, E.G.; Zhang, Q.; Zhang, Q.; Ezponda, T.; Shah, M.Y.; Zheng, Y.; Will, C.M.; Small, E.C.; et al. Histone Methyltransferase MMSET/NSD2 Alters EZH2 Binding and Reprograms the Myeloma Epigenome through Global and Focal Changes in H3K36 and H3K27 Methylation. PLoS Genet. 2014, 10, e1004566. [Google Scholar] [CrossRef]
- Martinez-Garcia, E.; Popovic, R.; Min, D.-J.; Sweet, S.M.M.; Thomas, P.M.; Zamdborg, L.; Heffner, A.; Will, C.; Lamy, L.; Staudt, L.M.; et al. The MMSET Histone Methyl Transferase Switches Global Histone Methylation and Alters Gene Expression in t(4;14) Multiple Myeloma Cells. Blood 2011, 117, 211–220. [Google Scholar] [CrossRef]
- Lhoumaud, P.; Badri, S.; Rodriguez-Hernaez, J.; Sakellaropoulos, T.; Sethia, G.; Kloetgen, A.; Cornwell, M.; Bhattacharyya, S.; Ay, F.; Bonneau, R.; et al. NSD2 Overexpression Drives Clustered Chromatin and Transcriptional Changes in a Subset of Insulated Domains. Nat. Commun. 2019, 10, 4843. [Google Scholar] [CrossRef]
- Swaroop, A.; Oyer, J.A.; Will, C.M.; Huang, X.; Yu, W.; Troche, C.; Bulic, M.; Durham, B.H.; Wen, Q.J.; Crispino, J.D.; et al. An Activating Mutation of the NSD2 Histone Methyltransferase Drives Oncogenic Reprogramming in Acute Lymphocytic Leukemia. Oncogene 2019, 38, 671–686. [Google Scholar] [CrossRef]
- Song, X.; Gao, T.; Wang, N.; Feng, Q.; You, X.; Ye, T.; Lei, Q.; Zhu, Y.; Xiong, M.; Xia, Y.; et al. Selective Inhibition of EZH2 by ZLD1039 Blocks H3K27methylation and Leads to Potent Anti-Tumor Activity in Breast Cancer. Sci. Rep. 2016, 6, 24893. [Google Scholar] [CrossRef]
- Campos-Sanchez, E.; Deleyto-Seldas, N.; Dominguez, V.; Carrillo-de-Santa-Pau, E.; Ura, K.; Rocha, P.P.; Kim, J.; Aljoufi, A.; Esteve-Codina, A.; Dabad, M.; et al. Wolf-Hirschhorn Syndrome Candidate 1 Is Necessary for Correct Hematopoietic and B Cell Development. Cell Rep. 2017, 19, 1586–1601. [Google Scholar] [CrossRef]
- Nguyen, H.V.; Dong, J.; Panchakshari, R.A.; Kumar, V.; Alt, F.W.; Bories, J.-C. Histone Methyltransferase MMSET Promotes AID-Mediated DNA Breaks at the Donor Switch Region during Class Switch Recombination. Proc. Natl. Acad. Sci. USA 2017, 114, E10560–E10567. [Google Scholar] [CrossRef] [PubMed]
- de Krijger, I.; van der Torre, J.; Peuscher, M.H.; Eder, M.; Jacobs, J.J.L. H3K36 Dimethylation by MMSET Promotes Classical Non-Homologous End-Joining at Unprotected Telomeres. Oncogene 2020, 39, 4814–4827. [Google Scholar] [CrossRef] [PubMed]
- Shah, M.Y.; Martinez-Garcia, E.; Phillip, J.M.; Chambliss, A.B.; Popovic, R.; Ezponda, T.; Small, E.C.; Will, C.; Phillip, M.P.; Neri, P.; et al. MMSET/WHSC1 Enhances DNA Damage Repair Leading to an Increase in Resistance to Chemotherapeutic Agents. Oncogene 2016, 35, 5905–5915. [Google Scholar] [CrossRef] [PubMed]
- Wang, J.; Duan, Z.; Nugent, Z.; Zou, J.X.; Borowsky, A.D.; Zhang, Y.; Tepper, C.G.; Li, J.J.; Fiehn, O.; Xu, J.; et al. Reprogramming Metabolism by Histone Methyltransferase NSD2 Drives Endocrine Resistance via Coordinated Activation of Pentose Phosphate Pathway Enzymes. Cancer Lett. 2016, 378, 69–79. [Google Scholar] [CrossRef]
- Xiao, G.; Chan, L.N.; Klemm, L.; Braas, D.; Chen, Z.; Geng, H.; Zhang, Q.C.; Aghajanirefah, A.; Cosgun, K.N.; Sadras, T.; et al. B-Cell-Specific Diversion of Glucose Carbon Utilization Reveals a Unique Vulnerability in B Cell Malignancies. Cell 2018, 173, 470–484.e18. [Google Scholar] [CrossRef]
- Hayes, J.D.; Dinkova-Kostova, A.T.; Tew, K.D. Oxidative Stress in Cancer. Cancer Cell 2020, 38, 167–197. [Google Scholar] [CrossRef]
- Tanaka, H.; Igata, T.; Etoh, K.; Koga, T.; Takebayashi, S.-I.; Nakao, M. The NSD2/WHSC1/MMSET Methyltransferase Prevents Cellular Senescence-Associated Epigenomic Remodeling. Aging Cell 2020, 19, e13173. [Google Scholar] [CrossRef]
- Li, N.; Xue, W.; Yuan, H.; Dong, B.; Ding, Y.; Liu, Y.; Jiang, M.; Kan, S.; Sun, T.; Ren, J.; et al. AKT-Mediated Stabilization of Histone Methyltransferase WHSC1 Promotes Prostate Cancer Metastasis. J. Clin. Investig. 2017, 127, 1284–1302. [Google Scholar] [CrossRef]
- Xie, Z.; Chooi, J.Y.; Toh, S.H.M.; Yang, D.; Basri, N.B.; Ho, Y.S.; Chng, W.J. MMSET I Acts as an Oncoprotein and Regulates GLO1 Expression in t(4;14) Multiple Myeloma Cells. Leukemia 2019, 33, 739–748. [Google Scholar] [CrossRef]
- Honek, J.F. Glyoxalase Biochemistry. Biomol. Concepts 2015, 6, 401–414. [Google Scholar] [CrossRef]
- Morgan, G.J.; Walker, B.A.; Davies, F.E. The Genetic Architecture of Multiple Myeloma. Nat. Rev. Cancer 2012, 12, 335–348. [Google Scholar] [CrossRef] [PubMed]
- Chesi, M.; Bergsagel, P.L.; Shonukan, O.O.; Martelli, M.L.; Brents, L.A.; Chen, T.; Schröck, E.; Ried, T.; Kuehl, W.M. Frequent Dysregulation of the C-Maf Proto-Oncogene at 16q23 by Translocation to an Ig Locus in Multiple Myeloma. Blood 1998, 91, 4457–4463. [Google Scholar] [CrossRef] [PubMed]
- Shah, V.; Sherborne, A.L.; Walker, B.A.; Johnson, D.C.; Boyle, E.M.; Ellis, S.; Begum, D.B.; Proszek, P.Z.; Jones, J.R.; Pawlyn, C.; et al. Prediction of Outcome in Newly Diagnosed Myeloma: A Meta-Analysis of the Molecular Profiles of 1905 Trial Patients. Leukemia 2018, 32, 102–110. [Google Scholar] [CrossRef] [PubMed]
- Eychène, A.; Rocques, N.; Pouponnot, C. A New MAFia in Cancer. Nat. Rev. Cancer 2008, 8, 683–693. [Google Scholar] [CrossRef]
- Goldman-Mazur, S.; Jurczyszyn, A.; Castillo, J.J.; Waszczuk-Gajda, A.; Grząśko, N.; Radocha, J.; Bittrich, M.; Kortüm, K.M.; Gozzetti, A.; Usnarska-Zubkiewicz, L.; et al. Different MAF Translocations Confer Similar Prognosis in Newly Diagnosed Multiple Myeloma Patients. Leuk. Lymphoma 2020, 61, 1885–1893. [Google Scholar] [CrossRef]
- Rocques, N.; Abou Zeid, N.; Sii-Felice, K.; Lecoin, L.; Felder-Schmittbuhl, M.-P.; Eychène, A.; Pouponnot, C. GSK-3-Mediated Phosphorylation Enhances Maf-Transforming Activity. Mol. Cell 2007, 28, 584–597. [Google Scholar] [CrossRef]
- Chen, Q.; Dowhan, D.H.; Liang, D.; Moore, D.D.; Overbeek, P.A. CREB-Binding Protein/P300 Co-Activation of Crystallin Gene Expression. J. Biol. Chem. 2002, 277, 24081–24089. [Google Scholar] [CrossRef]
- Friedman, J.S.; Khanna, H.; Swain, P.K.; Denicola, R.; Cheng, H.; Mitton, K.P.; Weber, C.H.; Hicks, D.; Swaroop, A. The Minimal Transactivation Domain of the Basic Motif-Leucine Zipper Transcription Factor NRL Interacts with TATA-Binding Protein. J. Biol. Chem. 2004, 279, 47233–47241. [Google Scholar] [CrossRef]
- Motohashi, H.; Katsuoka, F.; Shavit, J.A.; Engel, J.D.; Yamamoto, M. Positive or Negative MARE-Dependent Transcriptional Regulation Is Determined by the Abundance of Small Maf Proteins. Cell 2000, 103, 865–875. [Google Scholar] [CrossRef][Green Version]
- Kataoka, K. Multiple Mechanisms and Functions of Maf Transcription Factors in the Regulation of Tissue-Specific Genes. J. Biochem. 2007, 141, 775–781. [Google Scholar] [CrossRef]
- Yang, Y.; Cvekl, A. Large Maf Transcription Factors: Cousins of AP-1 Proteins and Important Regulators of Cellular Differentiation. Einstein J. Biol. Med. 2007, 23, 2–11. [Google Scholar] [CrossRef]
- Blank, V.; Andrews, N.C. The Maf Transcription Factors: Regulators of Differentiation. Trends Biochem. Sci. 1997, 22, 437–441. [Google Scholar] [CrossRef]
- Cordes, S.P.; Barsh, G.S. The Mouse Segmentation Gene Kr Encodes a Novel Basic Domain-Leucine Zipper Transcription Factor. Cell 1994, 79, 1025–1034. [Google Scholar] [CrossRef]
- Han, S.-I.; Aramata, S.; Yasuda, K.; Kataoka, K. MafA Stability in Pancreatic Beta Cells Is Regulated by Glucose and Is Dependent on Its Constitutive Phosphorylation at Multiple Sites by Glycogen Synthase Kinase 3. Mol. Cell. Biol. 2007, 27, 6593–6605. [Google Scholar] [CrossRef]
- Ochi, H.; Ogino, H.; Kageyama, Y.; Yasuda, K. The Stability of the Lens-Specific Maf Protein Is Regulated by Fibroblast Growth Factor (FGF)/ERK Signaling in Lens Fiber Differentiation. J. Biol. Chem. 2003, 278, 537–544. [Google Scholar] [CrossRef] [PubMed]
- Sii-Felice, K.; Pouponnot, C.; Gillet, S.; Lecoin, L.; Girault, J.-A.; Eychène, A.; Felder-Schmittbuhl, M.-P. MafA Transcription Factor Is Phosphorylated by P38 MAP Kinase. FEBS Lett. 2005, 579, 3547–3554. [Google Scholar] [CrossRef] [PubMed]
- Wang, S.; Juan, J.; Zhang, Z.; Du, Y.; Xu, Y.; Tong, J.; Cao, B.; Moran, M.F.; Zeng, Y.; Mao, X. Inhibition of the Deubiquitinase USP5 Leads to C-Maf Protein Degradation and Myeloma Cell Apoptosis. Cell Death Dis. 2017, 8, e3058. [Google Scholar] [CrossRef] [PubMed]
- He, Y.; Wang, S.; Tong, J.; Jiang, S.; Yang, Y.; Zhang, Z.; Xu, Y.; Zeng, Y.; Cao, B.; Moran, M.F.; et al. The Deubiquitinase USP7 Stabilizes Maf Proteins to Promote Myeloma Cell Survival. J. Biol. Chem. 2020, 295, 2084–2096. [Google Scholar] [CrossRef]
- Nishizawa, M.; Kataoka, K.; Vogt, P.K. MafA Has Strong Cell Transforming Ability but Is a Weak Transactivator. Oncogene 2003, 22, 7882–7890. [Google Scholar] [CrossRef][Green Version]
- Pouponnot, C.; Sii-Felice, K.; Hmitou, I.; Rocques, N.; Lecoin, L.; Druillennec, S.; Felder-Schmittbuhl, M.-P.; Eychène, A. Cell Context Reveals a Dual Role for Maf in Oncogenesis. Oncogene 2006, 25, 1299–1310. [Google Scholar] [CrossRef]
- Murakami, Y.I.; Yatabe, Y.; Sakaguchi, T.; Sasaki, E.; Yamashita, Y.; Morito, N.; Yoh, K.; Fujioka, Y.; Matsuno, F.; Hata, H.; et al. C-Maf Expression in Angioimmunoblastic T-Cell Lymphoma. Am. J. Surg. Pathol. 2007, 31, 1695–1702. [Google Scholar] [CrossRef] [PubMed]
- Morito, N.; Yoh, K.; Fujioka, Y.; Nakano, T.; Shimohata, H.; Hashimoto, Y.; Yamada, A.; Maeda, A.; Matsuno, F.; Hata, H.; et al. Overexpression of C-Maf Contributes to T-Cell Lymphoma in Both Mice and Human. Cancer Res. 2006, 66, 812–819. [Google Scholar] [CrossRef]
- Morito, N.; Yoh, K.; Maeda, A.; Nakano, T.; Fujita, A.; Kusakabe, M.; Hamada, M.; Kudo, T.; Yamagata, K.; Takahashi, S. A Novel Transgenic Mouse Model of the Human Multiple Myeloma Chromosomal Translocation t(14;16)(Q32;Q23). Cancer Res. 2011, 71, 339–348. [Google Scholar] [CrossRef]
- Vicente-Dueñas, C.; Romero-Camarero, I.; González-Herrero, I.; Alonso-Escudero, E.; Abollo-Jiménez, F.; Jiang, X.; Gutierrez, N.C.; Orfao, A.; Marín, N.; Villar, L.M.; et al. A Novel Molecular Mechanism Involved in Multiple Myeloma Development Revealed by Targeting MafB to Haematopoietic Progenitors. EMBO J. 2012, 31, 3704–3717. [Google Scholar] [CrossRef] [PubMed]
- Vicente-Dueñas, C.; González-Herrero, I.; García Cenador, M.B.; García Criado, F.J.; Sánchez-García, I. Loss of P53 Exacerbates Multiple Myeloma Phenotype by Facilitating the Reprogramming of Hematopoietic Stem/Progenitor Cells to Malignant Plasma Cells by MafB. Cell Cycle 2012, 11, 3896–3900. [Google Scholar] [CrossRef]
- Hurt, E.M.; Wiestner, A.; Rosenwald, A.; Shaffer, A.L.; Campo, E.; Grogan, T.; Bergsagel, P.L.; Kuehl, W.M.; Staudt, L.M. Overexpression of C-Maf Is a Frequent Oncogenic Event in Multiple Myeloma That Promotes Proliferation and Pathological Interactions with Bone Marrow Stroma. Cancer Cell 2004, 5, 191–199. [Google Scholar] [CrossRef]
- Inagaki, A.; Tajima, E.; Uranishi, M.; Totani, H.; Asao, Y.; Ogura, H.; Masaki, A.; Yoshida, T.; Mori, F.; Ito, A.; et al. Global Real-Time Quantitative Reverse Transcription-Polymerase Chain Reaction Detecting Proto-Oncogenes Associated with 14q32 Chromosomal Translocation as a Valuable Marker for Predicting Survival in Multiple Myeloma. Leuk. Res. 2013, 37, 1648–1655. [Google Scholar] [CrossRef]
- Peterson, T.R.; Laplante, M.; Thoreen, C.C.; Sancak, Y.; Kang, S.A.; Kuehl, W.M.; Gray, N.S.; Sabatini, D.M. DEPTOR Is an MTOR Inhibitor Frequently Overexpressed in Multiple Myeloma Cells and Required for Their Survival. Cell 2009, 137, 873–886. [Google Scholar] [CrossRef]
- Zhan, F.; Huang, Y.; Colla, S.; Stewart, J.P.; Hanamura, I.; Gupta, S.; Epstein, J.; Yaccoby, S.; Sawyer, J.; Burington, B.; et al. The Molecular Classification of Multiple Myeloma. Blood 2006, 108, 2020–2028. [Google Scholar] [CrossRef]
- Moreaux, J.; Hose, D.; Jourdan, M.; Reme, T.; Hundemer, M.; Moos, M.; Robert, N.; Moine, P.; De Vos, J.; Goldschmidt, H.; et al. TACI Expression Is Associated with a Mature Bone Marrow Plasma Cell Signature and C-MAF Overexpression in Human Myeloma Cell Lines. Haematologica 2007, 92, 803–811. [Google Scholar] [CrossRef]
- Carrasco, D.R.; Sukhdeo, K.; Protopopova, M.; Sinha, R.; Enos, M.; Carrasco, D.E.; Zheng, M.; Mani, M.; Henderson, J.; Pinkus, G.S.; et al. The Differentiation and Stress Response Factor XBP-1 Drives Multiple Myeloma Pathogenesis. Cancer Cell 2007, 11, 349–360. [Google Scholar] [CrossRef] [PubMed]
- Annunziata, C.M.; Hernandez, L.; Davis, R.E.; Zingone, A.; Lamy, L.; Lam, L.T.; Hurt, E.M.; Shaffer, A.L.; Kuehl, W.M.; Staudt, L.M. A Mechanistic Rationale for MEK Inhibitor Therapy in Myeloma Based on Blockade of MAF Oncogene Expression. Blood 2011, 117, 2396–2404. [Google Scholar] [CrossRef] [PubMed]
- Walker, B.A.; Wardell, C.P.; Murison, A.; Boyle, E.M.; Begum, D.B.; Dahir, N.M.; Proszek, P.Z.; Melchor, L.; Pawlyn, C.; Kaiser, M.F.; et al. APOBEC Family Mutational Signatures Are Associated with Poor Prognosis Translocations in Multiple Myeloma. Nat. Commun. 2015, 6, 6997. [Google Scholar] [CrossRef] [PubMed]
- Hoang, P.H.; Cornish, A.J.; Dobbins, S.E.; Kaiser, M.; Houlston, R.S. Mutational Processes Contributing to the Development of Multiple Myeloma. Blood Cancer J. 2019, 9, 60. [Google Scholar] [CrossRef] [PubMed]
- Weinhold, N.; Heuck, C.J.; Rosenthal, A.; Thanendrarajan, S.; Stein, C.K.; Van Rhee, F.; Zangari, M.; Hoering, A.; Tian, E.; Davies, F.E.; et al. Clinical Value of Molecular Subtyping Multiple Myeloma Using Gene Expression Profiling. Leukemia 2016, 30, 423–430. [Google Scholar] [CrossRef]
- Qiang, Y.-W.; Ye, S.; Chen, Y.; Buros, A.F.; Edmonson, R.; van Rhee, F.; Barlogie, B.; Epstein, J.; Morgan, G.J.; Davies, F.E. MAF Protein Mediates Innate Resistance to Proteasome Inhibition Therapy in Multiple Myeloma. Blood 2016, 128, 2919–2930. [Google Scholar] [CrossRef]
- Qiang, Y.-W.; Ye, S.; Huang, Y.; Chen, Y.; Van Rhee, F.; Epstein, J.; Walker, B.A.; Morgan, G.J.; Davies, F.E. MAFb Protein Confers Intrinsic Resistance to Proteasome Inhibitors in Multiple Myeloma. BMC Cancer 2018, 18, 724. [Google Scholar] [CrossRef]
- Herath, N.I.; Rocques, N.; Garancher, A.; Eychène, A.; Pouponnot, C. GSK3-Mediated MAF Phosphorylation in Multiple Myeloma as a Potential Therapeutic Target. Blood Cancer J. 2014, 4, e175. [Google Scholar] [CrossRef]
- Mattioli, M.; Agnelli, L.; Fabris, S.; Baldini, L.; Morabito, F.; Bicciato, S.; Verdelli, D.; Intini, D.; Nobili, L.; Cro, L.; et al. Gene Expression Profiling of Plasma Cell Dyscrasias Reveals Molecular Patterns Associated with Distinct IGH Translocations in Multiple Myeloma. Oncogene 2005, 24, 2461–2473. [Google Scholar] [CrossRef]
- van Stralen, E.; van de Wetering, M.; Agnelli, L.; Neri, A.; Clevers, H.C.; Bast, B.J.E.G. Identification of Primary MAFB Target Genes in Multiple Myeloma. Exp. Hematol. 2009, 37, 78–86. [Google Scholar] [CrossRef]
- Suzuki, A.; Iida, S.; Kato-Uranishi, M.; Tajima, E.; Zhan, F.; Hanamura, I.; Huang, Y.; Ogura, T.; Takahashi, S.; Ueda, R.; et al. ARK5 Is Transcriptionally Regulated by the Large-MAF Family and Mediates IGF-1-Induced Cell Invasion in Multiple Myeloma: ARK5 as a New Molecular Determinant of Malignant Multiple Myeloma. Oncogene 2005, 24, 6936–6944. [Google Scholar] [CrossRef] [PubMed]
- Furuyama, K.; Chera, S.; van Gurp, L.; Oropeza, D.; Ghila, L.; Damond, N.; Vethe, H.; Paulo, J.A.; Joosten, A.M.; Berney, T.; et al. Diabetes Relief in Mice by Glucose-Sensing Insulin-Secreting Human α-Cells. Nature 2019, 567, 43–48. [Google Scholar] [CrossRef] [PubMed]
- Vanderford, N.L.; Andrali, S.S.; Ozcan, S. Glucose Induces MafA Expression in Pancreatic Beta Cell Lines via the Hexosamine Biosynthetic Pathway. J. Biol. Chem. 2007, 282, 1577–1584. [Google Scholar] [CrossRef]
- Chiaradonna, F.; Ricciardiello, F.; Palorini, R. The Nutrient-Sensing Hexosamine Biosynthetic Pathway as the Hub of Cancer Metabolic Rewiring. Cells 2018, 7, 53. [Google Scholar] [CrossRef] [PubMed]
- Liu, Y.; Cao, Y.; Pan, X.; Shi, M.; Wu, Q.; Huang, T.; Jiang, H.; Li, W.; Zhang, J. O-GlcNAc Elevation through Activation of the Hexosamine Biosynthetic Pathway Enhances Cancer Cell Chemoresistance. Cell Death Dis. 2018, 9, 485. [Google Scholar] [CrossRef]
- Sekine, H.; Okazaki, K.; Kato, K.; Alam, M.M.; Shima, H.; Katsuoka, F.; Tsujita, T.; Suzuki, N.; Kobayashi, A.; Igarashi, K.; et al. O-GlcNAcylation Signal Mediates Proteasome Inhibitor Resistance in Cancer Cells by Stabilizing NRF1. Mol. Cell. Biol. 2018, 38. [Google Scholar] [CrossRef]
- Tibullo, D.; Giallongo, C.; Romano, A.; Vicario, N.; Barbato, A.; Puglisi, F.; Parenti, R.; Amorini, A.M.; Wissam Saab, M.; Tavazzi, B.; et al. Mitochondrial Functions, Energy Metabolism and Protein Glycosylation Are Interconnected Processes Mediating Resistance to Bortezomib in Multiple Myeloma Cells. Biomolecules 2020, 10, 696. [Google Scholar] [CrossRef]
- Salpeter, S.J.; Klochendler, A.; Weinberg-Corem, N.; Porat, S.; Granot, Z.; Shapiro, A.M.J.; Magnuson, M.A.; Eden, A.; Grimsby, J.; Glaser, B.; et al. Glucose Regulates Cyclin D2 Expression in Quiescent and Replicating Pancreatic β-Cells through Glycolysis and Calcium Channels. Endocrinology 2011, 152, 2589–2598. [Google Scholar] [CrossRef]
- Luan, C.; Ye, Y.; Singh, T.; Barghouth, M.; Eliasson, L.; Artner, I.; Zhang, E.; Renström, E. The Calcium Channel Subunit Gamma-4 Is Regulated by MafA and Necessary for Pancreatic Beta-Cell Specification. Commun. Biol. 2019, 2, 106. [Google Scholar] [CrossRef]
- Kushner, J.A.; Ciemerych, M.A.; Sicinska, E.; Wartschow, L.M.; Teta, M.; Long, S.Y.; Sicinski, P.; White, M.F. Cyclins D2 and D1 Are Essential for Postnatal Pancreatic Beta-Cell Growth. Mol. Cell. Biol. 2005, 25, 3752–3762. [Google Scholar] [CrossRef]
- Suzuki, A.; Lu, J.; Kusakai, G.-I.; Kishimoto, A.; Ogura, T.; Esumi, H. ARK5 Is a Tumor Invasion-Associated Factor Downstream of Akt Signaling. Mol. Cell. Biol. 2004, 24, 3526–3535. [Google Scholar] [CrossRef] [PubMed]
- Lanfranchi, M.; Meyer-Dilhet, G.; Dos Reis, R.; Garcia, A.; Blondet, C.; Javin, L.; Amar, A.; Courchet, J. The AMPK-Related Kinase NUAK1 Controls Cortical Axons Branching though a Local Modulation of Mitochondrial Metabolic Functions. bioRxiv 2020. [Google Scholar] [CrossRef]
- Palma, M.; Riffo, E.N.; Suganuma, T.; Washburn, M.P.; Workman, J.L.; Pincheira, R.; Castro, A.F. Identification of a Nuclear Localization Signal and Importin Beta Members Mediating NUAK1 Nuclear Import Inhibited by Oxidative Stress. J. Cell Biochem. 2019, 120, 16088–16107. [Google Scholar] [CrossRef] [PubMed]
- Escalona, E.; Muñoz, M.; Pincheira, R.; Elorza, Á.A.; Castro, A.F. Cytosolic NUAK1 Enhances ATP Production by Maintaining Proper Glycolysis and Mitochondrial Function in Cancer Cells. Front. Oncol. 2020, 10, 1123. [Google Scholar] [CrossRef] [PubMed]
- Perumal, D.; Kuo, P.-Y.; Leshchenko, V.V.; Jiang, Z.; Divakar, S.K.A.; Cho, H.J.; Chari, A.; Brody, J.; Reddy, M.V.R.; Zhang, W.; et al. Dual Targeting of CDK4 and ARK5 Using a Novel Kinase Inhibitor ON123300 Exerts Potent Anticancer Activity against Multiple Myeloma. Cancer Res. 2016, 76, 1225–1236. [Google Scholar] [CrossRef]
- Wang, H.; Wang, L.; Chi, P.-D.; Wang, W.; Chen, X.-Q.; Geng, Q.-R.; Xia, Z.-J.; Lu, Y. High Level of Interleukin-10 in Serum Predicts Poor Prognosis in Multiple Myeloma. Br. J. Cancer 2016, 114, 463–468. [Google Scholar] [CrossRef]
- Alexandrakis, M.G.; Goulidaki, N.; Pappa, C.A.; Boula, A.; Psarakis, F.; Neonakis, I.; Tsirakis, G. Interleukin-10 Induces Both Plasma Cell Proliferation and Angiogenesis in Multiple Myeloma. Pathol. Oncol. Res. 2015, 21, 929–934. [Google Scholar] [CrossRef]
- Xu, J.; Yang, Y.; Qiu, G.; Lal, G.; Wu, Z.; Levy, D.E.; Ochando, J.C.; Bromberg, J.S.; Ding, Y. C-Maf Regulates IL-10 Expression during Th17 Polarization. J. Immunol. 2009, 182, 6226–6236. [Google Scholar] [CrossRef]
- Trinchieri, G. Interleukin-10 Production by Effector T Cells: Th1 Cells Show Self Control. J. Exp. Med. 2007, 204, 239–243. [Google Scholar] [CrossRef]
- Imbratta, C.; Leblond, M.M.; Bouzourène, H.; Speiser, D.E.; Velin, D.; Verdeil, G. Maf Deficiency in T Cells Dysregulates T(Reg)—T(H)17 Balance Leading to Spontaneous Colitis. Sci. Rep. 2019, 9, 6135. [Google Scholar] [CrossRef]
- Cao, S.; Liu, J.; Song, L.; Ma, X. The Protooncogene C-Maf Is an Essential Transcription Factor for IL-10 Gene Expression in Macrophages. J. Immunol. 2005, 174, 3484–3492. [Google Scholar] [CrossRef]
- Komai, T.; Inoue, M.; Okamura, T.; Morita, K.; Iwasaki, Y.; Sumitomo, S.; Shoda, H.; Yamamoto, K.; Fujio, K. Transforming Growth Factor-β and Interleukin-10 Synergistically Regulate Humoral Immunity via Modulating Metabolic Signals. Front. Immunol. 2018, 9, 1364. [Google Scholar] [CrossRef] [PubMed]
- Otsuki, T.; Yamada, O.; Yata, K.; Sakaguchi, H.; Kurebayashi, J.; Yawata, Y.; Ueki, A. Expression and Production of Interleukin 10 in Human Myeloma Cell Lines. Br. J. Haematol. 2000, 111, 835–842. [Google Scholar] [PubMed]
- Liu, L.; Ulbrich, J.; Müller, J.; Wüstefeld, T.; Aeberhard, L.; Kress, T.R.; Muthalagu, N.; Rycak, L.; Rudalska, R.; Moll, R.; et al. Deregulated MYC Expression Induces Dependence upon AMPK-Related Kinase 5. Nature 2012, 483, 608–612. [Google Scholar] [CrossRef] [PubMed]
- Cossa, G.; Roeschert, I.; Prinz, F.; Baluapuri, A.; Silveira Vidal, R.; Schülein-Völk, C.; Chang, Y.-C.; Ade, C.P.; Mastrobuoni, G.; Girard, C.; et al. Localized Inhibition of Protein Phosphatase 1 by NUAK1 Promotes Spliceosome Activity and Reveals a MYC-Sensitive Feedback Control of Transcription. Mol. Cell 2020, 77, 1322–1339.e11. [Google Scholar] [CrossRef] [PubMed]
- Perucha, E.; Melchiotti, R.; Bibby, J.A.; Wu, W.; Frederiksen, K.S.; Roberts, C.A.; Hall, Z.; LeFriec, G.; Robertson, K.A.; Lavender, P.; et al. The Cholesterol Biosynthesis Pathway Regulates IL-10 Expression in Human Th1 Cells. Nat. Commun. 2019, 10, 498. [Google Scholar] [CrossRef] [PubMed]


Publisher’s Note: MDPI stays neutral with regard to jurisdictional claims in published maps and institutional affiliations. |
© 2021 by the authors. Licensee MDPI, Basel, Switzerland. This article is an open access article distributed under the terms and conditions of the Creative Commons Attribution (CC BY) license (http://creativecommons.org/licenses/by/4.0/).