
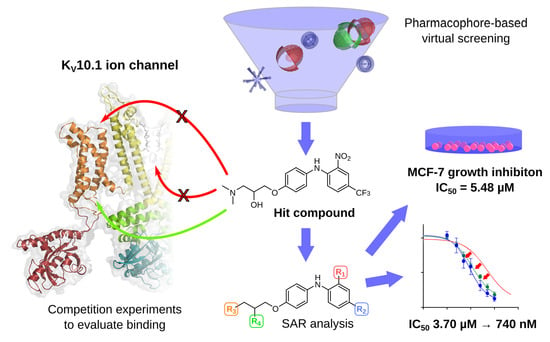
3D Pharmacophore-Based Discovery of Novel KV10.1 Inhibitors with Antiproliferative Activity

 , , ,
, , ,  , , , , and
Abstract
:Simple Summary
Abstract
1. Introduction

2. Materials and Methods
2.1. Virtual Compound Library Preparation
2.2. Ligand-Based Pharmacophore Modelling
2.3. Virtual Screening
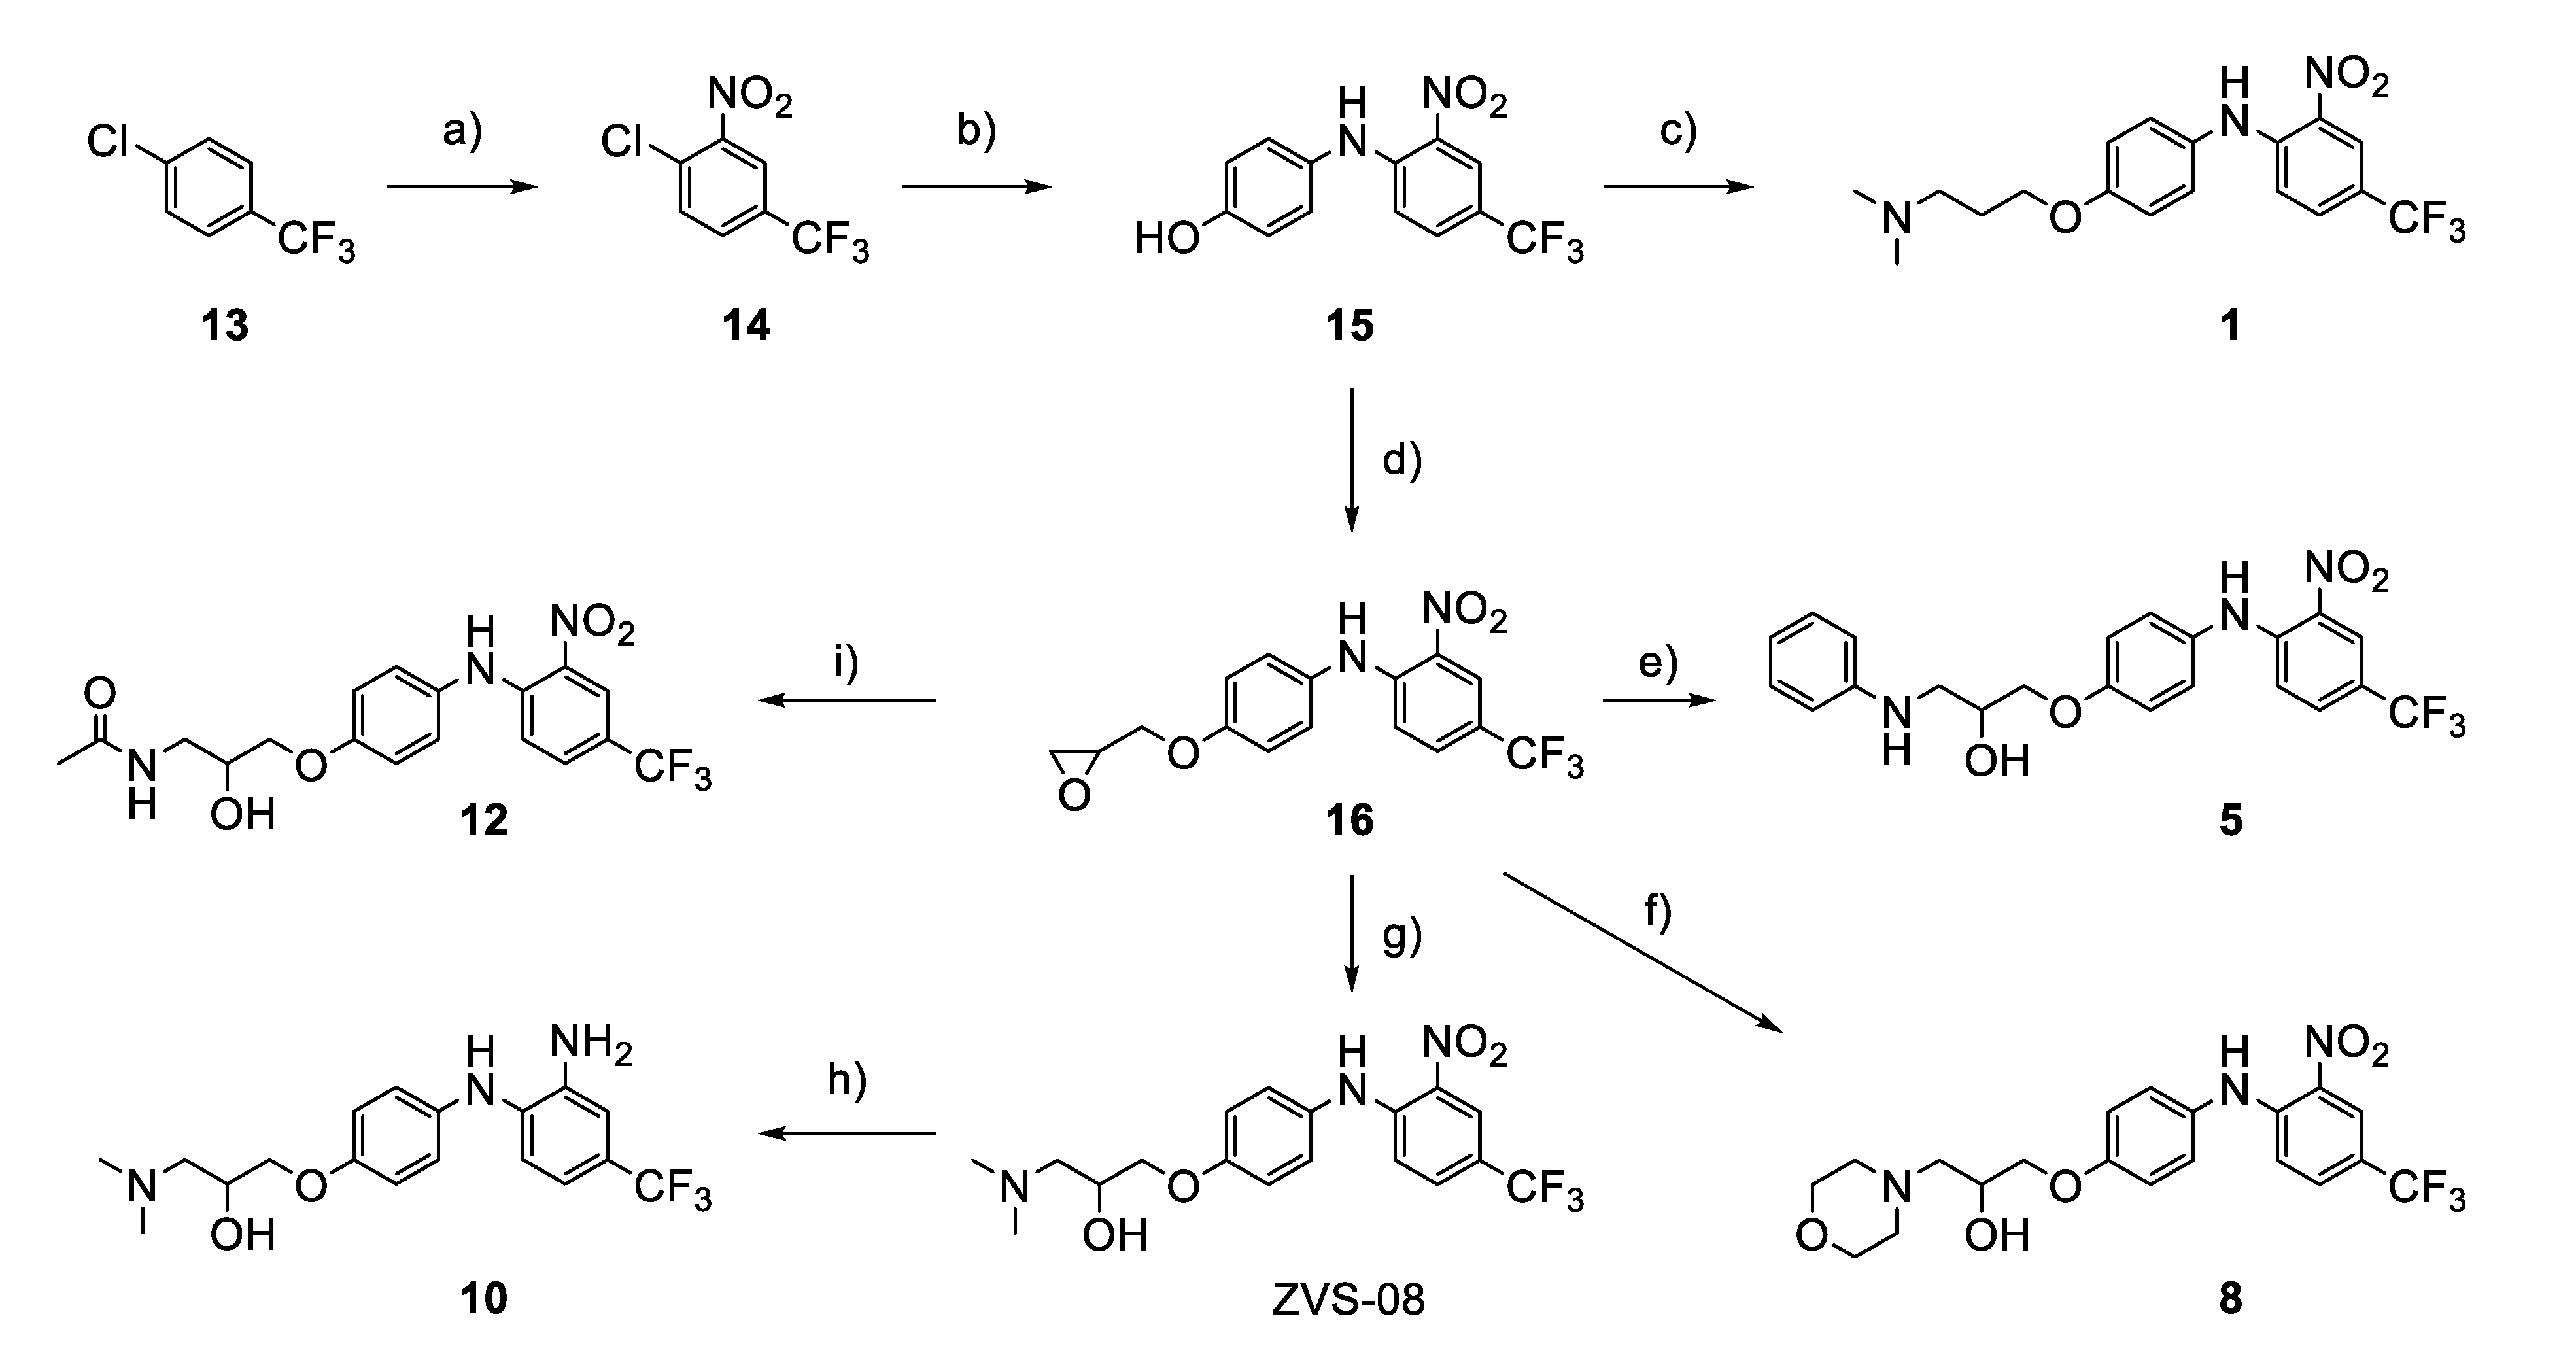
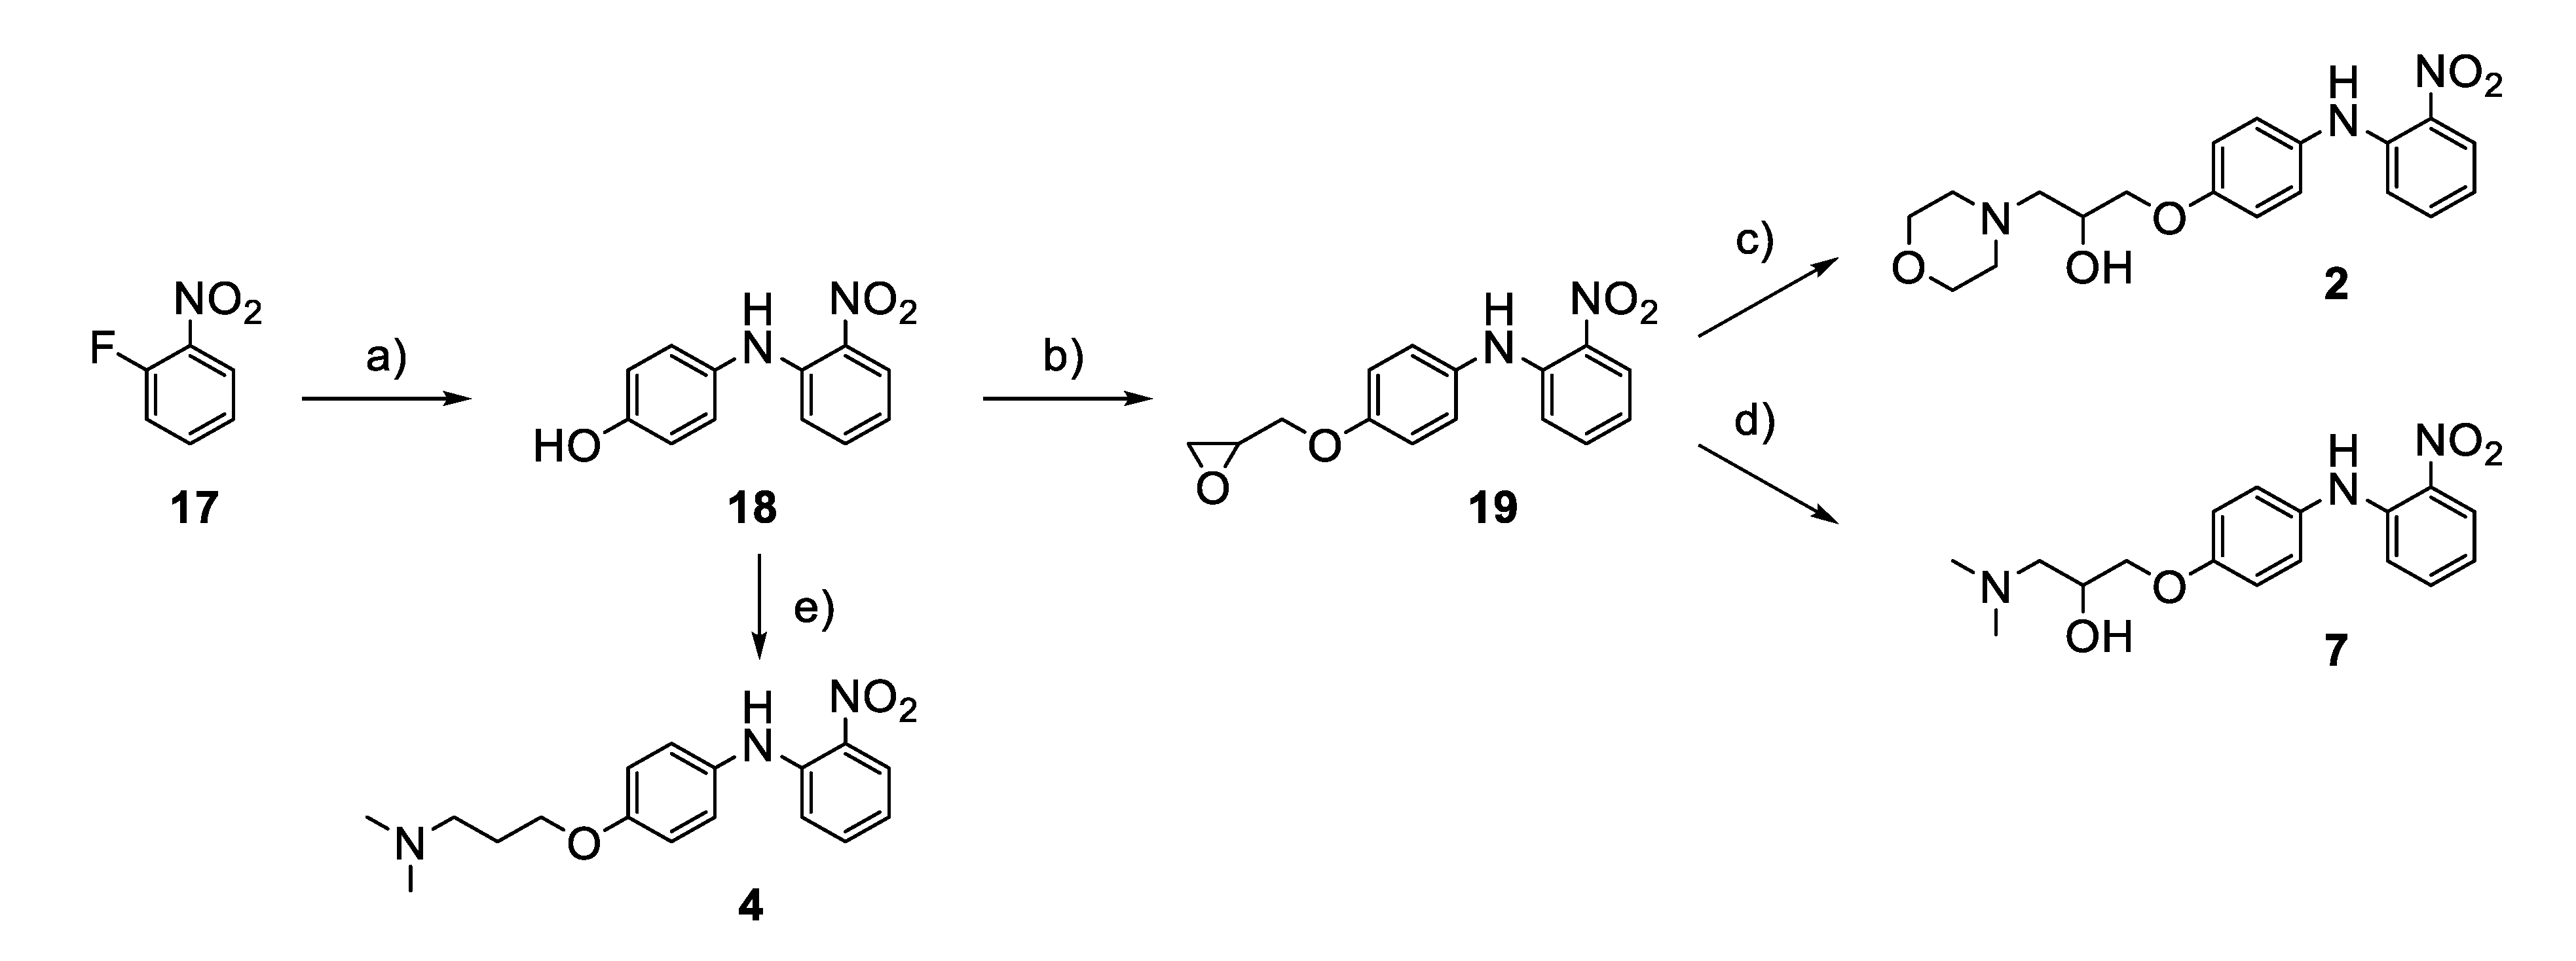
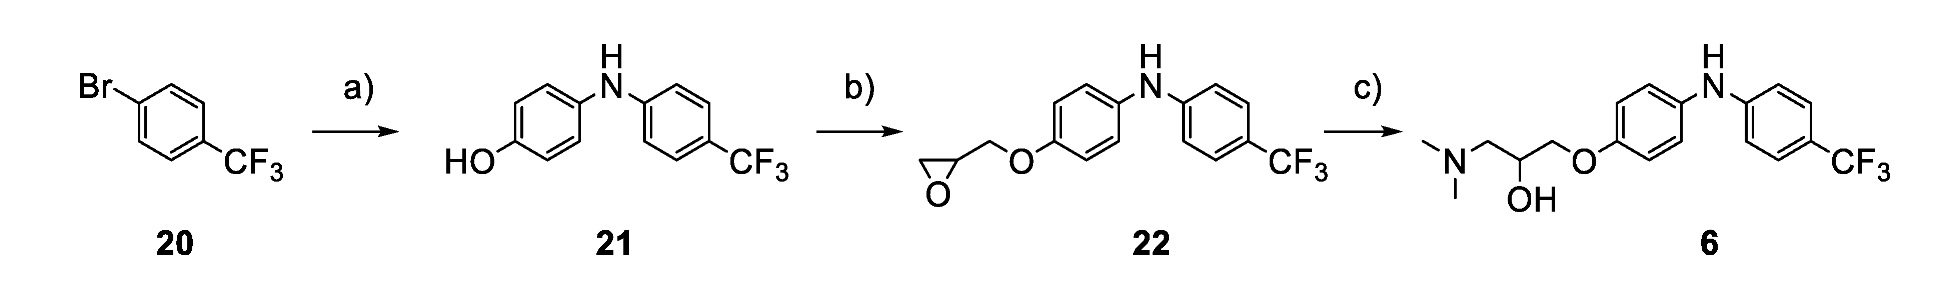
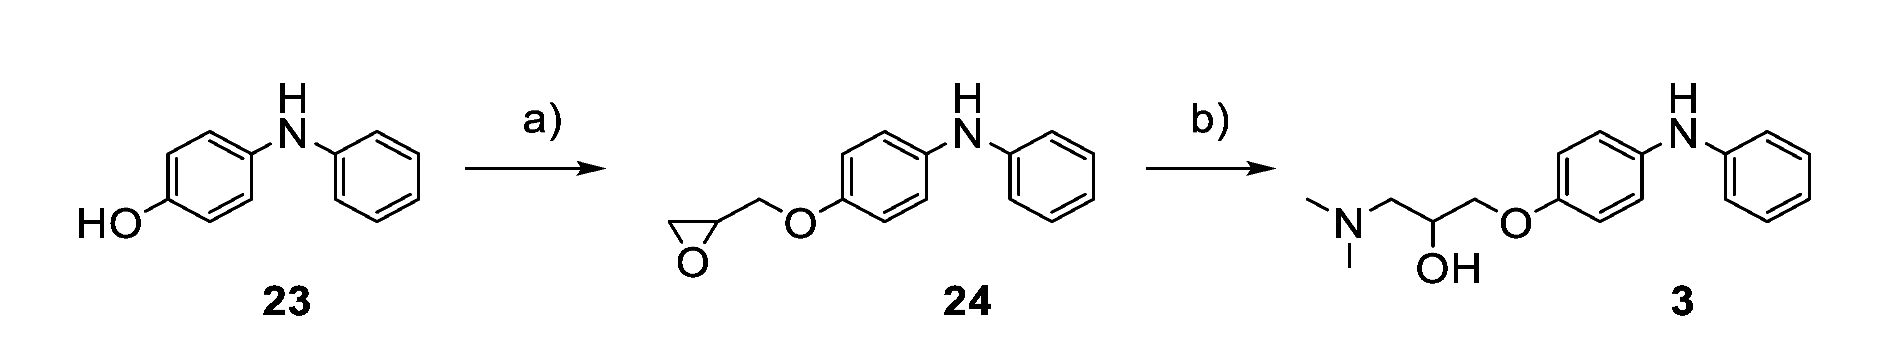
2.4. Chemistry
2.5. Electrophysiological Recordings
2.6. Statistical Analysis
2.7. Cell Culture
2.8. Evaluation of Mutagenic Activity with Salmonella/Microsomal Reverse Mutation Assay
3. Results
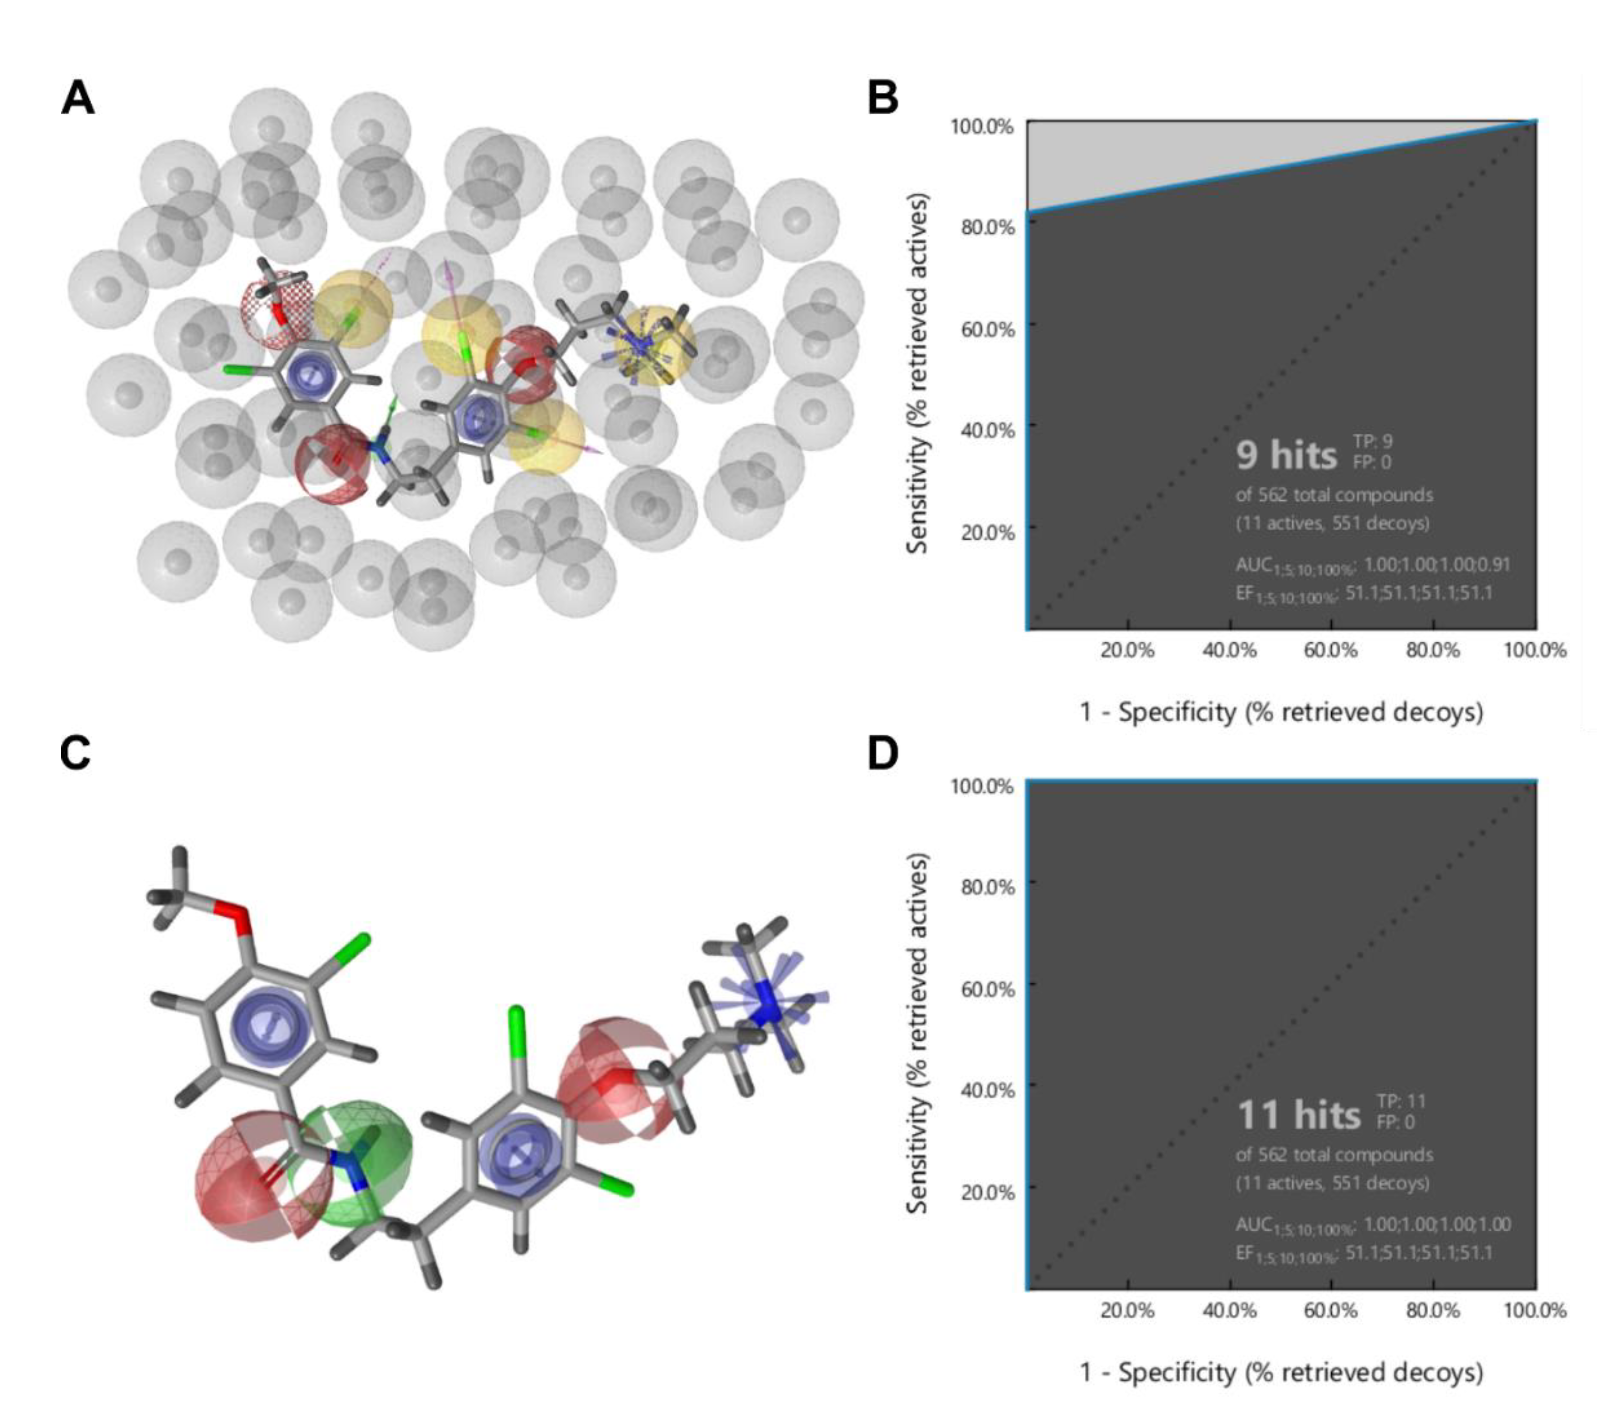
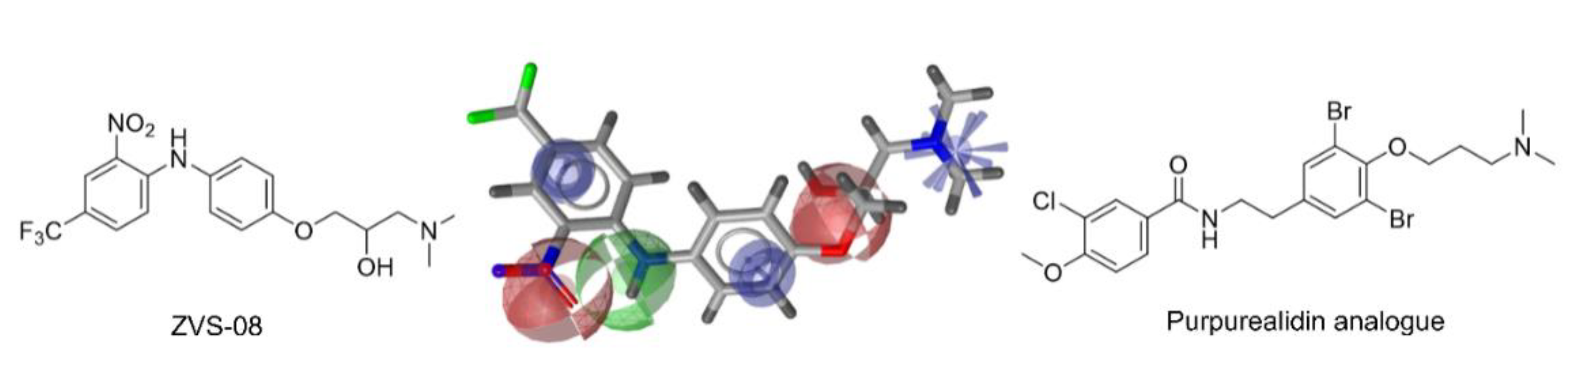
3.1. Ligand-Based Identification of Novel KV10.1 Inhibitors through in Silico Screening
3.2. Patch-Clamp Screening of Virtual Screening Hit Compounds
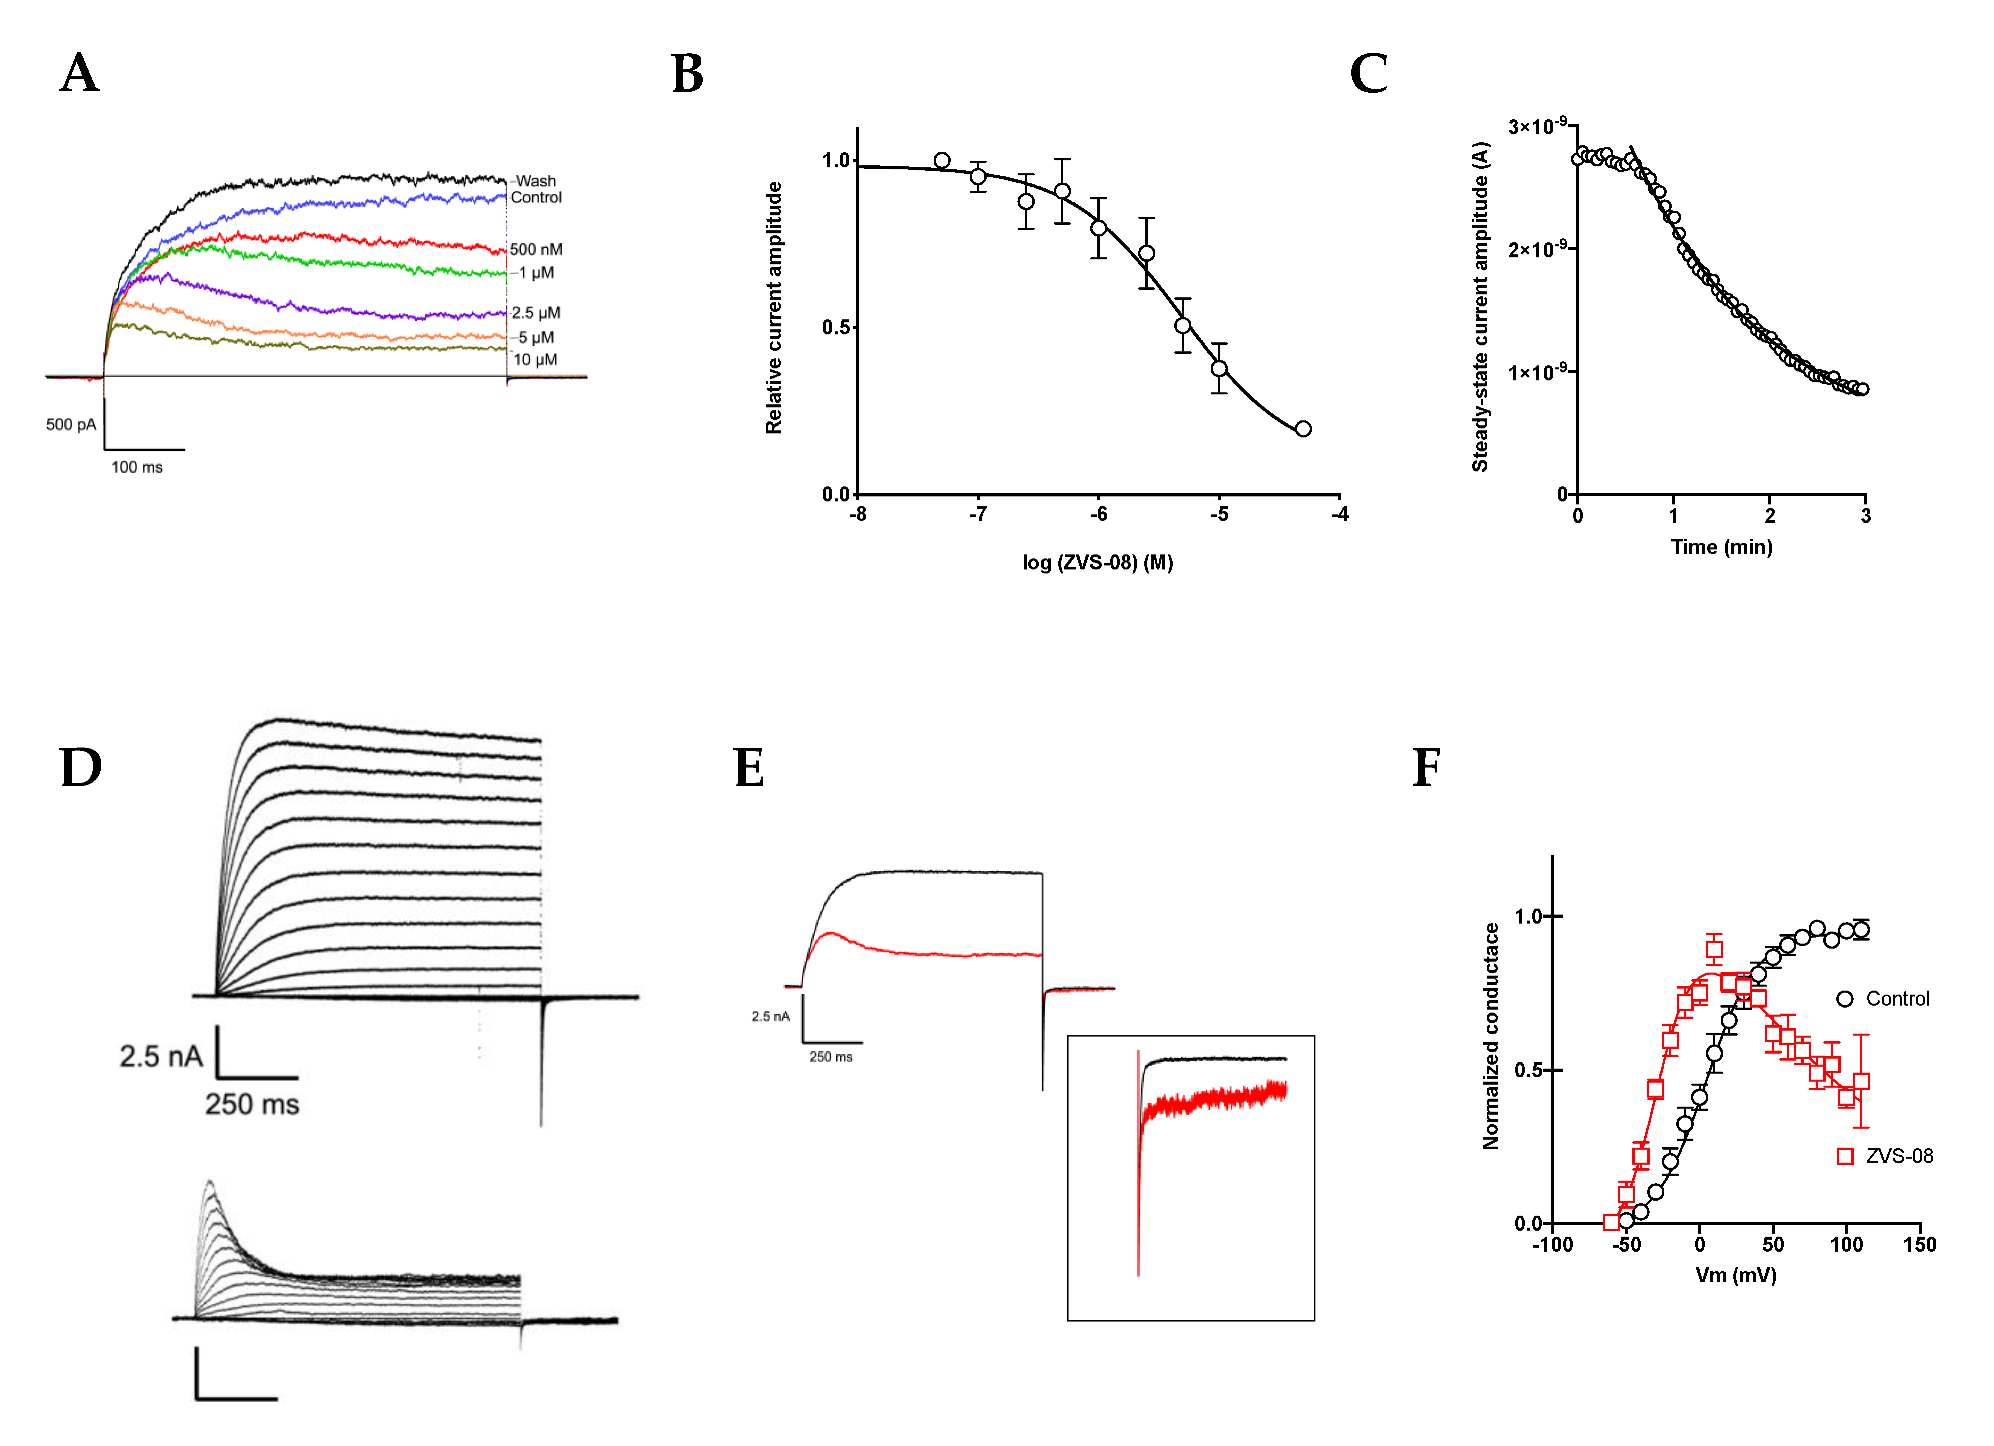
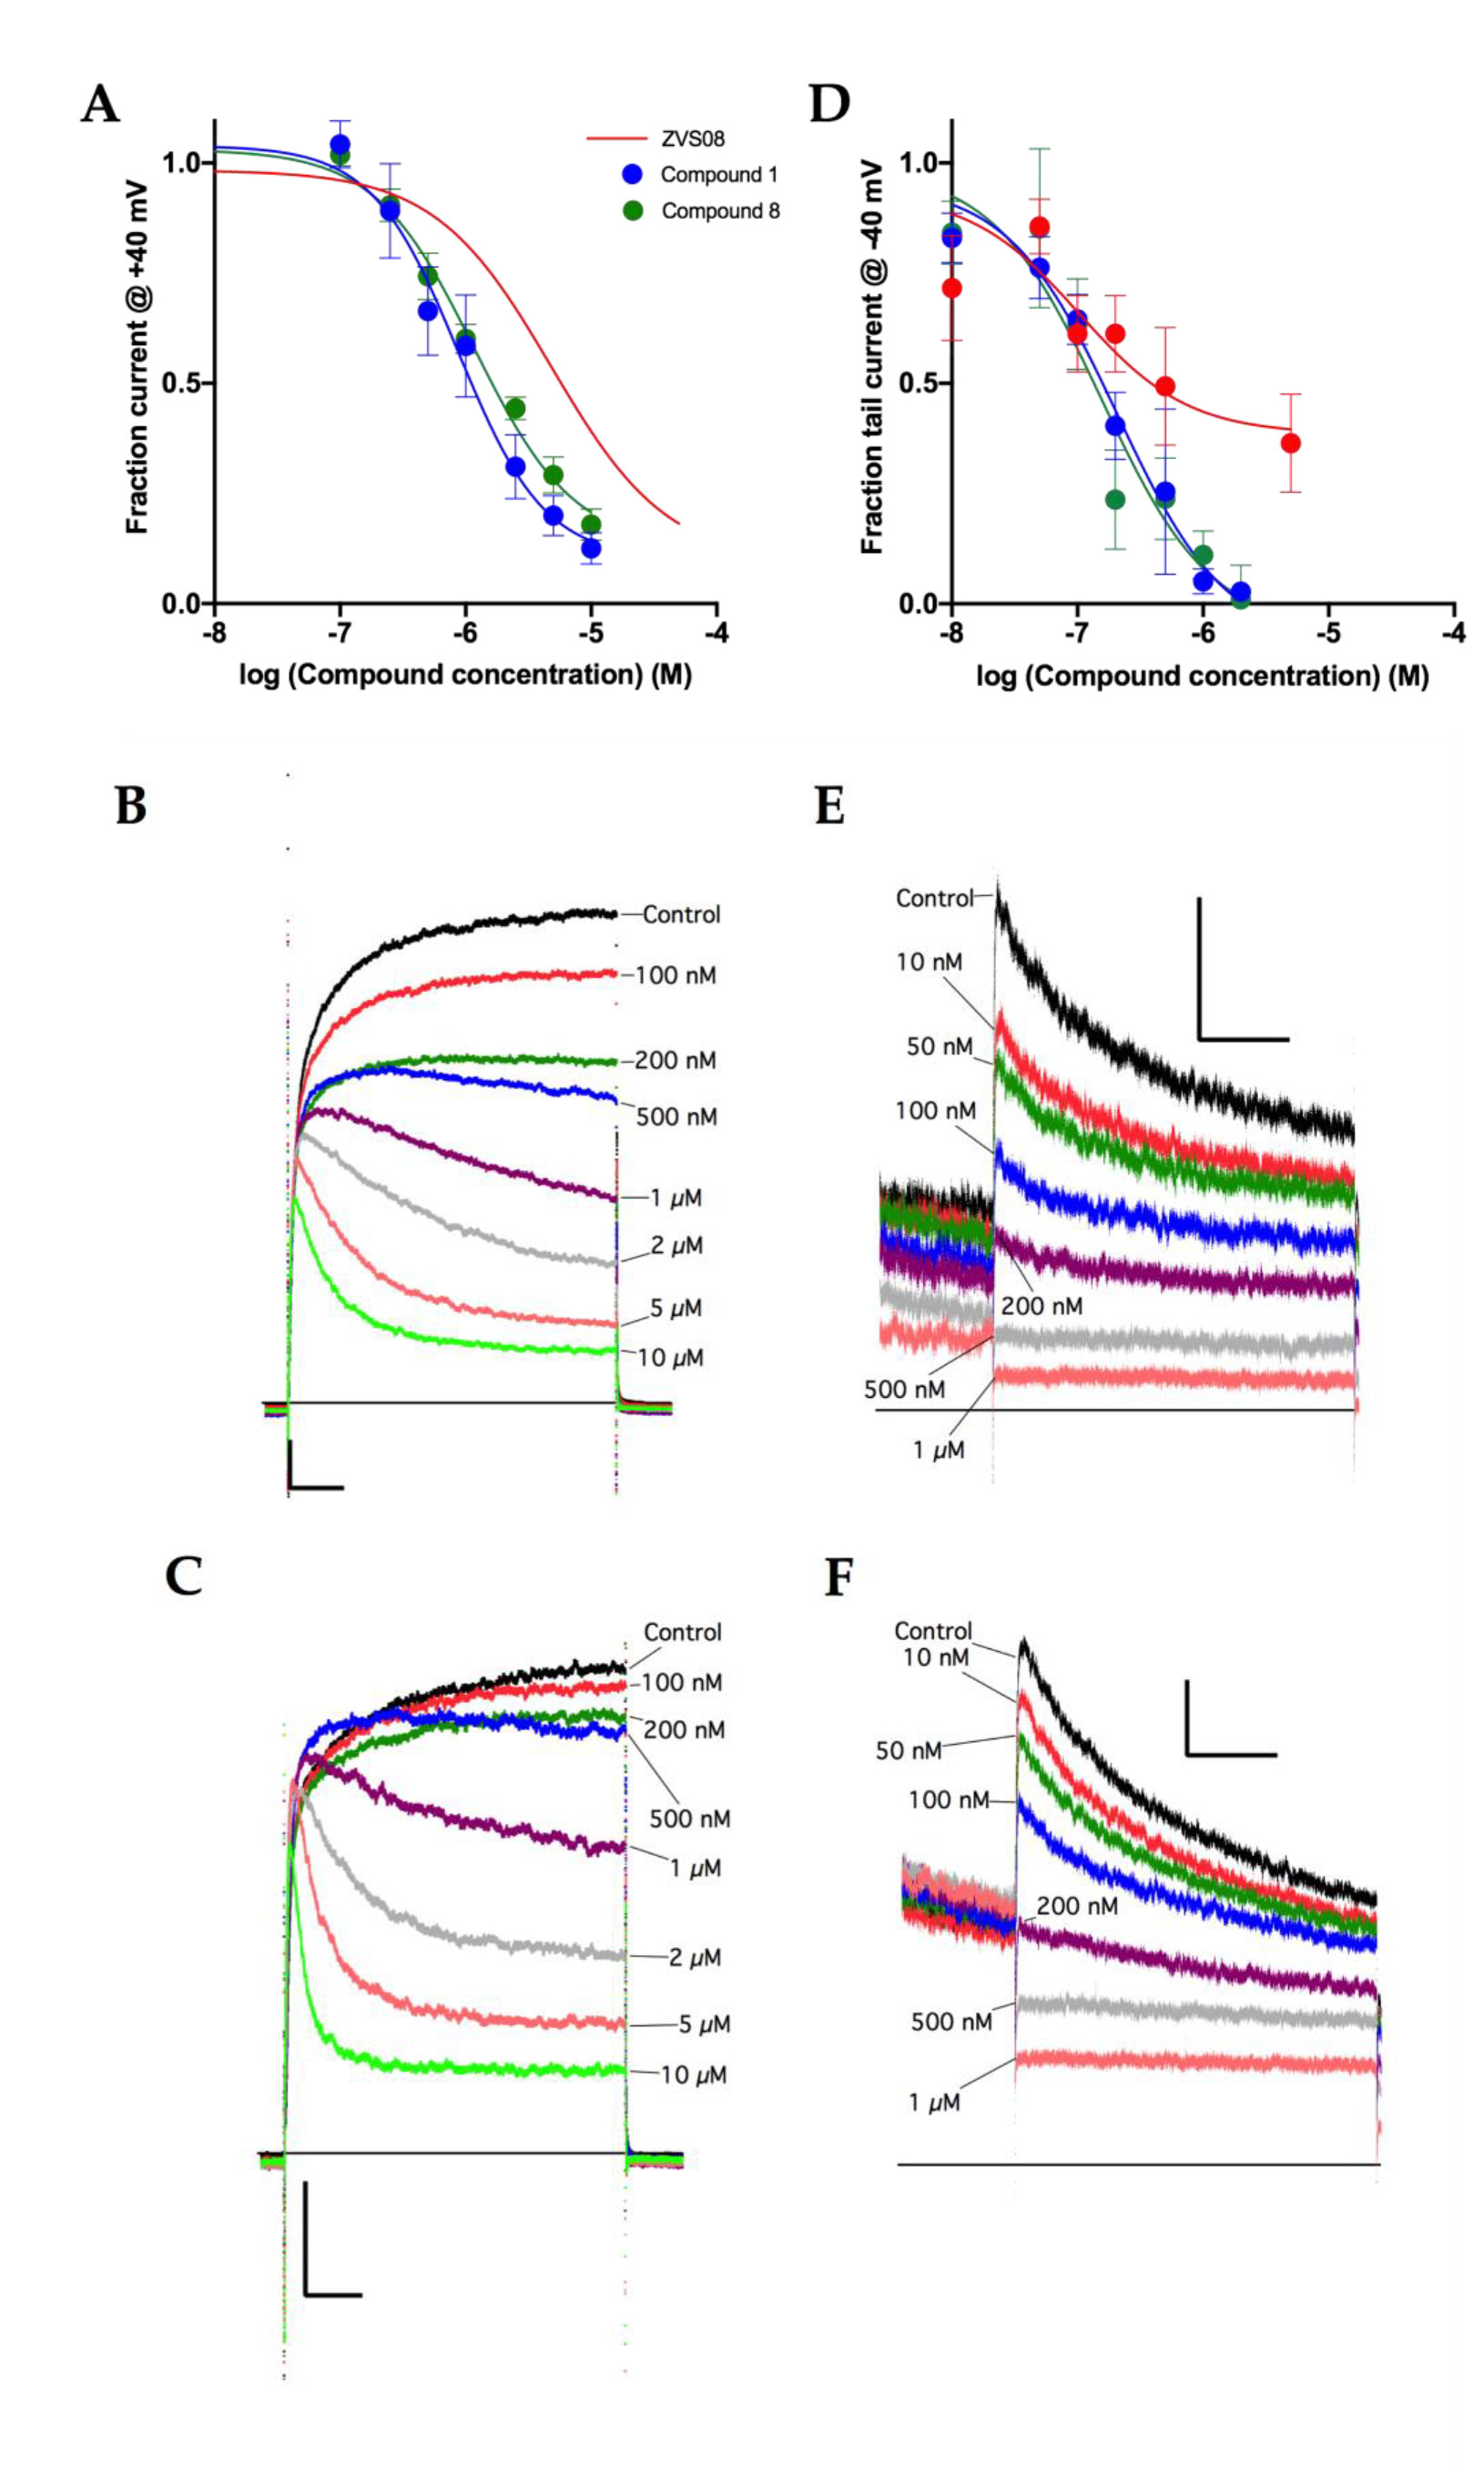
3.3. Characterisation of the KV10.1 Inhibition by ZVS-08
3.4. Analogues of the Hit Compound ZVS-08 and Structure–Activity Relationships
3.5. Selectivity of Compounds ZVS-08 and 1 against Other Voltage-Gated Ion Channels
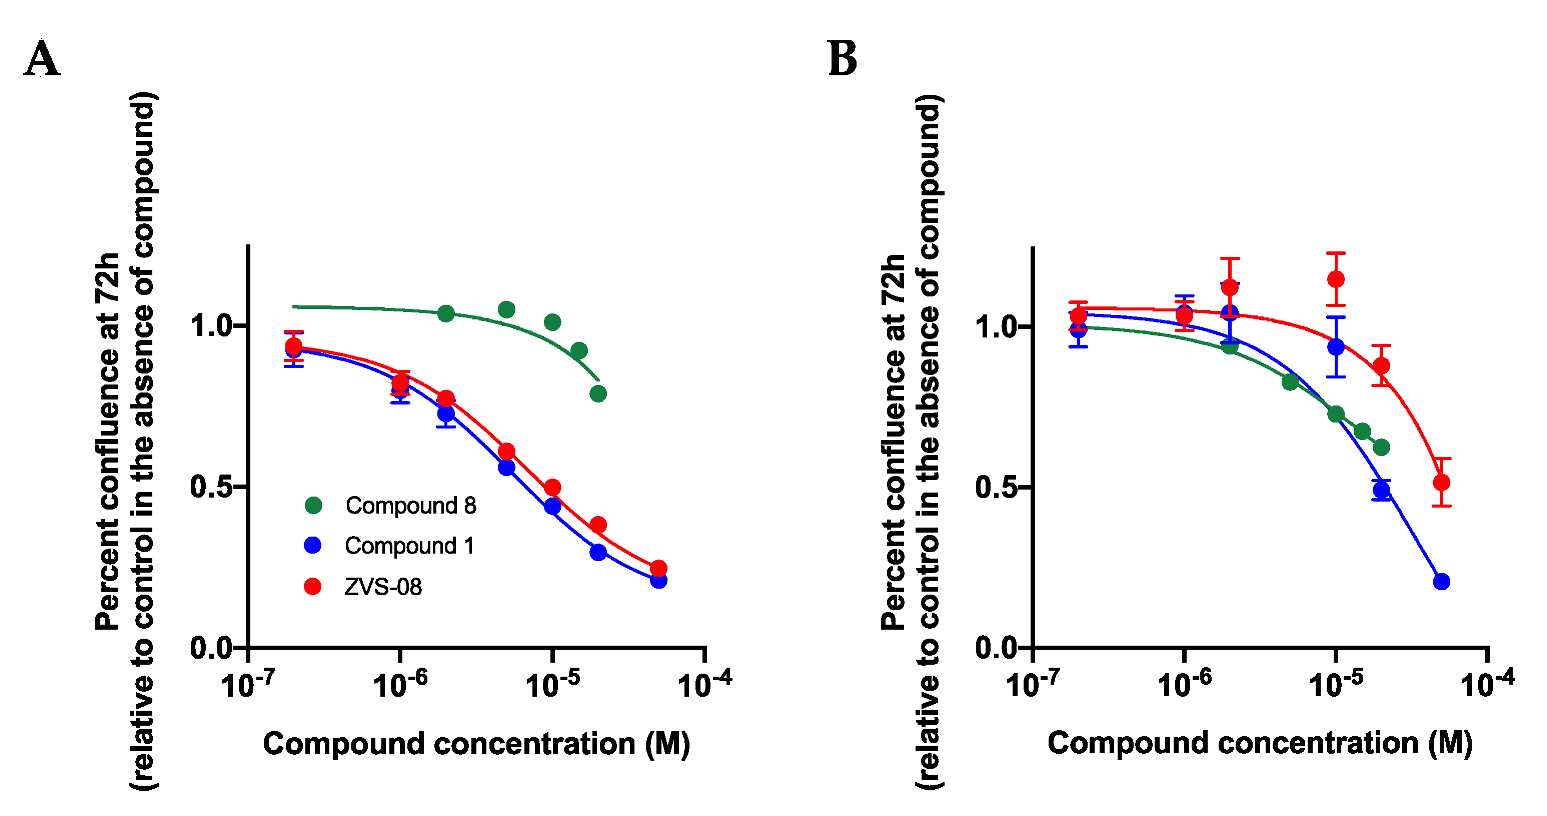
3.6. Effects on the Growth of Cell Lines in 2D Cell Culture
3.7. 3D Cell Based Assays
3.8. Mutagenic Activity of ZVS-08 and 8
4. Discussion
5. Conclusions
Supplementary Materials
Author Contributions
Funding
Institutional Review Board Statement
Informed Consent Statement
Data Availability Statement
Acknowledgments
Conflicts of Interest
References
- Lin, T.-F.; Jow, G.-M.; Fang, H.-Y.; Fu, S.-J.; Wu, H.-H.; Chiu, M.-M.; Jeng, C.-J. The Eag Domain Regulates the Voltage-Dependent Inactivation of Rat Eag1 K+ Channels. PLoS ONE 2014, 9, e110423. [Google Scholar] [CrossRef] [PubMed] [Green Version]
- Whicher, J.R.; MacKinnon, R. Structure of the Voltage-Gated K+ Channel Eag1 Reveals an Alternative Voltage Sensing Mechanism. Science 2016, 353, 664–669. [Google Scholar] [CrossRef] [PubMed] [Green Version]
- Ma, L.; Chin, Y.K.Y.; Dekan, Z.; Herzig, V.; Yuen Chow, C.; Heighway, J.; Wing Lam, S.; Guillemin, G.J.; Alewood, P.F.; King, G.F. Novel Venom-Derived Inhibitors of the Human EAG Channel, a Putative Antiepileptic Drug Target. Biochem. Pharmacol. 2018. [Google Scholar] [CrossRef] [Green Version]
- Pardo, L.A.; Gomez-Varela, D.; Major, F.; Sansuk, K.; Leurs, R.; Downie, B.R.; Tietze, L.F.; Stuhmer, W. Approaches Targeting KV10.1 Open a Novel Window for Cancer Diagnosis and Therapy. Curr. Med. Chem. 2012, 19, 675–682. [Google Scholar] [CrossRef]
- Pardo, L.A.; Stühmer, W. The Roles of K+ Channels in Cancer. Nat. Rev. Cancer 2014, 14, 39–48. [Google Scholar] [CrossRef] [PubMed]
- Movsisyan, N.; Pardo, L.A. Kv10.1 Regulates Microtubule Dynamics during Mitosis. Cancers 2020, 12, 2409. [Google Scholar] [CrossRef]
- García-Quiroz, J.; García-Becerra, R.; Santos-Martínez, N.; Barrera, D.; Ordaz-Rosado, D.; Avila, E.; Halhali, A.; Villanueva, O.; Ibarra-Sánchez, M.J.; Esparza-López, J.; et al. In Vivo Dual Targeting of the Oncogenic Ether-à-Go-Go-1 Potassium Channel by Calcitriol and Astemizole Results in Enhanced Antineoplastic Effects in Breast Tumors. BMC Cancer 2014, 14, 745. [Google Scholar] [CrossRef] [Green Version]
- Bai, Y.; Liao, H.; Liu, T.; Zeng, X.; Xiao, F.; Luo, L.; Guo, H.; Guo, L. MiR-296-3p Regulates Cell Growth and Multi-Drug Resistance of Human Glioblastoma by Targeting Ether-à-Go-Go (EAG1). Eur. J. Cancer 2013, 49, 710–724. [Google Scholar] [CrossRef]
- Wu, J.; Wu, X.; Zhong, D.; Zhai, W.; Ding, Z.; Zhou, Y. Short Hairpin Rna (ShRNA) Ether à Go-Go 1 (Eag1) Inhibition of Human Osteosarcoma Angiogenesis via VEGF/PI3K/AKT Signaling. Int. J. Mol. Sci. 2012, 13, 12573–12583. [Google Scholar] [CrossRef]
- Wang, X.; Chen, Y.; Li, J.; Guo, S.; Lin, X.; Zhang, H.; Zhan, Y.; An, H. Tetrandrine, a Novel Inhibitor of Ether-à-Go-Go-1 (Eag1), Targeted to Cervical Cancer Development. J. Cell. Physiol. 2018. [Google Scholar] [CrossRef] [PubMed]
- Gómez-Varela, D.; Zwick-Wallasch, E.; Knötgen, H.; Sánchez, A.; Hettmann, T.; Ossipov, D.; Weseloh, R.; Contreras-Jurado, C.; Rothe, M.; Stühmer, W.; et al. Monoclonal Antibody Blockade of the Human Eag1 Potassium Channel Function Exerts Antitumor Activity. Cancer Res. 2007, 67, 7343–7349. [Google Scholar] [CrossRef] [PubMed] [Green Version]
- de Queiroz, F.M.; Suarez-Kurtz, G.; Stühmer, W.; Pardo, L.A. Ether à Go-Go Potassium Channel Expression in Soft Tissue Sarcoma Patients. Mol. Cancer 2006, 5. [Google Scholar] [CrossRef] [Green Version]
- Asher, V.; Khan, R.; Warren, A.; Shaw, R.; Schalkwyk, G.V.; Bali, A.; Sowter, H.M. The Eag Potassium Channel as a New Prognostic Marker in Ovarian Cancer. Diagn. Pathol. 2010, 5, 78. [Google Scholar] [CrossRef] [Green Version]
- Martínez, R.; Stühmer, W.; Martin, S.; Schell, J.; Reichmann, A.; Rohde, V.; Pardo, L. Analysis of the Expression of Kv10.1 Potassium Channel in Patients with Brain Metastases and Glioblastoma Multiforme: Impact on Survival. BMC Cancer 2015, 15, 839. [Google Scholar] [CrossRef] [Green Version]
- Agarwal, J.R.; Griesinger, F.; Stühmer, W.; Pardo, L.A. The Potassium Channel Ether à Go-Go Is a Novel Prognostic Factor with Functional Relevance in Acute Myeloid Leukemia. Mol. Cancer 2010, 9. [Google Scholar] [CrossRef] [Green Version]
- Ding, X.-W.; Luo, H.-S.; Jin, X.; Yan, J.-J.; Ai, Y.-W. Aberrant Expression of Eag1 Potassium Channels in Gastric Cancer Patients and Cell Lines. Med. Oncol. 2007, 24, 345–350. [Google Scholar] [CrossRef]
- Menéndez, S.T.; Villaronga, M.Á.; Rodrigo, J.P.; Álvarez-Teijeiro, S.; García-Carracedo, D.; Urdinguio, R.G.; Fraga, M.F.; Pardo, L.A.; Viloria, C.G.; Suárez, C.; et al. Frequent Aberrant Expression of the Human Ether à Go-Go (HEAG1) Potassium Channel in Head and Neck Cancer: Pathobiological Mechanisms and Clinical Implications. J. Mol. Med. 2012, 90, 1173–1184. [Google Scholar] [CrossRef]
- Ousingsawat, J.; Spitzner, M.; Puntheeranurak, S.; Terracciano, L.; Tornillo, L.; Bubendorf, L.; Kunzelmann, K.; Schreiber, R. Expression of Voltage-Gated Potassium Channels in Human and Mouse Colonic Carcinoma. Clin. Cancer Res. 2007, 13, 824–831. [Google Scholar] [CrossRef] [Green Version]
- Șterbuleac, D.; Maniu, C.L. An Antiarrhythmic Agent as a Promising Lead Compound for Targeting the HEAG1 Ion Channel in Cancer Therapy: Insights from Molecular Dynamics Simulations. Chem. Biol. Drug Des. 2016, 88, 683–689. [Google Scholar] [CrossRef]
- Wang, W.; MacKinnon, R. Cryo-EM Structure of the Open Human Ether-à-Go-Go -Related K + Channel HERG. Cell 2017, 169, 422–430.e10. [Google Scholar] [CrossRef] [PubMed] [Green Version]
- The PyMOL Molecular Graphics System, version 2.3.0; Schrodinger, LLC: New York, NY, USA, 2019.
- Moreels, L.; Bhat, C.; Voráčová, M.; Peigneur, S.; Goovaerts, H.; Mäki-Lohiluoma, E.; Zahed, F.; Pardo, L.A.; Yli-Kauhaluoma, J.; Kiuru, P.; et al. Synthesis of Novel Purpurealidin Analogs and Evaluation of Their Effect on the Cancer-Relevant Potassium Channel KV10.1. PLoS ONE 2017, 12, e0188811. [Google Scholar] [CrossRef] [PubMed]
- Gómez-Lagunas, F.; Carrillo, E.; Pardo, L.A.; Stühmer, W. Gating Modulation of the Tumor-Related Kv10.1 Channel by Mibefradil. J. Cell. Physiol. 2017, 232, 2019–2032. [Google Scholar] [CrossRef] [PubMed]
- Mysinger, M.M.; Carchia, M.; Irwin; John, J.; Shoichet, B.K. Directory of Useful Decoys, Enhanced (DUD-E): Better Ligands and Decoys for Better Benchmarking. J. Med. Chem. 2012, 55, 6582–6594. [Google Scholar] [CrossRef]
- Inte:Ligand Expert KNIME Extensions Available from Inte:Ligand GmbH. Available online: http://www.Inteligand.com/knime-nodes (accessed on 10 January 2021).
- Friedrich, N.-O.; de Bruyn Kops, C.; Flachsenberg, F.; Sommer, K.; Rarey, M.; Kirchmair, J. Benchmarking Commercial Conformer Ensemble Generators. J. Chem. Inf. Model. 2017, 57, 2719–2728. [Google Scholar] [CrossRef]
- Poli, G.; Seidel, T.; Langer, T. Conformational Sampling of Small Molecules With ICon: Performance Assessment in Comparison With OMEGA. Front. Chem. 2018, 6, 229. [Google Scholar] [CrossRef]
- Boydston, A.J.; Rice, J.D.; Sanderson, M.D.; Dykhno, O.L.; Bielawski, C.W. Synthesis and Study of Bidentate Benzimidazolylidene−Group 10 Metal Complexes and Related Main-Chain Organometallic Polymers. Organometallics 2006, 25, 6087–6098. [Google Scholar] [CrossRef]
- Surry, D.S.; Buchwald, S.L. Dialkylbiaryl Phosphines in Pd-Catalyzed Amination: A User’s Guide. Chem. Sci. 2011, 2, 27–50. [Google Scholar] [CrossRef] [Green Version]
- Marx, M.A.; Vaisburg, C.A.; Christensen, J.G.; Galemmo, J. LSD1 Inhibitors. U.S. Patent US 2017/0183308A1, 29 June 2017. [Google Scholar]
- Sarkar, S.; Sonkar, R.; Bhatia, G.; Tadigoppula, N. Synthesis of New N-Acryl-1-Amino-2-Phenylethanol and N-Acyl-1-Amino-3-Aryloxypropanols and Evaluation of Their Antihyperlipidemic, LDL-Oxidation and Antioxidant Activity. Eur. J. Med. Chem. 2014, 80, 135–144. [Google Scholar] [CrossRef] [PubMed]
- Gómez-Varela, D.; Contreras-Jurado, C.; Furini, S.; García-Ferreiro, R.; Stühmer, W.; Pardo, L.A. Different Relevance of Inactivation and F468 Residue in the Mechanisms of HEag1 Channel Blockage by Astemizole, Imipramine and Dofetilide. FEBS Lett. 2006, 580, 5059–5066. [Google Scholar] [CrossRef] [PubMed] [Green Version]
- García-Ferreiro, R.E.; Kerschensteiner, D.; Major, F.; Monje, F.; Stühmer, W.; Pardo, L.A. Mechanism of Block of HEag1 K + Channels by Imipramine and Astemizole. J. Gen. Physiol. 2004, 124, 301–317. [Google Scholar] [CrossRef] [PubMed] [Green Version]
- Barros, F.; de la Peña, P.; Domínguez, P.; Sierra, L.M.; Pardo, L.A. The EAG Voltage-Dependent K+ Channel Subfamily: Similarities and Differences in Structural Organization and Gating. Front. Pharmacol. 2020, 11, 411. [Google Scholar] [CrossRef] [PubMed] [Green Version]
- Wolber, G.; Langer, T. LigandScout: 3-D Pharmacophores Derived from Protein-Bound Ligands and Their Use as Virtual Screening Filters. J. Chem. Inf. Model. 2005, 45, 160–169. [Google Scholar] [CrossRef] [PubMed]
- LigandScout v.4.3 Available from Inte:Ligand. Available online: https://www.Inteligand.com/ligandscout (accessed on 10 January 2021).
- Nepali, K.; Lee, H.-Y.; Liou, J.-P. Nitro Group Containing Drugs. J. Med. Chem. 2019, 62, 2851–2893. [Google Scholar] [CrossRef] [PubMed]
- Moreels, L. The Search for Novel Inhibitors of the Cancer-Relevant Potassium Channel Kv10.1. Ph.D. Thesis, KU Leuven, Leuven, Belgium, 2018. [Google Scholar]
- Fasano, M.; Curry, S.; Terreno, E.; Galliano, M.; Fanali, G.; Narciso, P.; Notari, S.; Ascenzi, P. The Extraordinary Ligand Binding Properties of Human Serum Albumin. IUBMB Life 2005, 57, 787–796. [Google Scholar] [CrossRef] [PubMed]
- Maron, D.M.; Ames, B.N. Revised Methods for the Salmonella Mutagenicity Test. Mutat. Res. Mutagen. Relat. Subj. 1983, 113, 173–215. [Google Scholar] [CrossRef]


| Compound ID | Structure | Pharmacophore Fit Score | Effect on Kv10.1 (% Inhibition) |
|---|---|---|---|
| ZVS-01 | 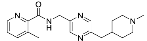 | 66.4900 | −1.13 ± 4.50 (3) |
| ZVS-02 | 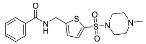 | 66.4745 | 5.03 ± 2.87 (3) |
| ZVS-03 |  | 66.4421 | −1.14 ± 3.47 (5) |
| ZVS-04 | 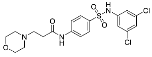 | 66.0596 | −0.86 ± 0.75 (5) |
| ZVS-05 | 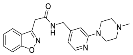 | 65.9545 | 8.84 ± 4.92 (6) |
| ZVS-06 | 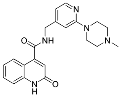 | 65.8501 | −7.50 ± 4.65 (4) |
| ZVS-07 | 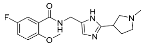 | 65.8019 | 4.68 ± 1.63 (5) |
| ZVS-08 |  | 65.7908 | 80.27 ± 0.63 (3) |
| ZVS-09 | 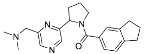 | 65.1035 | 0.15 ± 1.67 (4) |
| Compound ID | IC50 Kv10.1 (μM) | IC50 hERG (μM) |
|---|---|---|
| ZVS-08 | 3.70 µM (95% CI: 2.08 µM to 6.47 µM) | 0.194 µM (95% CI: 0.047 µM to 0.761 µM) |
| 1 | 0.740 µM (95% CI: 490 nM to 1.17 µM) | 0.207 µM (95% CI: 0.113 µM to 0.395 µM) |
| 8 | 1.01 µM (95% CI: 796 nM to 1.30 µM | 0.156 µM (95% CI: 0.070 µM to 0.373 µM) |
| Compound ID | Structure | % of Kv10.1 Inhibition at 10 μM |
|---|---|---|
| 1 | 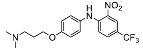 | 87.32 ± 4.60 (7) |
| 2 |  | 23.93 ± 26.80 (4) |
| 3 |  | 22.08 ± 33.52 (4) |
| 4 | 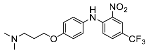 | 36.63 ± 19.89 (7) |
| 5 | 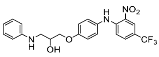 | 2.53 ± 11.73 (3) |
| 6 |  | 57.48 ± 28.38 (3) |
| 7 |  | 20.96 ± 30.27 (7) |
| 8 | 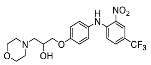 | 81.20 ± 4.97 (3) |
| 9 | 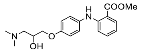 | 2.00 ± 7.45 (4) |
| 10 |  | 57.05 ± 21.71 (2) |
| 11 | 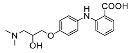 | 37.67 ± 7.13 (2) |
| 12 | 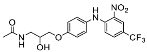 | 16.60 ± 38.36 (2) |
Publisher’s Note: MDPI stays neutral with regard to jurisdictional claims in published maps and institutional affiliations. |
© 2021 by the authors. Licensee MDPI, Basel, Switzerland. This article is an open access article distributed under the terms and conditions of the Creative Commons Attribution (CC BY) license (http://creativecommons.org/licenses/by/4.0/).
Share and Cite
Toplak, Ž.; Hendrickx, L.A.; Gubič, Š.; Možina, Š.; Žegura, B.; Štern, A.; Novak, M.; Shi, X.; Peigneur, S.; Tytgat, J.; et al. 3D Pharmacophore-Based Discovery of Novel KV10.1 Inhibitors with Antiproliferative Activity. Cancers 2021, 13, 1244. https://doi.org/10.3390/cancers13061244
Toplak Ž, Hendrickx LA, Gubič Š, Možina Š, Žegura B, Štern A, Novak M, Shi X, Peigneur S, Tytgat J, et al. 3D Pharmacophore-Based Discovery of Novel KV10.1 Inhibitors with Antiproliferative Activity. Cancers. 2021; 13(6):1244. https://doi.org/10.3390/cancers13061244
Chicago/Turabian StyleToplak, Žan, Louise Antonia Hendrickx, Špela Gubič, Štefan Možina, Bojana Žegura, Alja Štern, Matjaž Novak, Xiaoyi Shi, Steve Peigneur, Jan Tytgat, and et al. 2021. "3D Pharmacophore-Based Discovery of Novel KV10.1 Inhibitors with Antiproliferative Activity" Cancers 13, no. 6: 1244. https://doi.org/10.3390/cancers13061244