Simple Summary
When cells undergo epithelial–mesenchymal transition (EMT) they gain characteristics of stem cells. We investigated the mechanism by which the EMT transcription factor SNAI1 induces stem cell features. In these studies, we observed that SNAI1 represses a microRNA that maintains differentiation, let-7. This microRNA is lost in cancer, and its loss correlates with poor prognosis. In breast, pancreatic, and ovarian cancer cell lines the cell stemness in increased by SNAI1 overexpression and reduced by SNAI1 knockdown. We extended the ovarian cancer results to patient-derived cells, and to a mouse xenograft model. In mice, we used nanoparticles to deliver small RNAs (RNAi) targeting SNAI1, resulting in restoration of let-7 levels, inhibition of stemness, and reduced tumor burden. Our studies validate nanoparticle-delivered RNAi targeting SNAI1 as a clinically relevant approach.
Abstract
We aimed to determine the mechanism of epithelial–mesenchymal transition (EMT)-induced stemness in cancer cells. Cancer relapse and metastasis are caused by rare stem-like cells within tumors. Studies of stem cell reprogramming have linked let-7 repression and acquisition of stemness with the EMT factor, SNAI1. The mechanisms for the loss of let-7 in cancer cells are incompletely understood. In four carcinoma cell lines from breast cancer, pancreatic cancer, and ovarian cancer and in ovarian cancer patient-derived cells, we analyzed stem cell phenotype and tumor growth via mRNA, miRNA, and protein expression, spheroid formation, and growth in patient-derived xenografts. We show that treatment with EMT-promoting growth factors or SNAI1 overexpression increased stemness and reduced let-7 expression, while SNAI1 knockdown reduced stemness and restored let-7 expression. Rescue experiments demonstrate that the pro-stemness effects of SNAI1 are mediated via let-7. In vivo, nanoparticle-delivered siRNA successfully knocked down SNAI1 in orthotopic patient-derived xenografts, accompanied by reduced stemness and increased let-7 expression, and reduced tumor burden. Chromatin immunoprecipitation demonstrated that SNAI1 binds the promoters of various let-7 family members, and luciferase assays revealed that SNAI1 represses let-7 transcription. In conclusion, the SNAI1/let-7 axis is an important component of stemness pathways in cancer cells, and this study provides a rationale for future work examining this axis as a potential target for cancer stem cell-specific therapies.
1. Introduction
Cancer stem-like cells (CSC) are the subpopulation of tumor cells responsible for long-term maintenance of tumors. These cells are capable of self-renewal and differentiation, making them an important contributor to tumor recurrence [1]. The origin of CSC is not completely understood. In some cancers, normal tissue stem cells appear to be altered to result in CSC [1,2,3,4], while in others, somatic cells appear to be reprogrammed to the stem cell fate [5,6,7]. Whether the cells of origin in carcinomas are tissue resident stem cells or reprogrammed somatic cells, some aspects of the process by which CSC attain stem cell features are comparable to somatic cell reprogramming [4,7,8,9]. In somatic cell reprogramming, cells lose their differentiated characteristics and take on an embryonic or stem cell phenotype. Similarly, stem cells in tumors dedifferentiate and express genes consistent with the oncofetal state [10,11,12].
An important factor in maintenance of the differentiated state is the tumor suppressor miRNA let-7. Let-7, consisting in humans of nine highly conserved members in eight chromosomal locations, plays crucial roles in differentiation [13]. Because the individual family members’ seed sequence is identical, and the remaining sequence is different at only 1–3 residues, this miRNA family is generally presented as having redundant roles [13]. In pluripotent cells and germ cells, miRNA let-7 expression is low, while differentiated cells uniformly express high levels [14]. Factors required for stemness (a property referring to a cell’s ability to self-renew and differentiate [3]) are inhibited by let-7 [15]. Loss of let-7 is thus necessary for the stem cell state, either in reprogramming or in cancer [13,16,17]. Let-7 represses a set of embryonic genes and oncogenes, and its loss allows upregulation of those genes, resulting in the oncofetal state [13,14,15,16]. Replacing let-7 reduces the stem cell population and reduces resistance to chemotherapy [18]. These data strongly implicate let-7 as a key regulator of the CSC phenotype.
Let-7 is frequently reduced in many types of cancer [13]. Let-7 loss correlates with poor prognosis, functions as a biomarker for less differentiated cancer [13,19,20,21], and predicts tumor growth and metastasis [22]. Mechanisms for its loss are incompletely understood. miRNAs are regulated transcriptionally, epigenetically, and post-transcriptionally [23]. The pluripotency-associated factor LIN28 blocks let-7 biogenesis by inhibiting its processing to the mature form, but LIN28 is downregulated in differentiated cells [20]. In addition to the post-transcriptional regulation of let-7 by Lin28, transcriptional regulation of this miRNA family is an important factor in determining overall levels [23]. Several factors have been shown to regulate let-7 transcription, including the epithelial–mesenchymal transition (EMT) transcription factor TWIST1, TP53, MYC, BMI1, NFKB1, and CEBPA [18]. We set out to study let-7 regulation at the transcriptional level, because of evidence for its importance in dedifferentiation [17] and potential influence on the metastatic disease course.
EMT is a fundamental process for development and homeostasis whereby epithelial cells lose their cell polarity and cell–cell adhesion, and gain the migratory and invasive features typical of mesenchymal cells [21]. The aberrant activation of EMT is considered to be a hallmark of cancer metastasis [21,24,25]. Many studies have found that EMT is not an all-or-none response; instead, it is a multi-step process, with cells existing in states ranging from fully epithelial to fully mesenchymal. Cells are observed in several intermediate or partial (hybrid) EMT states [25]. In fact, cancer cells that undergo partial EMT (cells without complete loss of epithelial morphology or complete acquisition of mesenchymal morphology) have been reported to pose a higher metastatic risk [26,27]. Besides metastasis, cancer cells that undergo EMT demonstrate enhanced stemness, including tumor initiation ability and capacity to differentiate to multiple lineages [2,28,29]. The subpopulation within cancer cells with higher stemness has been shown to contribute to the tumor’s invasiveness and resistance to therapies [30,31]. A theoretical framework has linked EMT to stemness via cross-regulation of let-7, LIN28, and the miRNA-200 family [32]. However, few specific mechanistic studies show the molecular connections between EMT transcription factors and loss of the differentiated state. Yang et al. reported direct repression of let-7i by TWIST1 [33], leading us to ask whether another EMT transcription factor, SNAI1, plays a similar role. Hence, targeting stem-like cancer cells via EMT may be a crucial step to improve patient outcome.
Much evidence connects EMT with the acquisition of stem cell properties. Cells that have undergone EMT acquire the ability to differentiate to multiple lineages [28]. The expression of EMT transcription factors SNAI1, SNAI2, TWIST1, or ZEB1 results in an increase in the proportion of cells with stem cell properties [29,34,35,36]. Recent work demonstrates that SNAI1 expression locks cells in the hybrid state [37], and there is a computational report of SNAI2 stabilizing the hybrid state as well [38]. Hence, cells with hybrid EMT properties have high likelihood of gaining stemness [32,37]. SNAI1′s transcription factor roles include repression of epithelial factors such as CDH1, stimulation of mesenchymal factors, and repression of miRNAs such as miR-34 [21,39]. We chose to focus on the EMT factor SNAI1 because of its role in reprogramming somatic cells to pluripotency [17,40] and in cancer stemness [29,35,41].
Furthermore, SNAI1 interacts with the miRNA of interest—let-7. It binds let-7 family promoters and its early upregulation in reprogramming correlates with loss of let-7 [17]. Because the increase of SNAI1 and the decrease of let-7 occurred at time points in reprogramming prior to upregulation of LIN28, we hypothesized that it might be the loss of let-7, rather than the gain of LIN28, that destabilized the differentiated state. In the studies presented here, we asked whether these reprogramming principles applied in cancer: Does expression of SNAI1 lead to loss of let-7 and gain of stemness?
A promising approach targeting genes, such as EMT transcription factors, includes a suitable antisense oligonucleotide strategy. However, technical challenges for such techniques include avoiding degradation by ubiquitous nucleases, preventing immune activation, and allowing extravasation and cellular uptake by targeted cells [42]. Poor cytoplasmic delivery of RNA therapeutics to appropriate cells has inhibited research progress, but our team has optimized a targeted nanoparticle delivery method to deliver RNAis to tumors [43]. Mesoporous silica nanoparticles (MSN) are small (50–200 nm), but have relatively large surface area due to their pore structure [44]. Coating them with cationic polyethylenimine (PEI) facilitates loading of siRNA cargo, and conjugation with hyaluronic acid (HA) assists delivery to target cells [45,46]: HA is the ligand for CD44, enriched on the surface of ovarian cancer stem cells [47].
In this study, we hypothesized that SNAI1 directly represses miRNA let-7 transcription, and that SNAI1 knockdown would result in restoration of let-7 expression and reduction of stemness and tumor growth. Using breast, pancreatic, and ovarian cancer cells, transforming growth factor beta-1 (TGFB1) or epidermal growth factor (EGF) treatment or SNAI1 overexpression increased stemness and reduced let-7 expression, while SNAI1 knockdown reduced stemness and increased let-7 expression. We demonstrate on the molecular level that SNAI1 binds promoters of let-7 family members in cancer cells. Luciferase assays demonstrate that the presence of SNAI1 reduces let-7 transcription, consistent with direct repression of let-7 by SNAI1. Thus, one mechanism by which EMT promotes stemness is via loss of let-7, destabilizing the differentiated state. With the utilization of the orthotopic patient-derived xenograft (PDX) murine models of high grade serous ovarian carcinoma (HGSOC), we demonstrate feasibility of in vivo SNAI1 knockdown by delivering siRNA with mesoporous silica nanoparticles. In orthotopic PDX, SNAI1 knockdown results in increased let-7 levels and reduced tumor growth.
2. Materials and Methods
2.1. Cell Cultures
The human HGSOC cell line OVSAHO (RRID:CVCL_3114) was the kind gift of Gottfried Konecny (University of California, Los Angeles, CA, USA), and OVCAR8 (RRID:CVCL_1629) was from Carlotta Glackin (City of Hope, Duarte, CA, USA). HEK293T (RRID:CVCL_0063), PANC-1 (RRID:CVCL_0480) (gift of Nathan Wall, Loma Linda University (LLU), Loma Linda, CA USA), MCF-7 (RRID:CVCL_0031) (gift of Eileen Brantley, LLU), OVSAHO and OVCAR8 cells were cultured in Dulbecco’s Modification of Eagle’s Medium (DMEM, GenClone, San Diego, CA, USA) with 10% fetal bovine serum (FBS, Omega Scientific, Tarzana, CA, USA), 2 mM of L-Glutamine, 100 U/mL of penicillin, and 10 µg/mL of streptomycin. NCCIT (RRID:CVCL_1451), used as a positive control for expression of pluripotency factors, was cultured in RPMI with 10% FBS, 2 mM L-Glutamine, 1 mM sodium pyruvate, 100 U/mL of penicillin, and 10 µg/mL of streptomycin. MCF-7 and PANC-1 cells were treated with TGFB1 (10 ng/mL), OVCAR8 and OVSAHO cells were treated with EGF (100 ng/mL). PDX6, a HGSOC chemotherapy naïve sample, was obtained as described [22]. Deidentified fresh ovarian cancer ascites samples was provided by the LLU Biospecimen Laboratory and were processed by centrifuging. Erythrocytes were removed by overlaying a cell suspension on a 3 mL Ficoll gradient. Cells were initially engrafted into NSG mice subcutaneously in the region of the mammary fat pad, resulting in PDX. Patient-derived samples were cultured in three parts Ham’s F12 and one part DMEM, supplemented with 5% FBS, 10 µM insulin, 0.4 µM hydrocortisone, 2 µg/mL isoprenaline, 24 µg/mL adenine, 100 U/mL of penicillin, and 10 µg/mL streptomycin. 5–10 µM Y27632 was added to establish growth in vitro [48]. Low passage (maximal passage number: 15) patient-derived cells were used to avoid changes induced by extensive passaging in in vitro culture. All human cell lines have been authenticated using STR profiling within the last three years. All experiments were performed with mycoplasma-free cells.
2.2. Institutional Review Board (IRB) Statement:
All subjects gave their informed consent before participation in the study. All studies were approved by the Loma Linda University (LLU) IRB (#58238, approved 24 January 2018). Investigations were carried out following the rules of the Declaration of Helsinki of 1975.
2.3. Reverse-transcription Quantitative PCR (RT-qPCR)
Total RNA from cell culture samples was isolated using TRIzol reagent (Life Technologies, Carlsbad, CA, USA) according to the manufacturer’s instructions. For mRNA expression analysis, cDNA was synthesized with 1 µg of total RNA using Maxima First Strand cDNA Synthesis Kit (K1672; Thermo Fisher scientific, Grand Island, NY, USA). Real-time RT-qPCR for mRNA was performed using PowerUP SYBR Green master mix (Thermo Fisher scientific, Grand Island, NY, USA) and specific primers on a Stratagene Mx3005P instrument (Agilent Technology, Santa Clara, CA, USA). Primer sequences are listed in Table S2. For miRNA expression analysis, cDNA was synthesized with 100 ng of total RNA using specific stem-loop RT primers and TaqMan microRNA Reverse Transcription Kit (Applied Biosystems, Foster City, CA, USA). Real-time RT-qPCR for miRNA was performed using TaqMan Universal PCR Master Mix II (Applied Biosystems, Foster City, CA, USA) with specific probes (Life Technologies 4440887 assay numbers 000377 (let-a), 002406 (let-7e), 002282 (let-7g), 002221 (let-7i), U47 (001223)) on a Stratagene Mx3005P instrument (Agilent Technology, Santa Clara, CA, USA). The results were analyzed using the cycles to threshold (Ct) method; ACTB (mRNA) and U47 (miRNA) were used for normalization.
2.4. Western Blot
Proteins were extracted from cells in PBS by adding SDS sample buffer (2% SDS, 2.5% beta-mercaptoethanol, 7.5% glycerol) and then sonicated for 10–15 s. Thirty microliters of lysate per sample (2.4 × 10⁵ cells) were heated to 100 °C for 5 min and then loaded on SDS-PAGE gel (4–12%). After running at 150 V for 20–40 min, samples were transferred to PVDF membrane. Membranes were incubated in 5% milk for blocking for 1 h at room temperature. After blocking and washing with 1X TBST, membranes were incubated in primary antibodies diluted at the appropriate dilution (as suggested by manufacturer data sheets) over night at 4 °C. Antibodies used include: HMGA2 (D1A7, Cell Signaling Technology, Danvers, MA, USA), SNAI1 (L70G2; Cell Signaling Technology, Danvers, MA, USA), α/β-TUBULIN (2148S; Cell Signaling Technology, Danvers, MA, USA), LIN28A (A177; Cell Signaling Technology, Danvers, MA, USA). Secondary antibody incubations were done with an anti-mouse IgG conjugated with DyLight 800 (SA5-10176; Invitrogen, Carlsbad, CA, USA) or anti-rabbit IgG antibody conjugated with DyLight 680 (35569; Invitrogen, Carlsbad, CA, USA) at 1/30,000 for 1 h at room temperature. Immunoblots were scanned and visualized using Odyssey Infrared Imaging System (LI-COR Biosciences, Lincoln, NE, USA). Densitometry was performed on scanned immunoblots by ImageJ software (National Institutes of Health, Bethesda, MD, USA). Quantification of Western blot data was done by measuring the intensity of bands of the protein of interest divided by the intensity of the samples’ own α/β-TUBULIN bands (ImageJ). All uncropped Western blot figures can be found in Figure S12.
2.5. Retroviral Overexpression
The cDNA of human SNAI1 was subcloned from Flag-Snail WT (Addgene 16218, Watertown, MA, USA) into pWZL-Blast-GFP (Addgene 12269) after removing GFP using BamH1/Xho1. Retroviral particles were produced in HEK293T cells after co-transfection of retrovirus plasmid vector pWZL-Blast-Flag-Snail or control vector pWZL-Blast-Flag-Empty with packaging plasmids (VSVG, Gag/pol) using polyethylenimine (PEI) (Polysciences, Warrington, PA, USA). After 48 h and 72 h, supernatant containing virus was collected and filtered through a 0.22 μM filter. Supernatants were used for cell transduction or stored at −80 °C. Cells were transduced with retrovirus in the presence of 6 μg/mL protamine sulfate and selected with 5 µg/mL Blasticidin (InvivoGen #ant-bl-05 San Diego, CA, USA) for 5 days.
2.6. DsiRNA-Mediated Knockdown
A panel of dicer-substrate small inhibitory RNAs (DsiRNA, Integrated DNA Technologies (IDT), Coralville, IA, USA) were screened for SNAI1 knockdown (Figure S3). HA-conjugated, PEI-coated MSNs were synthesized as described [45]. Briefly, MSNs were produced using the sol-gel method, dissolving 250 mg cetyltrimethylammonium bromide in 120 mL water with 875 µL of 2 M sodium hydroxide solution. Next, 1.2 mL tetraethylorthosilicate was added, stirred for 2 h, allowing formation of MSN. Particles were collected by centrifugation and washed with methanol and acidic methanol. Low molecular weight cationic PEI (1.8 kDa branched polymer) was electrostatically attached to the MSN surface to provide a positive charge to attract negatively charged siRNA [45], and HA was covalently bound to the amine groups in the PEI using EDC-NHS coupling reaction [49]. DsiRNA targeting SNAI1 or control (oligonucleotide sequence listed in Table S4) were used for knockdown in vitro, loaded on MSN as described [43]. To complex siRNA for in vitro experiments, 10 μL siRNA at 10 μM was mixed with 70 μL MSNs at 500 μg/mL and 20 μL water, and the mixture was incubated overnight at 4 °C on a rotor. The following day, 100 μL of the HA-MSN-siRNA complexes were added to each well of a 6-well plate containing 1900 μL normal medium. To complex siRNA for in vivo experiments, 15 μL siRNA at 10 μM was mixed with 105 μL HA-MSNs at 500 μg/mL, and the mixture was incubated overnight at 4 °C on a rotor. The following day, 120 μL of the HA-MSN-siRNA complexes were injected intravenously (tail vein). For in vivo experiments, HA-MSN-siRNA were injected twice weekly.
2.7. Mimic Transfection
Let-7i mimics (sense: 5′-mCmArGmCrAmCrAmArAmCrUmArCmUrAmCrCmUrCA-3′; antisense 5′-/5Phos/rUrGrArGrGrUrArGrUrArGrUrUrUrGrUrGrCrUmGmUrU-3′) and scrambled control mimics (sense 5′-mCmArUmArUmUrGmCrGmCrGmUrAmUrAmGrUmCrGC-3′; antisense5′-/5Phos/rGrCrGrArCrUrArUrArCrGrCrGrCrArArUrArUmGmG rU-3′; IDT) were reverse transfected at 2 nM using Lipofectamine RNAiMax (Life Technologies) according to manufacturer guidelines.
2.8. Chromatin Immunoprecipitation (ChIP)
ChIP assay was conducted using MAGnify™ Chromatin Immunoprecipitation System (Thermo Fisher Scientific, #49-2024, Grand Island, NY, USA) according to manufacturer directions. Untreated OVCAR8, OVSAHO, MCF-7 cells with or without 10 ng/mL of TGFB1 were crosslinked with 1% formaldehyde. 1.25 M glycine in cold PBS were then added to stop the crosslinking reaction. Cell lysates were prepared with lysis buffer with protease inhibitors (50 μL per 1 million cells). Chromatin was then sheared into 200–500-bp fragments using Sonic Dismembrator Model F60 With Probe (Thermo Fisher Scientific, Grand Island, NY, USA). Each immunoprecipitation (IP) reaction contains 100,000 cells. Dynabeads® (Thermo Fisher Scientific, Grand Island, NY, USA) were coupled with anti-Snail (L70G2; Cell Signaling Technology, Danvers, MA, USA) or Mouse IgG (supplied in MAGnify kit) as negative controls (1 μg per CHIP). After 1 h on a rotor, these antibody-Dynabeads® complexes were incubated with chromatin and put on rotor for 2 h at 4 °C. As input control, 10 μL of diluted chromatin were put aside without binding to the antibody-Dynabeads® complexes. After chromatin-antibody-Dynabeads® complexes were washed with IP buffer to remove unbound chromatin. Reverse Crosslinking buffer was added to reverse the formaldehyde crosslinking. Real-time RT-qPCR for DNA was performed using PowerUP SYBR Green master mix (Thermo Fisher Scientific, Grand Island, NY, USA) and specific primers on a Stratagene Mx3005P instrument (Agilent Technology, Santa Clara, CA, USA). Primer sequences are listed in Table S3. The results were analyzed using the ΔΔ cycles to threshold (ΔΔCt) method; ACTB was used for normalization.
2.9. Luciferase Assays
HEK293T cells were plated at 50,000 cells per well. Twenty-four hours later PEI reagent was used to transfect cells with 200 ng full length let-7, truncated let-7i (lucB), or mutated let-7i (mlucB) promoter luciferase vector in combination with 5 ng Renilla luciferase, and 200 ng SNAI1-expressing or empty vector (Addgene 16218). Forty-eight hours post transfection (or twenty-four hours for promoter truncation/mutation) dual-luciferase reporter assay kit (Promega, San Luis Obispo, CA, USA) was used to analyze bioluminescence on SpectraMax i3x microplate reader (Molecular Devices, Sunnyvale, CA, USA). Let-7a1df1 promoter luciferase was a kind gift from Dr. Zifeng Wang [50], let-7a3 from Dr. Hillary Coller [51], Let-7c from Dr. Maria Rizzo [52,53], full length let-7i from Dr. Steve O’Hara [54], and truncated (lucB)/mutated (mlucB) let-7i from Dr. Muh-Hwa Yang [33].
2.10. Spheroid Formation Assay
Cells were plated at a density of 10,000 cells/mL (12,000 cells/mL for PDX6 cells) in non-tissue culture coated plates, 10 technical replicates per condition, and maintained in serum-free medium (DMEM/F12 50/50) supplemented with 0.4% bovine serum albumin, 10 ng/mL FGF, 20 ng/mL EGF, 6.7 ng/mL selenium, 5.5 µg/mL transferrin, 10 µg/mL insulin, and 1% knock out serum replacement (Gibco/Thermo Fisher Scientific) for 7 days. Secondary spheroid assays were done by harvesting after seven days, trypsinization, and re-seeding at 10,000 cells/mL, followed by seven additional days of growth. To determine the number and size of spheroids, phase contrast images of spheroids taken on a Nikon Eclipse Ti microscope were analyzed using ImageJ software (National Institutes of Health, Bethesda, MD, USA).
2.11. Mice
All animal procedures were conducted according to animal care guidelines approved by the Institutional Animal Care and Use Committee at Loma Linda University (IACUC #8170044, 9 November 2017). Orthotopic PDX experiments were carried out in nude mice (nu/nu), obtained from Jackson Laboratory (Sacramento, CA, USA), which were housed in specific pathogen-free conditions, and were used for xenografts at 6–10 weeks of age.
2.12. Orthotopic Xenograft Model and Live Animal Imaging
To allow in vivo visualization, PDX6 cells were transduced with a CMV-p:EGFP-ffluc pHIV7 lentiviral vector (eGFP-ffluc, kind gift of Christine Brown, City of Hope, Duarte, CA USA) [55], which encodes a fusion protein of GFP and firefly luciferase. The eGFP-ffluc-transduced PDX6 cells were selectively isolated based on GFP expression via FACSAria cell sorter (BD Biosciences, San Jose, CA, USA). PDX6 cells were injected into the right ovarian bursa of nude mice with Matrigel (354248; Corning, Corning, NY, USA) at 2.5 × 10⁵ cells per mouse, eight mice per condition. For in vivo experiments, DsiRNA with 2′-O-methyl modifications were used [56] (modified oligonucleotide sequence listed Table S4). Starting 1 week after initial injection and continuing twice weekly, HA-MSN-siRNA were injected intravenously. After intraperitoneal injection of luciferin, the mice were imaged with an IVIS Lumina Series III in vivo imaging system (PerkinElmer, Waltham, MA, USA). Live imaging was performed twice weekly and the bioluminescent images were analyzed using Living Image in vivo Imaging Software (PerkinElmer, Waltham, MA, USA) to assess tumor burden at primary and metastatic sites. At day 1, 14 mice were randomized and assigned into two groups (siControl and siSnail, 7 mice each). The bioluminescence of animals from each group was measured at each time point. Based on tumor development, some mice were censored from analyses. Each animal’s measurement was normalized to its own bioluminescence from day one and then the means for each time point were analyzed using a two-way ANOVA. To determine endpoints, mouse abdominal girth was measured prior to surgery and monitored once a week. When the first mouse reached the endpoint of an increase of 25% in girth, all mice were euthanized, and necropsy was carried out. Primary and metastatic tumor weight and tumor locations were recorded, and samples were harvested for gene and protein expression analysis.
2.13. Statistical Analyses
For all in vitro experiments, cell samples in the same treatment group were harvested from at least 3 biological replicates and processed individually. For in vivo experiments, data are from one representative experiment of three. All values in the figures and text are the means ± SD. Statistical analyses were performed using the Prism 7.0a for Mac OS X (GraphPad Software, Inc., San Diego, CA, USA). Statistical significance among mean values was determined by Student’s t-test with two-tailed alpha level of 0.05 considered significant, with the exception of tumor growth in the in vivo study, which is determined by two-way ANOVA with Tukey’s multiple comparison test. * p < 0.05; ** p < 0.01; *** p < 0.001; **** p < 0.0001.
3. Results
3.1. SNAI1 Leads to Increased Stemness
To test the relationship between SNAI1 expression and changes in stemness, we induced SNAI1 expression with growth factors including TGFB1 and EGF [57,58]. We tested several cancer cell lines of epithelial origin including pancreatic (PANC-1), breast (MCF-7), and ovarian (OVCAR8 and OVSAHO).
After two days of TGFB1 (MCF-7 or PANC-1) or EGF (OVSAHO or OVCAR8) treatment, as expected, RNA and protein expression levels of SNAI1 increased modestly, confirmed by RT-qPCR (Figure 1A) and Western blot (Figure 1C and Figure S2A). TGFB1 does not induce SNAI1 expression in OVSAHO or OVCAR8 (Figure S1B); for this reason, ovarian cancer cell lines were treated with EGF. The smaller change in SNAI1 protein observed in OVCAR8 could be explained by its high endogenous SNAI1 level as previously described [59]. Endogenous levels of all cell lines are shown in Figure S1A. mRNA expression of stemness markers LIN28A, NANOG, POU5F1 and HMGA2 increased after treatment (Figure 1B). Western blot analysis showed an increase of HMGA2 protein in OVSAHO (43%) (Figure 1D and Figure S2B). However, this was not detectable in other lines. We used spheroid assays as a measure of self-renewal and growth in non-adherent conditions, which are increased with higher stemness [59,60]. In agreement with the phenotypic measurements above, cells in which SNAI1 expression was induced via TGFB1 or EGF formed more spheroids, to a greater extent in secondary spheroids (Figure 1E and Figure S5B). Along with the increased SNAI1 expression, consistent with a change to a more stem cell-like gene expression pattern, we observed a decrease in expression levels of let-7 family members (Figure 1F). We chose to follow one let-7 member from each of four clusters on chromosomes 3, 9, 12, and 19 [23].
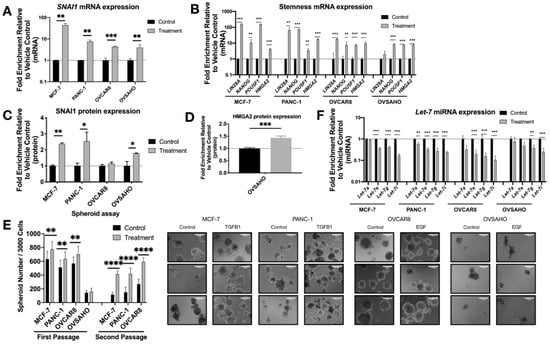
Figure 1.
Growth factor treatment results in increased SNAI1, increased stemness and decreased let-7 expression. MCF-7, PANC-1 were treated with TGFB1; OVCAR8, OVSAHO were treated with EGF. Levels of control group (cells treated with vehicle control) were normalized to 1. Values for RT-qPCR are shown on a log scale. (A,B) RT-qPCR analysis for mRNA expression level of SNAI1 (A) and of stemness markers ((B), LIN28A, NANOG, POU5F1 and HMGA2). (C,D) The quantification of Western blot analysis for protein expression of SNAI1 (C) and HMGA2 (D). (E) Left panel: The quantification of number of spheroids per 3000 cells (both first passage and second passage) is shown. Right panel: Phase contrast images of spheroids formed from cells (first passage) as indicated are presented. In each panel, the spheroids formed from control group are presented on the left, those from the treatment group are on the right. Scale bar = 100 μm (F) RT-qPCR analysis for let-7 miRNA (let-7a, let-7e, let-7g and let-7i) expression. * p < 0.05; ** p < 0.01; *** p < 0.001; **** p < 0.0001.
Because growth factor-induced EMT resulted in changes consistent with increased stemness, we wished to pinpoint mechanisms of stemness downstream of EMT. Our previous studies indicated a role for SNAI1 in the induction of the stem cell fate [17]. Besides inducing EMT, the TGFB1 signaling pathway is important in mediating cellular proliferation, preventing progression through the cell cycle, and multiple other actions [57]. EGF also plays an important role in the development of tumors by regulating cell proliferation, differentiation, migration and angiogenesis [58]. Thus, treatment with these growth factors changes the expression of numerous genes besides SNAI1. To specify the effect of a single factor, SNAI1, we overexpressed SNAI1 to determine whether it alone could induce the stem cell state. Cell lines were virally transduced with constitutively expressed SNAI1 or control vector.
After transduction, the increase in SNAI1 mRNA and protein expression (Figure 2A,C and Figure S4A) was accompanied by a significant increase in stemness markers LIN28A, POU5F1, and HMGA2 (Figure 2B). Western blot data confirmed this change, showing an increase in HMGA2 (Figure 2D and Figure S4B). With the increase in expression of SNAI1 and stemness genes, we observed a decrease in let-7 family members (Figure 2F). Consistent with the phenotypic changes, SNAI1 overexpression led to an increased number of spheroids formed, to a greater extent in secondary spheroids (Figure 2E, Figures S4C and S5B) (the size of spheroids for OVCAR8 is quantified and presented in Figure S5A). These results suggest increased stemness associated with SNAI1. In order to investigate whether the regulation of stemness is directly through SNAI1’s action on let-7, we overexpressed let-7i in SNAI1 overexpressing cells (Figure S6A). Let-7i overexpression resulted in abrogation of SNAI1-induced stemness as measured by RT-qPCR (Figure S6B) and spheroid formation (Figure S6C,D). These results are consistent with the observation that SNAI1 overexpression is sufficient to shift the phenotype toward stemness via its effect on let-7.
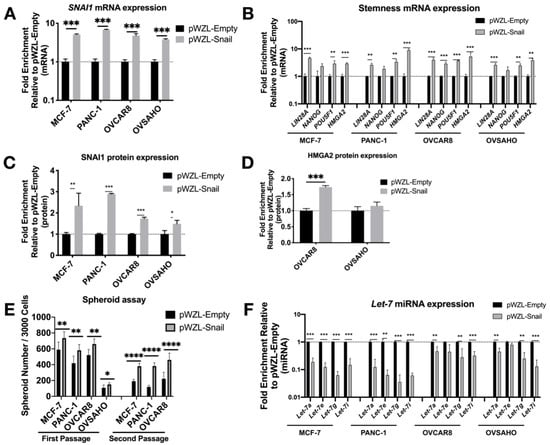
Figure 2.
SNAI1 overexpression results in increased stemness and decreased let-7 expression. Cell lines were transduced with the retroviral expression vector pWZL-Snail or empty vector, pWZL-Empty, in cell lines MCF-7, PANC-1, OVCAR8 and OVSAHO. Levels of control group (cells transduced with pWZL-Empty) were normalized to 1. Values for RT-qPCR are shown on a log scale. (A,B) RT-qPCR analysis for mRNA expression of SNAI1 (A) and of stemness markers LIN28A, NANOG, POU5F1 and HMGA2 (B). (C,D) The quantification of Western blot analysis for protein expression of SNAI1 (C) and HMGA2 (D). (E) The quantification of number of spheroids formed per 3000 cells (both first passage and second passage) as indicated. (F) RT-qPCR analysis for let-7 miRNA (let-7a, let-7e, let-7g and let-7i) expression. * p < 0.05; ** p < 0.01; *** p < 0.001; **** p < 0.0001
3.2. SNAI1 Knockdown Reverses Stemness
Having established the impact of SNAI1’s gain-of-function on cells’ stemness and let-7 levels, we proceeded to knock down SNAI1 to test if the opposite effects could be observed. We used HA-conjugated MSN [45] (HA-MSN) to deliver siRNA in MCF-7, PANC-1, OVSAHO and OVCAR8. We observed a decrease in the mRNA expression level of SNAI1 after HA-MSN-siSnail treatment in most cases (Figure 3A). The knockdown of SNAI1 was confirmed on the protein level with Western blot data (Figure 3C and Figure S7A). Together with the decrease of SNAI1, the expression of stemness markers also decreased on the mRNA level (Figure 3B). HMGA2 protein also decreased in PANC-1 and OVSAHO after siSnail treatment (Figure 3D and Figure S7B). SNAI1 knockdown resulted in reduced frequency of stem cells, as measured by number of spheroids formed (Figure 3E and Figure S7C), and secondary spheroids showed a greater difference between siSnail and siControl (Figure 3E and Figure S5B). An increase in spheroid size in OVCAR8 was also observed (Figure S5A). Consistent with the SNAI1 time course, let-7 expression increased after SNAI1 knockdown (Figure 3F). Similar effects can be observed with a different siRNA (Figure S8). These results indicate that reducing SNAI1 expression leads to decreased stemness and the restoration of let-7 expression in cancer cells.
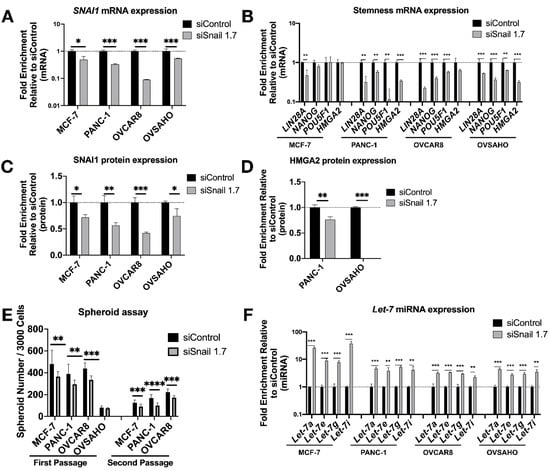
Figure 3.
SNAI1 knockdown reverses stemness and restores let-7 expression. Mesoporous silica nanoparticles coated with hyaluronic acid (HA-MSN) were used to deliver siRNA (siSnail and siControl) in MCF-7, PANC-1, OVCAR8, and OVSAHO. Levels of control group (cells treated with siControl) were normalized to 1. Values for RT-qPCR are shown on a log scale. Samples were harvested after 24 h (MCF-7, OVCAR8 and OVSAHO) or 72 h (PANC-1). (A,B) RT-qPCR analysis for mRNA expression of SNAI1 (A) and of stemness markers LIN28A, NANOG, POU5F1 and HMGA2 (B). (C,D) The quantification of Western blot analysis for protein expression of SNAI1 (C) and HMGA2 (D). (E) The quantification of number of spheroids formed per 3000 cells (both first passage and second passage) as indicated. (F) RT-qPCR analysis for let-7 miRNA (let-7a, let-7e, let-7g, and let-7i) expression. * p < 0.05; ** p < 0.01; *** p < 0.001; **** p < 0.0001
3.3. SNAI1 Knockdown Reverses Stemness in Patient Derived HGSOC Samples In Vitro and Decreases Tumor Burden In Vivo
To test our findings in a more clinically relevant setting, we knocked down SNAI1 in patient-derived HGSOC cells in vitro using HA-MSN-siSnail (Figure 4A,C and Figure S9A). In agreement with our observations in cell lines, PDX cells treated with HA-MSN-siSnail showed decreased levels of stemness markers (Figure 4B,D and Figure S9A), decreased size (Figure S5A) and number of spheroids formed (Figure 4E and Figure S9B), and increased levels of let-7 (Figure 4F).
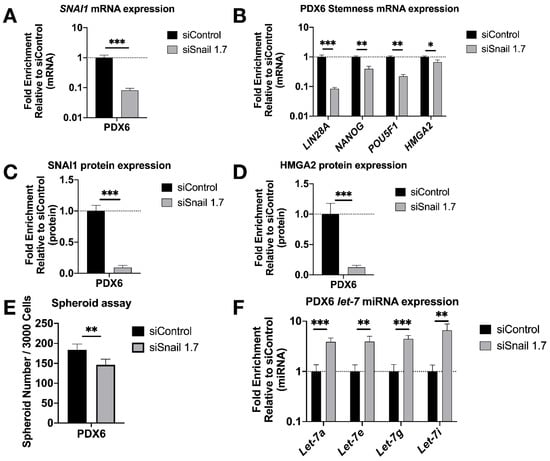
Figure 4.
SNAI1 knockdown reduces stemness in patient-derived cells in vitro. HA-MSN were used to deliver siRNA (siSnail and siControl) in PDX cells in vitro. Levels of control group (cells treated with siControl) were normalized to 1. Values for RT-qPCR are shown on a log scale. (A,B) RT-qPCR analysis for mRNA expression of SNAI1 (A) and of stemness markers LIN28A, NANOG, POU5F1 and HMGA2 (B). (C,D) The quantification of Western blot analysis for protein expression of SNAI1 (C) and HMGA2 (D). (E) The quantification of number of spheroids per 3000 cells formed from PDX6 in vitro. (F) RT-qPCR analysis for let-7 miRNA (let-7a, let-7e, let-7g, and let-7i) expression. * p < 0.05; ** p < 0.01; *** p < 0.001.
To extend these results to an in vivo setting, luciferized PDX6 cells were injected into the ovarian bursa of nude mice in our orthotopic xenograft model [59]. Mice were imaged twice weekly for bioluminescence, and total flux was quantified over seven weeks. One week after bursa injection, treatment with HA-MSN-siSnail (or HA-MSN-siControl) began and continued twice weekly for the duration of the experiment. Upon necropsy, RT-qPCR results showed a decrease of SNAI1 along with reduced LIN28A, NANOG and POU5F1 in tumors from mice treated with HA-MSN-siSnail (Figure 5A,B). In agreement with mRNA results, the protein levels of SNAI1, LIN28A and HMGA2 were significantly decreased in mice treated with HA-MSN-siSnail (Figure 5C,D and Figure S10A). Consistent with the in vitro results, let-7 levels were also increased in mice treated with HA-MSN-siSnail (Figure 5E). In addition, primary tumor weights demonstrated smaller tumors in siSnail mice (Figure S10B). Visualization of tumors in live animals revealed that primary tumors were significantly smaller in mice receiving HA-MSN-siSnail injections (Figure 5F). These results demonstrate that SNAI1 was successfully knocked down in vivo using targeted nanoparticle-delivered RNAi. Taken together, our results demonstrate that knockdown of SNAI1 in patient-derived HGSOC samples in vitro and in vivo results in restoration of let-7, decreased stemness, and reduced tumor burden.
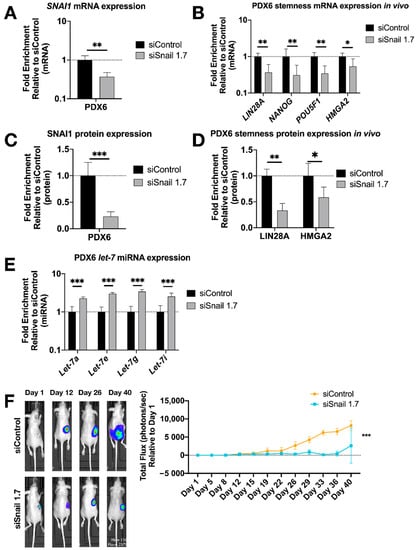
Figure 5.
SNAI1 knockdown in vivo reduces stemness gene expression and tumor burden. HA-MSN were used to deliver siRNA (siSnail and siControl) via IV injection to orthotopic PDX in vivo. Tumor samples were harvested and analyzed at necropsy. Levels of control group (cells treated with siControl) were normalized to 1. Values for RT-qPCR are shown on a log scale. (A,B) RT-qPCR analysis for mRNA expression of SNAI1 (A) and of stemness markers LIN28A, NANOG, POU5F1 and HMGA2 (B), in tumors. (C,D) The quantification of Western blot analysis for protein expression of SNAI1 (C) and stemness markers LIN28A and HMGA2 (D), in tumors. (E) RT-qPCR analysis for let-7 miRNA (let-7a, let-7e, let-7g and let-7i) expression in tumors. (F) Left panel: Representative images of xenograft mice. siControl (upper) and siSnail knockdown (lower). Right panel: Quantitation of bioluminescence at primary sites over six weeks. X axis, days; Y axis, total flux in photons/second relative to day 1. * p < 0.05; ** p < 0.01; *** p < 0.001.
3.4. SNAI1 Binds let-7 Promoters Resulting in let-7 Repression
We sought to establish whether SNAI1 acts to repress let-7 transcription directly. SNAI1 binds promoters of let-7 in fibroblasts, and binding increases upon SNAI1 overexpression [17]. To examine whether this same association can be observed in cancer cells, we carried out ChIP assays to determine the binding of SNAI1 to the promoter region of various let-7 family members, as defined by previous studies [33,50,51,52,53,54]. The let-7i promoter is diagrammed in Figure 6A; [33,54] the promoter region locations and the E-box (CANNTG) locations studied are listed in Table S1. At baseline, we observed that SNAI1 bound CDH1 (used as a positive control) and let-7 promoters to a greater extent in OVCAR8, the cell line with higher SNAI1 expression, than in OVSAHO [59] (Figure S11A). We also assessed binding upon EMT induction by TGFB1 in MCF-7 cells and detected an increased level of let-7i and miR-98 promoter binding compared to the control group (Figure S11B). These data demonstrate SNAI1 binding to let-7 promoter regions in cancer cells tested.
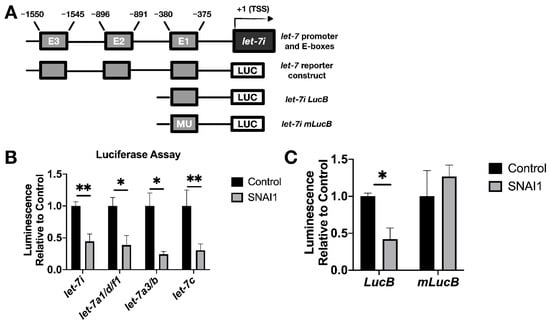
Figure 6.
SNAI1 represses let-7 promoters. (A) Schematic representation of the promoter region of let-7i (upper) and reporter constructs used in luciferase assays (lower diagrams). E1, E2, E3: E-boxes (sequence: CANNTG); MU: Mutated E-boxes; TSS: Transcription start site (B) For luciferase assays, HEK293T cells were co-transfected with two plasmids: (1) let-7 promoter luciferase (let-7i, let-7a1/d/f1, let-7a3/b, let-7c), and (2) either SNAI1 (constitutively expressed, gray bars) or empty vector (black bars). Luminescence activity was measured 48 h thereafter. (C) HEK293T cells were co-transfected with either let-7i lucB or let-7i mlucB with or without SNAI1. Luminescence was measured 24 h later. * p < 0.05; ** p < 0.01.
To test the functional result of SNAI1 binding to let-7 promoters, luciferase assays were used as a reporter for let-7 promoter activity via bioluminescence. We used let-7 promoter luciferase constructs as shown in Figure 6A (bottom diagram; see Table S1). This enabled us to detect the effect of SNAI1 on let-7i, let7a1/d/f1, let-7a-3, and let-7c promoter activity. Co-transfection with let-7 promoter luciferase and SNAI1 (constitutively expressed), compared with empty vector, resulted in a reduction in bioluminescence (Figure 6B), confirming the repression of let-7 promoter activity. Expression from a truncated promoter containing only E-box one was also reduced by overexpressed SNAI1 (E-boxes are the binding site for SNAI1). However, when the same E-box was mutated, the inhibition by SNAI1 was abrogated (Figure 6C). These results demonstrate that SNAI1 binding to let-7 promoters directly represses let-7 transcription.
4. Discussion
Let-7’s major roles in maintenance of differentiation make it a key player in both development and cancer [13,14]. Loss of let-7 is a major component of the loss of differentiation seen in many cancers, and significantly correlates with poor prognosis [13,16,18,19]. Studies of stem cell reprogramming linked let-7 repression with a transcription factor that induces EMT, SNAI1 [17]. In the present study, we examined the role of let-7 in cancer cells and its connection to SNAI1. When cells from breast (MCF-7), pancreatic (PANC-1), and ovarian (OVCAR8, OVSAHO) cancer were treated with EMT-inducing agents (TGFB1 or EGF), increases in EMT factors including SNAI1, increases in stemness markers, and decreases in let-7 could be detected. This positive association between SNAI1 and stemness, and the negative association between SNAI1 and let-7, were confirmed when SNAI1 itself was overexpressed through viral transduction or knocked down by siRNA.
One of the goals of this investigation was to understand the molecular mechanisms by which SNAI1 exerts its pro-stemness effects. The effect of SNAI1 on let-7 levels, and its direct binding to several let-7 family member promoter regions, were detected using ChIP and luciferase assays, providing evidence that SNAI1 binds let-7 promoters and directly represses its expression, leading to an increase in stemness in cancer cells. Although EMT has been linked to stemness, few insights into downstream mechanisms have been generated. One downstream effector of SNAI1 and other EMT programs is the transcription factor FOXC2 via the serine/threonine kinase p38, thus linking EMT and stem cell traits [39]. Another avenue by which SNAI1 exerts stemness is via repression of miR-34 via effects on WNT signaling, NOTCH, and CD44 [61]. Presented results provide evidence for the SNAI1/let-7 axis as a crucial mechanism by which EMT exerts pro-stemness roles. These results point to SNAI1 as a stem cell-directed target for therapy.
SNAI1 may be a particularly apt target in the goal of eliminating CSC because of its role in the stabilization of the hybrid epithelial–mesenchymal state [37,62]. OVCAR8 parental cells showed the highest level of stemness markers (LIN28A, NANOG, POU5F1 and HMGA2), along with a high level of epithelial marker CDH1 and mesenchymal markers SNAI1 and VIM (Figure S1A), consistent with a hybrid EMT status. LIN28/let-7 circuits regulate stemness as shown in both modeling and in vitro experiments [32,63]. Cells have been categorized on this basis into differentiated (d), d/u hybrid or undifferentiated (u) states, based on LIN28 level. Significant correspondence between E/M state to D/U hybrid state has been theoretically demonstrated [32]. Therefore, the hybrid EMT state has been proposed to be most likely to gain stemness via let-7 regulation. SNAI1 is highly expressed in all of the cell types examined here (Figure S1A), and further studies will determine whether SNAI1-dependent let-7 repression plays a role in the hybrid state.
SNAI1 inhibition via transfection, viral delivery, or genetic deletion has been shown to reduce invasion, proliferation, chemoresistance, and other aspects of the stemness phenotype [59,64,65]. However, because these approaches cannot be considered for use in patients, novel approaches like the nanoparticle-mediated delivery are needed. Small RNAs can be efficiently loaded onto MSNs, which protect the oligonucleotides from degradation, are enriched in tumors due to leaky vasculature, and are taken up into cells by pinocytosis, in effect functioning as a transfection reagent [46]. Their large surface area and pore structure make them ideal for drug delivery [44]. MSNs are a promising delivery agent for RNAi in vivo [45,49,66]. Considering this potential, and with the goal of clinical relevance, we used MSN to knock down SNAI1. SNAI1 downregulation could be detected on both RNA and protein levels, emphasizing the utility of MSN for siRNA delivery. We extended these results to in vivo experiments where we knocked down SNAI1 in our orthotopic PDX model [59]. We achieved >75% knockdown of SNAI1 protein in tumors in vivo. Furthermore, tumor let-7 levels increased 2–3 fold, consistent with SNAI1-mediated repression of let-7 in vivo. In parallel, expression of stem cell markers LIN28A, NANOG, POU5F1, and HMGA2 decreased, consistent with a shift away from the stem cell phenotype. This demonstrates that targeting SNAI1 is sufficient to reduce stemness. Further studies will determine if these changes lead to reduced metastasis or delayed recurrence.
Although these studies provide important insights into the mechanism for loss of let-7 and thus the destabilization of the differentiated state, they do not address the question of the origin of CSC. Rather, we suggest that any cell, regardless of origin, will lose let-7 while taking on the characteristics of cancer stem cells. Like differentiated cells, adult stem cells express high levels of let-7 [67,68], therefore let-7 loss via transcriptional, post-transcriptional, or epigenetic regulation is required even if adult stem cells are the cell of origin. In the absence of LIN28A, transcriptional repression of let-7 could tip the balance in favor of stemness. The mechanism by which let-7 is lost is thus germane to cancer stem cell biology regardless of whether normal stem cells or differentiated cells are the cells of origin. Our finding that SNAI1 transcriptionally represses let-7 adds even more weight to SNAI1 as a therapeutic target. Blocking SNAI1, in addition to inhibiting invasion and migratory ability, is expected to restore let-7 by increasing its transcription. We predict that SNAI1-mediated let-7 repression could be an important mechanism of cancer stemness in a wide variety of carcinoma cells.
5. Conclusions
Our studies reveal one mechanism for EMT-induced stemness. SNAI1 overexpression results in reduction of miRNA let-7 levels, and is sufficient to shift the phenotype of cancer cells tested toward stemness. SNAI1 knockdown leads to decreased stemness and the restoration of let-7 expression in cancer cells, including patient-derived cells. ChIP and luciferase assays led to the conclusion that SNAI1 binding to let-7 promoters directly represses let-7 transcription. Mesoporous silica nanoparticle-delivered RNAi effectively knocks down SNAI1 in vivo, resulting in reduced tumor burden, in support of its clinical use. These results provide evidence for the SNAI1/let-7 axis as a key mechanism by which EMT exerts pro-stemness roles.
Supplementary Materials
The following are available online at https://www.mdpi.com/2072-6694/13/6/1469/s1, Figure S1: Parental cell line gene expression comparison; EMT is not induced by TGFB1 treatment in ovarian cancer cell lines, Figure S2: Western blot data for growth factor treatment, Figure S3: The effectiveness of different DsiRNAs, Figure S4: Western blot data and pictures of spheroids formed with SNAI1 overexpression, Figure S5: Higher level of SNAI1 is associated with larger size of spheroids and higher number of secondary spheroids formed, Figure S6: Let-7i overexpression rescues the increase in stemness resulting from SNAI1 overexpression, Figure S7: Western blot data and pictures of spheroids formed in SNAI1 knockdown in cancer cell lines, Figure S8: Knockdown of SNAI1 with a second DsiRNA, Figure S9: Western blot data and pictures of spheroids formed in SNAI1 knockdown in PDX cells in vitro, Figure S10: Western blot data and tumor weight comparison for SNAI1 knockdown in PDX cells in vivo, Figure S11: SNAI1 binds to let-7 promoters demonstrated by ChIP, Figure S12: Uncropped Western blot figures, Table S1: Let-7 promoter region length, locations and E-box (CANNTG) locations, Table S2: Sequences of primers used in RT-qPCR, Table S3: Sequences of primers used in chromatin immunoprecipitation, Table S4: Sequences of siRNA oligonucleotides.
Author Contributions
Conceptualization, H.W., J.Z., C.A.G., Y.J.I. and J.J.U.; Data curation, H.W.; Formal analysis, H.W., E.C., T.S. and J.J.U.; Funding acquisition, J.J.U.; Investigation, H.W., E.C., N.H., T.S., A.B., M.P., R.W., Y.J.I. and J.J.U.; Methodology, E.C., N.H., T.S., C.P., R.W., C.A.G., Y.J.I. and J.J.U.; Project administration, H.W. and J.J.U.; Resources, R.W., J.Z. and J.J.U.; Supervision, J.J.U.; Validation, H.W., E.C., N.H., T.S. and J.J.U.; Visualization, H.W. and J.J.U.; Writing—original draft, H.W. and J.J.U.; Writing—review and editing, H.W., C.A.G., Y.J.I. and J.J.U. All authors have read and agreed to the published version of the manuscript.
Funding
This work was supported by a Grant to Promote Collaboration and Translation from Loma Linda University (LLU) to J.U. and Y.J.I., by a California Institute for Regenerative Medicine Inception Grant to J.U. (DISC1-10588), and by LLU start-up funding.
Institutional Review Board Statement
All studies were approved by the Loma Linda University (LLU) IRB (#58238, approved 24 January 2018). Investigations were carried out following the rules of the Declaration of Helsinki of 1975.
Informed Consent Statement
All subjects gave their informed consent before participation in the study.
Data Availability Statement
Data will be made available from the corresponding author upon reasonable request.
Acknowledgments
We thank Gottfried Konecny, C.A.G., Nathan Wall, and Eileen Brantley for cell lines, Ebtesam Nafie for cell line authentication, Jacqueline Coats for input on statistical analyses, members of the Perry lab for assistance with dynamic light scattering measurements of MSN, Danilo Boskovic for insightful comments on the manuscript, and members of the Unternaehrer and Glackin labs for helpful discussions.
Conflicts of Interest
The authors declare no conflict of interest.
References
- Kreso, A.; Dick, J.E. Evolution of the Cancer Stem Cell Model. Cell Stem Cell 2014, 14, 275–291. [Google Scholar] [CrossRef] [PubMed]
- Al-Hajj, M.; Wicha, M.S.; Benito-Hernandez, A.; Morrison, S.J.; Clarke, M.F. Prospective Identification of Tumorigenic Breast Cancer Cells. Proc. Natl. Acad. Sci. USA 2003, 100, 3983–3988. [Google Scholar] [CrossRef] [PubMed]
- Reya, T.; Morrison, S.J.; Clarke, M.F.; Weissman, I.L. Stem Cells, Cancer, and Cancer Stem Cells. Nature 2001, 414, 105–111. [Google Scholar] [CrossRef] [PubMed]
- Yamada, Y.; Haga, H.; Yamada, Y. Concise Review: Dedifferentiation Meets Cancer Development: Proof of Concept for Epigenetic Cancer. Stem Cells Transl. Med. 2014, 3, 1182–1187. [Google Scholar] [CrossRef] [PubMed]
- Schwitalla, S.; Fingerle, A.A.; Cammareri, P.; Nebelsiek, T.; Göktuna, S.I.; Ziegler, P.K.; Canli, O.; Heijmans, J.; Huels, D.J.; Moreaux, G.; et al. Intestinal Tumorigenesis Initiated by Dedifferentiation and Acquisition of Stem-Cell-like Properties. Cell 2013, 152, 25–38. [Google Scholar] [CrossRef] [PubMed]
- Vermeulen, L.; De Sousa, E.; Melo, F.; van der Heijden, M.; Cameron, K.; de Jong, J.H.; Borovski, T.; Tuynman, J.B.; Todaro, M.; Merz, C.; et al. Wnt Activity Defines Colon Cancer Stem Cells and Is Regulated by the Microenvironment. Nat. Cell Biol. 2010, 12, 468–476. [Google Scholar] [CrossRef] [PubMed]
- Friedmann-Morvinski, D.; Verma, I.M. Dedifferentiation and Reprogramming: Origins of Cancer Stem Cells. EMBO Rep. 2014, 15, 244–253. [Google Scholar] [CrossRef] [PubMed]
- Daley, G.Q. Common Themes of Dedifferentiation in Somatic Cell Reprogramming and Cancer. Cold Spring Harb. Symp. Quant. Biol. 2008, 73, 171–174. [Google Scholar] [CrossRef]
- Riggs, J.W.; Barrilleaux, B.L.; Varlakhanova, N.; Bush, K.M.; Chan, V.; Knoepfler, P.S. Induced Pluripotency and Oncogenic Transformation Are Related Processes. Stem Cells Dev. 2013, 22, 37–50. [Google Scholar] [CrossRef]
- Kim, J.; Orkin, S.H. Embryonic Stem Cell-Specific Signatures in Cancer: Insights into Genomic Regulatory Networks and Implications for Medicine. Genome Med. 2011, 3, 75. [Google Scholar] [CrossRef]
- Gupta, P.B.; Chaffer, C.L.; Weinberg, R.A. Cancer Stem Cells: Mirage or Reality? Nat. Med. 2009, 15, 1010–1012. [Google Scholar] [CrossRef]
- Ben-Porath, I.; Thomson, M.W.; Carey, V.J.; Ge, R.; Bell, G.W.; Regev, A.; Weinberg, R.A. An Embryonic Stem Cell-like Gene Expression Signature in Poorly Differentiated Aggressive Human Tumors. Nat. Genet. 2008, 40, 499–507. [Google Scholar] [CrossRef] [PubMed]
- Boyerinas, B.; Park, S.-M.; Hau, A.; Murmann, A.E.; Peter, M.E. The Role of Let-7 in Cell Differentiation and Cancer. Endocr. Relat. Cancer 2010, 17, F19–F36. [Google Scholar] [CrossRef]
- Büssing, I.; Slack, F.J.; Grosshans, H. Let-7 MicroRNAs in Development, Stem Cells and Cancer. Trends Mol. Med. 2008, 14, 400–409. [Google Scholar] [CrossRef] [PubMed]
- Boyerinas, B.; Park, S.-M.; Shomron, N.; Hedegaard, M.M.; Vinther, J.; Andersen, J.S.; Feig, C.; Xu, J.; Burge, C.B.; Peter, M.E. Identification of Let-7-Regulated Oncofetal Genes. Cancer Res. 2008, 68, 2587–2591. [Google Scholar] [CrossRef]
- Park, S.-M.; Shell, S.; Radjabi, A.R.; Schickel, R.; Feig, C.; Boyerinas, B.; Dinulescu, D.M.; Lengyel, E.; Peter, M.E. Let-7 Prevents Early Cancer Progression by Suppressing Expression of the Embryonic Gene HMGA2. Cell Cycle Georget. Tex 2007, 6, 2585–2590. [Google Scholar] [CrossRef]
- Unternaehrer, J.J.; Zhao, R.; Kim, K.; Cesana, M.; Powers, J.T.; Ratanasirintrawoot, S.; Onder, T.; Shibue, T.; Weinberg, R.A.; Daley, G.Q. The Epithelial-Mesenchymal Transition Factor SNAIL Paradoxically Enhances Reprogramming. Stem Cell Rep. 2014, 3, 691–698. [Google Scholar] [CrossRef]
- Chirshev, E.; Oberg, K.C.; Ioffe, Y.J.; Unternaehrer, J.J. Let-7 as Biomarker, Prognostic Indicator, and Therapy for Precision Medicine in Cancer. Clin. Transl. Med. 2019, 8, 24. [Google Scholar] [CrossRef] [PubMed]
- Shell, S.; Park, S.-M.; Radjabi, A.R.; Schickel, R.; Kistner, E.O.; Jewell, D.A.; Feig, C.; Lengyel, E.; Peter, M.E. Let-7 Expression Defines Two Differentiation Stages of Cancer. Proc. Natl. Acad. Sci. USA 2007, 104, 11400–11405. [Google Scholar] [CrossRef]
- Viswanathan, S.R.; Daley, G.Q.; Gregory, R.I. Selective Blockade of MicroRNA Processing by Lin28. Science 2008, 320, 97–100. [Google Scholar] [CrossRef]
- Baum, B.; Settleman, J.; Quinlan, M.P. Transitions between Epithelial and Mesenchymal States in Development and Disease. Semin. Cell Dev. Biol. 2008, 19, 294–308. [Google Scholar] [CrossRef] [PubMed]
- Chirshev, E.; Hojo, N.; Bertucci, A.; Sanderman, L.; Nguyen, A.; Wang, H.; Suzuki, T.; Brito, E.; Martinez, S.R.; Castañón, C.; et al. Epithelial/Mesenchymal Heterogeneity of High-Grade Serous Ovarian Carcinoma Samples Correlates with MiRNA Let-7 Levels and Predicts Tumor Growth and Metastasis. Mol. Oncol. 2020. [Google Scholar] [CrossRef]
- Lee, H.; Han, S.; Kwon, C.S.; Lee, D. Biogenesis and Regulation of the Let-7 MiRNAs and Their Functional Implications. Protein Cell 2016, 7, 100–113. [Google Scholar] [CrossRef] [PubMed]
- Micalizzi, D.S.; Farabaugh, S.M.; Ford, H.L. Epithelial-Mesenchymal Transition in Cancer: Parallels between Normal Development and Tumor Progression. J. Mammary Gland Biol. Neoplasia 2010, 15, 117–134. [Google Scholar] [CrossRef] [PubMed]
- Nieto, M.A. Epithelial Plasticity: A Common Theme in Embryonic and Cancer Cells. Science 2013, 342, 1234850. [Google Scholar] [CrossRef]
- Pastushenko, I.; Blanpain, C. EMT Transition States during Tumor Progression and Metastasis. Trends Cell Biol. 2019, 29, 212–226. [Google Scholar] [CrossRef] [PubMed]
- Bocci, F.; Jolly, M.K.; Tripathi, S.C.; Aguilar, M.; Hanash, S.M.; Levine, H.; Onuchic, J.N. Numb Prevents a Complete Epithelial-Mesenchymal Transition by Modulating Notch Signalling. J. R. Soc. Interface 2017, 14. [Google Scholar] [CrossRef]
- Battula, V.L.; Evans, K.W.; Hollier, B.G.; Shi, Y.; Marini, F.C.; Ayyanan, A.; Wang, R.-Y.; Brisken, C.; Guerra, R.; Andreeff, M.; et al. Epithelial-Mesenchymal Transition-Derived Cells Exhibit Multilineage Differentiation Potential Similar to Mesenchymal Stem Cells. Stem Cells Dayt. Ohio 2010, 28, 1435–1445. [Google Scholar] [CrossRef]
- Mani, S.A.; Guo, W.; Liao, M.-J.; Eaton, E.N.; Ayyanan, A.; Zhou, A.Y.; Brooks, M.; Reinhard, F.; Zhang, C.C.; Shipitsin, M.; et al. The Epithelial-Mesenchymal Transition Generates Cells with Properties of Stem Cells. Cell 2008, 133, 704–715. [Google Scholar] [CrossRef] [PubMed]
- Diehn, M.; Cho, R.W.; Lobo, N.A.; Kalisky, T.; Dorie, M.J.; Kulp, A.N.; Qian, D.; Lam, J.S.; Ailles, L.E.; Wong, M.; et al. Association of Reactive Oxygen Species Levels and Radioresistance in Cancer Stem Cells. Nature 2009, 458, 780–783. [Google Scholar] [CrossRef] [PubMed]
- Li, X.; Lewis, M.T.; Huang, J.; Gutierrez, C.; Osborne, C.K.; Wu, M.-F.; Hilsenbeck, S.G.; Pavlick, A.; Zhang, X.; Chamness, G.C.; et al. Intrinsic Resistance of Tumorigenic Breast Cancer Cells to Chemotherapy. J. Natl. Cancer Inst. 2008, 100, 672–679. [Google Scholar] [CrossRef]
- Jolly, M.K.; Huang, B.; Lu, M.; Mani, S.A.; Levine, H.; Ben-Jacob, E. Towards Elucidating the Connection between Epithelial-Mesenchymal Transitions and Stemness. J. R. Soc. Interface 2014, 11, 20140962. [Google Scholar] [CrossRef]
- Yang, W.-H.; Lan, H.-Y.; Huang, C.-H.; Tai, S.-K.; Tzeng, C.-H.; Kao, S.-Y.; Wu, K.-J.; Hung, M.-C.; Yang, M.-H. RAC1 Activation Mediates Twist1-Induced Cancer Cell Migration. Nat. Cell Biol. 2012, 14, 366–374. [Google Scholar] [CrossRef]
- Wellner, U.; Schubert, J.; Burk, U.C.; Schmalhofer, O.; Zhu, F.; Sonntag, A.; Waldvogel, B.; Vannier, C.; Darling, D.; zur Hausen, A.; et al. The EMT-Activator ZEB1 Promotes Tumorigenicity by Repressing Stemness-Inhibiting MicroRNAs. Nat. Cell Biol. 2009, 11, 1487–1495. [Google Scholar] [CrossRef]
- Morel, A.-P.; Lièvre, M.; Thomas, C.; Hinkal, G.; Ansieau, S.; Puisieux, A. Generation of Breast Cancer Stem Cells through Epithelial-Mesenchymal Transition. PLoS ONE 2008, 3, e2888. [Google Scholar] [CrossRef]
- Bhat-Nakshatri, P.; Appaiah, H.; Ballas, C.; Pick-Franke, P.; Goulet, R.; Badve, S.; Srour, E.F.; Nakshatri, H. SLUG/SNAI2 and Tumor Necrosis Factor Generate Breast Cells with CD44+/CD24- Phenotype. BMC Cancer 2010, 10, 411. [Google Scholar] [CrossRef]
- Kröger, C.; Afeyan, A.; Mraz, J.; Eaton, E.N.; Reinhardt, F.; Khodor, Y.L.; Thiru, P.; Bierie, B.; Ye, X.; Burge, C.B.; et al. Acquisition of a Hybrid E/M State Is Essential for Tumorigenicity of Basal Breast Cancer Cells. Proc. Natl. Acad. Sci. USA 2019, 116, 7353–7362. [Google Scholar] [CrossRef]
- Subbalakshmi, A.R.; Sahoo, S.; Biswas, K.; Jolly, M.K. A Computational Systems Biology Approach Identifies SLUG as a Mediator of Partial Epithelial-Mesenchymal Transition (EMT). Cells Tissues Organs 2021, 1–14. [Google Scholar] [CrossRef]
- Siemens, H.; Jackstadt, R.; Hünten, S.; Kaller, M.; Menssen, A.; Götz, U.; Hermeking, H. MiR-34 and SNAIL Form a Double-Negative Feedback Loop to Regulate Epithelial-Mesenchymal Transitions. Cell Cycle Georget. Tex 2011, 10, 4256–4271. [Google Scholar] [CrossRef] [PubMed]
- Gingold, J.A.; Fidalgo, M.; Guallar, D.; Lau, Z.; Sun, Z.; Zhou, H.; Faiola, F.; Huang, X.; Lee, D.-F.; Waghray, A.; et al. A Genome-Wide RNAi Screen Identifies Opposing Functions of Snai1 and Snai2 on the Nanog Dependency in Reprogramming. Mol. Cell 2014, 56, 140–152. [Google Scholar] [CrossRef]
- Lu, Z.-Y.; Dong, R.; Li, D.; Li, W.-B.; Xu, F.-Q.; Geng, Y.; Zhang, Y.-S. SNAI1 Overexpression Induces Stemness and Promotes Ovarian Cancer Cell Invasion and Metastasis. Oncol. Rep. 2012, 27, 1587–1591. [Google Scholar] [CrossRef]
- Wittrup, A.; Lieberman, J. Knocking down Disease: A Progress Report on SiRNA Therapeutics. Nat. Rev. Genet. 2015, 16, 543–552. [Google Scholar] [CrossRef]
- Finlay, J.; Roberts, C.M.; Dong, J.; Zink, J.I.; Tamanoi, F.; Glackin, C.A. Mesoporous Silica Nanoparticle Delivery of Chemically Modified SiRNA against TWIST1 Leads to Reduced Tumor Burden. Nanomed. Nanotechnol. Biol. Med. 2015, 11, 1657–1666. [Google Scholar] [CrossRef] [PubMed]
- Lu, J.; Liong, M.; Zink, J.I.; Tamanoi, F. Mesoporous Silica Nanoparticles as a Delivery System for Hydrophobic Anticancer Drugs. Small Weinh. Bergstr. Ger. 2007, 3, 1341–1346. [Google Scholar] [CrossRef]
- Shahin, S.A.; Wang, R.; Simargi, S.I.; Contreras, A.; Parra Echavarria, L.; Qu, L.; Wen, W.; Dellinger, T.; Unternaehrer, J.; Tamanoi, F.; et al. Hyaluronic Acid Conjugated Nanoparticle Delivery of SiRNA against TWIST Reduces Tumor Burden and Enhances Sensitivity to Cisplatin in Ovarian Cancer. Nanomed. Nanotechnol. Biol. Med. 2018, 14, 1381–1394. [Google Scholar] [CrossRef]
- Hom, C.; Lu, J.; Liong, M.; Luo, H.; Li, Z.; Zink, J.I.; Tamanoi, F. Mesoporous Silica Nanoparticles Facilitate Delivery of SiRNA to Shutdown Signaling Pathways in Mammalian Cells. Small Weinh. Bergstr. Ger. 2010, 6, 1185–1190. [Google Scholar] [CrossRef]
- Zhang, S.; Balch, C.; Chan, M.W.; Lai, H.-C.; Matei, D.; Schilder, J.M.; Yan, P.S.; Huang, T.H.-M.; Nephew, K.P. Identification and Characterization of Ovarian Cancer-Initiating Cells from Primary Human Tumors. Cancer Res. 2008, 68, 4311–4320. [Google Scholar] [CrossRef]
- Liu, X.; Ory, V.; Chapman, S.; Yuan, H.; Albanese, C.; Kallakury, B.; Timofeeva, O.A.; Nealon, C.; Dakic, A.; Simic, V.; et al. ROCK Inhibitor and Feeder Cells Induce the Conditional Reprogramming of Epithelial Cells. Am. J. Pathol. 2012, 180, 599–607. [Google Scholar] [CrossRef] [PubMed]
- Meng, H.; Xue, M.; Xia, T.; Ji, Z.; Tarn, D.Y.; Zink, J.I.; Nel, A.E. Use of Size and a Copolymer Design Feature to Improve the Biodistribution and the Enhanced Permeability and Retention Effect of Doxorubicin-Loaded Mesoporous Silica Nanoparticles in a Murine Xenograft Tumor Model. ACS Nano 2011, 5, 4131–4144. [Google Scholar] [CrossRef] [PubMed]
- Wang, Z.; Lin, S.; Li, J.J.; Xu, Z.; Yao, H.; Zhu, X.; Xie, D.; Shen, Z.; Sze, J.; Li, K.; et al. MYC Protein Inhibits Transcription of the MicroRNA Cluster MC-Let-7a-1~let-7d via Noncanonical E-Box. J. Biol. Chem. 2011, 286, 39703–39714. [Google Scholar] [CrossRef] [PubMed]
- Wang, D.J.; Legesse-Miller, A.; Johnson, E.L.; Coller, H.A. Regulation of the Let-7a-3 Promoter by NF-ΚB. PLoS ONE 2012, 7, e31240. [Google Scholar] [CrossRef]
- Careccia, S.; Mainardi, S.; Pelosi, A.; Gurtner, A.; Diverio, D.; Riccioni, R.; Testa, U.; Pelosi, E.; Piaggio, G.; Sacchi, A.; et al. A Restricted Signature of MiRNAs Distinguishes APL Blasts from Normal Promyelocytes. Oncogene 2009, 28, 4034–4040. [Google Scholar] [CrossRef]
- Pelosi, A.; Careccia, S.; Sagrestani, G.; Nanni, S.; Manni, I.; Schinzari, V.; Martens, J.H.A.; Farsetti, A.; Stunnenberg, H.G.; Gentileschi, M.P.; et al. Dual Promoter Usage as Regulatory Mechanism of Let-7c Expression in Leukemic and Solid Tumors. Mol. Cancer Res. MCR 2014, 12, 878–889. [Google Scholar] [CrossRef]
- O’Hara, S.P.; Splinter, P.L.; Gajdos, G.B.; Trussoni, C.E.; Fernandez-Zapico, M.E.; Chen, X.-M.; LaRusso, N.F. NFkappaB P50-CCAAT/Enhancer-Binding Protein Beta (C/EBPbeta)-Mediated Transcriptional Repression of MicroRNA Let-7i Following Microbial Infection. J. Biol. Chem. 2010, 285, 216–225. [Google Scholar] [CrossRef]
- Brown, C.E.; Starr, R.; Martinez, C.; Aguilar, B.; D’Apuzzo, M.; Todorov, I.; Shih, C.-C.; Badie, B.; Hudecek, M.; Riddell, S.R.; et al. Recognition and Killing of Brain Tumor Stem-like Initiating Cells by CD8+ Cytolytic T Cells. Cancer Res. 2009, 69, 8886–8893. [Google Scholar] [CrossRef] [PubMed]
- Roberts, C.M.; Shahin, S.A.; Wen, W.; Finlay, J.B.; Dong, J.; Wang, R.; Dellinger, T.H.; Zink, J.I.; Tamanoi, F.; Glackin, C.A. Nanoparticle Delivery of SiRNA against TWIST to Reduce Drug Resistance and Tumor Growth in Ovarian Cancer Models. Nanomed. Nanotechnol. Biol. Med. 2017, 13, 965–976. [Google Scholar] [CrossRef] [PubMed]
- Elliott, R.L.; Blobe, G.C. Role of Transforming Growth Factor Beta in Human Cancer. J. Clin. Oncol. Off. J. Am. Soc. Clin. Oncol. 2005, 23, 2078–2093. [Google Scholar] [CrossRef] [PubMed]
- Al Moustafa, A.-E.; Achkhar, A.; Yasmeen, A. EGF-Receptor Signaling and Epithelial-Mesenchymal Transition in Human Carcinomas. Front. Biosci. Sch. Ed. 2012, 4, 671–684. [Google Scholar] [CrossRef]
- Hojo, N.; Huisken, A.L.; Wang, H.; Chirshev, E.; Kim, N.S.; Nguyen, S.M.; Campos, H.; Glackin, C.A.; Ioffe, Y.J.; Unternaehrer, J.J. Snail Knockdown Reverses Stemness and Inhibits Tumour Growth in Ovarian Cancer. Sci. Rep. 2018, 8, 8704. [Google Scholar] [CrossRef] [PubMed]
- Yu, F.; Yao, H.; Zhu, P.; Zhang, X.; Pan, Q.; Gong, C.; Huang, Y.; Hu, X.; Su, F.; Lieberman, J.; et al. Let-7 Regulates Self Renewal and Tumorigenicity of Breast Cancer Cells. Cell 2007, 131, 1109–1123. [Google Scholar] [CrossRef] [PubMed]
- Hahn, S.; Jackstadt, R.; Siemens, H.; Hünten, S.; Hermeking, H. SNAIL and MiR-34a Feed-Forward Regulation of ZNF281/ZBP99 Promotes Epithelial-Mesenchymal Transition. EMBO J. 2013, 32, 3079–3095. [Google Scholar] [CrossRef] [PubMed]
- Li, C.-F.; Chen, J.-Y.; Ho, Y.-H.; Hsu, W.-H.; Wu, L.-C.; Lan, H.-Y.; Hsu, D.S.-S.; Tai, S.-K.; Chang, Y.-C.; Yang, M.-H. Snail-Induced Claudin-11 Prompts Collective Migration for Tumour Progression. Nat. Cell Biol. 2019, 21, 251–262. [Google Scholar] [CrossRef]
- Liu, Y.; Li, H.; Feng, J.; Cui, X.; Huang, W.; Li, Y.; Su, F.; Liu, Q.; Zhu, J.; Lv, X.; et al. Lin28 Induces Epithelial-to-Mesenchymal Transition and Stemness via Downregulation of Let-7a in Breast Cancer Cells. PLoS ONE 2013, 8, e83083. [Google Scholar] [CrossRef] [PubMed]
- Kurrey, N.K.; Jalgaonkar, S.P.; Joglekar, A.V.; Ghanate, A.D.; Chaskar, P.D.; Doiphode, R.Y.; Bapat, S.A. Snail and Slug Mediate Radioresistance and Chemoresistance by Antagonizing P53-Mediated Apoptosis and Acquiring a Stem-like Phenotype in Ovarian Cancer Cells. Stem Cells Dayt. Ohio 2009, 27, 2059–2068. [Google Scholar] [CrossRef] [PubMed]
- Wang, Y.-Y.; Yang, Y.-X.; Zhao, R.; Pan, S.-T.; Zhe, H.; He, Z.-X.; Duan, W.; Zhang, X.; Yang, T.; Qiu, J.-X.; et al. Bardoxolone Methyl Induces Apoptosis and Autophagy and Inhibits Epithelial-to-Mesenchymal Transition and Stemness in Esophageal Squamous Cancer Cells. Drug Des. Devel. Ther. 2015, 9, 993–1026. [Google Scholar] [CrossRef] [PubMed]
- Liong, M.; Lu, J.; Kovochich, M.; Xia, T.; Ruehm, S.G.; Nel, A.E.; Tamanoi, F.; Zink, J.I. Multifunctional Inorganic Nanoparticles for Imaging, Targeting, and Drug Delivery. ACS Nano 2008, 2, 889–896. [Google Scholar] [CrossRef] [PubMed]
- Marson, A.; Levine, S.S.; Cole, M.F.; Frampton, G.M.; Brambrink, T.; Johnstone, S.; Guenther, M.G.; Johnston, W.K.; Wernig, M.; Newman, J.; et al. Connecting MicroRNA Genes to the Core Transcriptional Regulatory Circuitry of Embryonic Stem Cells. Cell 2008, 134, 521–533. [Google Scholar] [CrossRef]
- Oshima, M.; Hasegawa, N.; Mochizuki-Kashio, M.; Muto, T.; Miyagi, S.; Koide, S.; Yabata, S.; Wendt, G.R.; Saraya, A.; Wang, C.; et al. Ezh2 Regulates the Lin28/Let-7 Pathway to Restrict Activation of Fetal Gene Signature in Adult Hematopoietic Stem Cells. Exp. Hematol. 2016, 44, 282–296.e3. [Google Scholar] [CrossRef]


Publisher’s Note: MDPI stays neutral with regard to jurisdictional claims in published maps and institutional affiliations. |
© 2021 by the authors. Licensee MDPI, Basel, Switzerland. This article is an open access article distributed under the terms and conditions of the Creative Commons Attribution (CC BY) license (http://creativecommons.org/licenses/by/4.0/).