
Molecular Subtypes Based on Genomic and Transcriptomic Features Correlate with the Responsiveness to Immune Checkpoint Inhibitors in Metastatic Clear Cell Renal Cell Carcinoma

 , , , and
Abstract
:Simple Summary
Abstract
1. Introduction
2. Materials and Methods
2.1. Patients
2.2. Targeted Sequencing Preprocess
2.3. RNA-Sequencing Preprocess
2.4. Immunohistochemical Analysis
2.5. GSEA (Gene Set Enrichment Analysis) and ssGSEA (Single-Sample GSEA)
2.6. Immune Cell Type and Immune Type
2.7. The Signatures of Differentially Expressed Genes (DEGs)
2.8. Statistical Analysis
2.9. Validation Sets
2.10. Cell Culture and Treatments
2.11. Real-Time qPCR
2.12. Cell Migration Assays
2.13. Colony Formation Assay
3. Results
3.1. The Characteristics of Genomic Alterations in Patients with ccRCC Treated with ICIs
3.2. The Characteristics of Molecular Subtypes in Patients with ccRCC Treated with ICIs
3.3. Subtype 2 Is Associated with Higher Metabolic Processes and Lower Exhausted Immune Types than the Other Two Subtypes
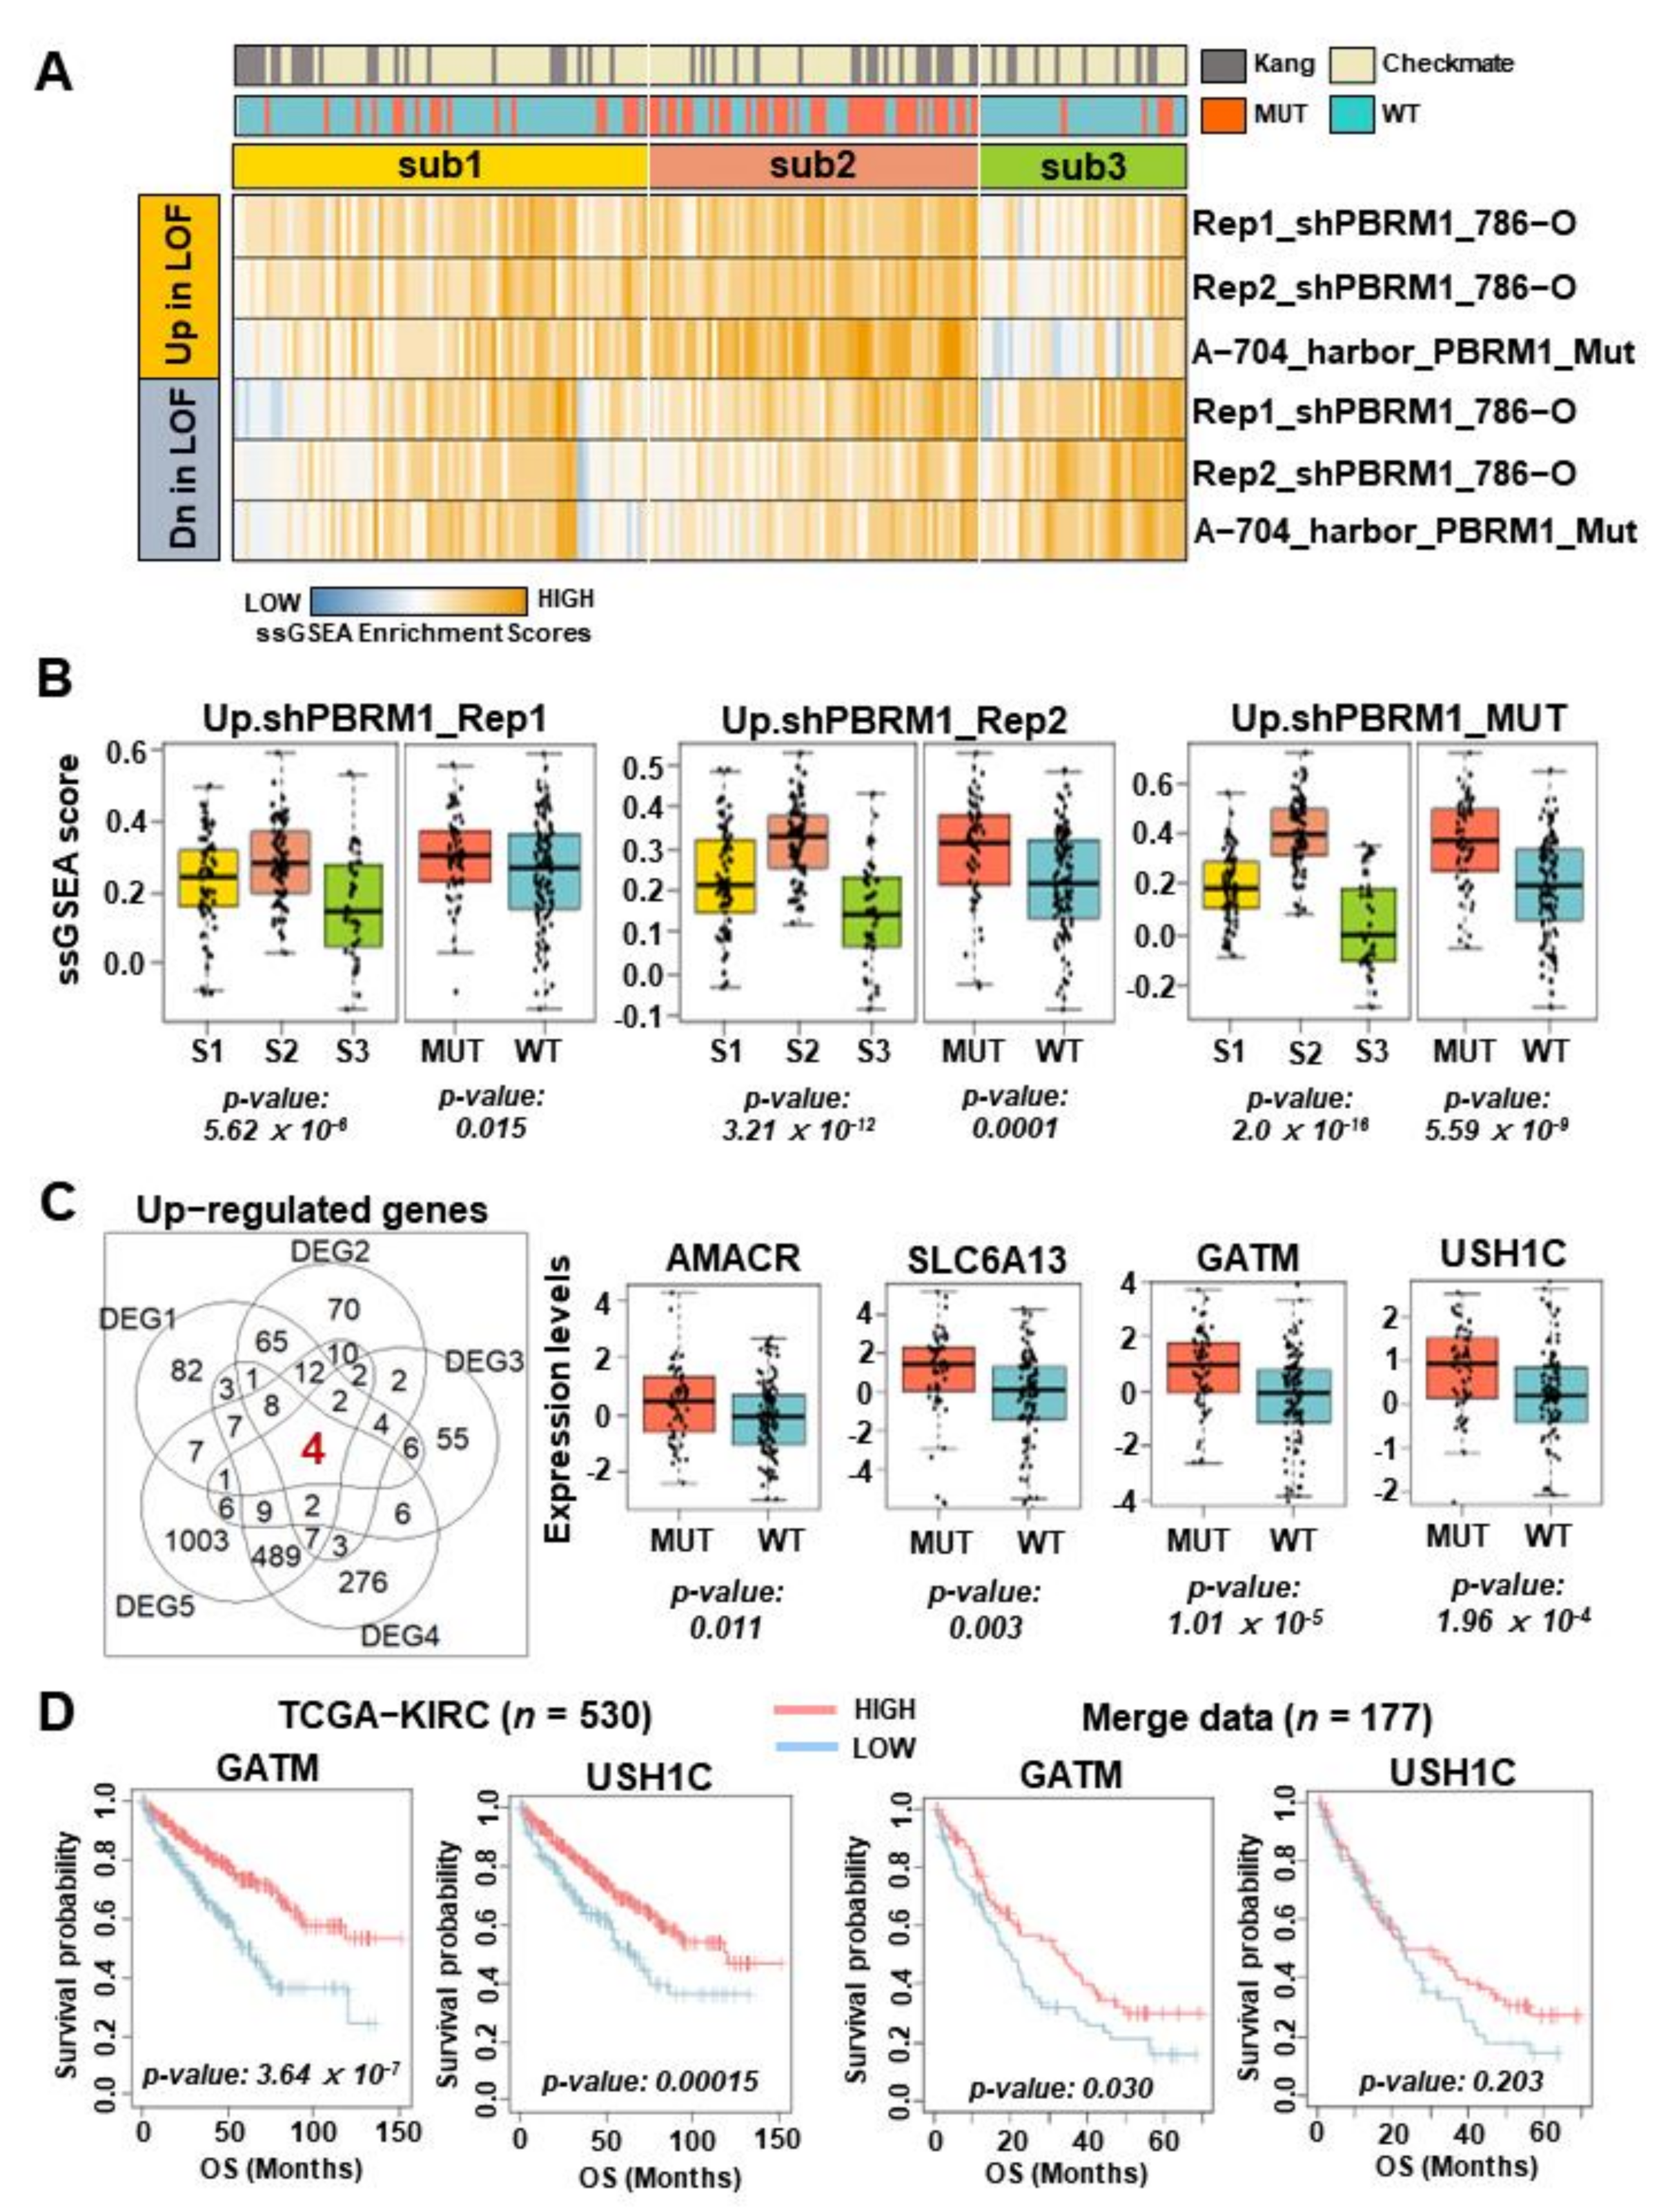
3.4. GATM Expression Associated with PBRM1 Mutation as a Novel Biomarker of Therapeutic Response in Patients with ccRCC Treated by ICIs
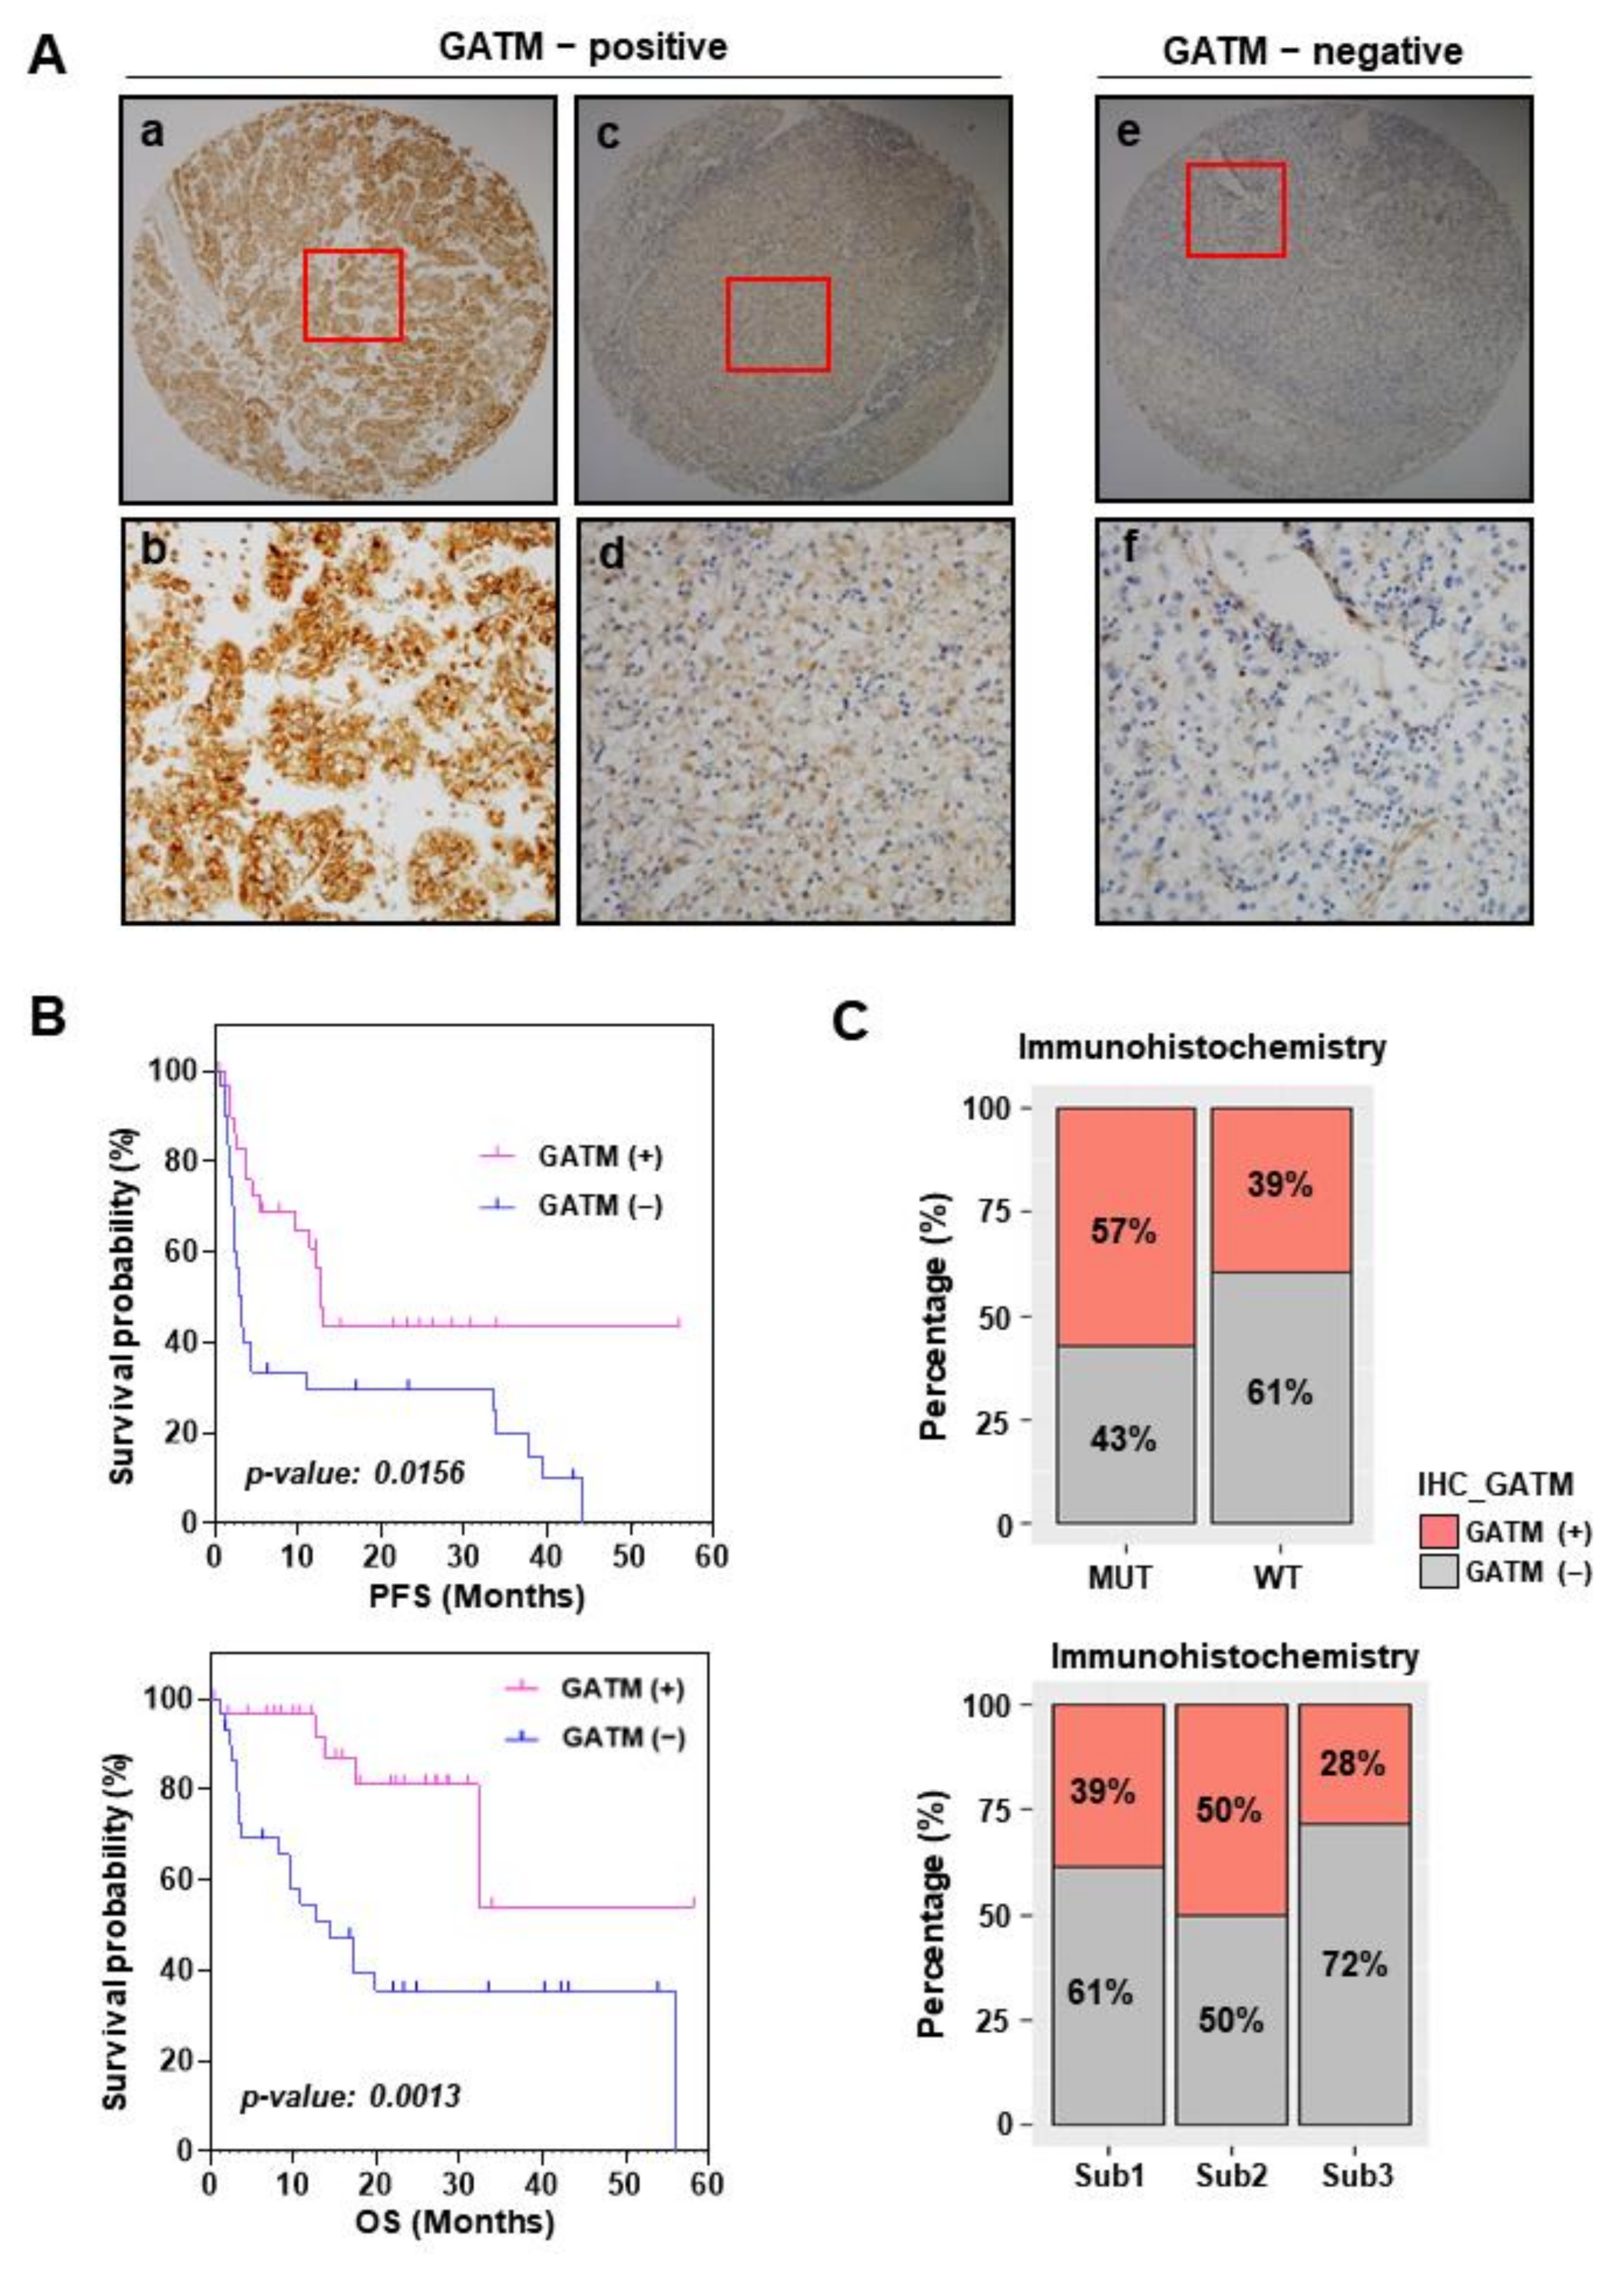
3.5. GATM Protein Levels Using Immunohistochemistry Are Related to Favorable Survival
3.6. PBRM1 Deficiency and GATM Upregulation in Stress Conditions Reduce Cell Proliferation
4. Discussion
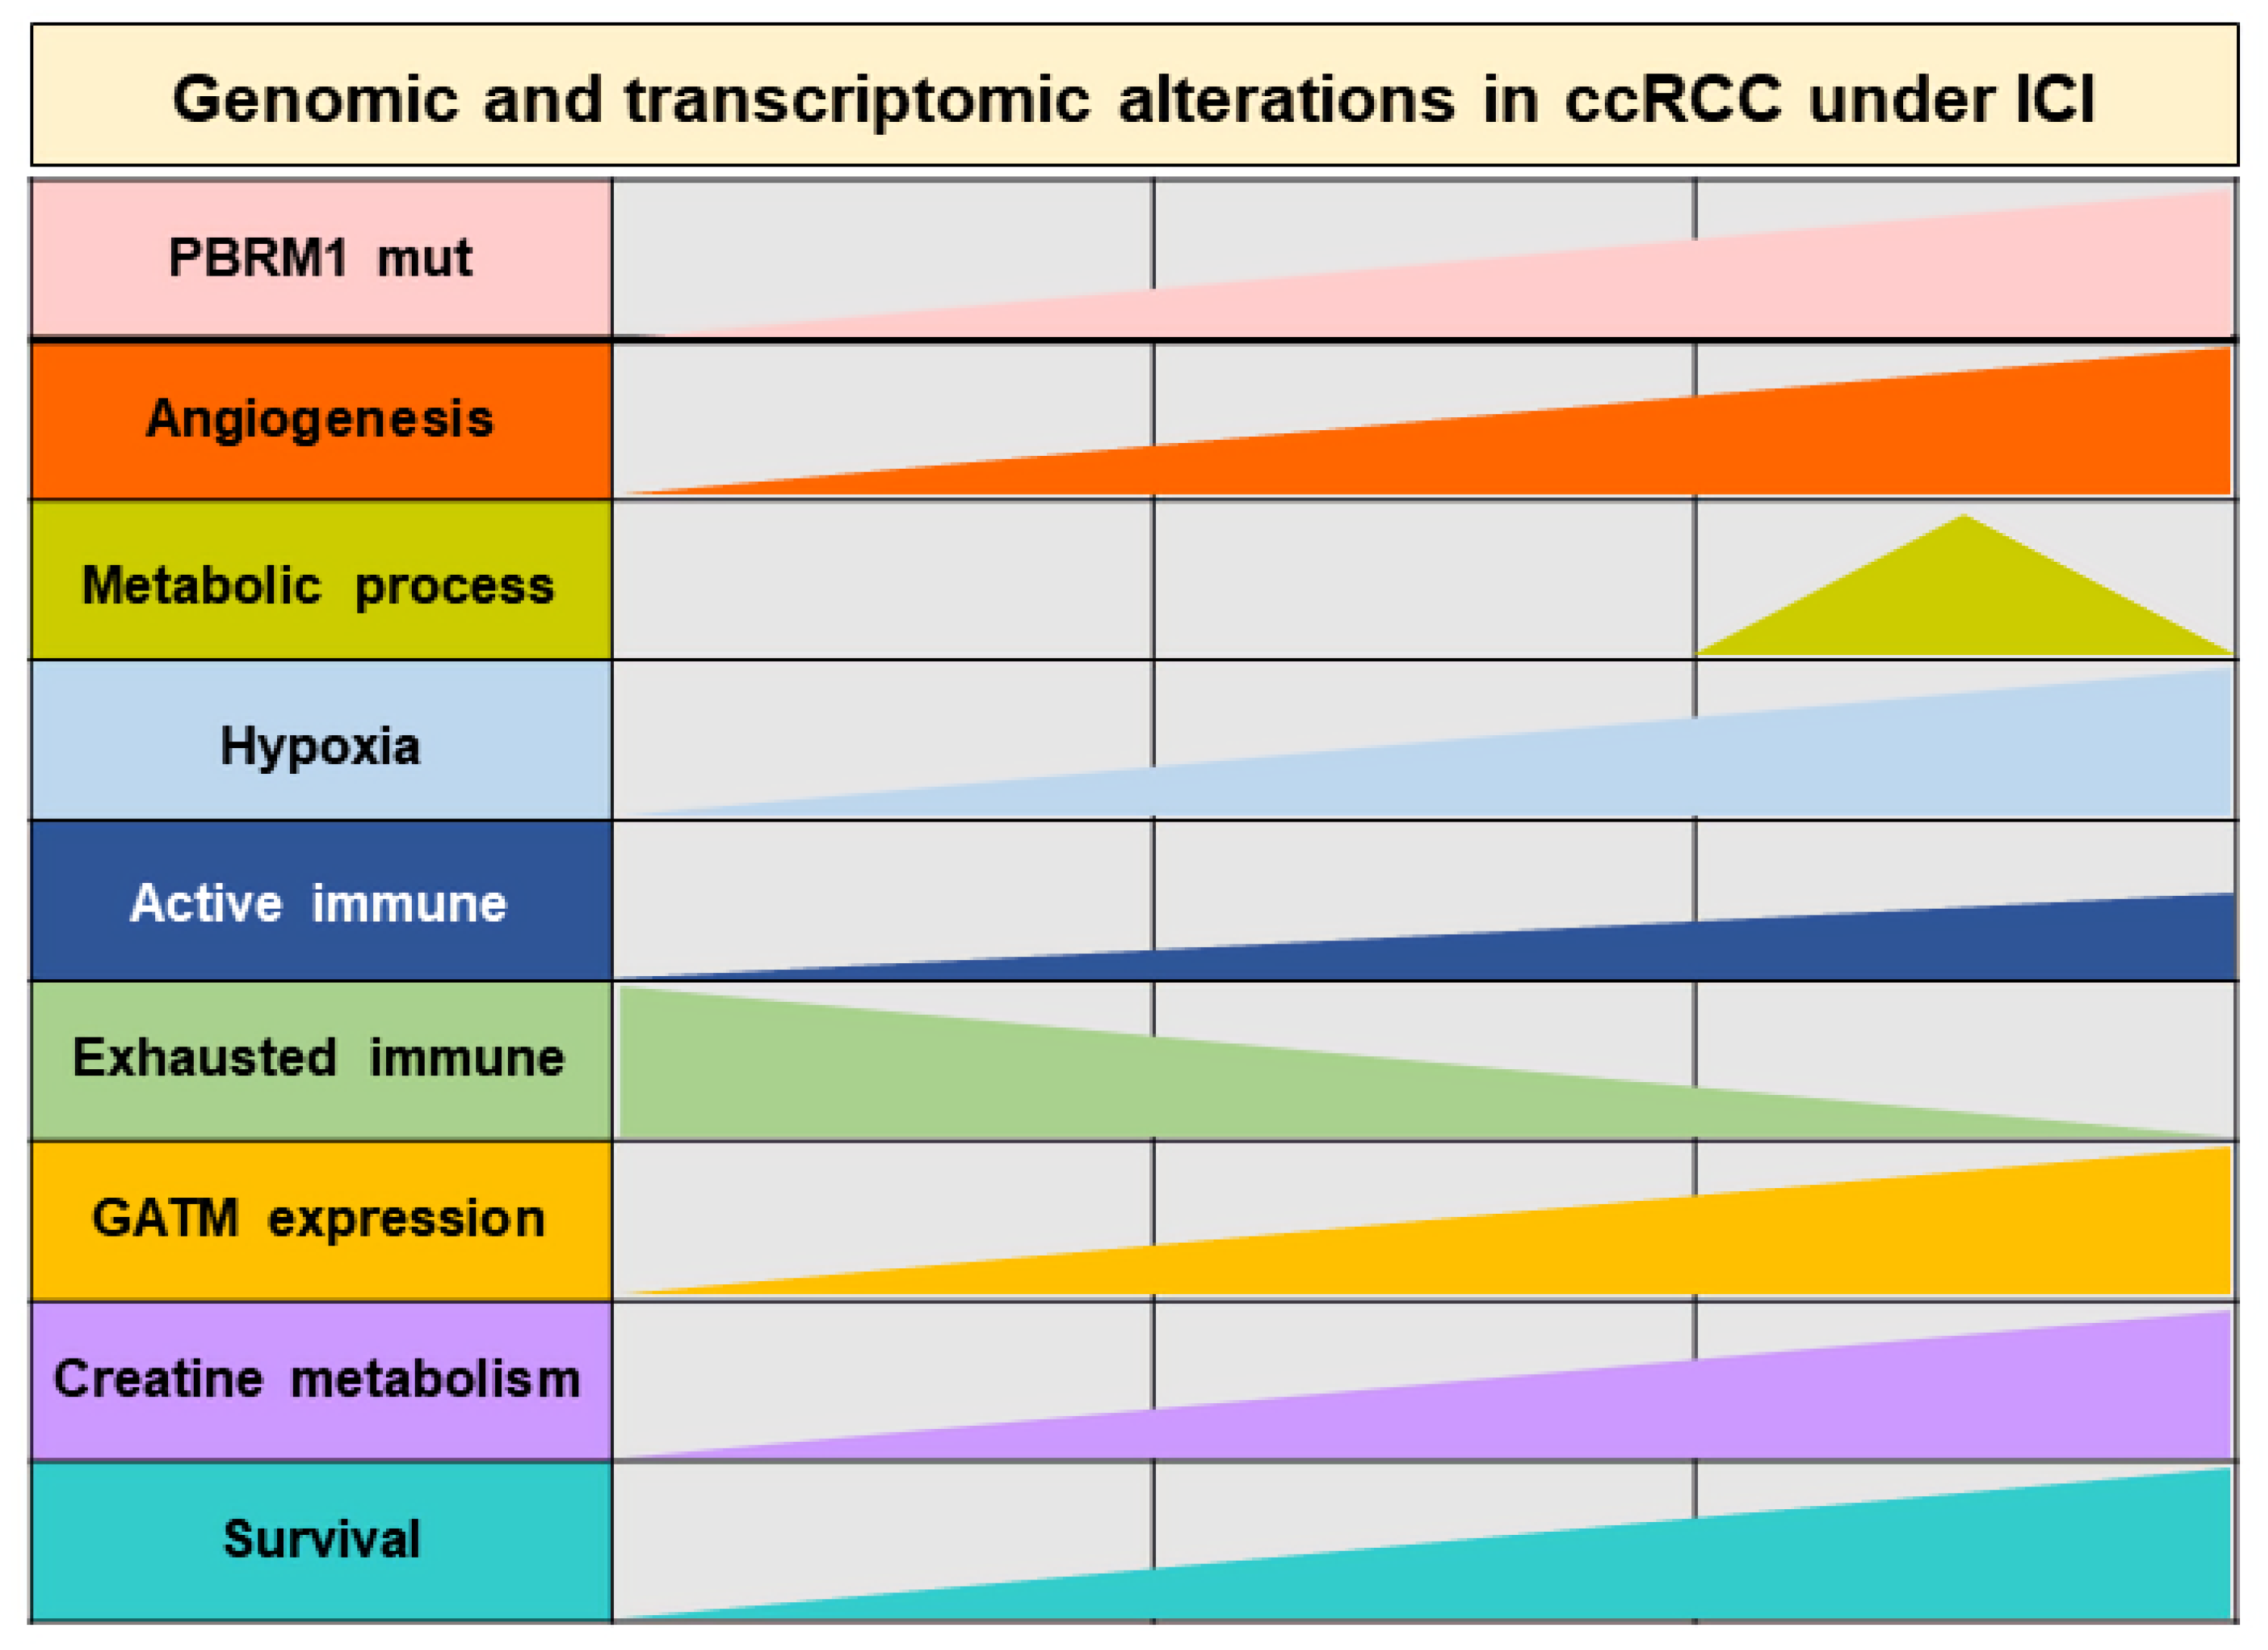
5. Conclusions
Supplementary Materials
Author Contributions
Funding
Institutional Review Board Statement
Informed Consent Statement
Data Availability Statement
Acknowledgments
Conflicts of Interest
Abbreviations
References
- Ribas, A.; Wolchok, J.D. Cancer immunotherapy using checkpoint blockade. Science 2018, 359, 1350–1355. [Google Scholar] [CrossRef] [PubMed] [Green Version]
- De Velasco, G.; Miao, D.; Voss, M.H.; Hakimi, A.A.; Hsieh, J.J.; Tannir, N.M.; Tamboli, P.; Appleman, L.J.; Rathmell, W.K.; Van Allen, E.M.; et al. Tumor Mutational Load and Immune Parameters across Metastatic Renal Cell Carcinoma Risk Groups. Cancer Immunol. Res. 2016, 4, 820–822. [Google Scholar] [CrossRef] [PubMed] [Green Version]
- Cristescu, R.; Mogg, R.; Ayers, M.; Albright, A.; Murphy, E.; Yearley, J.; Sher, X.; Liu, X.Q.; Lu, H.; Nebozhyn, M.; et al. Pan-tumor genomic biomarkers for PD-1 checkpoint blockade-based immunotherapy. Science 2018, 362, eaar3593. [Google Scholar] [CrossRef] [PubMed] [Green Version]
- Braun, D.A.; Hou, Y.; Bakouny, Z.; Ficial, M.; Sant’ Angelo, M.; Forman, J.; Ross-Macdonald, P.; Berger, A.C.; Jegede, O.A.; Elagina, L.; et al. Interplay of somatic alterations and immune infiltration modulates response to PD-1 blockade in advanced clear cell renal cell carcinoma. Nat. Med. 2020, 26, 909–918. [Google Scholar] [CrossRef]
- Motzer, R.J.; Escudier, B.; McDermott, D.F.; George, S.; Hammers, H.J.; Srinivas, S.; Tykodi, S.S.; Sosman, J.A.; Procopio, G.; Plimack, E.R.; et al. Nivolumab versus Everolimus in Advanced Renal-Cell Carcinoma. N. Engl. J. Med. 2015, 373, 1803–1813. [Google Scholar] [CrossRef]
- Motzer, R.J.; Tannir, N.M.; McDermott, D.F.; Aren Frontera, O.; Melichar, B.; Choueiri, T.K.; Plimack, E.R.; Barthelemy, P.; Porta, C.; George, S.; et al. Nivolumab plus Ipilimumab versus Sunitinib in Advanced Renal-Cell Carcinoma. N. Engl. J. Med. 2018, 378, 1277–1290. [Google Scholar] [CrossRef]
- Rini, B.I.; Plimack, E.R.; Stus, V.; Gafanov, R.; Hawkins, R.; Nosov, D.; Pouliot, F.; Alekseev, B.; Soulieres, D.; Melichar, B.; et al. Pembrolizumab plus Axitinib versus Sunitinib for Advanced Renal-Cell Carcinoma. N. Engl. J. Med. 2019, 380, 1116–1127. [Google Scholar] [CrossRef]
- Xu, W.; Atkins, M.B.; McDermott, D.F. Checkpoint inhibitor immunotherapy in kidney cancer. Nat. Rev. Urol. 2020, 17, 137–150. [Google Scholar] [CrossRef]
- Miao, D.; Margolis, C.A.; Gao, W.; Voss, M.H.; Li, W.; Martini, D.J.; Norton, C.; Bosse, D.; Wankowicz, S.M.; Cullen, D.; et al. Genomic correlates of response to immune checkpoint therapies in clear cell renal cell carcinoma. Science 2018, 359, 801–806. [Google Scholar] [CrossRef] [Green Version]
- Motzer, R.J.; Banchereau, R.; Hamidi, H.; Powles, T.; McDermott, D.; Atkins, M.B.; Escudier, B.; Liu, L.F.; Leng, N.; Abbas, A.R.; et al. Molecular Subsets in Renal Cancer Determine Outcome to Checkpoint and Angiogenesis Blockade. Cancer Cell 2020, 38, 803–817.e4. [Google Scholar] [CrossRef]
- Eisenhauer, E.A.; Therasse, P.; Bogaerts, J.; Schwartz, L.H.; Sargent, D.; Ford, R.; Dancey, J.; Arbuck, S.; Gwyther, S.; Mooney, M.; et al. New response evaluation criteria in solid tumours: Revised RECIST guideline (version 1.1). Eur. J. Cancer 2009, 45, 228–247. [Google Scholar] [CrossRef] [PubMed]
- Liberzon, A.; Birger, C.; Thorvaldsdottir, H.; Ghandi, M.; Mesirov, J.P.; Tamayo, P. The Molecular Signatures Database (MSigDB) hallmark gene set collection. Cell Syst. 2015, 1, 417–425. [Google Scholar] [CrossRef] [Green Version]
- Hanzelmann, S.; Castelo, R.; Guinney, J. GSVA: Gene set variation analysis for microarray and RNA-seq data. BMC Bioinform. 2013, 14, 7. [Google Scholar] [CrossRef] [Green Version]
- Newman, A.M.; Steen, C.B.; Liu, C.L.; Gentles, A.J.; Chaudhuri, A.A.; Scherer, F.; Khodadoust, M.S.; Esfahani, M.S.; Luca, B.A.; Steiner, D.; et al. Determining cell type abundance and expression from bulk tissues with digital cytometry. Nat. Biotechnol. 2019, 37, 773–782. [Google Scholar] [CrossRef] [PubMed]
- Sia, D.; Jiao, Y.; Martinez-Quetglas, I.; Kuchuk, O.; Villacorta-Martin, C.; Castro de Moura, M.; Putra, J.; Camprecios, G.; Bassaganyas, L.; Akers, N.; et al. Identification of an Immune-specific Class of Hepatocellular Carcinoma, Based on Molecular Features. Gastroenterology 2017, 153, 812–826. [Google Scholar] [CrossRef] [PubMed] [Green Version]
- Pena-Llopis, S.; Vega-Rubin-de-Celis, S.; Liao, A.; Leng, N.; Pavia-Jimenez, A.; Wang, S.; Yamasaki, T.; Zhrebker, L.; Sivanand, S.; Spence, P.; et al. BAP1 loss defines a new class of renal cell carcinoma. Nat. Genet. 2012, 44, 751–759. [Google Scholar] [CrossRef] [PubMed]
- Liu, X.D.; Kong, W.; Peterson, C.B.; McGrail, D.J.; Hoang, A.; Zhang, X.; Lam, T.; Pilie, P.G.; Zhu, H.; Beckermann, K.E.; et al. PBRM1 loss defines a nonimmunogenic tumor phenotype associated with checkpoint inhibitor resistance in renal carcinoma. Nat. Commun. 2020, 11, 2135. [Google Scholar] [CrossRef]
- Gao, W.; Li, W.; Xiao, T.; Liu, X.S.; Kaelin, W.G., Jr. Inactivation of the PBRM1 tumor suppressor gene amplifies the HIF-response in VHL-/- clear cell renal carcinoma. Proc. Natl. Acad. Sci. USA 2017, 114, 1027–1032. [Google Scholar] [CrossRef] [Green Version]
- Meng, J.; Lu, X.; Zhou, Y.; Zhang, M.; Ge, Q.; Zhou, J.; Hao, Z.; Gao, S.; Yan, F.; Liang, C. Tumor immune microenvironment-based classifications of bladder cancer for enhancing the response rate of immunotherapy. Mol. Ther. Oncolytics 2021, 20, 410–421. [Google Scholar] [CrossRef]
- Meng, J.; Zhou, Y.; Lu, X.; Bian, Z.; Chen, Y.; Zhou, J.; Zhang, L.; Hao, Z.; Zhang, M.; Liang, C. Immune response drives outcomes in prostate cancer: Implications for immunotherapy. Mol. Oncol. 2021, 15, 1358–1375. [Google Scholar] [CrossRef]
- Piva, F.; Santoni, M.; Matrana, M.R.; Satti, S.; Giulietti, M.; Occhipinti, G.; Massari, F.; Cheng, L.; Lopez-Beltran, A.; Scarpelli, M.; et al. BAP1, PBRM1 and SETD2 in clear-cell renal cell carcinoma: Molecular diagnostics and possible targets for personalized therapies. Expert Rev. Mol. Diagn. 2015, 15, 1201–1210. [Google Scholar] [CrossRef] [PubMed]
- Di Biase, S.; Ma, X.; Wang, X.; Yu, J.; Wang, Y.C.; Smith, D.J.; Zhou, Y.; Li, Z.; Kim, Y.J.; Clarke, N.; et al. Creatine uptake regulates CD8 T cell antitumor immunity. J. Exp. Med. 2019, 216, 2869–2882. [Google Scholar] [CrossRef] [PubMed] [Green Version]
- Miller, E.E.; Evans, A.E.; Cohn, M. Inhibition of rate of tumor growth by creatine and cyclocreatine. Proc. Natl. Acad. Sci. USA 1993, 90, 3304–3308. [Google Scholar] [CrossRef] [PubMed] [Green Version]
- Beuselinck, B.; Job, S.; Becht, E.; Karadimou, A.; Verkarre, V.; Couchy, G.; Giraldo, N.; Rioux-Leclercq, N.; Molinie, V.; Sibony, M.; et al. Molecular subtypes of clear cell renal cell carcinoma are associated with sunitinib response in the metastatic setting. Clin. Cancer Res. 2015, 21, 1329–1339. [Google Scholar] [CrossRef] [PubMed] [Green Version]
- Brannon, A.R.; Reddy, A.; Seiler, M.; Arreola, A.; Moore, D.T.; Pruthi, R.S.; Wallen, E.M.; Nielsen, M.E.; Liu, H.; Nathanson, K.L.; et al. Molecular Stratification of Clear Cell Renal Cell Carcinoma by Consensus Clustering Reveals Distinct Subtypes and Survival Patterns. Genes Cancer 2010, 1, 152–163. [Google Scholar] [CrossRef] [PubMed]
- Hakimi, A.A.; Voss, M.H.; Kuo, F.; Sanchez, A.; Liu, M.; Nixon, B.G.; Vuong, L.; Ostrovnaya, I.; Chen, Y.B.; Reuter, V.; et al. Transcriptomic Profiling of the Tumor Microenvironment Reveals Distinct Subgroups of Clear Cell Renal Cell Cancer: Data from a Randomized Phase III Trial. Cancer Discov. 2019, 9, 510–525. [Google Scholar] [CrossRef] [Green Version]
- Bacigalupa, Z.A.; Rathmell, W.K. Beyond glycolysis: Hypoxia signaling as a master regulator of alternative metabolic pathways and the implications in clear cell renal cell carcinoma. Cancer Lett. 2020, 489, 19–28. [Google Scholar] [CrossRef]
- Hakimi, A.A.; Reznik, E.; Lee, C.H.; Creighton, C.J.; Brannon, A.R.; Luna, A.; Aksoy, B.A.; Liu, E.M.; Shen, R.; Lee, W.; et al. An Integrated Metabolic Atlas of Clear Cell Renal Cell Carcinoma. Cancer Cell 2016, 29, 104–116. [Google Scholar] [CrossRef] [Green Version]
- Linehan, W.M.; Schmidt, L.S.; Crooks, D.R.; Wei, D.; Srinivasan, R.; Lang, M.; Ricketts, C.J. The Metabolic Basis of Kidney Cancer. Cancer Discov. 2019, 9, 1006–1021. [Google Scholar] [CrossRef] [Green Version]
- Pandey, N.; Lanke, V.; Vinod, P.K. Network-based metabolic characterization of renal cell carcinoma. Sci. Rep. 2020, 10, 5955. [Google Scholar] [CrossRef]
- Chen, Y.P.; Wang, Y.Q.; Lv, J.W.; Li, Y.Q.; Chua, M.L.K.; Le, Q.T.; Lee, N.; Colevas, A.D.; Seiwert, T.; Hayes, D.N.; et al. Identification and validation of novel microenvironment-based immune molecular subgroups of head and neck squamous cell carcinoma: Implications for immunotherapy. Ann. Oncol. 2019, 30, 68–75. [Google Scholar] [CrossRef] [PubMed]
- Jee, B.A.; Choi, J.H.; Rhee, H.; Yoon, S.; Kwon, S.M.; Nahm, J.H.; Yoo, J.E.; Jeon, Y.; Choi, G.H.; Woo, H.G.; et al. Dynamics of Genomic, Epigenomic, and Transcriptomic Aberrations during Stepwise Hepatocarcinogenesis. Cancer Res. 2019, 79, 5500–5512. [Google Scholar] [CrossRef] [PubMed] [Green Version]
- Fairman, C.M.; Kendall, K.L.; Hart, N.H.; Taaffe, D.R.; Galvao, D.A.; Newton, R.U. The potential therapeutic effects of creatine supplementation on body composition and muscle function in cancer. Crit. Rev. Oncol. Hematol. 2019, 133, 46–57. [Google Scholar] [CrossRef] [PubMed]
- Li, B.; Yang, L. Creatine in T Cell Antitumor Immunity and Cancer Immunotherapy. Nutrients 2021, 13, 1633. [Google Scholar] [CrossRef] [PubMed]


| Variables | Univariate Analysis | Multivariate Analysis | |||
|---|---|---|---|---|---|
| HR (95% CI) | p-Value | HR (95% CI) | p-Value | ||
| Age | <Median | Reference | - | Reference | - |
| ≥Median | 0.855 (0.58–1.26) | 0.428 | 0.895 (0.599–1.339) | 0.589 | |
| Sex | Female | Reference | - | Reference | - |
| Male | 2.047 (1.235–3.394) | 0.005 ** | 1.576 (0.939–2.645) | 0.085 | |
| IMDC | Favor | Reference | - | Reference | - |
| Intermediate & Poor | 2.134 (1.336–3.409) | 0.0015 ** | 2.012 (1.252–3.233) | 0.004 ** | |
| PBRM1 & GATM | MUT & HIGH | Reference | - | Reference | - |
| MUT & LOW, WT & HIGH, and WT & LOW | 2.532 (1.414–4.532) | 0.0017 ** | 2.067 (1.147–3.726) | 0.016 * | |
Publisher’s Note: MDPI stays neutral with regard to jurisdictional claims in published maps and institutional affiliations. |
© 2022 by the authors. Licensee MDPI, Basel, Switzerland. This article is an open access article distributed under the terms and conditions of the Creative Commons Attribution (CC BY) license (https://creativecommons.org/licenses/by/4.0/).
Share and Cite
Jee, B.; Seo, E.; Park, K.; Kim, Y.R.; Byeon, S.-j.; Lee, S.M.; Chung, J.H.; Song, W.; Sung, H.H.; Jeon, H.G.; et al. Molecular Subtypes Based on Genomic and Transcriptomic Features Correlate with the Responsiveness to Immune Checkpoint Inhibitors in Metastatic Clear Cell Renal Cell Carcinoma. Cancers 2022, 14, 2354. https://doi.org/10.3390/cancers14102354
Jee B, Seo E, Park K, Kim YR, Byeon S-j, Lee SM, Chung JH, Song W, Sung HH, Jeon HG, et al. Molecular Subtypes Based on Genomic and Transcriptomic Features Correlate with the Responsiveness to Immune Checkpoint Inhibitors in Metastatic Clear Cell Renal Cell Carcinoma. Cancers. 2022; 14(10):2354. https://doi.org/10.3390/cancers14102354
Chicago/Turabian StyleJee, ByulA, Eunjeong Seo, Kyunghee Park, Yi Rang Kim, Sun-ju Byeon, Sang Min Lee, Jae Hoon Chung, Wan Song, Hyun Hwan Sung, Hwang Gyun Jeon, and et al. 2022. "Molecular Subtypes Based on Genomic and Transcriptomic Features Correlate with the Responsiveness to Immune Checkpoint Inhibitors in Metastatic Clear Cell Renal Cell Carcinoma" Cancers 14, no. 10: 2354. https://doi.org/10.3390/cancers14102354