Simple Summary
We studied cancer survival and its trends in adult patients in Spain. We included more than 600,000 patients with primary cancer diagnosed during 2002–2013 and followed them up to 2015. The study provides cancer survival estimates up to five years after diagnosis by sex and age for 29 cancer groups. We found survival improvements for most cancer groups from 2002–2007 to 2008–2013, although with differences by age, being greater for patients younger than 75 years than for older patients. The persistent poor prognosis for some cancers emphasizes the need to reinforce actions along the cancer continuum, from primary prevention to early diagnosis, optimal treatment, and supportive care. Further examination of possible sociodemographic inequalities is warranted.
Abstract
The assessment of cancer survival at the population level is essential for monitoring progress in cancer control. We aimed to assess cancer survival and its trends in adults in Spain. Individual records of 601,250 adults with primary cancer diagnosed during 2002–2013 and followed up to 2015 were included from 13 population-based cancer registries. We estimated net survival up to five years after diagnosis and analyzed absolute changes between 2002–2007 and 2008–2013. Estimates were age-standardized. Analyses were performed for 29 cancer groups, by age and sex. Overall, age-standardized five-year net survival was higher in women (61.7%, 95% CI 61.4–62.1%) than in men (55.3%, 95% CI 55.0–55.6%), and ranged by cancer from 7.2% (pancreas) to 89.6% (prostate) in men, and from 10.0% (pancreas) to 93.1% (thyroid) in women in the last period. Survival declined with age, showing different patterns by cancer. Between both periods, age-standardized five-year net survival increased overall by 3.3% (95% CI 3.0–3.7%) in men and 2.5% (95% CI 2.0–3.0%) in women, and for most cancer groups. Improvements were greater in patients younger than 75 years than in older patients. Chronic myeloid leukemia and myeloma showed the largest increases. Among the most common malignancies, the greatest absolute increases in survival were observed for colon (5.0%, 95% CI 4.0–6.0%) and rectal cancers (4.5%, 95% CI 3.2–5.9%). Survival improved even for some cancers with poor prognosis (pancreas, esophagus, lung, liver, and brain cancer). Further investigation of possible sociodemographic inequalities is warranted. This study contributes to the evaluation of cancer control and health services’ effectiveness.
1. Introduction
Cancer is a major cause of morbidity and mortality globally. Recent World Health Organization (WHO) estimates showed that cancer is the first leading cause of premature death (before 70 years of age) in 57 of 183 countries, including Spain, and ranks second in a further 55 countries [1]. In 2020 in Spain, with projected 280,000 new cancer cases [2], and 113,000 cancer deaths, the disease remains the first cause of death in men and the second in women, accounting for 27% and 19% of all deaths, respectively [3].
Population-based cancer survival, in addition to being a fundamental measure to describe the prognosis of cancer patients, is an indicator of the overall performance of health services across the patient pathway, from early detection and diagnosis to treatment and follow-up. Moreover, wide regional and international differences have been revealed, largely reflecting socioeconomic inequalities and differences in the effectiveness of health systems [4,5,6]. Hence, cancer survival estimates are of great importance to patients, clinicians, public health professionals, and policymakers.
The CONCORD-3 Programme updated the worldwide 5-year survival estimates to 2014 (2013 for Spanish adults) for 18 groups of cancers, however it did not provide data by sex nor by age group at the country level [4]. The latest specific study on survival of cancer patients in Spain, performed by the Spanish Network of Cancer Registries (REDECAN), provided results for patients diagnosed up to 2007 [7], therefore, detailed and more up-to-date estimates are needed.
The aims of this study were (1) to provide cancer survival estimates for adult patients, diagnosed during 2008–2013 in Spain, overall and for 29 cancer groups by sex and age group, and (2) to assess survival trends between 2002–2007 and 2008–2013.
2. Materials and Methods
2.1. Study Design and Population
We conducted an observational study using data from 13 population-based cancer registries (Asturias, Canary Islands, Castellón, Ciudad Real, Cuenca, Basque Country, Girona, Granada, La Rioja, Mallorca, Murcia, Navarra and Tarragona), covering more than 12 million inhabitants that represent ~26% of the Spanish population of 2013. All the participating cancer registries follow standard registration procedures and have met the high standards of comparability, completeness and validity for inclusion in the series Cancer Incidence in Five Continents, published quinquennially by the International Agency for Research on Cancer (IARC) [8]. Most registries provided data for the entire study period and all included at least three years of each comparison period (Supplementary Table S1).
We selected the cancer registration records for adults (aged 15–99 years) diagnosed between 2002 and 2013 with a primary malignant neoplasm, except non-melanoma skin cancer. Tumor anatomical site (topography) and morphology were coded according to the International Classification of Disease for Oncology, 3rd edition (ICD-O-3) [9]. The international rules for registering multiple primary neoplasms were applied [10], to enable comparison of the results with other studies. Patients who had more than one primary cancer were included in the analyses for each cancer. Only invasive malignancies (ICD-O-3 behaviour code 3) were included, except for the bladder, for which tumors with uncertain or borderline malignancy and in situ (behavior codes 1 and 2) were also included, to ensure comparability. Cases known to the registry only through the death certificate (DCO) and cases diagnosed at autopsy were excluded from the analyses, since their survival time was unknown.
Analyses were performed for all cancers combined and separately for 29 cancer groups that jointly represent more than 90% of all cancer cases. Cancer groups were defined by topography and morphology. The WHO classification and the HAEMACARE guidelines were followed for grouping the hematological malignancies [11,12]. For presentation, the ICD-O-3 codes were converted to the International Classification of Diseases, Tenth Revision (ICD-10) codes by using the software IARCcrg Tools v2.13 (IARC, Lyon, France). Table 1 shows the cancer groups analyzed and the respective ICD-10 codes.

Table 1.
Cancer groups, number of cases included and data quality indicators, 2002–2013.
2.2. Follow-Up for Vital Status
Vital status follow-up until the end of 2015 was carried out using multiple sources of information in all cancer registries, such as the regional mortality registries, National Death Index, social security database, hospital and primary care records and population censuses, as needed and available in each registry.
2.3. Quality Control
In addition to the quality controls performed in each cancer registry, extensive data quality checks were undertaken on the joint database, including those proposed by EUROCARE-5 [13], using IARCcrg Tools v2.13 (IARC, Lyon, France), JRC-ENCR Quality Check Software v1.8.1 (ENCR, Ispra, Italy), and automated ad-hoc checks. The records with definite or possible errors were returned to the registries for verification, correction and resubmission.
We assessed the proportions of cases microscopically verified and cases with non-specific morphology. We also evaluated the percentage of patients lost to follow-up, defined as cases censored alive before five years from diagnosis unless they were censored due to the end of follow-up (31 December 2015).
2.4. Statistical Analyses
We estimated observed and net survival up to five years after diagnosis, with 95% confidence intervals (CIs), for adults diagnosed during 2002 through 2007 and 2008 through 2013, by sex and age group for each cancer group. The Kaplan-Meier and Pohar-Perme methods were used to obtain observed and net survival estimates, respectively [14]. Net survival is the probability of being alive at a certain time following diagnosis after controlling for other causes of death (background mortality). To control for background mortality, we built life tables of all-cause death rates in the general population for each province, by single year of age, sex, and calendar year of death. The source of population and death data was the Spanish National Institute of Statistics. Life tables were interpolated and smoothed by the Elandt-Johnson method [15]. The cohort approach was adopted for patients diagnosed in 2002–2007 and the period approach for those diagnosed in 2008–2013 [16], given that follow-up was carried out up to 2015, thus a complete 5-year follow-up was not available for all the cases incident during the latter period.
To allow comparisons over time and with other studies, net survival estimates were age-standardized using the cancer-specific weights from the International Cancer Survival Standards (ICSS) [17]. The ICSS age groups are defined as 15–44, 45–54, 55–64, 65–74 and ≥75 years, with a variation for prostate cancer patients (15–54, 55–64, 65–74, 75–84 and ≥85). We present age-standardized net survival (ASNS) at 1, 3 and 5 years post-diagnosis and at 5 years post-diagnosis, conditional on having survived 1 year. The latter was obtained by restricting the analysis to patients who survived at least 1 year. The 95% CIs were calculated from the standard errors using the Greenwood formula [18].
Absolute changes in survival between both periods were measured as the arithmetic difference between ASNS estimates (ASNS 2008–2013—ASNS 2002–2007), for instance, a change in survival from 10% to 15% is reported as an increase of 5% (not 50%). A change was considered statistically significant if the 95% CI did not include zero. Trends were analyzed for all ages by sex and for two broad age groups (<75 and ≥75 years at diagnosis).
The analyses were performed using STATA 15.1 (Stata Corporation, College Station, TX, USA), and specifically the stns command to estimate net survival [19].
3. Results
3.1. Study Population and Quality Indicators
A total of 601,250 adult patients diagnosed with cancer (except non-melanoma skin cancer) over the 12-year period were included in the study, representing 98.1% of the eligible cases. The remaining 1.9% (11,723 cases) were excluded because they were DCO or diagnosed at autopsy. Men accounted for 60.4% (363,144 cases) of the study population and the mean age ±SD was 68 ±13 and 65 ±16 years in men and women, respectively. The number of cases and data quality indicators by cancer group are shown in Table 1. A high proportion of diagnoses were microscopically verified: 91% overall and ≥80% in all cancer groups with the exception of liver, pancreas, gallbladder and brain cancers. About 9% of tumors were recorded with a non-specific morphology, and only 0.23% of patients were lost to follow-up.
3.2. Cancer Survival in Patients Diagnosed in 2008–2013
The 5-year observed survival (5y-OS) and net survival (5y-NS) estimates in patients diagnosed during the last six-year period (2008–2013) are shown in Table 2. For all cancers combined, 5y-OS was 47.4% and 57.4% in men and women, respectively; and 5y-NS, i.e., survival after controlling for other causes of death, was 54.3% and 62.0% in men and women, respectively. By cancer group, the lowest 5y-NS (<10%) was found for pancreatic cancer in men and women while the highest (≥95%) was observed for testicular cancer in men and thyroid cancer in women. The largest differences between 5y-OS and 5y-NS were found for prostate cancer (78% vs. 90%) and chronic lymphoid leukemia (62.5% vs. 73.6% in both sexes), while the smallest differences were seen for brain cancer (13.7% vs. 14.1% in both sexes).
Table 2.
Five-year observed survival (OS) and net survival (NS) by sex in adult patients diagnosed with cancer in Spain in 2008–2013.
Age-specific 5y-NS estimates by sex for each cancer group in 2008–2013 are shown in Figure 1 and are detailed for men, women and both sexes in Supplementary Table S2. Survival declined with age at diagnosis, although for some cancers it occurred only after a certain age, for instance, for colon, rectal, breast and testicular cancers after the age of 65 years and for prostate cancer after 75 years. The downward trend over age was steeper for chronic myeloid leukemia, myeloma, prostate and brain cancer in men and for Hodgkin lymphoma, acute myeloid leukemia, brain and ovarian cancer in women.
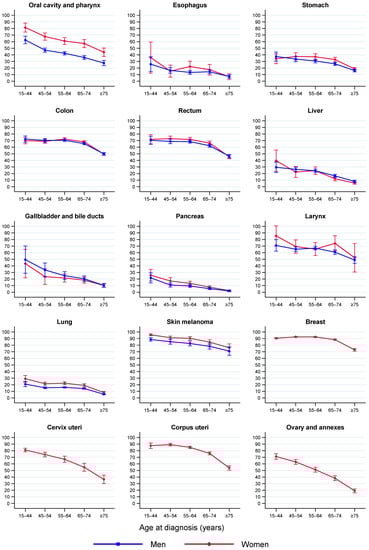
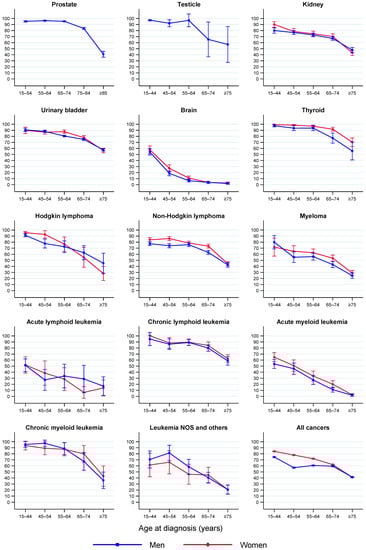
Figure 1.
Five-year net survival by age group and sex in adult patients diagnosed with cancer in Spain in 2008–2013. Error bars are 95% CIs. The “all cancers” category excludes non-melanoma skin cancer. Abbreviations: NOS, not otherwise specified.
Table 3 shows the ASNS at one, three, and five years following diagnosis, and at five years following diagnosis conditional on having survived 1 year (5|1 years). The ASNS at the first year was 74.7% (95% CI 74.6–74.9%) overall and varied by cancer group from <40% for pancreas, esophagus and lung cancers to ≥95% for skin melanoma, female breast and prostate cancers. We observed a 5y-ASNS of 58.2% (95% CI 58.0–58.4%) overall, ranging from <20% for the pancreas, esophagus, lung, and liver cancer to ≥80% for cancers of the thyroid, prostate, testicle, skin melanoma, female breast, and Hodgkin lymphoma. The 5|1y-ASNS was 77.1% (95% CI 76.8–77.3%) for all cancers combined, and it was more than 20 percentage points higher than the 5y-ASNS for cancer of the esophagus, stomach, gallbladder and acute lymphoid leukemia.
Table 3.
Age-standardised net survival at one, three and five years post-diagnosis and at five years post-diagnosis conditional on having survived one year, in adult patients diagnosed with cancer in Spain in 2008–2013.
The 5y-ASNS in 2008–2013 was higher in women than in men overall and for 12 cancer groups: oral cavity and pharynx, stomach, rectum, pancreas, lung, skin melanoma, urinary bladder, brain, thyroid, non-Hodgkin lymphoma, myeloma and acute myeloid leukemia (Table 4). For the remaining cancer groups, the 5y-ASNS was similar in both sexes. The most pronounced female survival advantage was found for cancer of the oral cavity and pharynx, with 5y-ASNS of 38.2% (95% CI 36.6–39.9%) in men vs. 57.2% (95% CI 54.4–60.2%) in women.
Table 4.
Five-year age-standardised net survival (ASNS) in men and women diagnosed with cancer in Spain in 2002–2007 and 2008–2013 and absolute change between periods.
3.3. Survival Trends between 2002–2007 and 2008–2013
In both sexes together, there were significant increases in survival overall and for most of the cancer groups between 2002–2007 and 2008–2013, as shown in Figure 2. The 5y-ASNS increased by more than 5% in patients with thyroid cancer, chronic myeloid leukemia, non-Hodgkin lymphoma and myeloma. Absolute increases of 3–5% were observed for kidney, colon, rectum, ovary and annexes, acute myeloid leukemia and esophageal cancer. In addition, increases of 1–3% in the 5y-ASNS were found in patients with cancer of the prostate, skin melanoma, female breast, urinary bladder, oral cavity and pharynx, brain, liver, lung, and pancreas. The trend was stable for the remaining cancer groups.
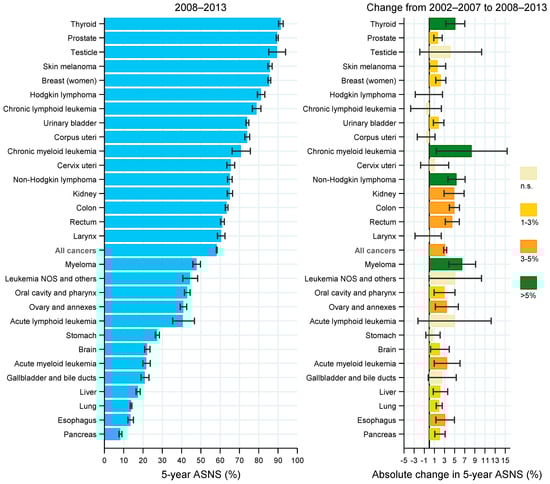
Figure 2.
Five-year age-standardized net survival by cancer group in patients diagnosed with cancer in Spain in 2008–2013 (left panel) and absolute change from 2002–2007 to 2008–2013 (right panel). Error bars are 95% CIs. Abbreviations: ASNS, age-standardized net survival; n.s., non-statistically significant change (i.e., 95% CI includes zero).
The trend analysis by sex (Table 4) showed that the 5y-ASNS for all cancers combined increased between the two periods from 52.0% (95% CI 51.7–52.2%) to 55.3% (95% CI 55.0–55.6%) in men, and from 59.2% (95% CI 58.9–59.6%) to 61.7% (95% CI 61.4–62.1%) in women. The increases in 5y-ASNS for cancer of the colon, rectum, pancreas, kidney, urinary bladder, thyroid, non-Hodgkin lymphoma and myeloma were observed in both men and women. An upward trend in 5y-ASNS for cancer of the esophagus, liver, lung, skin melanoma, and chronic myeloid leukemia was found only in men, while it remained stable in women. Increased 5y-ASNS for cancer of the oral cavity and pharynx, brain, acute myeloid leukemia, and the group of leukemia not otherwise specified (NOS) and others was observed only in women, whereas it did not change in men. There were no significant decreases in survival in men or women for any cancer group.
Among the most common cancers, the largest increases in the 5y-ASNS were found for colon cancer, from 57.5% to 63.1% in men and from 59.8% to 63.9% in women, and for rectal cancer, from 55.8% to 60.4% in men and from 58.1% to 62.7% in women. In addition, the 5y-ASNS for prostate cancer increased from 87.8% to 89.6%, and for female breast cancer from 83.2% to 85.5%. For patients with lung cancer the figures moved from 11.2% to 12.7% in men and from 16.2% to 17.6% in women, although the change in women was not statistically significant. Increases in the 5y-ASNS were also seen for urinary bladder tumors in men (by 1.6%) and women (by 3.0%). However, for corpus uteri cancer the 5y-ASNS remained unchanged between the first and second periods, 74.6% vs. 74.0%, respectively (Table 4).
The results of the trend analysis according to age group at diagnosis are shown in Table 5. In patients younger than 75 years, the 5y-ASNS increased for all cancers combined (by 4.5%, 95% CI 4.1 to 4.8%) and for 20 cancer groups. By contrast, in patients aged 75 years and older, the 5y-ASNS was stable for all cancers combined (absolute change of −0.1%, 95% CI −0.8 to 0.5%) and increased only for five cancer groups (colon, thyroid, non-Hodgkin lymphoma, myeloma, and acute lymphoid leukemia). Although an upward trend was observed mainly in patients younger than 75 years, in the older age group there were larger increases for thyroid cancer and acute lymphoid leukemia.
Table 5.
Five-year age-standardised net survival (ASNS) in patients diagnosed with cancer in Spain in 2002–2007 and 2008–2013 and absolute change between periods according to age group at diagnosis.
4. Discussion
The present study provides a comprehensive overview of cancer survival in Spain using the most up-to-date data from population-based cancer registries. More than 600,000 adult patients diagnosed until 2013 and followed up to 2015 were included. This study updates a previous publication incorporating six additional years of incidence [7], and also expands coverage as more registries were able to contribute data, reaching more than a quarter of the Spanish population.
Survival estimates vary widely by cancer group [4,5,7]. The range of variation we found is broadly consistent with that reported by other population-based studies [4,20,21,22]. Very good prognosis (5y-ASNS ≥ 80%) was observed for cancers of the thyroid, prostate, testicle, female breast, skin melanoma and Hodgkin lymphoma. According to incidence estimates [23], these cancers represent 29% of all cancer cases in Spain, and account for a greater proportion in women than in men, 34% vs. 26%, respectively. Other frequent cancers, including those of the colon, rectum, urinary bladder and corpus uteri, had good prognosis (5y-ASNS 60–79%). However, cancers of the pancreas, esophagus, lung and liver showed 5y-ASNS < 20%. These malignancies represent 18% of the incident cancer cases, making up 11% and 22% for women and men, respectively [23].
For all malignancies combined, better survival was observed in women than in men, which is largely explained by the different distribution of cancer groups by sex, as has been mentioned above. Furthermore, women showed higher survival than did men for 12 out of 23 non-sex specific cancer groups. A better prognosis in women for several cancers has been consistently reported in other studies [24,25,26]. A biological advantage mediated by sexual hormones has been hypothesized [25,27]. Other considerations are that stage at diagnosis, tumor subsite and histology, and patients’ comorbidity may differ between the sexes [25,26]. Our study revealed a remarkable male survival disadvantage for oral cavity and pharynx cancer (absolute difference in 5y-ASNS point estimates of 19%), which could be partly related to differences in the prevalence of risk factors between sexes, such as smoking and alcohol consumption, that in turn are associated with histological type, subsite and comorbidity [25,28]. Nevertheless, the gender gap we observed for this cancer group warrants deeper examination, as it appears to be wider than described in other studies [28,29].
Survival generally decreased with age, consistent with other population-based studies [5,21,30,31]. Several factors may be contributing to age-related differences in survival, including comorbidity, frailty, socioeconomic factors, suboptimal cancer management, diagnostic delays, and patient’s preferences for treatment options [32,33,34]. Further studies are needed to better understand this age-related disparity and to guide strategies to reduce it.
Differences between observed and net survival were smaller for cancers that tend to occur among younger patients (e.g., testicle cancer or Hodgkin lymphoma) than for those cancers occurring in older patients (e.g., prostate cancer or chronic lymphoid leukemia), which is explained by less competing risks for death at a younger age. Likewise, as expected, these differences also tended to be smaller for cancers with poorer prognosis (e.g., pancreas or brain cancers). The large difference (>20 percentage points) between the 5y-ASNS and the conditional 5|1y-ASNS in patients with cancer of the esophagus, stomach and gallbladder possibly reflects the impact of postoperative mortality and/or comorbidity on first-year survival, as these patients frequently require high-risk procedures with a considerable incidence of major complications [35].
The CONCORD-3 study reported worldwide survival estimates for 15 cancer groups in adults, both sexes combined, up to the period 2010–2014 [4]. Spanish figures were within the ranges of most countries globally; however, the 5y-ASNS for esophageal, lung and brain cancer seem to be lower in Spain than in most high-income countries. Similarly, our 5y-ASNS estimates for esophageal and lung cancer tended to be lower than those of seven high-income countries published by the ICBP-SURVMARK2 project for 2010–2014 [31]. Different distribution by sex and smoking habits could be among the reasons for these differences, and variation in registration practices across countries may partly contribute. However, further investigation is required to determine whether potentially modifiable factors that could be intervened on, such as stage at diagnosis and access to timely and optimal treatment, are contributing to the poor prognosis for these tumors. A previous study found regional differences in survival for various cancers in Spain, most notably for lung cancer [36]. Indications that there is room for improvement have been seen in some high-resolution studies showing geographical variation in the early diagnosis and management of cancer patients in Spain [37,38]. Furthermore, some Spanish studies have reported geographical disparities in infrastructure and equipment for radiation oncology, and in access to oncology drugs and predictive biomarkers [39,40].
We observed significant increases in survival between periods of diagnosis, 2002–2007 and 2008–2013, for all cancers combined and for 19 of 29 cancer groups in both sexes (14 of 25 in men and 14 of 27 in women), and no significant decrease was found for any cancer group. For most cancers, larger improvements were found in patients younger than 75 years at diagnosis than in those aged 75 years and older, as described in other studies [31], and various factors might play a role in these differences, as mentioned previously.
Some of the largest increases were seen for some hematological malignancies: chronic myeloid leukemia, myeloma, non-Hodgkin lymphoma, acute myeloid leukemia, acute lymphoid leukemia and the group of leukemia NOS and others, although the increases were not statistically significant for the two latter groups. Chronic myeloid leukemia was the malignancy that showed the greatest increase in survival in the period 2000–2007 compared to 1995–1999 [7] and continued to rise considerably in 2008–2013. This results mostly from the introduction in 2001 of treatments with tyrosine kinase inhibitors, which dramatically changed the course and prognosis of the disease [41,42]. The increased survival in patients with myeloma is probably largely due to changes in the therapeutic arsenal in the last decade [43]. For non-Hodgkin lymphoma and some leukemias, advances in molecular biology and cytogenetic techniques have led to better diagnostic and therapeutic approaches that may be reflected in the observed improved survival [44,45]. Despite the aforementioned advances, no increased survival was observed for chronic lymphoid leukemia, but this may be at least partially due to a bias resulting from the change of diagnostic criteria in the 2008 WHO classification [46]. This change might have led to classification of some patients who formerly would have been diagnosed with chronic lymphoid leukemia, as monoclonal B-cell lymphocytosis, a premalignant condition [47].
Among the most common cancers, survival increases were particularly large for those of the colon and rectum, probably related to earlier diagnosis and better patient management [48]. Only a few regions of Spain had started population-based organized screening programs for colorectal cancer in the studied period, therefore, it is unlikely that there was already an impact on survival from these programs. An increase in survival was also observed for breast cancer, for which there are well-established screening programs in all Spanish regions. Regarding thyroid and kidney cancers, it should be note that some of the apparent improvement in survival might be caused by the increased diagnosis of indolent tumors [49,50,51].
Improved survival was also seen for some of the tumors with poor prognosis including pancreatic, esophageal, lung, liver and brain cancer, possibly due to advancements in diagnosis and treatment, together with enhanced supportive care [52,53]. However, we did not detect changes for gallbladder and stomach cancer, two other neoplasms that showed low survival. Moreover, for stomach cancer, the survival we found in the last period is very similar to that in 1995–1999 reported in a previous study [7]. The persisting poor prognosis for all these cancers underscores the need to strengthen primary prevention and early diagnosis whenever possible.
The main strengths of this study include its population-based setting, which minimized the selection bias present in most clinical trials; the use of standardized registration procedures and high-quality data; and the reliable follow-up of vital status. Among the limitations, we acknowledge that our data covered only about 26% of the Spanish population, nevertheless this is the most complete and accurate information available on the survival of cancer patients in Spain. Another limitation is that some important explanatory factors, such as stage at diagnosis, treatments, or socioeconomic status, could not be considered because these data were not available. Finally, the fact that survival was estimated using the cohort approach for patients diagnosed in 2002–2007 and the period approach for those diagnosed in 2008–2013, might have slightly underestimated the level of survival improvement achieved [54].
5. Conclusions
We provided cancer survival estimates and analyzed survival trends among adult patients in Spain by cancer group, sex, and age. These survival estimates are crucial indicators for assessing the cancer strategy of the Spanish National Health System and the overall effectiveness of health services for cancer patients. We found survival improvements for most cancer groups and there may be multiple reasons for these findings, including earlier diagnosis and improved treatment options. However, the persistent poor prognosis observed for some cancers emphasizes the need to reinforce actions along the cancer continuum, from primary prevention to early diagnosis, optimal treatment, and supportive care. Further investigation of possible sociodemographic inequalities is warranted. Population-based cancer registries are fundamental to continue monitoring cancer survival.
Supplementary Materials
The following supporting information can be downloaded at: https://www.mdpi.com/article/10.3390/cancers14102441/s1, Table S1: Participating cancer registries, number of cases and periods of diagnosis included; Table S2: Five-year net survival by age group and sex for adult patients diagnosed with cancer in Spain in 2008–2013.
Author Contributions
Conceptualization, M.G., E.A., R.M.-G., M.-D.C. and J.G.; Methodology, M.G., E.A., D.S. and R.M.-G.; Data Collection and Validation, M.G., R.M.-G., M.C. (Marià Carulla), M.-D.C., M.R.C., A.A., D.R., A.V.B., M.C. (Matilde Chico), R.J.C., A.L.d.M., V.d.C., M.-J.S., E.R.-G., P.F., J.G. and E.A.; Data Curation, M.C. (Marià Carulla), J.G., A.M. and M.G.; Formal Analysis, M.G. and A.M.; Investigation, all authors; Visualization, M.G.; Writing—Original Draft Preparation, M.G. and E.A.; Writing—Review and Editing, all authors. All authors have read and agreed to the published version of the manuscript.
Funding
This research received no external funding.
Institutional Review Board Statement
This study is based on data collected in cancer registries for public health surveillance. All the participating cancer registries comply with current European and national regulations on data protection. The public health administration of each region/province authorized the collection and use of these data for their analysis without requirement of informed consent and ethical approval, covered by the Spanish General Health Law 14/1986 and the Public Health General Law 33/2011. The authorizing bodies for each region/province can be seen on https://stage.redecan.org/es/registros-de-cancer (accessed on 29 April 2022). The study was carried out in accordance with the principles of the Declaration of Helsinki.
Informed Consent Statement
Patient consent was waived due to the deidentified nature of the data.
Data Availability Statement
Data are available from the authors on reasonable request with the permission of the cancer registries. Data requestors will need to sign a data access agreement.
Acknowledgments
The authors acknowledge Nerea Larrañaga (Basque Country Cancer Registry) and Josefina Perucha-González (La Rioja Cancer Registry) for their valuable contribution to this work.
Conflicts of Interest
The authors declare that they have no conflicts of interest.
References
- Sung, H.; Ferlay, J.; Siegel, R.L.; Laversanne, M.; Soerjomataram, I.; Jemal, A.; Bray, F. Global Cancer Statistics 2020: GLOBOCAN Estimates of Incidence and Mortality Worldwide for 36 Cancers in 185 Countries. CA Cancer J. Clin. 2021, 71, 209–249. [Google Scholar] [CrossRef] [PubMed]
- Red Española de Registros de Cáncer (REDECAN). Estimaciones de la Incidencia del Cáncer en España. 2022. Available online: https://redecan.org (accessed on 14 May 2022).
- Instituto Nacional de Estadística. Estadística de Defunciones Según Causa de Muerte. INE-España. 2019. Available online: https://www.ine.es/ (accessed on 14 May 2022).
- Allemani, C.; Matsuda, T.; Di Carlo, V.; Harewood, R.; Matz, M.; Nikšić, M.; Bonaventure, A.; Valkov, M.; Johnson, C.J.; Estève, J.; et al. Global surveillance of trends in cancer survival 2000-14 (CONCORD-3): Analysis of individual records for 37,513,025 patients diagnosed with one of 18 cancers from 322 population-based registries in 71 countries. Lancet 2018, 391, 1023–1075. [Google Scholar] [CrossRef]
- De Angelis, R.; Sant, M.; Coleman, M.P.; Francisci, S.; Baili, P.; Pierannunzio, D.; Trama, A.; Visser, O.; Brenner, H.; Ardanaz, E.; et al. Cancer survival in Europe 1999–2007 by country and age: Results of EUROCARE--5-a population-based study. Lancet Oncol. 2014, 15, 23–34. [Google Scholar] [CrossRef]
- Tron, L.; Belot, A.; Fauvernier, M.; Remontet, L.; Bossard, N.; Launay, L.; Bryere, J.; Monnereau, A.; Dejardin, O.; Launoy, G. Socioeconomic environment and disparities in cancer survival for 19 solid tumor sites: An analysis of the French Network of Cancer Registries (FRANCIM) data. Int. J. Cancer 2019, 144, 1262–1274. [Google Scholar] [CrossRef] [PubMed]
- Chirlaque, M.D.; Salmeron, D.; Galceran, J.; Ameijide, A.; Mateos, A.; Torrella, A.; Jimenez, R.; Larranaga, N.; Marcos-Gragera, R.; Ardanaz, E.; et al. Cancer survival in adult patients in Spain. Results from nine population-based cancer registries. Clin. Transl. Oncol. 2018, 20, 201–211. [Google Scholar] [CrossRef] [PubMed]
- International Agency for Reasearch on Cancer. Cancer Incidence in Five Continents, Vol. XI. IARC Scientific Publication No. 166., 1st ed.; Bray, F., Colombet, M., Mery, L., Piñeros, M., Znaor, A., Zanetti, R., Ferlay, J., Eds.; International Agency for Reasearch on Cancer—World Health Organization: Lyon, France, 2021; ISBN 978-92-832-2218-7. [Google Scholar]
- World Health Organization. International Classification of Diseases for Oncology (ICD-O), 1st Revision, 3rd ed.; Fritz, A., Percy, C., Jack, A., Shanmugaratnam, K., Sobin, L., Parkin, D.M., Sharon, W., Eds.; World Health Organization: Geneva, Switzerland, 2013; ISBN 978 92 4 154849 6. [Google Scholar]
- International Association of Cancer Registries. International Rules for Multiple Primary Cancers (ICD-O Third Edition). International Agency for Research on Cancer Internal Report No. 2004/02. Available online: http://www.iacr.com.fr/images/doc/MPrules_july2004.pdf (accessed on 14 May 2022).
- World Health Organization. WHO Classification of Tumours of Haematopoietic and Lymphoid Tissues; Swerdlow, S.H., Campo, E., Harris, N.L., Jaffe, E.S., Pileri, S.A., Stein, H., Thiele, J., Eds.; International Agency for Research on Cancer: Lyon, France, 2017; ISBN 9789283244943. [Google Scholar]
- HAEMACARE Working Group. Manual for coding and reporting haematological malignancies. Tumori 2010, 96, i-A32. [Google Scholar]
- Rossi, S.; Baili, P.; Capocaccia, R.; Caldora, M.; Carrani, E.; Minicozzi, P.; Pierannunzio, D.; Santaquilani, M.; Trama, A.; Allemani, C.; et al. The EUROCARE-5 study on cancer survival in Europe 1999–2007: Database, quality checks and statistical analysis methods. Eur. J. Cancer 2015, 51, 2104–2119. [Google Scholar] [CrossRef]
- Perme, M.P.; Stare, J.; Estève, J. On Estimation in Relative Survival. Biometrics 2012, 68, 113–120. [Google Scholar] [CrossRef]
- Elandt-Johnson, R.C.; Johnson, N.L. Survival Models and Data Analysis; John Wiley and Sons: New York, NY, USA, 1980; ISBN 9780471031741. [Google Scholar]
- Brenner, H.; Gefeller, O.; Hakulinen, T. Period analysis for “up-to-date” cancer survival data: Theory, empirical evaluation, computational realisation and applications. Eur. J. Cancer 2004, 40, 326–335. [Google Scholar] [CrossRef]
- Corazziari, I.; Quinn, M.; Capocaccia, R. Standard cancer patient population for age standardising survival ratios. Eur. J. Cancer 2004, 40, 2307–2316. [Google Scholar] [CrossRef]
- Greenwood, M. The natural duration of cancer. In Reports on Public Health and Medical Subjects; Great Britain Ministry of Health: Londres, UK, 1926; pp. 1–26. [Google Scholar]
- Clerc-Urmès, I.; Grzebyk, M.; Hédelin, G. Net Survival Estimation with Stns. Stata J. Promot. Commun. Stat. Stata 2014, 14, 87–102. [Google Scholar] [CrossRef]
- Lundberg, F.E.; Andersson, T.M.L.; Lambe, M.; Engholm, G.; Mørch, L.S.; Johannesen, T.B.; Virtanen, A.; Pettersson, D.; Ólafsdóttir, E.J.; Birgisson, H.; et al. Trends in cancer survival in the Nordic countries 1990–2016: The NORDCAN survival studies. Acta Oncol. 2020, 59, 1266–1274. [Google Scholar] [CrossRef] [PubMed]
- Cowppli-Bony, A.; Uhry, Z.; Remontet, L.; Voirin, N.; Guizard, A.V.; Trétarre, B.; Bouvier, A.M.; Colonna, M.; Bossard, N.; Woronoff, A.S.; et al. Survival of solid cancer patients in France, 1989–2013: A population-based study. Eur. J. Cancer Prev. 2017, 26, 461–468. [Google Scholar] [CrossRef] [PubMed]
- Zadnik, V.; Zagar, T.; Lokar, K.; Tomsic, S.; Konjevic, A.D.; Zakotnik, B. Trends in population-based cancer survival in Slovenia. Radiol. Oncol. 2021, 55, 42–49. [Google Scholar] [CrossRef]
- Galceran, J.; Ameijide, A.; Carulla, M.; Mateos, A.; Quirós, J.R.; Rojas, D.; Alemán, A.; Torrella, A.; Chico, M.; Vicente, M.; et al. Cancer incidence in Spain, 2015. Clin. Transl. Oncol. 2017, 19, 799–825. [Google Scholar] [CrossRef]
- Quaresma, M.; Coleman, M.P.; Rachet, B. 40-year trends in an index of survival for all cancers combined and survival adjusted for age and sex for each cancer in England and Wales, 1971–2011: A population-based study. Lancet 2015, 385, 1206–1218. [Google Scholar] [CrossRef]
- Micheli, A.; Ciampichini, R.; Oberaigner, W.; Ciccolallo, L.; de Vries, E.; Izarzugaza, I.; Zambon, P.; Gatta, G.; De Angelis, R.; Oberaigner, W.; et al. The advantage of women in cancer survival: An analysis of EUROCARE-4 data. Eur. J. Cancer 2009, 45, 1017–1027. [Google Scholar] [CrossRef]
- Ellison, L.F. Differences in cancer survival in Canada by sex. Health Rep. 2016, 27, 19–27. [Google Scholar]
- Majek, O.; Gondos, A.; Jansen, L.; Emrich, K.; Holleczek, B.; Katalinic, A.; Nennecke, A.; Eberle, A.; Brenner, H. Sex Differences in Colorectal Cancer Survival: Population-Based Analysis of 164,996 Colorectal Cancer Patients in Germany. PLoS ONE 2013, 8, e68077. [Google Scholar] [CrossRef]
- Gatta, G.; Botta, L.; Sánchez, M.J.; Anderson, L.A.; Pierannunzio, D.; Licitra, L.; Hackl, M.; Zielonke, N.; Oberaigner, W.; Van Eycken, E.; et al. Prognoses and improvement for head and neck cancers diagnosed in Europe in early 2000s: The EUROCARE-5 population-based study. Eur. J. Cancer 2015, 51, 2130–2143. [Google Scholar] [CrossRef]
- Guizard, A.V.; Uhry, Z.; De Raucourt, D.; Mazzoleni, G.; Sánchez, M.J.; Ligier, K.; Van Eycken, E.; Henau, K.; Velten, M.; Bouvier, V.; et al. Trends in net survival from head and neck cancer in six European Latin countries: Results from the SUDCAN population-based study. Eur. J. Cancer Prev. 2017, 26, S16–S23. [Google Scholar] [CrossRef] [PubMed]
- Quaglia, A.; Tavilla, A.; Shack, L.; Brenner, H.; Janssen-Heijnen, M.; Allemani, C.; Colonna, M.; Grande, E.; Grosclaude, P.; Vercelli, M.; et al. The cancer survival gap between elderly and middle-aged patients in Europe is widening. Eur. J. Cancer 2009, 46, 1006–1016. [Google Scholar] [CrossRef] [PubMed]
- Arnold, M.; Rutherford, M.J.; Bardot, A.; Ferlay, J.; Andersson, T.M.L.; Myklebust, T.Å.; Tervonen, H.; Thursfield, V.; Ransom, D.; Shack, L.; et al. Progress in cancer survival, mortality, and incidence in seven high-income countries 1995–2014 (ICBP SURVMARK-2): A population-based study. Lancet Oncol. 2019, 20, 1493–1505. [Google Scholar] [CrossRef]
- Nur, U.; Lyratzopoulos, G.; Rachet, B.; Coleman, M.P. The impact of age at diagnosis on socioeconomic inequalities in adult cancer survival in England. Cancer Epidemiol. 2015, 39, 641–649. [Google Scholar] [CrossRef]
- Sarfati, D.; Koczwara, B.; Jackson, C. The impact of comorbidity on cancer and its treatment. CA Cancer J. Clin. 2016, 66, 337–350. [Google Scholar] [CrossRef]
- Pilleron, S.; Gower, H.; Janssen-Heijnen, M.; Signal, V.C.; Gurney, J.K.; Morris, E.J.A.; Cunningham, R.; Sarfati, D. Patterns of age disparities in colon and lung cancer survival: A systematic narrative literature review. BMJ Open 2021, 11, e044239. [Google Scholar] [CrossRef]
- Abdelsattar, Z.M.; Habermann, E.; Borah, B.J.; Moriarty, J.P.; Rojas, R.L.; Blackmon, S.H. Understanding Failure to Rescue After Esophagectomy in the United States. Ann. Thorac. Surg. 2020, 109, 865–871. [Google Scholar] [CrossRef]
- Chirlaque, M.D.; Salmeron, D.; Ardanaz, E.; Galceran, J.; Martinez, R.; Marcos-Gragera, R.; Sanchez, M.J.; Mateos, A.; Torrella, A.; Capocaccia, R.; et al. Cancer survival in Spain: Estimate for nine major cancers. Ann. Oncol. 2010, 21, iii21–iii29. [Google Scholar] [CrossRef]
- Rodríguez-Barranco, M.; Salamanca-Fernández, E.; Fajardo, M.L.; Bayo, E.; Chang-Chan, Y.L.; Expósito, J.; García, C.; Tallón, J.; Minicozzi, P.; Sant, M.; et al. Patient, tumor, and healthcare factors associated with regional variability in lung cancer survival: A Spanish high-resolution population-based study. Clin. Transl. Oncol. 2019, 21, 621–629. [Google Scholar] [CrossRef]
- Guevara, M.; Rodríguez-Barranco, M.; Puigdemont, M.; Minicozzi, P.; Yanguas-Bayona, I.; Porras-Povedano, M.; Rubió-Casadevall, J.; Sánchez Pérez, M.J.; Marcos-Gragera, R.; Ardanaz, E. Disparities in the management of cutaneous malignant melanoma. A population-based high-resolution study. Eur. J. Cancer Care 2019, 28, e13043. [Google Scholar] [CrossRef]
- Rodríguez, A.; Algara, M.; Monge, D.; López-Torrecilla, J.; Caballero, F.; Morera, R.; Escó, R.; Pérez-Montero, H.; Ferrer, C.; Lara, P.C.; et al. Infrastructure and equipment for radiation oncology in the Spanish National Health System: Analysis of external beam radiotherapy 2015–2020. Clin. Transl. Oncol. 2018, 20, 402–410. [Google Scholar] [CrossRef] [PubMed]
- Rodríguez-Lescure, A.; de la Peña, F.A.; Aranda, E.; Calvo, A.; Felip, E.; Garrido, P.; Vera, R. Study of the Spanish Society of Medical Oncology (SEOM) on the access to oncology drugs and predictive biomarkers in Spain. Clin. Transl. Oncol. 2020, 22, 2253–2263. [Google Scholar] [CrossRef] [PubMed]
- Hoffmann, V.S.; Baccarani, M.; Hasford, J.; Castagnetti, F.; Di Raimondo, F.; Casado, L.F.; Turkina, A.; Zackova, D.; Ossenkoppele, G.; Zaritskey, A.; et al. Treatment and outcome of 2904 CML patients from the EUTOS population-based registry. Leukemia 2017, 31, 593–601. [Google Scholar] [CrossRef] [PubMed]
- Di Felice, E.; Roncaglia, F.; Venturelli, F.; Mangone, L.; Luminari, S.; Cirilli, C.; Carrozzi, G.; Giorgi Rossi, P. The impact of introducing tyrosine kinase inhibitors on chronic myeloid leukemia survival: A population-based study. BMC Cancer 2018, 18, 1069. [Google Scholar] [CrossRef] [PubMed]
- Thorsteinsdottir, S.; Dickman, P.W.; Landgren, O.; Blimark, C.; Hultcrantz, M.; Turesson, I.; Björkholm, M.; Kristinsson, S.Y. Dramatically improved survival in multiple myeloma patients in the recent decade: Results from a Swedish population-based study. Haematologica 2018, 103, e412–e415. [Google Scholar] [CrossRef] [PubMed]
- Pratap, S.; Scordino, T.S. Molecular and cellular genetics of non-Hodgkin lymphoma: Diagnostic and prognostic implications. Exp. Mol. Pathol. 2019, 106, 44–51. [Google Scholar] [CrossRef] [PubMed]
- Villavicencio, A.; Solans, M.; Auñon-Sanz, C.; Roncero, J.M.; Marcos-Gragera, R. Population-based survival of lymphoid neoplasms: Twenty years of epidemiological data in the Girona province, Spain. Cancer Epidemiol. 2020, 69, 101841. [Google Scholar] [CrossRef]
- Muller-Hermelink, H.K.; Catovsky, D.; Campo, E.; Harris, N.; Stein, H. Chronic Lymphocytic Leukaemia/Small Lymphocytic Lymphoma, 4th ed.; Swerdlow, S.H., Campo, E., Harris, N.L., Jaffe, E.S., Pileri, S.A., Stein, H., Thiele, J., Vardiman, J.W., Eds.; WHO Press: Lyon, France, 2008. [Google Scholar]
- Solans, M.; Osca-Gelis, G.; Comas, R.; Roncero, J.M.; Gallardo, D.; Marcos-Gragera, R.; Saez, M. Challenges in assessing the real incidence of chronic lymphocytic leukemia: 16 years of epidemiological data from the province of Girona, Spain. Cancer Causes Control 2018, 29, 379–382. [Google Scholar] [CrossRef]
- Manchon-Walsh, P.; Aliste, L.; Espinàs, J.A.; Prades, J.; Guarga, A.; Balart, J.; Biondo, S.; Castells, A.; Sanjuán, X.; Tabernero, J.; et al. Improving survival and local control in rectal cancer in Catalonia (Spain) in the context of centralisation: A full cycle audit assessment. Eur. J. Surg. Oncol. 2016, 42, 1873–1880. [Google Scholar] [CrossRef]
- Salamanca-Fernández, E.; Rodriguez-Barranco, M.; Chang-Chan, Y.L.; Redondo-Sánchez, D.; Domínguez-López, S.; Bayo, E.; Narankiewicz, D.; Expósito, J.; Sánchez, M.J. Thyroid Cancer Epidemiology in South Spain: A population-based time trend study. Endocrine 2018, 62, 423–431. [Google Scholar] [CrossRef]
- Rojo Álvaro, J.; Bermejo Fraile, B.; Menéndez Torre, E.; Ardanaz, E.; Guevara, M.; Anda Apiñániz, E. Increased incidence of thyroid cancer in Navarra (Spain). Evolution and clinical characteristics, 1986–2010. Endocrinol. Diabetes Nutr. 2017, 64, 303–309. [Google Scholar] [CrossRef]
- Rosiello, G.; Larcher, A.; Montorsi, F.; Capitanio, U. Renal cancer: Overdiagnosis and overtreatment. World J. Urol. 2021, 39, 2821–2823. [Google Scholar] [CrossRef] [PubMed]
- Taieb, J.; Prager, G.W.; Melisi, D.; Westphalen, C.B.; D’Esquermes, N.; Ferreras, A.; Carrato, A.; MacArulla, T. First-line and second-line treatment of patients with metastatic pancreatic adenocarcinoma in routine clinical practice across Europe: A retrospective, observational chart review study. ESMO Open 2020, 5, e000587. [Google Scholar] [CrossRef] [PubMed]
- Jones, G.S.; Baldwin, D.R. Recent advances in the management of lung cancer. Clin. Med. J. R. Coll. Physicians Lond. 2018, 18, s41–s46. [Google Scholar] [CrossRef] [PubMed]
- Brenner, H.; Spix, C. Combining cohort and period methods for retrospective time trend analyses of long-term cancer patient survival rates. Br. J. Cancer 2003, 89, 1260–1265. [Google Scholar] [CrossRef] [PubMed][Green Version]
Publisher’s Note: MDPI stays neutral with regard to jurisdictional claims in published maps and institutional affiliations. |
© 2022 by the authors. Licensee MDPI, Basel, Switzerland. This article is an open access article distributed under the terms and conditions of the Creative Commons Attribution (CC BY) license (https://creativecommons.org/licenses/by/4.0/).