Simple Summary
Tumor dormancy is a state in which some cancer cells are dormant by less cell proliferation, and are resistant to treatments, thus leading to late recurrence. As nuclear receptor subfamily 2 group F member 1 (NR2F1) is a biomarker of dormancy shown in experimental settings, we studied its clinical relevance by analyzing comprehensive gene expression profiles of approximately 7000 breast cancer patients using computational biological approaches. NR2F1 gene expression of bulk tumors correlated with the suppression of cell proliferation and metastasis-related pathways, but not with metastasis or survival. Using single-cell sequence cohorts, we found that NR2F1 was predominantly expressed in cancer-associated fibroblasts, particularly in inflammatory type, rather than in cancer cells. Further, NR2F1 expression in breast cancer cells did not consistently correlate with stem cell-like traits. Our findings suggest that the NR2F1 gene expression signal from a patient’s bulk tumor is not from the cancer cells.
Abstract
Background: Tumor dormancy is a crucial mechanism responsible for the late recurrence of breast cancer. Thus, we investigated the clinical relevance of the expression of NR2F1, a known dormancy biomarker. Methods: A total of 6758 transcriptomes of bulk tumors from multiple breast cancer patient cohorts and two single-cell sequence cohorts were analyzed. Results: Breast cancer (BC) with high NR2F1 expression enriched TGFβ signaling, multiple metastases, and stem cell-related pathways. Cell proliferation-related gene sets were suppressed, and MKi67 expression was lower in high NR2F1 BC. In tumors with high Nottingham grade, NR2F1 expression was found to be lower. There was no consistent relationship between NR2F1 expression and metastasis or survival. Cancer mutation rates, immune responses, and immune cell infiltrations were lower in high NR2F1 tumors, whereas the infiltration of stromal cells including cancer-associated fibroblasts (CAFs) was higher. NR2F1 was predominantly expressed in CAFs, particularly inflammatory CAFs, rather than in cancer cells, consistently in the two single-cell sequence cohorts. Conclusions: NR2F1 expression in breast cancer is associated with tumor dormancy traits, and it is predominantly expressed in CAFs in the tumor microenvironment.
1. Introduction
Breast cancer is the most common cancer in women, and the vast majority of the deaths occur after cancer cells metastasize systemically to bone, liver, lung, and brain long after the completion of initial treatment, also known as late recurrence [1]. In particular, estrogen receptor (ER)-positive breast cancers are known to develop late recurrence mainly in the bone with about half of the recurrences occurring 5 years after the initial diagnosis of the primary tumor [2,3]. Adjuvant chemotherapy and 5 years of adjuvant endocrine therapy have greatly reduced the overall recurrence rates [1]; however, late recurrence has emerged as an issue given the longevity of the population. Low recurrence rates of about 0.5% to 3% are observed for the first few years after the adjuvant treatments [4,5], and eventually, more than half of breast cancer patients die from late recurrence after 5 to 20 years of initial treatment [6]. This prolonged latency occurs due to cancer cells surviving in a non-proliferative cell cycle arrest, called tumor dormancy [2,6]. These dormant cancer cells remain in a quiescent state, thus evading cytotoxic chemotherapy and apoptosis that target proliferating cells [7,8,9] and hide undetected for decades and regain proliferation that surfaces as late recurrence at some point with unknown triggers [10]. To this end, tumor dormancy is considered one of the major mechanisms of drug resistance that leads to patient deaths [11].
It is well known that even early-stage breast cancer can scatter disseminated tumor cells (DTCs) [12], which can invade, spread, resist chemotherapy, and switch to quiescent states [10]. These characteristics resemble tumor dormancy cells where some were shown to express TGFβ that regulates cancer stem cells [13,14,15]. The activation of cellular plasticity pathways such as Wnt or Rank was shown to be necessary for dormant cell dissemination in primary breast cancer [16]. Furthermore, dormant DTCs recapitulate the quiescent program of normal stem cells, regulating pluripotency and reducing proliferation through BMP and TGFβ family members for a long period [17].
Nuclear receptor subfamily 2 group F member 1 (NR2F1) is an established biomarker of tumor dormancy that promotes quiescence of various types of cancer cells, including breast, prostate, and squamous cell carcinoma of the head and neck [18,19]. NR2F1 is upregulated in bone marrow DTCs via SOX9 and RARβ and regulates the expression of genes related to quiescence, cell survival, and pluripotency [18]. High NR2F1 expression in the bone marrow of DTC-positive breast cancer was associated with a better prognosis, indicating that NR2F1 induces durable growth arrest in metastatic cells [20]. Administration of NR2F1 agonist to the primary squamous cell carcinoma of the head and neck induced tumor dormancy and suppressed metastasis [21].
The dormancy of disseminated cells at latent sites is considered undesirable, as it leads to late recurrence upon reactivation; however, high expression of NR2F1 that prolongs dormancy may keep those cells from reactivation and thus recurrence. We hypothesize that high expression of the NR2F1 gene in the primary breast cancer tumor microenvironment (TME) maintains the quiescence of cancer cells and is associated with clinical outcomes in breast cancer patients. We have investigated cell fractionation and immune activation in the TME using large public patient cohorts in silico using the techniques we have previously described [22,23,24,25]. To the best of our knowledge, this is the first translational study to investigate the clinical relevance of NR2F1 gene expression in primary breast cancer.
2. Materials and Methods
2.1. Collection of Breast Cancer Sample Data
The transcriptome of the bulk primary breast tumor of 6245 patients and 512 metastatic breast cancer patients and single-cell sequence data of 20 primary breast cancer patients were analyzed. For large primary breast cancer cohorts, curated RNA-seq data of the bulk tumors from the Cancer Genome Atlas (TCGA, n = 1077) [26] and Molecular Taxonomy of Breast Cancer International Consortium (METABRIC, n = 1904) [27] were downloaded from cBiopotal [28], and GSE96058 (n = 3069) [29,30] from the Gene Expression Omnibus (GEO) database, as previously reported [24,31,32]. Nottingham histological grade of TCGA was manually calculated from pathology reports of TCGA-BRCA as previously reported [33]. We also downloaded the following curated RNA-seq data of the bulk tumors from GEO database: GSE12276 (n = 195) [34] of early breast cancer with known later metastatic sites, GSE124647 (n = 140) [35] and GSE159956 (n = 295) [36] of advanced breast cancer, GSE110590 (n = 77) [37] of primary and metastatic samples of advanced breast cancer, and GSE180280 (n = 37) [38], GSE87455 (n = 153) [39,40,41], GSE28844 (n = 61) [42], GSE21974 (n = 57) [43] as cohorts including before and after neoadjuvant chemotherapy samples of primary breast cancer. Matching probes were used for NR2F1 expression, and the average of the probes was used when there were multiple probes. The R package GEOquary was used to acquire and process data from GEO. We also used RNA-seq data of GSE172882 [44], a cohort of dormant D2.OR and proliferate D2A1 breast cancer cell lines, as well as 4T1 and metastasis-competent derivative cell line 4T1.2 from our previous publication [45].
Two cohorts of single-cell seq data were downloaded from the Single-cell Portal (https://singlecell.broadinstitute.org/single_cell, accessed on 21 November 2021): 5 triple-negative breast cancer (TNBC) samples reported by Wu et al. in 2020 [46] (Cohort 1) and 26 primary breast cancer tumors including 11 estrogen receptor (ER) positive, 5 human epidermal growth factor receptor (HER) 2 positive and 10 TNBCs reported by Wu et al. in 2021 [47] (Cohort 2).
2.2. Gene Set Enrichment Analysis
For functional analysis of the bulk RNA sequencing data, Gene set enrichment analysis (GSEA) [48,49] was performed comparing “high” and “low” groups divided by the median NR2F1 expression. The free software GSEA v4.2.3 for Windows was used to analyze 50 gene sets of Hallmark from the Molecular Signatures Database [50]. As previously reported [51,52], the normalized enrichment score (NES) was utilized for assessment and the false discovery rate (FDR) of less than 0.25 was considered significant. For single-cell seq data, GSEA was conducted exclusively on cancer cells. Since most cells had no expression of NR2F1, we compared cells with positive and negative NR2F1 expression in cancer cells. Seurat and fgsea R package for the R platform was used for analyses.
2.3. Intertumoral Cell Fraction Estimation
Intratumor microenvironment deconvolution of the bulk tumor was performed using xCell [53] to analyze immune and stromal cell fractions, as previously reported [23,51,54]. The geometric mean of Perforin 1 and granzyme A expression level was used to calculate cytolytic activity (CYT) to quantify cell-killing immunity [55,56]. Several score values of TCGA patients reported by Thorsson et al. in 2018 [57] were used: proliferation score, intra-tumor heterogeneity, homologous recombination loss, silent and non-silent mutation rates, interferon response, fraction altered, tumor-infiltrating lymphocyte fraction, stromal fraction.
2.4. Others
The analysis and visualization of this study were performed using R (version 4.0.1). The “high” and “low” NR2F1 groups of TCGA, METABRIC, and GSE96058 were defined by median expression of NR2F1 as cutoff as explained above. All analyses of single-cell seq data were performed on the R platform using the VlnPlot and DotPlot commands from the R package Seurat. The classification of cell types is different in Cohort 1 and in Cohort 2, and the cell annotations for single-cell seq data are obtained from the original paper published by the authors. Overall survival (OS) was defined as the time from the end of therapy to death from any cause, disease-specific survival (DSS) was defined as the time to death from breast cancer, and disease-free survival (DFS) was defined as the time to recurrence.
3. Results
3.1. Tumor Dormancy-Related Genes (NR2F1, TGFβ, RARβ) Were Highly Expressed in the Dormant and Metastatic Cell Lines, and High NR2F1 Breast Cancer Enriched Multiple Cancer Metastasis-Related Pathways including TGFβ Signaling Gene Set
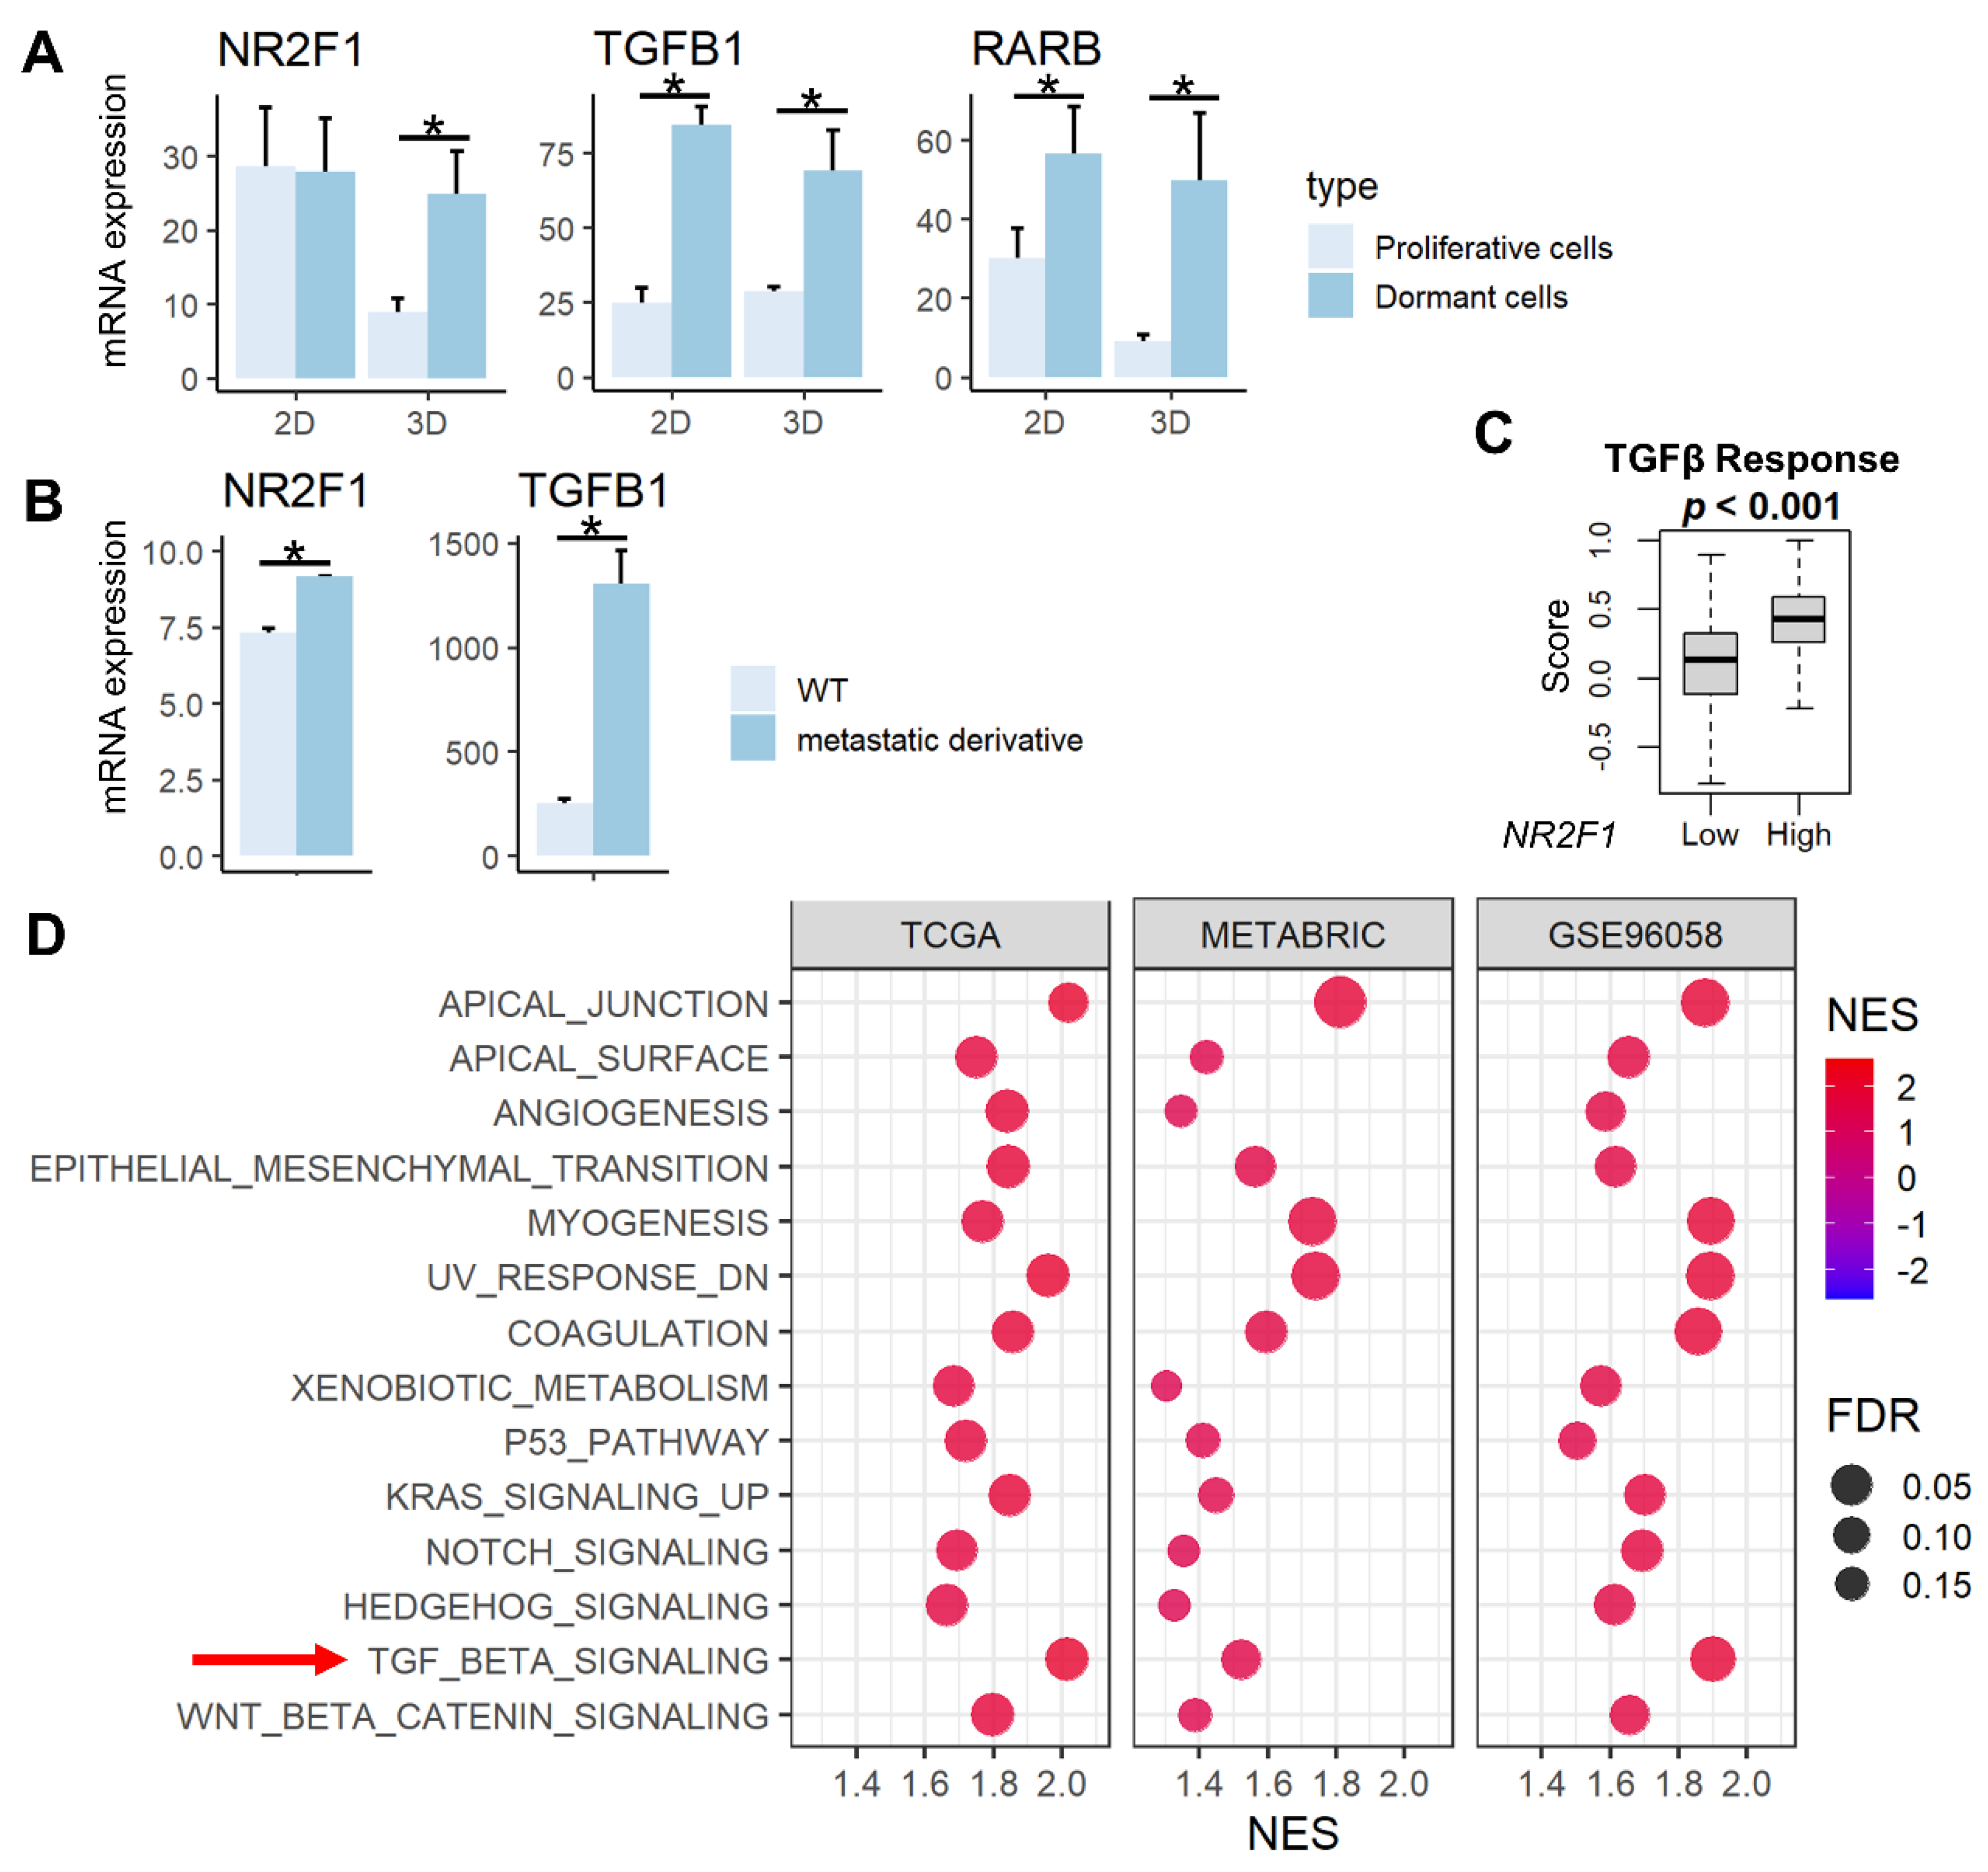
NR2F1 is a known tumor dormancy marker, and RARβ and TGF-β signaling have been reported to induce dormancy [13,15]. We demonstrated that the expression of NR2F1 gene was higher in previously established dormant cells (D2OR murine breast cancer cells) [44] compared to the proliferative cells (D2A1 cells) in 3D cultures, and the expression of RARB and TGFB1 genes are higher in dormant cells compared to the proliferative cells in both 2D and 3D cultures (Figure 1A, all p < 0.02). Further, both NR2F1 and TGFB1 gene expressions were significantly higher in bone metastatic derivatives [45] compared with wild-type 4T1 murine breast cancer cells (Figure 1B). TGF-β signaling calculated by Thorsson et al. [57] in the TCGA cohort was higher in the NR2F1 high group (Figure 1C). This result was validated by gene enrichment analysis (GSEA) that showed enrichment of TGF-β signaling in the NR2F1 high group consistently in the three independent large primary breast cancer cohorts (TCGA, METABRIC, and GSE96058; Figure 1D). NR2F1-high primary breast cancer amplified multiple pathways related to metastasis: Epithelial Mesenchymal Transition (EMT), angiogenesis, as well as enhanced cancer stem cell-related pathways, including KRAS signaling, Notch signaling, Hedgehog signaling, and Wnt/β-catenin signaling (Figure 1D). These results confirm that NR2F1 gene expression is associated with dormancy, metastasis, TGF-β signaling, as well as with the cancer stem cell phenotype that has similar biological characteristics to tumor dormancy.
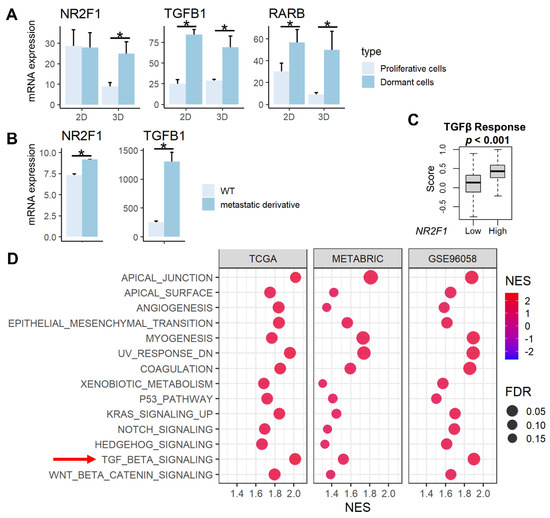
Figure 1.
Association between NR2F1 and TGFβ and pathways enriched in high NR2F1 tumors. (A) Barplots showing mRNA expression of NR2F1, TGFB1, and RARB in the dormant D2OR cells (dark blue) and proliferative D2A1 cells (light blue) cultured in 2D and 3D. (B) Barplots showing mRNA expression of NR2F1 and TGFB1 in 4T1 murine breast cancer cell line and metastatic derivative 4T1.2 cell line. ANOVA test was performed between the two groups (A,B), with * indicating p < 0.05. (C) The box plot shows the TGFβ score for high and low NR2F1 groups in TCGA. Cohorts were divided into high and low groups by median expression of NR2F1. Mann−Whitney U test was used to compare the two groups. (D) Dot plots showing hallmark gene sets that are significantly enriched in high NR2F1 groups by gene set enrichment analysis in the TCGA, METABRIC, and GSE96058 cohorts. TGFβ gene set is highlighted by the red arrow. The size of each dot represents FDR, and the x−axis and color tone represent NES.
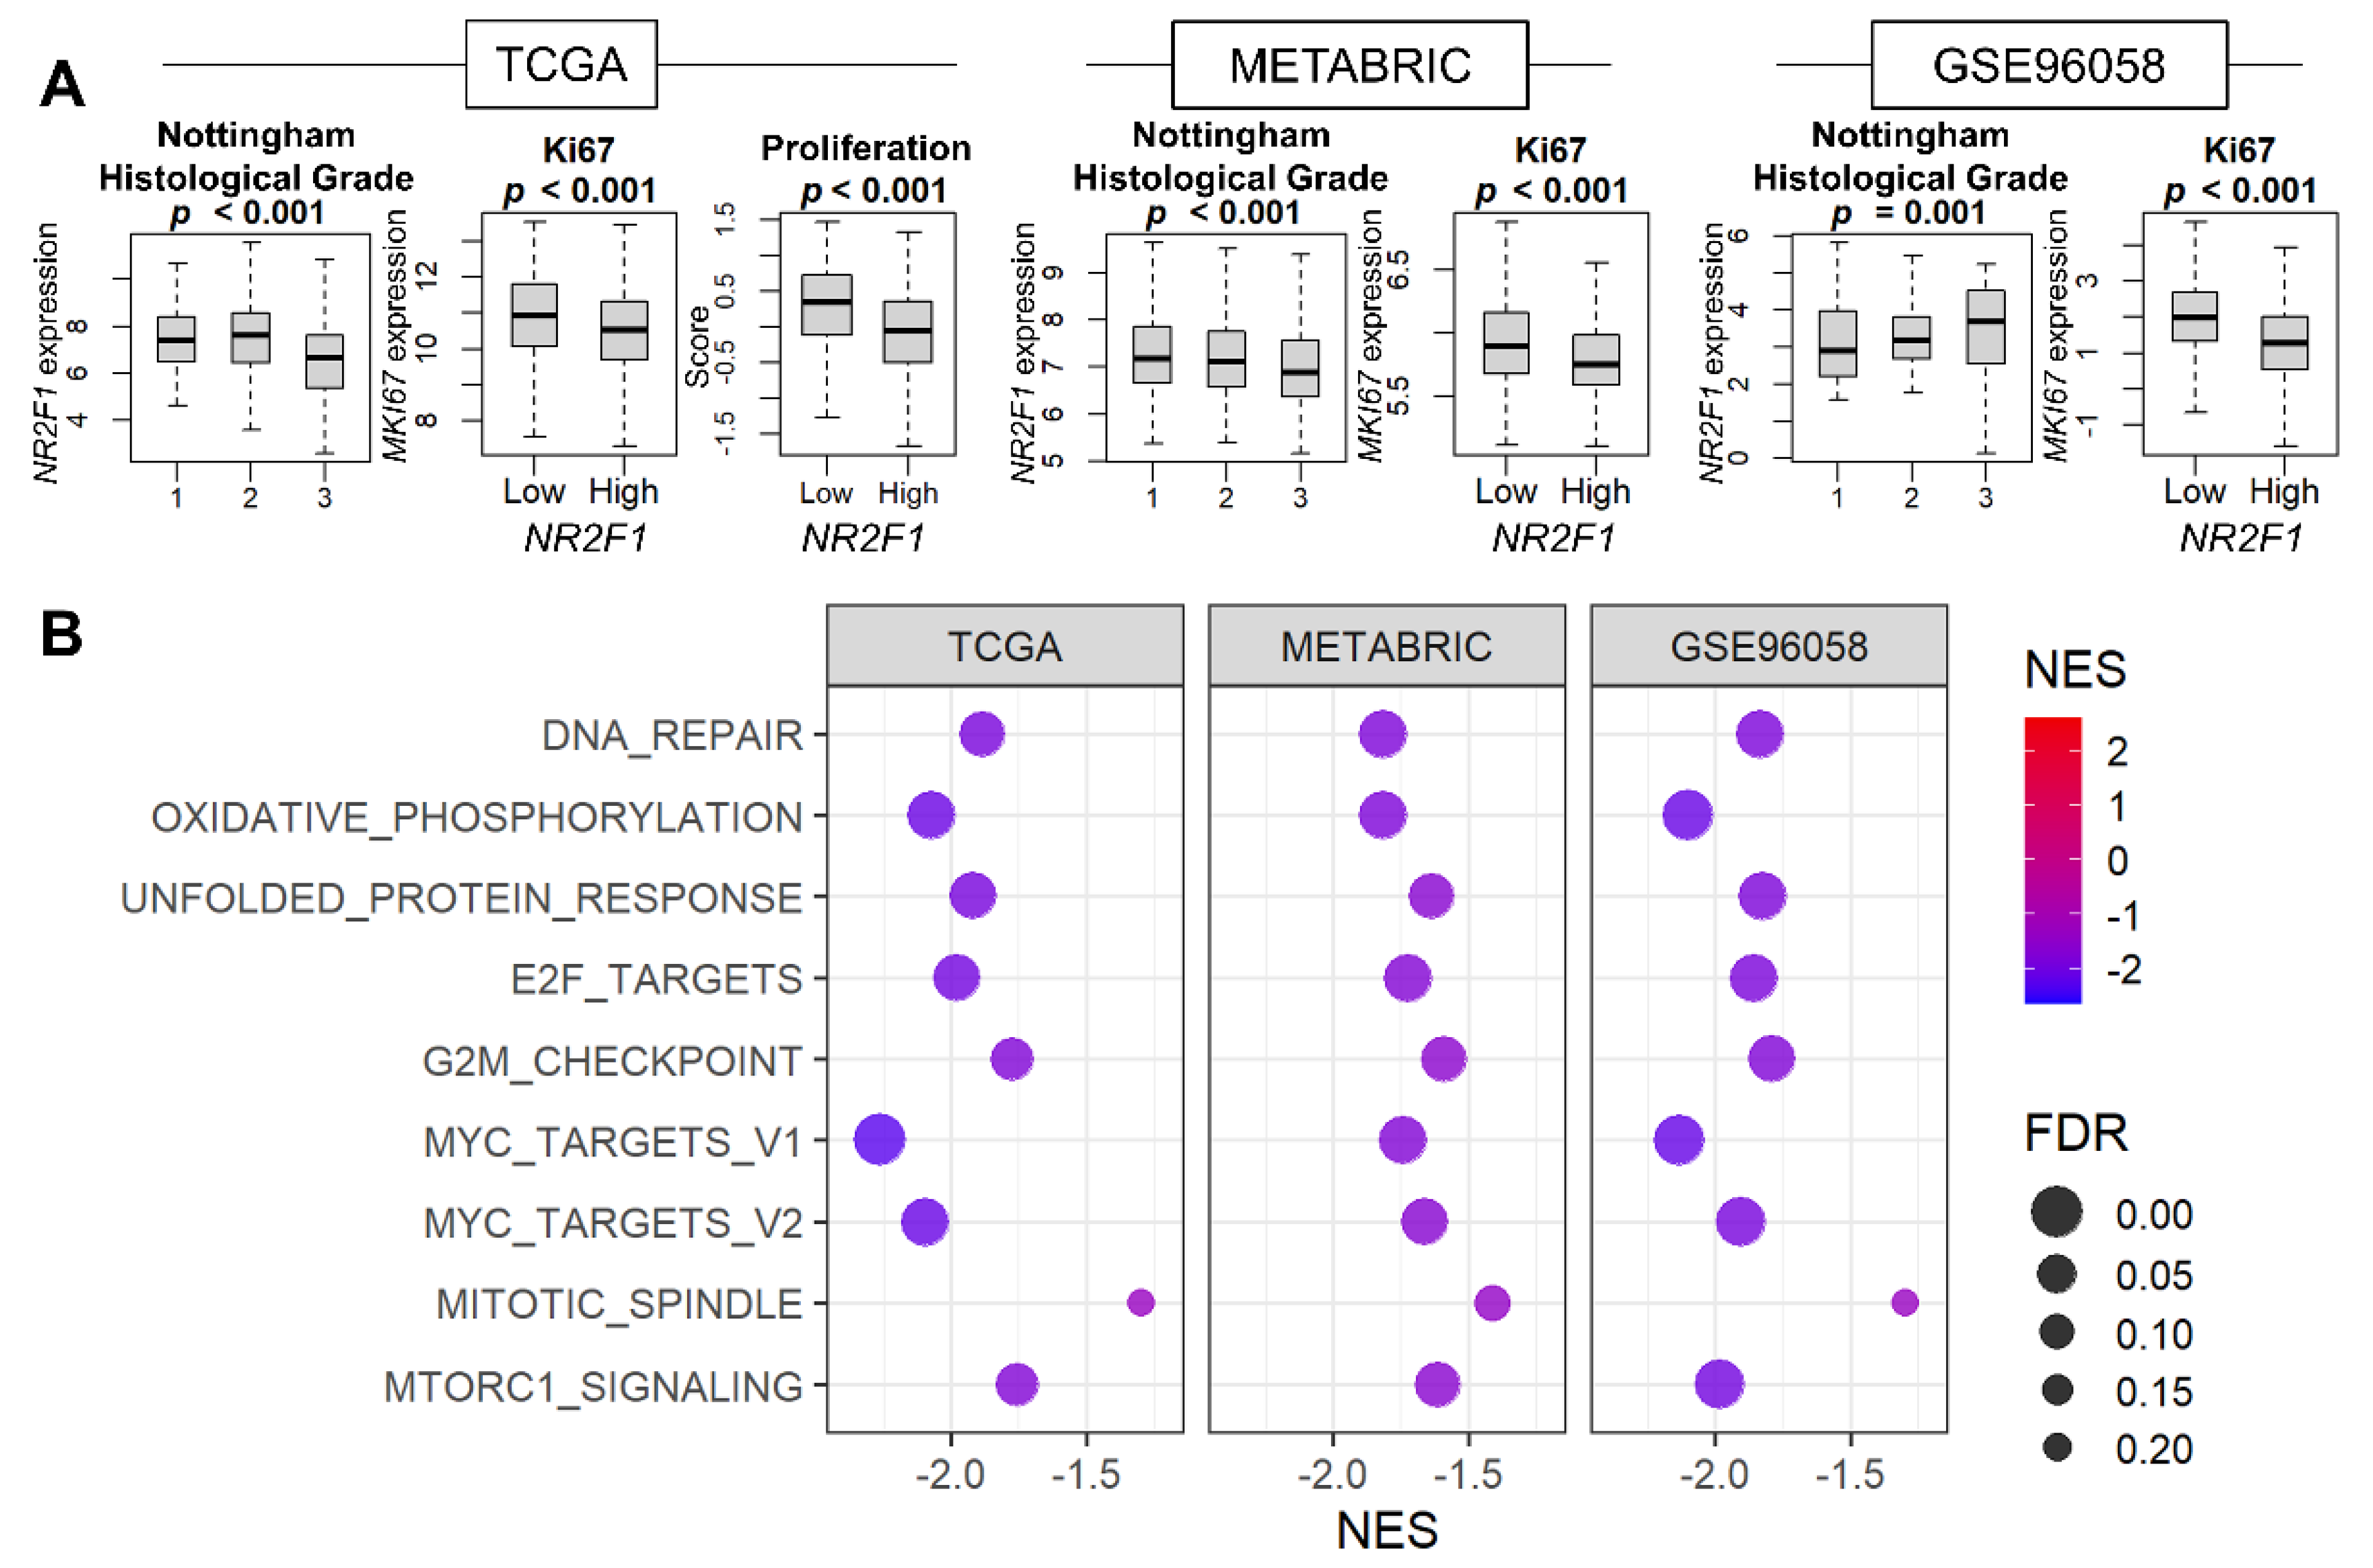
3.2. Cell Proliferation Was Consistently Suppressed in Breast Cancer with High NR2F1 Expression
Given that cell growth arrest is the major characteristic of tumor dormancy, it was of interest to investigate the relationship between NR2F1 expression and cell proliferation. The association of NR2F1 levels with the Nottingham histological grades and the cell proliferation marker MKI67 was studied for the pathological assessment of cancer cell proliferation. We found that Nottingham grade was inversely related to NR2F1 expression in TCGA and METABRIC, but not in GSE96058 (Figure 2A). MKI67 expression was lower in the NR2F1 high tumor consistently in all three cohorts, and the proliferation score calculated by Thorsson et al. was also lower in TCGA (Figure 2A). Five cell proliferation-related gene sets defined in the Hallmark collection (E2F targets, G2M checkpoint, Myc targets v1 and v2, and Mitotic spindle,) were all strongly suppressed in the high NR2F1 group in all cohorts (Figure 2B). These results suggest that NR2F1 expression in primary breast cancer is associated with low cell proliferation.
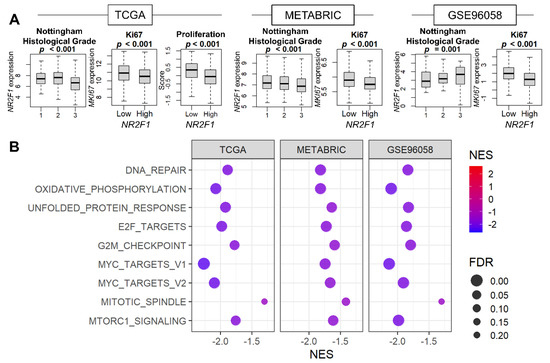
Figure 2.
Association of NR2F1 expression with cell proliferation−related measurements and pathways. (A) Boxplots of NR2F1 expression by Nottingham histological grade and MKi67 expression in three cohorts. Proliferation score based on NR2F1 high vs. low expression in TCGA cohort. The Kruskal–Wallis H test was used for three groups, and the Mann–Whitney U test was used for two−group comparison. (B) Hallmark gene sets were significantly enriched in the low NR2F1 group in all three cohorts by GSEA.
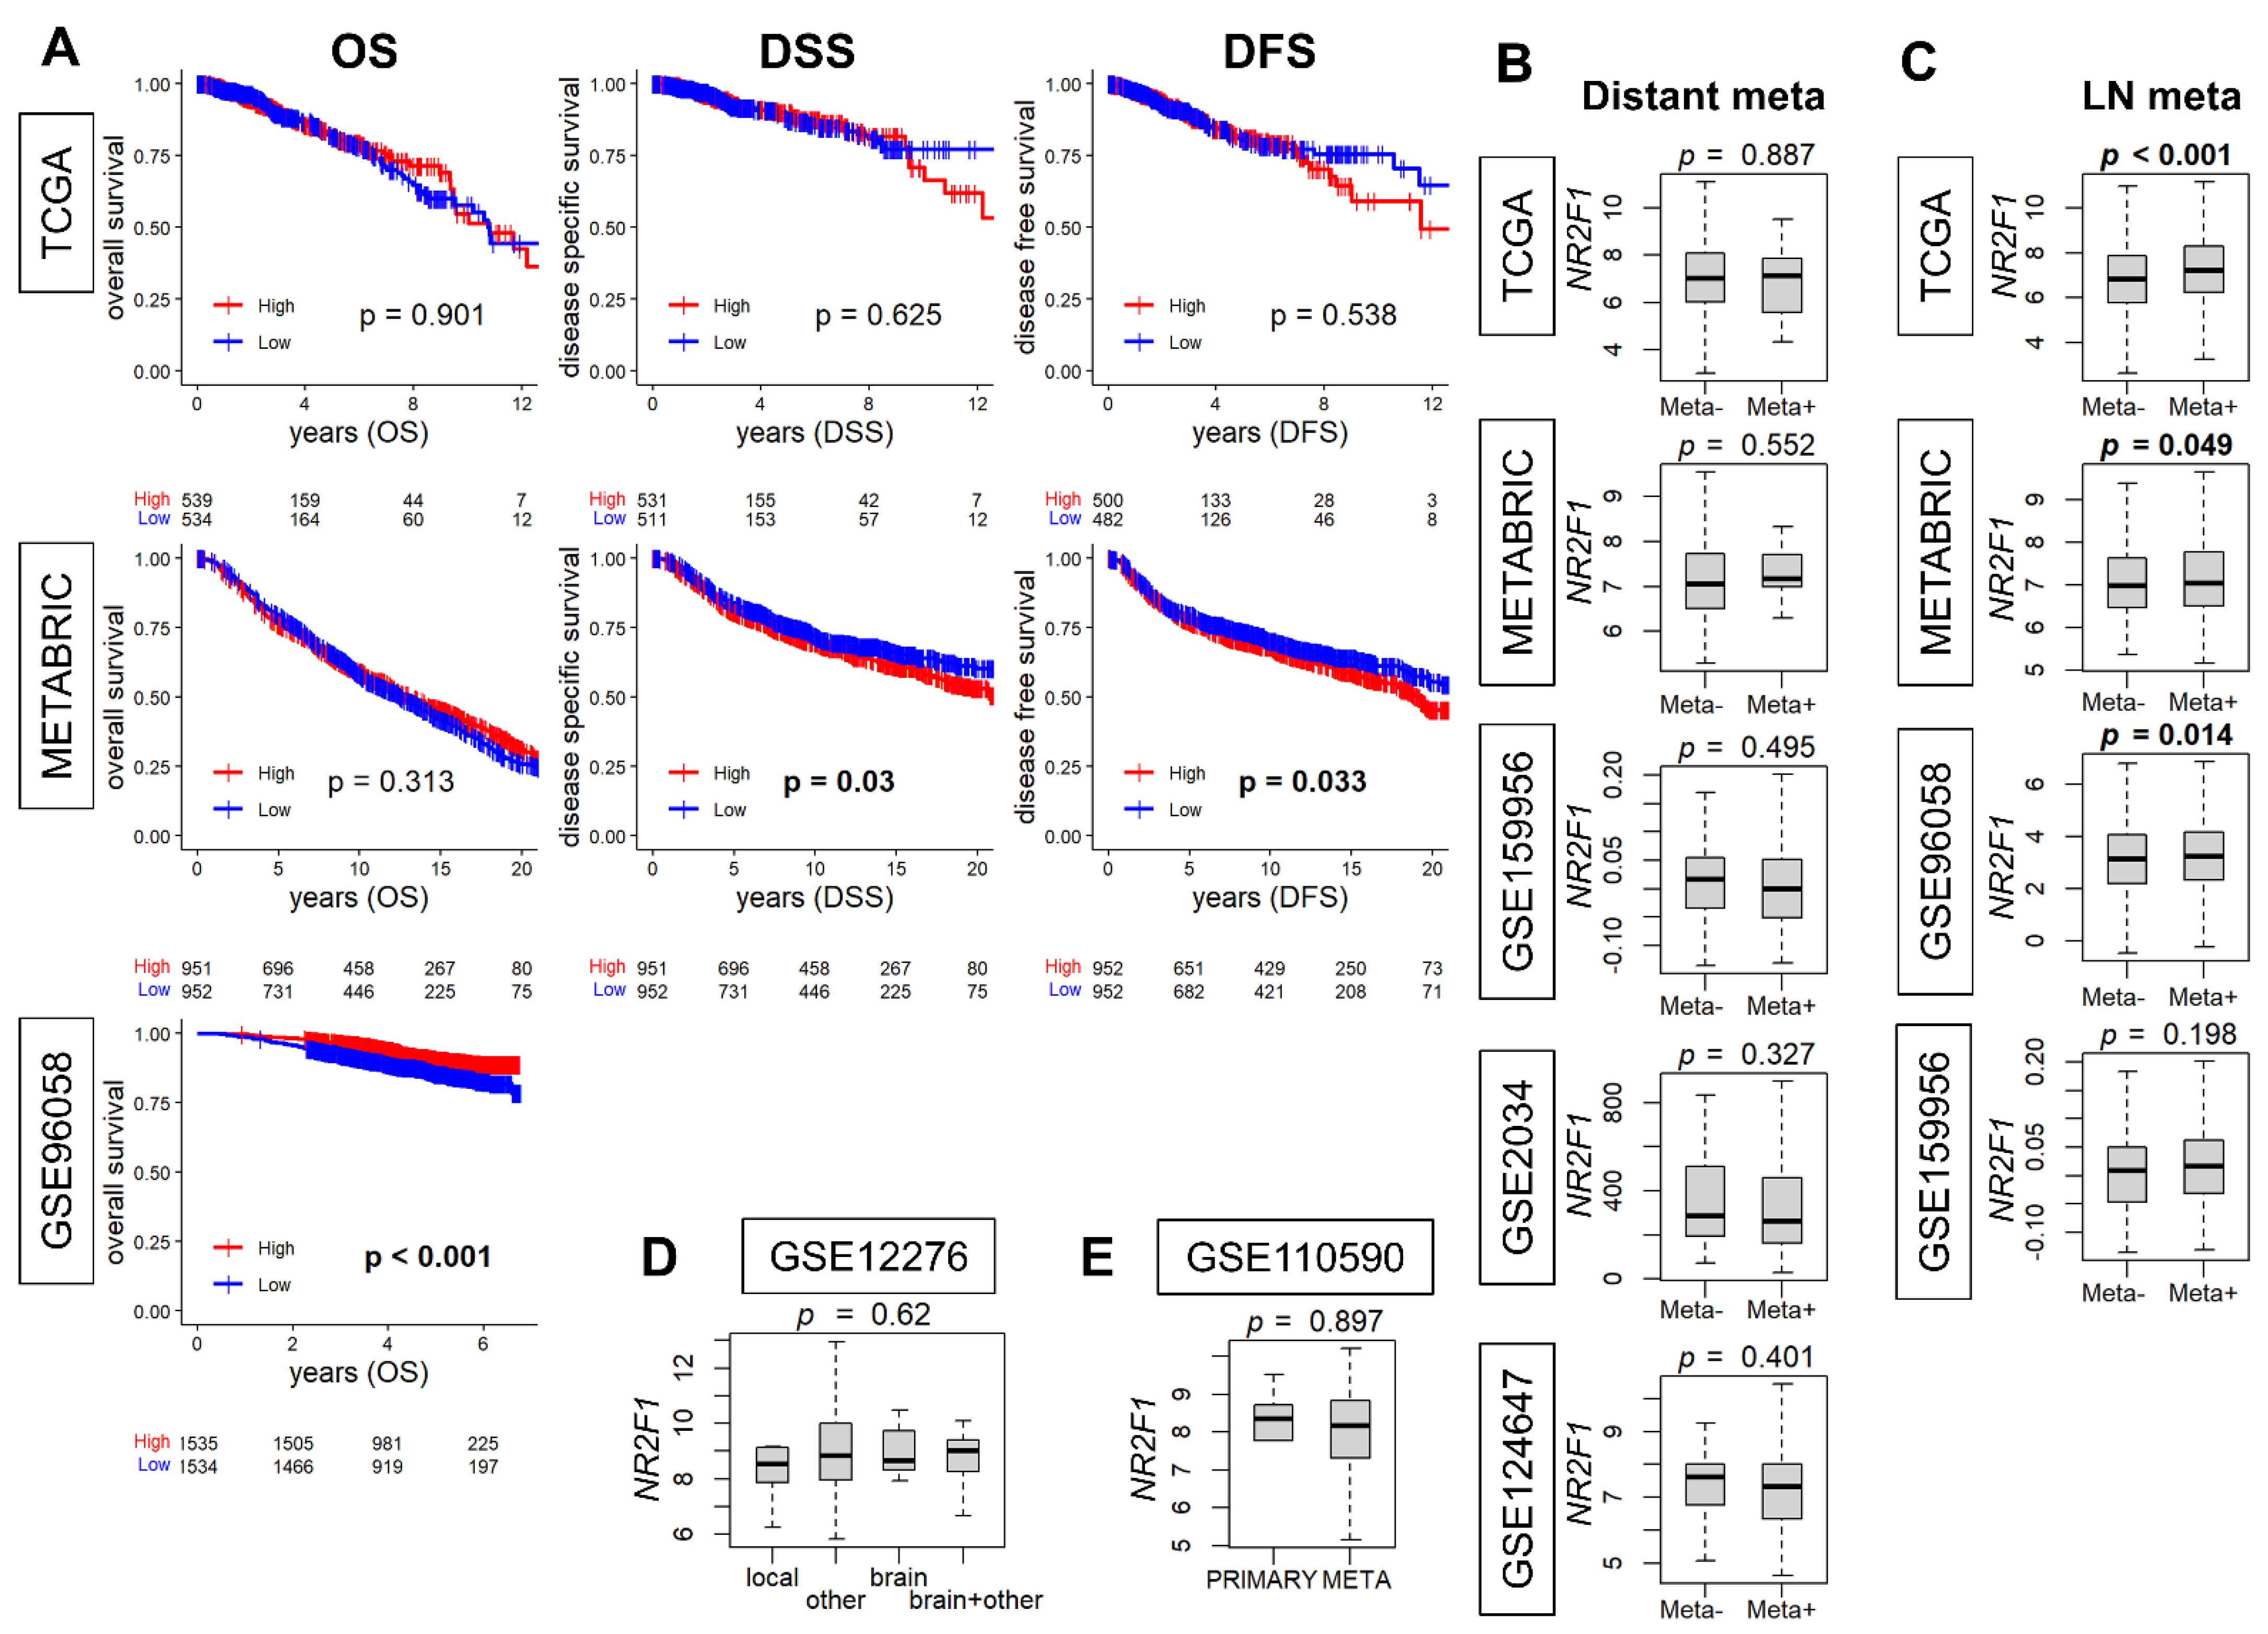
3.3. NR2F1 Expression in Primary Breast Cancer Was Higher with Lymph Node Metastasis but Was Not Consistently Associated with Distant Metastasis or Survival
When NR2F1 expression is associated with metastatic disease, it is of interest to study its relationship with clinical outcomes. Therefore, we investigated the association of NR2F1 expression with breast cancer survival. The survival analysis comparing the high and low NR2F1 expression in primary breast cancer did not show consistent results. The high-NR2F1 group showed worse disease-specific (DSS) and disease-free survival (DFS) in the METABRIC cohort, while it showed better overall survival (OS) in GSE96058. None of these results were validated by another cohort (Figure 3A). Given that breast cancer is a heterogenous disease, it was of interest to investigate the survival outcome by NR2F1 expression of each subtype. The OS of NR2F1 high triple-negative and ER-positive/HER2-negative subtypes was associated with better survival in GSE96058, and DSS of NR2F1 high HER2-positive subtypes was associated with worse survival in METABRIC. However, none of these results were validated by the other breast cancer cohorts (Supplementary Figures S1–S3). We investigated the association of NR2F1 expression with metastasis. No significant difference was found in the NR2F1 expression with and without distant metastasis in five independent primary breast cancer cohorts (Figure 3B). Conversely, NR2F1 expression was higher in the group with lymph node metastasis in three out of four cohorts (Figure 3C). In addition, there was no difference in NR2F1 expression in primary breast cancer based on the known site of relapse (Figure 3D). It was also of interest to compare the expression of NR2F1 between primary and metastatic breast cancer, but there was no difference observed in the NR2F1 expression between both groups (Figure 3E). Based on the above results, we concluded that there were no differences in the survival or metastasis by NR2F1 expression levels in the patient cohorts.
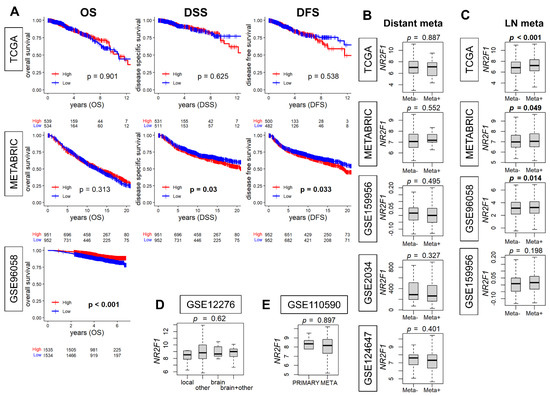
Figure 3.
Association of NR2F1 with clinical parameters. (A) Kaplan–Meier curves of overall survival (OS), disease−specific survival (DSS), and disease−free survival (DFS) based on the high and low NR2F1 expression in three large cohorts. Log−rank test was used for the analysis, and significant p values are shown in bold. (B) Boxplots showing NR2F1 expression between patients with (Meta+) and without (Meta−) distant metastasis in the five cohorts. (C) Boxplots showing NR2F1 expression between patients with (Meta+) and without (Meta−) lymph node metastasis in the four cohorts. (D) The boxplot shows NR2F1 expression of primary breast cancer by the known site of relapse. (E) The boxplot shows NR2F1 expression of primary and metastatic breast cancer. Cohort names are indicated in the figure, and Mann–Whitney U and Kruskal–Wallis H tests were used for analysis. Significant p values are shown in bold. p < 0.05 was considered significant.
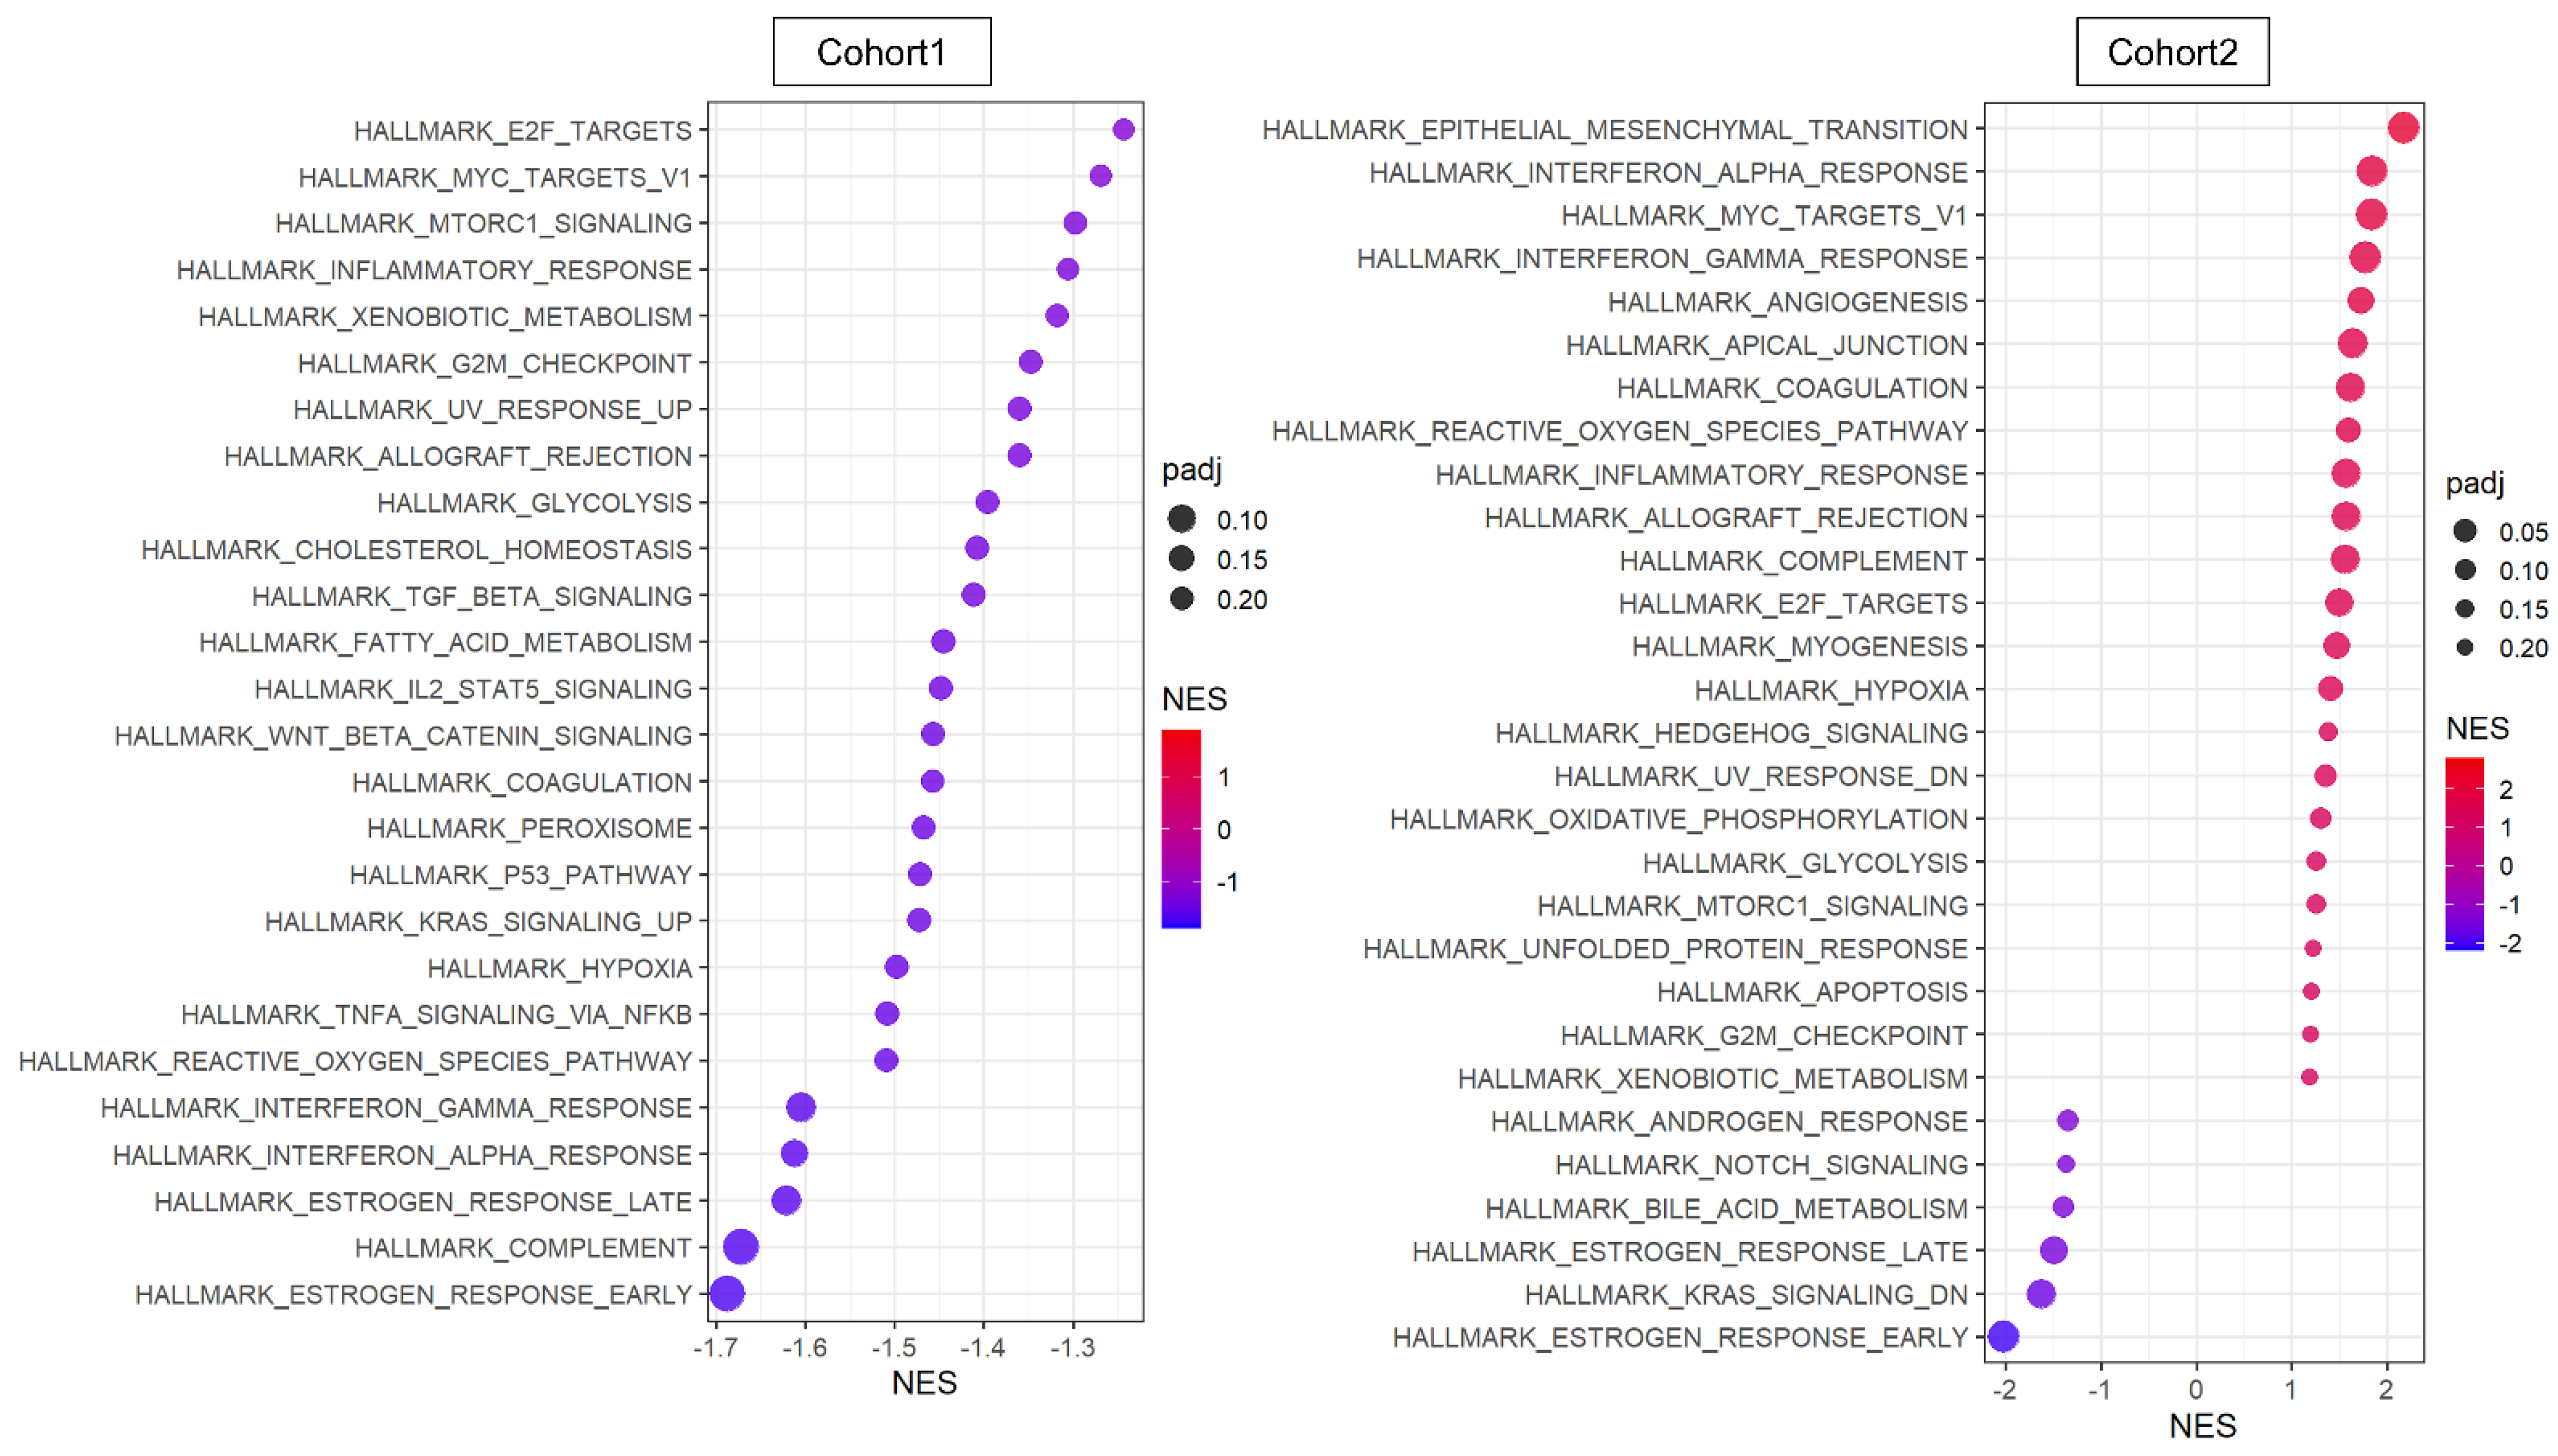
3.4. Cancer Cells That Express NR2F1 Were Not Associated with Upregulation of Metastasis-Related Gene Sets or with Downregulation of Cell Proliferation-Related Gene Sets
The transcriptome of the patient cohorts was obtained from bulk tumors, which is a mixture of messenger-RNA expression signals from all cell types in the TME. Therefore, it was of interest to investigate the pathway that is involved with NR2F1 expression solely within cancer cells. We used two primary breast cancer single-cell sequencing cohorts, Cohort 1 and 2 [46,47], where 5.1% and 2.7% of cancer cells excluding the other cell types expressed any NR2F1 mRNA (NR2F1-positive group), respectively. GSEA showed minimal concordance between the two cohorts in the NR2F1-positive group (Figure 4). In contrast to the bulk tumor results, TGFβ and cancer stem cell-related pathways were not enriched in NR2F1-positive cancer cells, and conversely, TGFβ signaling and Wnt/β-catenin signaling gene sets were suppressed in Cohort 1 (Figure 4 left). Cell proliferation pathways such as E2F targets, Myc targets v1, G2M checkpoints, and mTOR signaling were suppressed in NR2F1-positive cancer cells of Cohort 1 but were enriched in that of Cohort 2. EMT gene set was enriched in the NR2F1-positive group in Cohort 2, but not in Cohort 1. These results show that cancer cells from breast cancer patients that express NR2F1 were not consistently associated with common pathways seen in tumor dormancy.
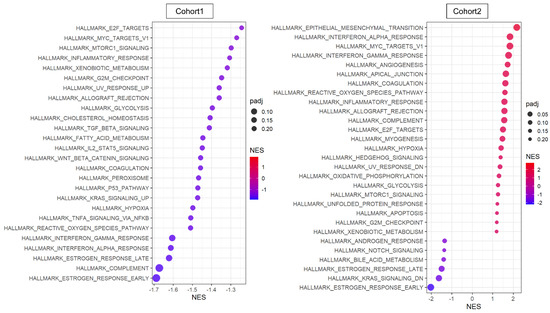
Figure 4.
Pathway analysis of cancer cells that expressed any amount of NR2F1. Dot plots showing GSEA comparing cancer cells with positive and negative NR2F1 expression in single−cell Cohort 1 (left) and Cohort 2 (right). Only significant gene sets from HALLMARK are shown in the figure. The size of each dot represents adjusted p value, and the x−axis and color tone represent NES.
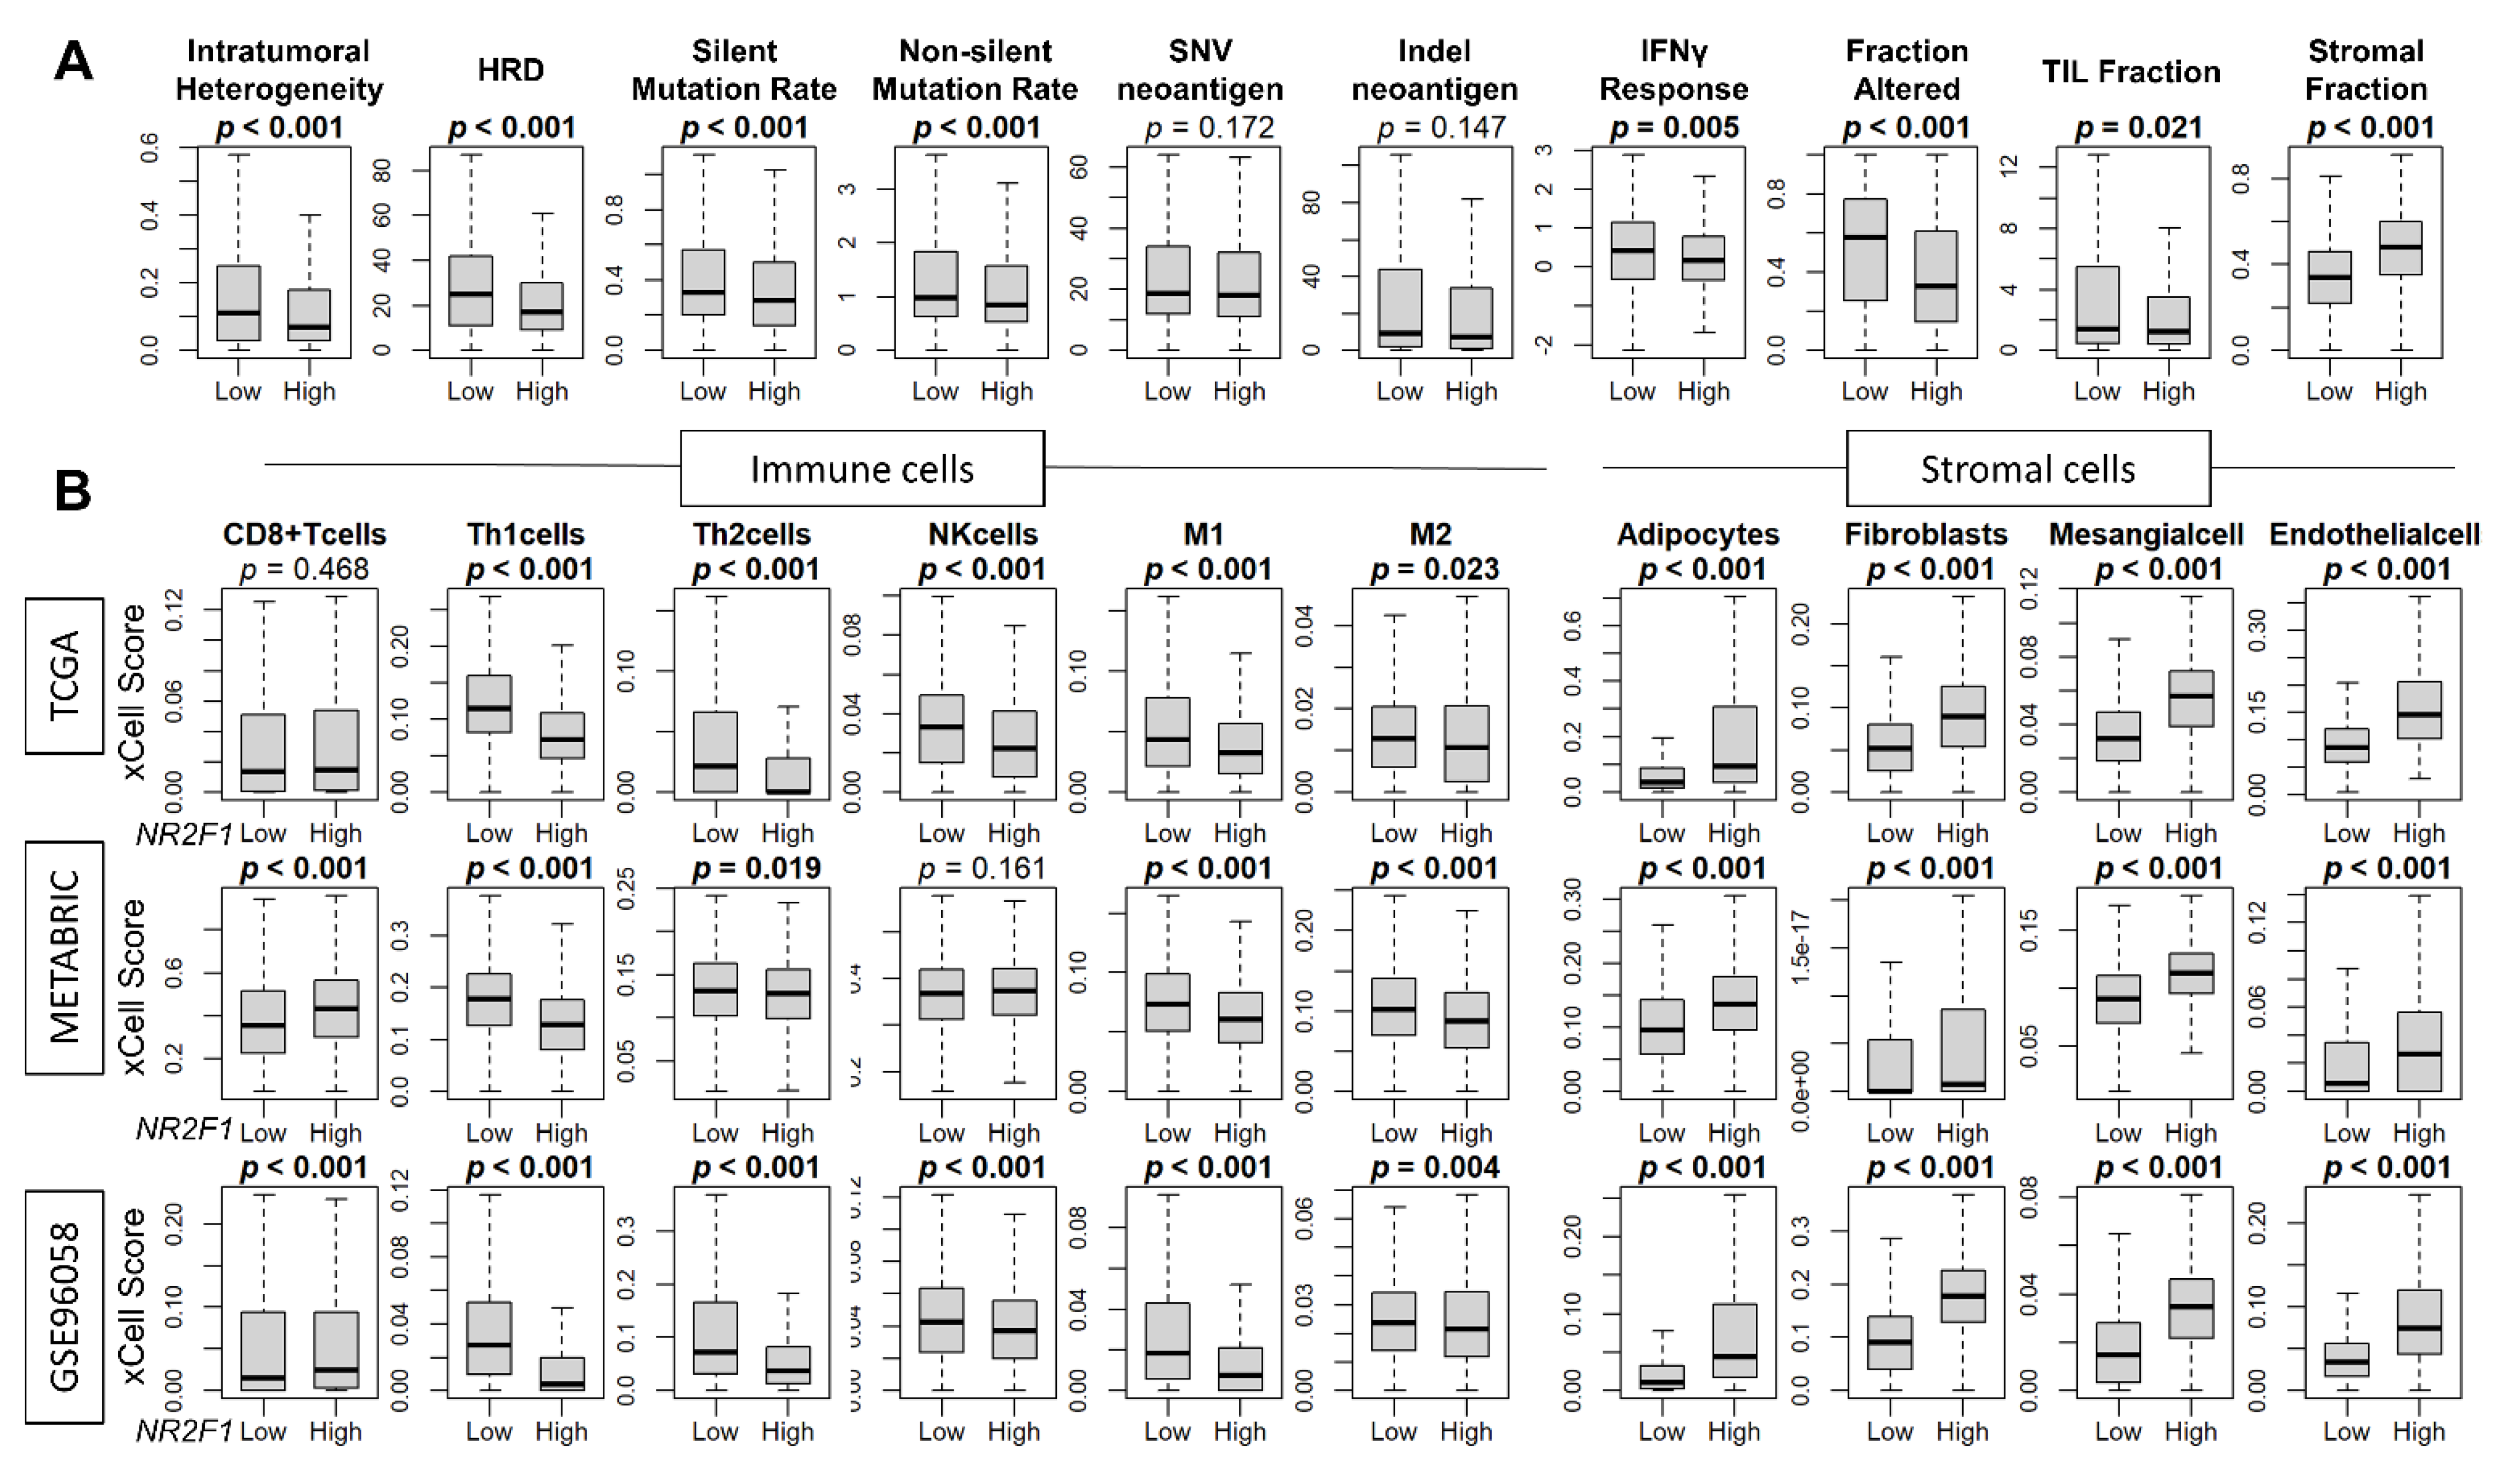
3.5. High Expression of NR2F1 Was Associated with a Lower Mutational Rate, Less Immune Response, and Less Infiltration of Immune Cells, but a Higher Abundance of Stromal Cells
Since breast cancer cells in patients that express any NR2F1 did not consistently demonstrate the phenotype of dormancy, we investigated the association of NR2F1 expression and cancer cell mutation rates, as well as the cell fractions that constitute the TME of the NR2F1 high expression breast cancer. Intratumoral heterogeneity, homologous recombination deficiency (HRD), silent and non-silent mutation rates were all decreased in NR2F1-high tumors in TCGA (Figure 5A). Cancer immune activity measured by interferon (IFN)-γ response, fractional change, and tumor-infiltrating lymphocytes (TIL) fraction were all significantly lower in the NR2F1-high tumors in TCGA (Figure 5A). In agreement, the fraction of immune cells such as T helper type 1 (Th1) cells, T helper type 2 (Th2) cells, and M1 and M2 macrophages was significantly lower in the NR2F1-high tumors consistently in GSE96058, METABRIC, and TCGA cohorts (Figure 5B). Conversely, stromal cells such as adipocytes, fibroblasts, mesangial cells, and endothelial cells were all significantly abundant in NR2F1-high tumors consistently in TCGA, METABRIC, and GSE96058 cohorts (Figure 5B). Further analysis by each immunohistological subtype showed the same trend that the fraction of stromal cells was significantly higher in the NR2F1 high group across multiple cohorts (Supplementary Figures S4–S6). These data suggest that NR2F1-high breast cancers have less immune response, less immune cell infiltration, and a higher density of stromal cells.
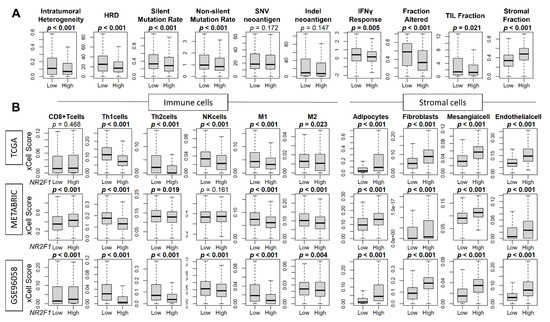
Figure 5.
Association of NR2F1 with immunity within the tumor microenvironment. (A) Boxplots showing various scores based on high and low NR2F1 expression in TCGA. Intratumoral heterogeneity, homologous recombination deficiency (HRD), silent/non-silent mutation rate, SNV/Indel neoantigen, interferon gamma response, fraction altered, tumor-infiltrating lymphocytes (TIL) fraction, and stromal fraction. (B) Boxplots showing immune and stromal cell fractions between NR2F1 high and low groups in three large cohorts. Mann–Whitney U test was used to compare the two groups, and p values are shown in bold for significant results (p < 0.05).
3.6. Cancer-Associated Fibroblasts (CAF), Not Cancer Cells, Were the Major Contributor to the NR2F1 Expression Signal in a Bulk Breast Tumor
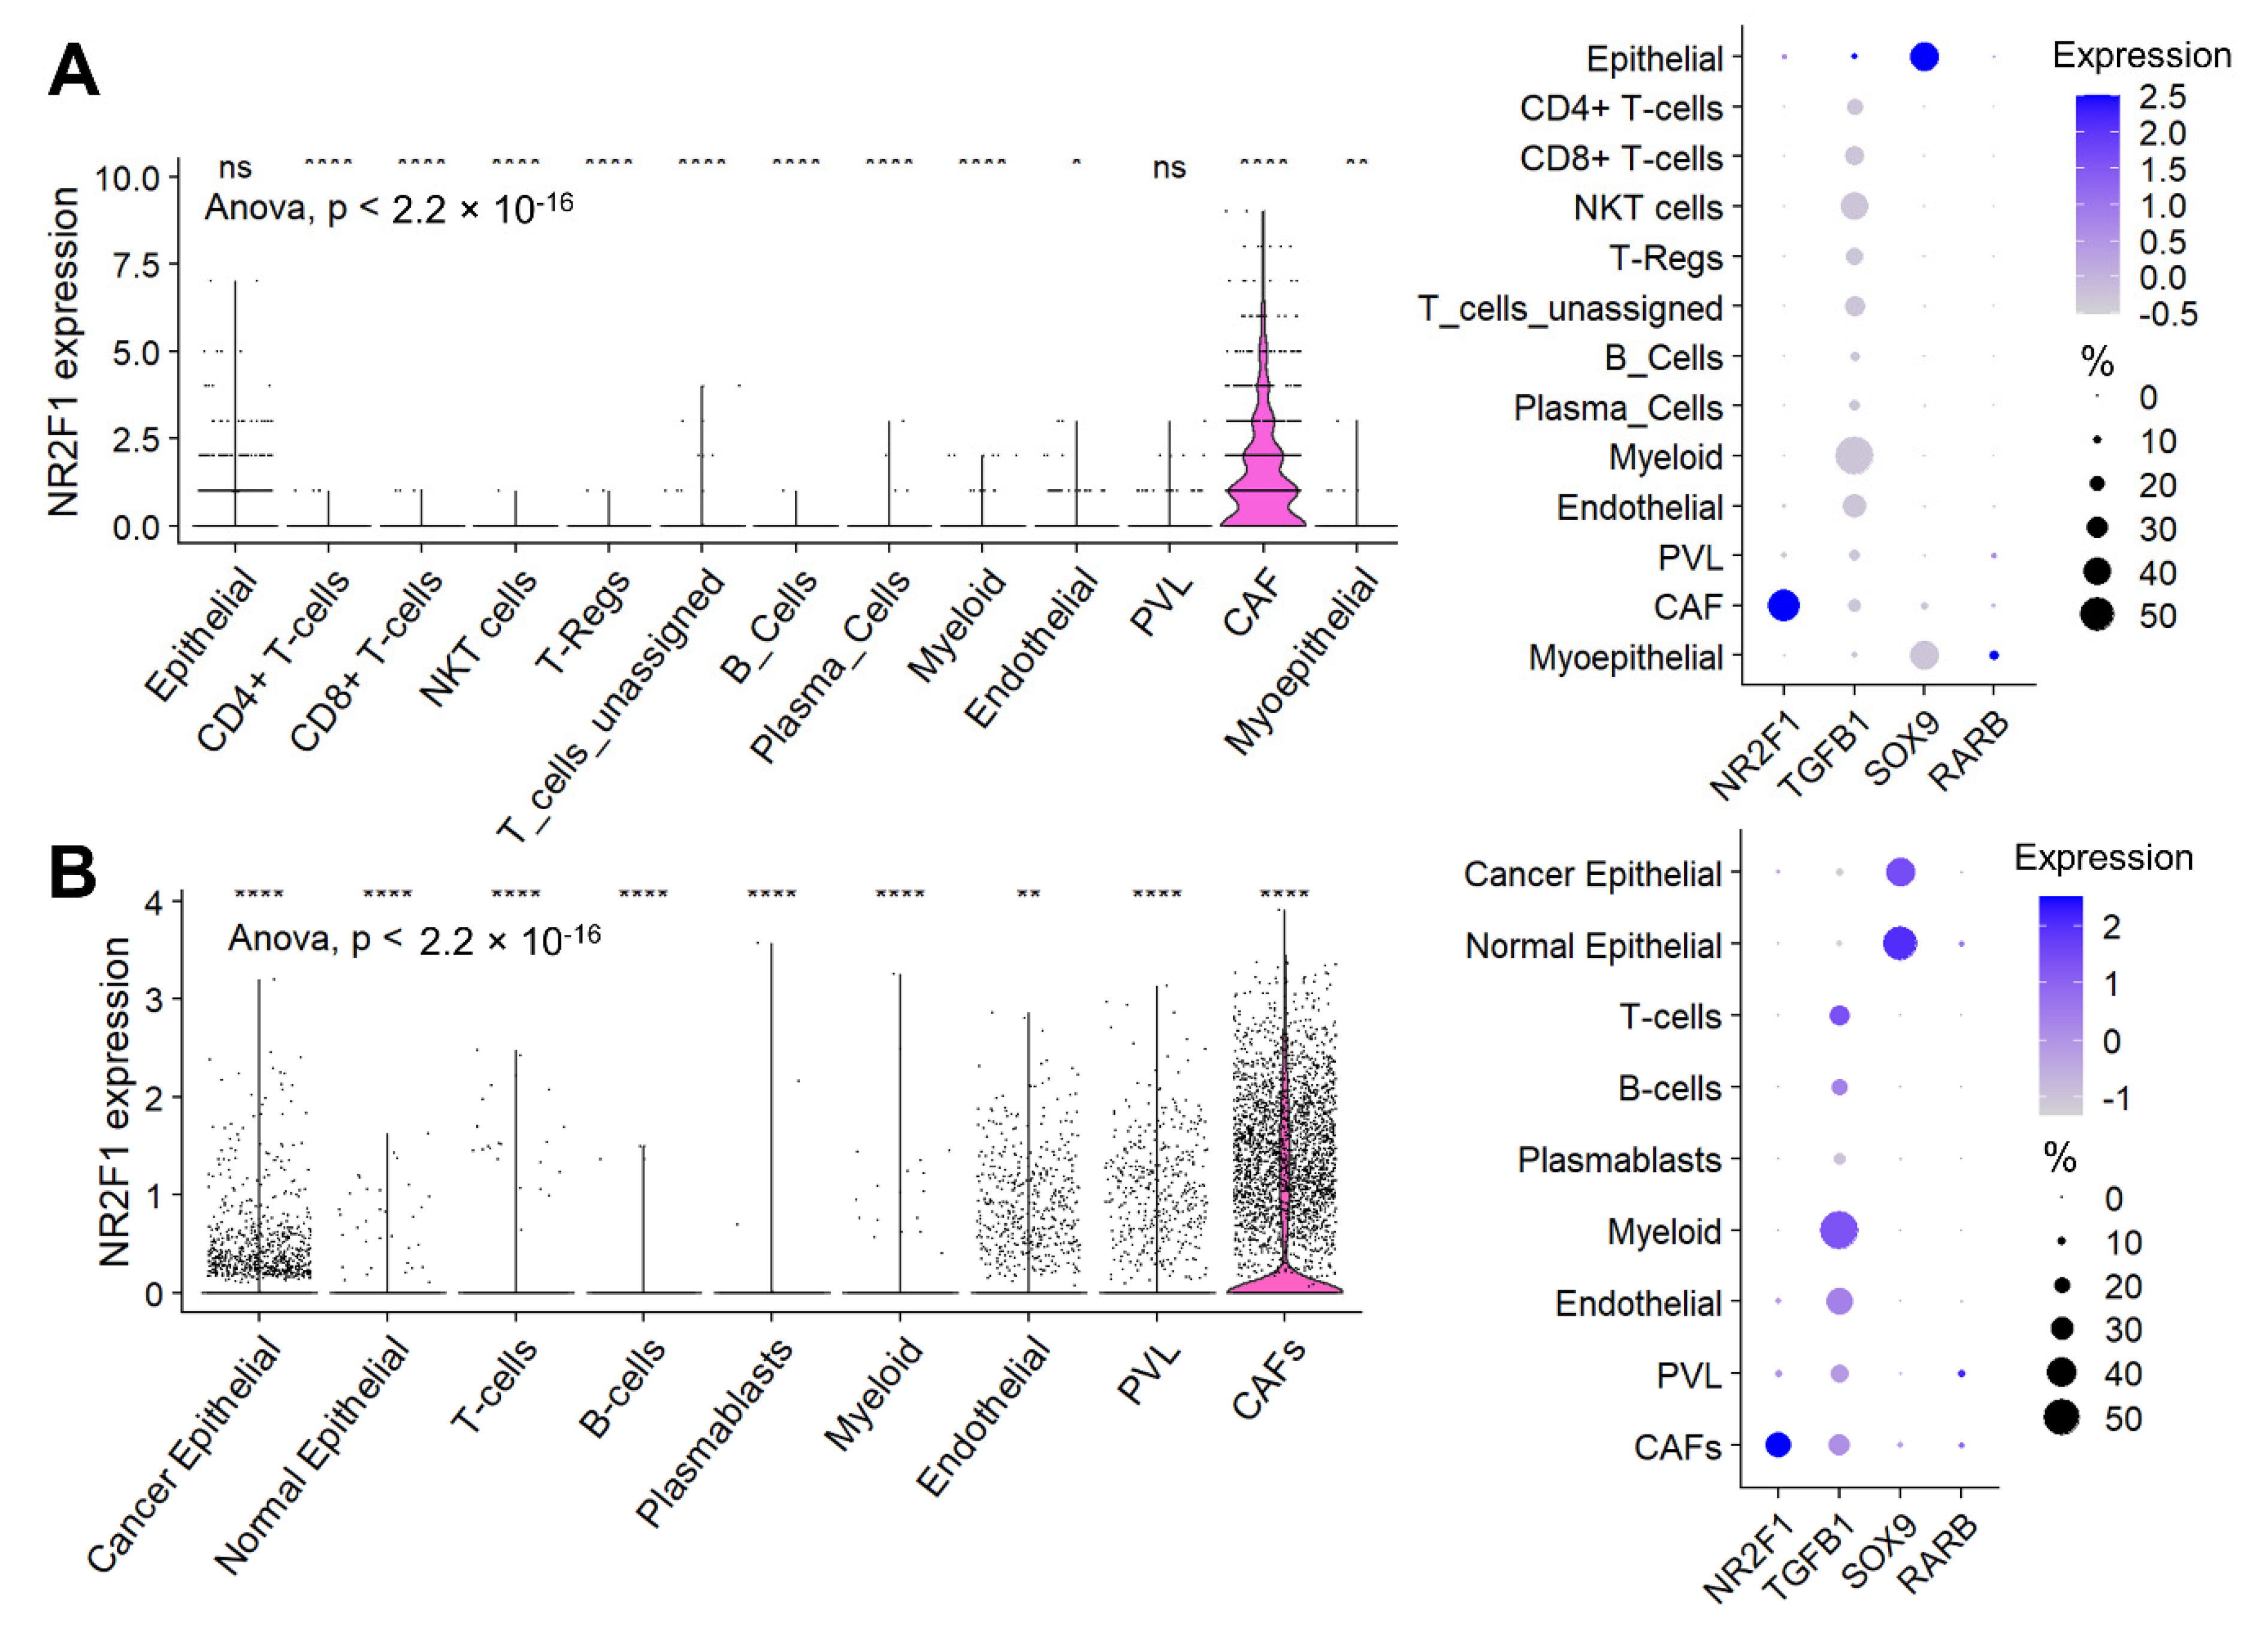
Given the high infiltration of stromal cells in the NR2F1-high tumors, we investigated the cell type that contributes to the NR2F1 gene expression signal using single-cell sequencing cohorts. In Cohort 1, cancer-associated fibroblasts (CAFs) were the predominant cells followed by cancer (epithelial) cells that expressed NR2F1 among all the cell types, as shown in Figure 6A (left). Unlike for NR2F1, which was almost exclusively expressed in CAFs, for the other dormancy-related genes: TGFB1 was predominantly expressed by myeloid cells followed by endothelial cells and lymphocytes, SOX9 was predominantly expressed in cancer (epithelial) cells followed by normal (myo)epithelial cells, and RARB was expressed weakly in normal (myo)epithelial cells, CAFs and perivascular-like cells (PVL) (Figure 6A right). These results were strikingly mirrored in Cohort 2 (Figure 6B), and they were similar regardless of the subtypes in Cohort 2 (Supplementary Figure S7A).
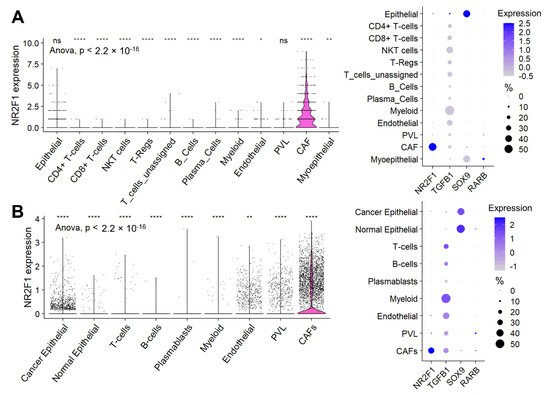
Figure 6.
Expression of NR2F1 and dormancy−related genes by cell types. (A) The violin plot on the left shows NR2F1 expression of single-cell Cohort 1 by cell type: epithelial cells, CD4+ T-cells, CD8+ T-cells, natural killer T-cells (NKT), regulatory T-cells (T-reg), unassigned T-cells, B-cells, plasma cells, myeloid cells, endothelial cells, perivascular like cells (PVL), cancer-associated fibroblast (CAFs), and myoepithelial cells. One dot represents one cell. After multi-group comparison, baseline NR2F1 expression and expression in each cell type were compared in two groups by one-way ANOVA test. The dot plot on the right shows NR2F1, TGFB1, SOX9, and RARB expression by cell type in the single-cell Cohort 1. The size of each dot indicates the number of cells, and the purple intensity indicates the expression level. (B) The violin plot on the left shows NR2F1 expression of single-cell Cohort 2 by cell type: cancer epithelial cells, normal epithelial cells, T cells, B cells, plasmablasts, myeloid cells, endothelial cells, PVL, and CAFs. The dot plot on the right shows NR2F1, TGFB1, SOX9, and RARB expression by cell type in the single-cell Cohort 2. Symbols in the figure are as follows: ns, p > 0.05; *, p ≤ 0.05; **, p ≤ 0.01; ****, p ≤ 0.0001.
3.7. NR2F1 Was More Highly Expressed in Inflammatory CAFs, and in CAFs with Lymph Node Metastasis and in More Advanced Stages, but No Differences Were Observed in Cancer Cells
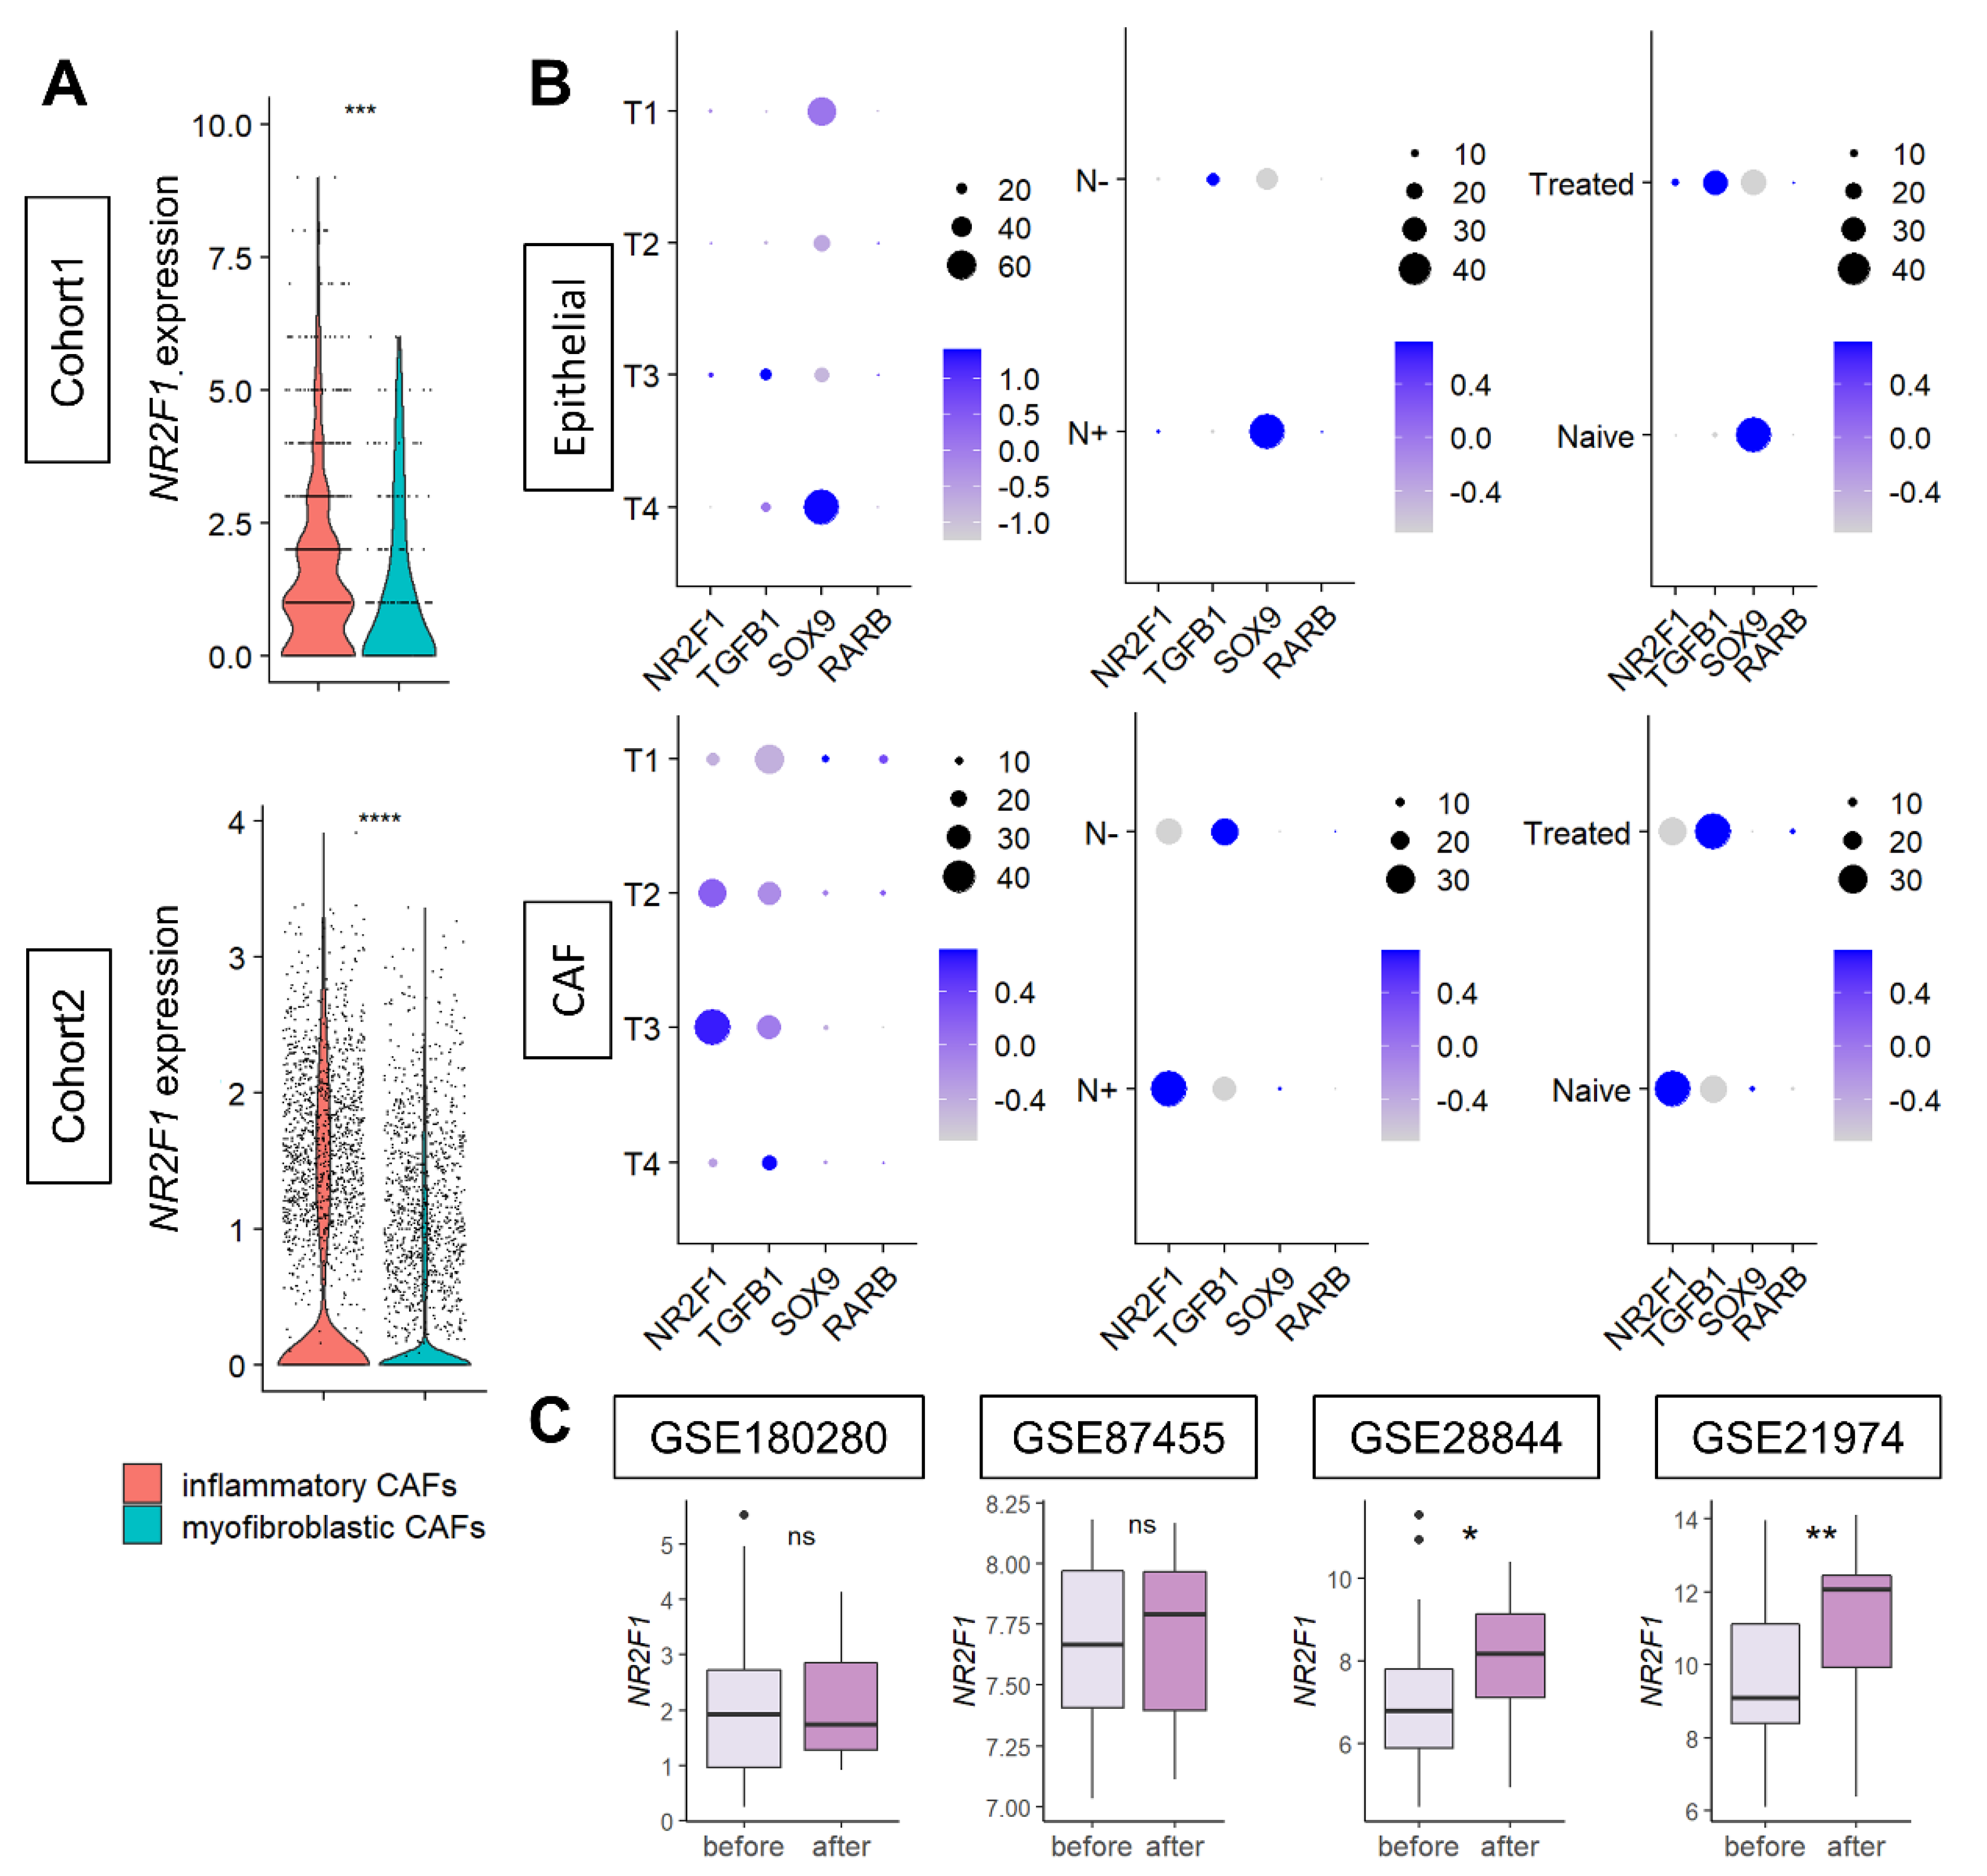
Since CAFs were the major contributor to NR2F1 gene expression, we further investigated the types of CAFs that express NR2F1. NR2F1 was found to be consistently highly expressed in inflammatory CAFs, compared to myofibroblastic CAFs in both Cohort 1 and Cohort 2 (Figure 7A), regardless of the subtypes (Supplementary Figure S7B).
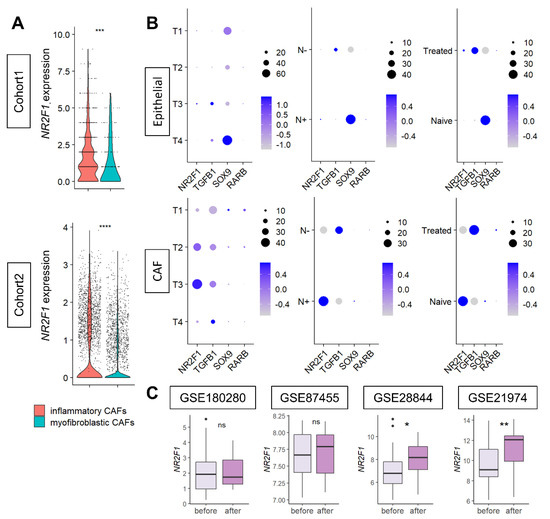
Figure 7.
(A) Violin plots showing NR2F1 expression of inflammatory CAF (iCAF) and myofibroblastic CAF (myCAF) of the two single−cell cohorts. One dot represents one cell. One−way ANOVA test was performed, and *** indicates p ≤ 0.001. (B) Dot plots showing NR2F1, TGFB1, SOX9, and RARB expressions in epithelial (cancer) cells and CAFs of single−cell Cohort 2 by T category of AJCC TNM staging, with and without lymph node metastasis, and with and without prior drug therapy. The size of each dot indicates the number of cells, and the purple intensity indicates the expression level. (C) Boxplots showing NR2F1 expression before and after neoadjuvant chemotherapy in the four cohorts. Mann–Whitney U test was used for analysis, and the symbols in the figure are as follows: ns, p > 0.05; *, p ≤ 0.05; **, p ≤ 0.01, ****, p ≤ 0.0001.
Next, it was of interest to investigate the expression levels of tumor dormancy markers based on the cancer progression (tumor size and lymph node metastasis) and based on the effect of chemotherapy on cancer (epithelial) cells and CAFs. Single-cell sequence Cohort 2 was analyzed, as it contains clinical information. Levels of expression of tumor dormancy markers in primary breast cancer were compared before and after neoadjuvant chemotherapy by anthracyclines and taxanes in four cohorts. Few cancer (epithelial) cells expressed NR2F1 and TGFB1. SOX9 was highly expressed in the T4 or tumors with lymph node metastasis or without treatment (Figure 7B upper). Conversely, in CAFs, NR2F1 expression was higher in T3 or tumors with lymph node metastasis, TGFB1 was higher in larger T categories or without lymph node metastasis, and there was little difference in SOX9 expression (Figure 7B). NR2F1 expression was higher in treatment naïve than in treated CAFs, which was opposite the results that were observed in cancer cells (Figure 7B). Little RARB expression was detected in either type of cell. See Supplementary Figure S8 for violin plots of NR2F1, TGFB1, SOX9, and RARB expression in cancer cells and CAFs. In summary, we found that higher NR2F1 expression in CAFs was associated with tumors of larger size and with lymph node metastasis. NR2F1 expression was significantly higher after treatment in two out of four neoadjuvant cohorts (Figure 7C). There was no difference in NR2F1 expression between responder and non-responder to neoadjuvant endocrine therapy (Supplementary Figure S9). The details of neoadjuvant treatment for each cohort are summarized in Supplementary Table S1.
4. Discussion
In this study, we demonstrated that NR2F1 gene expression in a bulk breast tumor is associated with metastasis-related as well as stem cell-related pathways, including suppression of cell proliferation, but it is not associated with distant metastasis or survival. We also found that NR2F1 is most strongly expressed in cancer-associated fibroblasts (CAFs) and not in cancer cells in the tumor microenvironment (TME). NR2F1 is a known marker of tumor dormancy and is expressed higher in dormant cell lines and bone metastatic clone cells. The cancer stem cell-related pathways, as well as metastasis-related pathways, were enriched in the NR2F1-high expressing bulk breast tumor. NR2F1 expression was lower in tumors with high Nottingham grade, high Ki67 expression, and high proliferation scores. All five cell proliferation-related pathways from the Hallmark collection were less enriched in the high NR2F1 tumors. All these results indicated that NR2F1 expression was associated with suppressed cell proliferation, which agrees with the notion that NR2F1 is a tumor dormancy marker. Conversely, there was no consistent association between NR2F1 expression and survival among the three cohorts, and no coherent relationship was observed between NR2F1 expression in primary breast cancer and distant metastases. Therefore, we performed gene set enrichment analysis exclusively on cancer cells from single-cell sequence cohorts and found that there was no consistent enrichment of metastasis-related, stem cell-related gene sets or suppression of cell proliferation-related gene sets in NR2F1 high cancer cells. There was no difference in mutation rates by the level of NR2F1 expression in a bulk tumor, however; immune-related scores such as IFN-γ response and TIL fractionation, as well as immune cell infiltrations such as Th1 and Th2 T cells and M1 and M2 macrophages, were all less in NR2F1 high expression breast tumors. On the contrary, stromal cells such as adipocytes, fibroblasts, and endothelial cells were more abundant in these tumors. NR2F1 was rarely expressed in cancer cells and was most prominently expressed in CAFs, as assessed by cell types in a single-cell sequence cohort and validated in another cohort. Among the CAF types, NR2F1 expression was higher in inflammatory CAF than in myofibroblastic CAF as well as in larger-size tumors and tumors with lymph node metastasis. Finally, NR2F1 expression was higher in CAFs without treatment compared to those treated with chemotherapy, whereas NR2F1 expression was higher in cancer cells that underwent treatment compared to those that are not treated. There was no consistent increase in NR2F1 expression after treatment in bulk tumors.
NR2F1 is an orphan nuclear receptor [58] that regulates enhancer elements during human neural crest cell differentiation [59], which also interacts with chromatin remodeling enzymes and mediates histone modifications [60]. Because of this pleiotropic regulation and proliferation suppression, NR2F1 has been identified as a master regulator of tumor dormancy [21]. SOX9, RARβ, and TGF-β are key genes that are related to dormancy as well as to Wnt and Notch pathways [18,61]. The NR2F1 high-expression bulk breast tumors in the cohorts we analyzed were consistent with suppressed cell proliferation, higher expression of dormancy-related genes, and enrichment of pathways as observed in the previous reports. Dormant cells can originate and disseminate even from early-stage cancers [10,62]. In agreement, we observed that the EMT pathway is enriched in the high NR2F1 tumors. In addition, the NR2F1 high group showed lower mutation burden, HRD with decreased proliferation, and less immune response and immune cell infiltration, indicating immune “cold” tumors. Conversely, residual dormant tumor cells after treatment were reported to be associated with tumor heterogeneity [63], whereas intratumor heterogeneity was less in the high NR2F1-expressing breast tumors in TCGA.
Despite high NR2F1 tumors showing tumor dormancy traits consistently, NR2F1 expression was not related to survival or distant metastasis. Single-cell sequencing showed that NR2F1 was almost exclusively expressed in CAFs, and rarely in cancer cells. The transcriptome of a bulk tumor is an average of the mRNA expression in the TME. Cell types other than cancer cells in the TME can be responsible for a gene expression signature. This is in agreement with our results showing that cancer cells alone cannot enrich stem cells and metastasis-related pathways. Unlike mesenchymal markers such as αSMA, fibroblast-specific protein 1 (FSP1), and fibroblast activation protein (FAP) [64], NR2F1 has not been described to be highly expressed in breast cancer CAFs. Through interactions with several types of cells in the TME, mesenchymal stromal cells including fibroblasts may either promote or inhibit tumor growth [65,66]. This is because CAFs are a heterogeneous population of cells that can be divided into subsets with different functions. In the single-cell cohort used in this study, CAFs were classified into inflammatory CAFs (iCAFs) and myofibroblast-like CAFs (myCAFs), and NR2F1 was significantly expressed in iCAFs in both cohorts. As high NR2F1 expression is more predominantly seen in iCAFs, which are considered more “stem cell-like” since they secrete a variety of inflammatory cytokines compared to myCAFs, this can be speculated as a reason for the enrichment of multiple stem cell-related pathways in high NR2F1 tumors [46].
The current study demonstrated that NR2F1 expression in the bulk tumor of primary breast cancer is associated with decreased cell proliferation and cancer stem cell-like characteristics. Previous studies mentioned that NR2F1 was highly expressed in DTCs [67] We found that NR2F1 is most predominantly expressed in CAFs in the TME of primary breast cancer. However, the findings from our study are not ample enough to substantiate that CAF-expressed NR2F1 regulates breast tumor dormancy. The Aguirre-Ghiso group recently demonstrated that NR2F1 agonist treatment induced cancer cell dormancy [21], which raised an expectation that NR2F1 expression in primary breast cancer may have the possibility to be a biomarker. The novelty of our study is that it is CAFs, not cancer cells, that are the dominant source of NR2F1 expression in the bulk tumor. To this end, we believe that NR2F1 expression in the bulk tumor does not reflect expression in cancer cells; thus, its value as a biomarker is in doubt. NR2F1 expression in cancer cells of primary breast cancer was not associated with cancer stem cell-like characteristics at all. In order to prove that CAF-expressed NR2F1 regulates breast tumor dormancy, one needs to analyze the single-cell sequencing data and show whether the late recurrence in other organs, such as lungs, bones, and brain, other than lymph nodes, is correlated with NR2F1 expression in CAFs.
Our study has some limitations. A major limitation is that it is a retrospective study with potential selection bias, particularly regarding clinical factors, which include data from decades ago and therefore fails to include the prognostic impact of recent treatments. Furthermore, variations among bulk tumor samples of the cohorts may result in sampling bias due to differences in the proportion of the stromal area. For single-cell cohorts, we used cell annotations at the time of cohort publication; therefore, it includes the resolution limitations of single-cell annotation techniques at that time. Finally, all the data are derived in silico analysis, and as the study does not include experimental validation of the data, we cannot prove any cause–effect relationships in TME.
5. Conclusions
The tumor dormancy marker NR2F1 expression in primary breast cancer is associated with less cell proliferation, and it is predominantly expressed in cancer-associated fibroblasts in the tumor microenvironment.
Supplementary Materials
The following supporting information can be downloaded at: https://www.mdpi.com/article/10.3390/cancers14122962/s1, Supplementary Figure S1: Survival analysis between high and low NR2F1 groups in triple-negative breast cancer. Supplementary Figure S2: Survival analysis between high and low NR2F1 groups in ER-positive and HER2-negative breast cancer. Supplementary Figure S3: Survival analysis between high and low NR2F1 groups in HER2-positive breast cancer. Supplementary Figure S4: Association of NR2F1 with immunity within the tumor microenvironment of triple-negative breast cancer. Supplementary Figure S5: Association of NR2F1 with immunity within the tumor microenvironment of ER-positive and HER2-negative breast cancer. Supplementary Figure S6: Association of NR2F1 with immunity within the tumor microenvironment of HER2-positive breast cancer. Supplementary Figure S7: Expression of NR2F1 and dormancy-related genes by immunohistological breast cancer subtypes in Cohort 2. Supplementary Figure S8: Expression of NR2F1, TGFB1, SOX9, and RARB in cancer cells and CAFs in Cohort 2. Supplementary Figure S9: Expression of NR2F1 between endocrine therapy responder and non-responder in hormone-positive primary breast cancer. Supplementary Table S1: Details of neoadjuvant chemotherapy or endocrine therapy used in each cohort.
Author Contributions
Conceptualization, R.W., T.I. and K.T.; formal analysis, R.W.; methodology, R.W. and K.T.; funding acquisition, K.T.; project administration, K.T.; supervision, K.T.; writing—original draft preparation, R.W.; writing—review and editing, R.W., A.M.R., Y.T., S.G., M.A., M.O., L.Y., T.I. and K.T. All authors have read and agreed to the published version of the manuscript.
Funding
This research was supported by National Institutes of Health, USA grant number R37CA248018, R01CA250412, R01CA251545, R01EB029596, as well as US Department of Defense BCRP, grant number W81XWH-19-1-0674 and W81XWH-19-1-0111, and National Institute of Health TO Roswell Park grant number P30CA016056 to K.T.
Institutional Review Board Statement
Not applicable.
Informed Consent Statement
Not applicable.
Data Availability Statement
Publicly available datasets were analyzed in this study. TCGA data can be found here: (https://www.cbioportal.org, accessed on accessed on 21 October 2021. /Breast Invasive Carcinoma (TCGA, PanCancer Atlas)). METABRIC data can be found here: (https://www.cbioportal.org, accessed on 21 October 2021. /Breast Cancer (METABRIC, Curtis et al. [27]). GEO96058, GSE12276, GSE124647, GSE159956, GSE110590, GSE180280, GSE87455, GSE28844, GSE21974, and GSE172882 data can be downloaded from the Gene Expression Omnibus website with access number: (https://www.ncbi.nlm.nih.gov/geo, accessed on 2 November 2021). Two cohorts of single-cell seq data were downloaded from the Single-cell Portal (https://singlecell.broadinstitute.org/single_cell, accessed on 29 November 2021. (Wu et al. [46] and Wu et al. [47]).
Conflicts of Interest
The authors declare no conflict of interest.
References
- Takeshita, T.; Yan, L.; Asaoka, M.; Rashid, O.; Takabe, K. Late recurrence of breast cancer is associated with pro-cancerous immune microenvironment in the primary tumor. Sci. Rep. 2019, 9, 16942. [Google Scholar] [CrossRef] [PubMed] [Green Version]
- Zhang, X.H.; Giuliano, M.; Trivedi, M.V.; Schiff, R.; Osborne, C.K. Metastasis dormancy in estrogen receptor-positive breast cancer. Clin. Cancer Res. 2013, 19, 6389–6397. [Google Scholar] [CrossRef] [PubMed] [Green Version]
- Foldi, J.; O’Meara, T.; Marczyk, M.; Sanft, T.; Silber, A.; Pusztai, L. Defining Risk of Late Recurrence in Early-Stage Estrogen Receptor-Positive Breast Cancer: Clinical Versus Molecular Tools. J. Clin. Oncol. 2019, 37, 1365–1369. [Google Scholar] [CrossRef]
- Brewster, A.M.; Hortobagyi, G.N.; Broglio, K.R.; Kau, S.W.; Santa-Maria, C.A.; Arun, B.; Buzdar, A.U.; Booser, D.J.; Valero, V.; Bondy, M.; et al. Residual risk of breast cancer recurrence 5 years after adjuvant therapy. J. Natl. Cancer Inst. 2008, 100, 1179–1183. [Google Scholar] [CrossRef] [Green Version]
- Hess, K.R.; Pusztai, L.; Buzdar, A.U.; Hortobagyi, G.N. Estrogen receptors and distinct patterns of breast cancer relapse. Breast Cancer Res. Treat. 2003, 78, 105–118. [Google Scholar] [CrossRef]
- Ogba, N.; Manning, N.G.; Bliesner, B.S.; Ambler, S.K.; Haughian, J.M.; Pinto, M.P.; Jedlicka, P.; Joensuu, K.; Heikkila, P.; Horwitz, K.B. Luminal breast cancer metastases and tumor arousal from dormancy are promoted by direct actions of estradiol and progesterone on the malignant cells. Breast Cancer Res. 2014, 16, 489. [Google Scholar] [CrossRef] [Green Version]
- Kurppa, K.J.; Liu, Y.; To, C.; Zhang, T.; Fan, M.; Vajdi, A.; Knelson, E.H.; Xie, Y.; Lim, K.; Cejas, P.; et al. Treatment-Induced Tumor Dormancy through YAP-Mediated Transcriptional Reprogramming of the Apoptotic Pathway. Cancer Cell 2020, 37, 104–122.e12. [Google Scholar] [CrossRef]
- Dey-Guha, I.; Wolfer, A.; Yeh, A.C.; Albeck, J.G.; Darp, R.; Leon, E.; Wulfkuhle, J.; Petricoin, E.F., 3rd; Wittner, B.S.; Ramaswamy, S. Asymmetric cancer cell division regulated by AKT. Proc. Natl. Acad. Sci. USA 2011, 108, 12845–12850. [Google Scholar] [CrossRef] [Green Version]
- Naumov, G.N.; Townson, J.L.; MacDonald, I.C.; Wilson, S.M.; Bramwell, V.H.; Groom, A.C.; Chambers, A.F. Ineffectiveness of doxorubicin treatment on solitary dormant mammary carcinoma cells or late-developing metastases. Breast Cancer Res. Treat. 2003, 82, 199–206. [Google Scholar] [CrossRef]
- Triana-Martinez, F.; Loza, M.I.; Dominguez, E. Beyond Tumor Suppression: Senescence in Cancer Stemness and Tumor Dormancy. Cells 2020, 9, 346. [Google Scholar] [CrossRef] [Green Version]
- Manjili, M.H. Tumor Dormancy and Relapse: From a Natural Byproduct of Evolution to a Disease State. Cancer Res. 2017, 77, 2564–2569. [Google Scholar] [CrossRef] [PubMed] [Green Version]
- Husemann, Y.; Geigl, J.B.; Schubert, F.; Musiani, P.; Meyer, M.; Burghart, E.; Forni, G.; Eils, R.; Fehm, T.; Riethmuller, G.; et al. Systemic spread is an early step in breast cancer. Cancer Cell 2008, 13, 58–68. [Google Scholar] [CrossRef] [PubMed] [Green Version]
- Bragado, P.; Estrada, Y.; Parikh, F.; Krause, S.; Capobianco, C.; Farina, H.G.; Schewe, D.M.; Aguirre-Ghiso, J.A. TGF-beta2 dictates disseminated tumour cell fate in target organs through TGF-beta-RIII and p38alpha/beta signalling. Nat. Cell Biol. 2013, 15, 1351–1361. [Google Scholar] [CrossRef] [PubMed] [Green Version]
- Gao, H.; Chakraborty, G.; Lee-Lim, A.P.; Mo, Q.; Decker, M.; Vonica, A.; Shen, R.; Brogi, E.; Brivanlou, A.H.; Giancotti, F.G. The BMP inhibitor Coco reactivates breast cancer cells at lung metastatic sites. Cell 2012, 150, 764–779. [Google Scholar] [CrossRef] [PubMed] [Green Version]
- Prunier, C.; Baker, D.; Ten Dijke, P.; Ritsma, L. TGF-beta Family Signaling Pathways in Cellular Dormancy. Trends Cancer 2019, 5, 66–78. [Google Scholar] [CrossRef]
- Hosseini, H.; Obradovic, M.M.S.; Hoffmann, M.; Harper, K.L.; Sosa, M.S.; Werner-Klein, M.; Nanduri, L.K.; Werno, C.; Ehrl, C.; Maneck, M.; et al. Early dissemination seeds metastasis in breast cancer. Nature 2016, 540, 552–558. [Google Scholar] [CrossRef] [Green Version]
- Sosa, M.S.; Bragado, P.; Aguirre-Ghiso, J.A. Mechanisms of disseminated cancer cell dormancy: An awakening field. Nat. Rev. Cancer 2014, 14, 611–622. [Google Scholar] [CrossRef]
- Sosa, M.S.; Parikh, F.; Maia, A.G.; Estrada, Y.; Bosch, A.; Bragado, P.; Ekpin, E.; George, A.; Zheng, Y.; Lam, H.M.; et al. NR2F1 controls tumour cell dormancy via SOX9- and RARbeta-driven quiescence programmes. Nat. Commun. 2015, 6, 6170. [Google Scholar] [CrossRef] [Green Version]
- Kim, R.S.; Avivar-Valderas, A.; Estrada, Y.; Bragado, P.; Sosa, M.S.; Aguirre-Ghiso, J.A.; Segall, J.E. Dormancy signatures and metastasis in estrogen receptor positive and negative breast cancer. PLoS ONE 2012, 7, e35569. [Google Scholar] [CrossRef]
- Borgen, E.; Rypdal, M.C.; Sosa, M.S.; Renolen, A.; Schlichting, E.; Lonning, P.E.; Synnestvedt, M.; Aguirre-Ghiso, J.A.; Naume, B. NR2F1 stratifies dormant disseminated tumor cells in breast cancer patients. Breast Cancer Res. 2018, 20, 120. [Google Scholar] [CrossRef]
- Khalil, B.D.; Sanchez, R.; Rahman, T.; Rodriguez-Tirado, C.; Moritsch, S.; Martinez, A.R.; Miles, B.; Farias, E.; Mezei, M.; Nobre, A.R.; et al. An NR2F1-specific agonist suppresses metastasis by inducing cancer cell dormancy. J. Exp. Med. 2022, 219, e20210836. [Google Scholar] [CrossRef] [PubMed]
- Oshi, M.; Sarkar, J.; Wu, R.; Tokumaru, Y.; Yan, L.; Nakagawa, K.; Ishibe, A.; Matsuyama, R.; Endo, I.; Takabe, K. Intratumoral density of regulatory T cells is a predictor of host immune response and chemotherapy response in colorectal cancer. Am. J. Cancer Res. 2022, 12, 490–503. [Google Scholar] [PubMed]
- Tokumaru, Y.; Oshi, M.; Murthy, V.; Tian, W.; Yan, L.; Angarita, F.A.; Nagahashi, M.; Matsuhashi, N.; Futamura, M.; Yoshida, K.; et al. Low intratumoral genetic neutrophil-to-lymphocyte ratio (NLR) is associated with favorable tumor immune microenvironment and with survival in triple negative breast cancer (TNBC). Am. J. Cancer Res. 2021, 11, 5743–5755. [Google Scholar] [PubMed]
- Satyananda, V.; Oshi, M.; Endo, I.; Takabe, K. High BRCA2 Gene Expression is Associated with Aggressive and Highly Proliferative Breast Cancer. Ann. Surg. Oncol. 2021, 28, 7356–7365. [Google Scholar] [CrossRef]
- Oshi, M.; Kawaguchi, T.; Yan, L.; Peng, X.; Qi, Q.; Tian, W.; Schulze, A.; McDonald, K.A.; Narayanan, S.; Young, J.; et al. Immune cytolytic activity is associated with reduced intra-tumoral genetic heterogeneity and with better clinical outcomes in triple negative breast cancer. Am. J. Cancer Res. 2021, 11, 3628–3644. [Google Scholar]
- The Cancer Genome Atlas Network. Comprehensive molecular portraits of human breast tumours. Nature 2012, 490, 61–70. [Google Scholar] [CrossRef] [Green Version]
- Curtis, C.; Shah, S.P.; Chin, S.F.; Turashvili, G.; Rueda, O.M.; Dunning, M.J.; Speed, D.; Lynch, A.G.; Samarajiwa, S.; Yuan, Y.; et al. The genomic and transcriptomic architecture of 2000 breast tumours reveals novel subgroups. Nature 2012, 486, 346–352. [Google Scholar] [CrossRef]
- Cerami, E.; Gao, J.; Dogrusoz, U.; Gross, B.E.; Sumer, S.O.; Aksoy, B.A.; Jacobsen, A.; Byrne, C.J.; Heuer, M.L.; Larsson, E.; et al. The cBio cancer genomics portal: An open platform for exploring multidimensional cancer genomics data. Cancer Discov. 2012, 2, 401–404. [Google Scholar] [CrossRef] [Green Version]
- Brueffer, C.; Gladchuk, S.; Winter, C.; Vallon-Christersson, J.; Hegardt, C.; Hakkinen, J.; George, A.M.; Chen, Y.; Ehinger, A.; Larsson, C.; et al. The mutational landscape of the SCAN-B real-world primary breast cancer transcriptome. EMBO Mol. Med. 2020, 12, e12118. [Google Scholar] [CrossRef]
- Brueffer, C.; Vallon-Christersson, J.; Grabau, D.; Ehinger, A.; Hakkinen, J.; Hegardt, C.; Malina, J.; Chen, Y.; Bendahl, P.O.; Manjer, J.; et al. Clinical Value of RNA Sequencing-Based Classifiers for Prediction of the Five Conventional Breast Cancer Biomarkers: A Report from the Population-Based Multicenter Sweden Cancerome Analysis Network-Breast Initiative. JCO Precis. Oncol. 2018, 2, 1–18. [Google Scholar] [CrossRef]
- Wu, R.; Sarkar, J.; Tokumaru, Y.; Takabe, Y.; Oshi, M.; Asaoka, M.; Yan, L.; Ishikawa, T.; Takabe, K. Intratumoral lymphatic endothelial cell infiltration reflecting lymphangiogenesis is counterbalanced by immune responses and better cancer biology in the breast cancer tumor microenvironment. Am. J. Cancer Res. 2022, 12, 504–520. [Google Scholar] [PubMed]
- Wu, R.; Patel, A.; Tokumaru, Y.; Asaoka, M.; Oshi, M.; Yan, L.; Ishikawa, T.; Takabe, K. High RAD51 gene expression is associated with aggressive biology and with poor survival in breast cancer. Breast Cancer Res. Treat. 2022, 193, 49–63. [Google Scholar] [CrossRef] [PubMed]
- Asaoka, M.; Patnaik, S.K.; Zhang, F.; Ishikawa, T.; Takabe, K. Lymphovascular invasion in breast cancer is associated with gene expression signatures of cell proliferation but not lymphangiogenesis or immune response. Breast Cancer Res. Treat. 2020, 181, 309–322. [Google Scholar] [CrossRef] [PubMed]
- Bos, P.D.; Zhang, X.H.; Nadal, C.; Shu, W.; Gomis, R.R.; Nguyen, D.X.; Minn, A.J.; van de Vijver, M.J.; Gerald, W.L.; Foekens, J.A.; et al. Genes that mediate breast cancer metastasis to the brain. Nature 2009, 459, 1005–1009. [Google Scholar] [CrossRef] [PubMed]
- Sinn, B.V.; Fu, C.; Lau, R.; Litton, J.; Tsai, T.H.; Murthy, R.; Tam, A.; Andreopoulou, E.; Gong, Y.; Murthy, R.; et al. SETER/PR: A robust 18-gene predictor for sensitivity to endocrine therapy for metastatic breast cancer. NPJ Breast Cancer 2019, 5, 16. [Google Scholar] [CrossRef] [Green Version]
- Regua, A.; Papp, C.; Grageda, A.; Porter, B.A.; Caza, T.; Bichindaritz, I.; Krendel, M.; Sivapiragasam, A.; Bratslavsky, G.; Kuznetsov, V.A.; et al. ABI1-based expression signature predicts breast cancer metastasis and survival. Mol. Oncol. 2021. [Google Scholar] [CrossRef] [PubMed]
- Siegel, M.B.; He, X.; Hoadley, K.A.; Hoyle, A.; Pearce, J.B.; Garrett, A.L.; Kumar, S.; Moylan, V.J.; Brady, C.M.; Van Swearingen, A.E.; et al. Integrated RNA and DNA sequencing reveals early drivers of metastatic breast cancer. J. Clin. Investig. 2018, 128, 1371–1383. [Google Scholar] [CrossRef] [PubMed]
- Parkes, E.E.; Savage, K.I.; Lioe, T.; Boyd, C.; Halliday, S.; Walker, S.M.; Lowry, K.; Knight, L.; Buckley, N.E.; Grogan, A.; et al. Activation of a cGAS-STING-mediated immune response predicts response to neoadjuvant chemotherapy in early breast cancer. Br. J. Cancer 2022, 126, 247–258. [Google Scholar] [CrossRef]
- Matikas, A.; Lovrot, J.; Ramberg, A.; Eriksson, M.; Lindsten, T.; Lekberg, T.; Hedenfalk, I.; Loman, N.; Bergh, J.; Hatschek, T.; et al. Dynamic evaluation of the immune infiltrate and immune function genes as predictive markers for neoadjuvant chemotherapy in hormone receptor positive, HER2 negative breast cancer. Oncoimmunology 2018, 7, e1466017. [Google Scholar] [CrossRef] [Green Version]
- Kimbung, S.; Markholm, I.; Bjohle, J.; Lekberg, T.; von Wachenfeldt, A.; Azavedo, E.; Saracco, A.; Hellstrom, M.; Veerla, S.; Paquet, E.; et al. Assessment of early response biomarkers in relation to long-term survival in patients with HER2-negative breast cancer receiving neoadjuvant chemotherapy plus bevacizumab: Results from the Phase II PROMIX trial. Int. J. Cancer 2018, 142, 618–628. [Google Scholar] [CrossRef] [Green Version]
- Palazon, A.; Tyrakis, P.A.; Macias, D.; Velica, P.; Rundqvist, H.; Fitzpatrick, S.; Vojnovic, N.; Phan, A.T.; Loman, N.; Hedenfalk, I.; et al. An HIF-1alpha/VEGF-A Axis in Cytotoxic T Cells Regulates Tumor Progression. Cancer Cell 2017, 32, 669–683 e665. [Google Scholar] [CrossRef] [Green Version]
- Vera-Ramirez, L.; Sanchez-Rovira, P.; Ramirez-Tortosa, C.L.; Quiles, J.L.; Ramirez-Tortosa, M.; Lorente, J.A. Transcriptional shift identifies a set of genes driving breast cancer chemoresistance. PLoS ONE 2013, 8, e53983. [Google Scholar] [CrossRef]
- Stickeler, E.; Pils, D.; Klar, M.; Orlowsk-Volk, M.; Zur Hausen, A.; Jager, M.; Watermann, D.; Gitsch, G.; Zeillinger, R.; Tempfer, C.B. Basal-like molecular subtype and HER4 up-regulation and response to neoadjuvant chemotherapy in breast cancer. Oncol. Rep. 2011, 26, 1037–1045. [Google Scholar] [CrossRef]
- Prunier, C.; Alay, A.; van Dijk, M.; Ammerlaan, K.L.; van Gelderen, S.; Marvin, D.L.; Teunisse, A.; Slieker, R.C.; Szuhai, K.; Jochemsen, A.G.; et al. Breast cancer dormancy is associated with a 4NG1 state and not senescence. NPJ Breast Cancer 2021, 7, 140. [Google Scholar] [CrossRef] [PubMed]
- Maiti, A.; Okano, I.; Oshi, M.; Okano, M.; Tian, W.; Kawaguchi, T.; Katsuta, E.; Takabe, K.; Yan, L.; Patnaik, S.; et al. Altered Expression of Secreted Mediator Genes That Mediate Aggressive Breast Cancer Metastasis to Distant Organs. Cancers 2021, 13, 2641. [Google Scholar] [CrossRef] [PubMed]
- Wu, S.Z.; Roden, D.L.; Wang, C.; Holliday, H.; Harvey, K.; Cazet, A.S.; Murphy, K.J.; Pereira, B.; Al-Eryani, G.; Bartonicek, N.; et al. Stromal cell diversity associated with immune evasion in human triple-negative breast cancer. EMBO J. 2020, 39, e104063. [Google Scholar] [CrossRef] [PubMed]
- Wu, S.Z.; Al-Eryani, G.; Roden, D.L.; Junankar, S.; Harvey, K.; Andersson, A.; Thennavan, A.; Wang, C.; Torpy, J.R.; Bartonicek, N.; et al. A single-cell and spatially resolved atlas of human breast cancers. Nat. Genet. 2021, 53, 1334–1347. [Google Scholar] [CrossRef]
- Subramanian, A.; Tamayo, P.; Mootha, V.K.; Mukherjee, S.; Ebert, B.L.; Gillette, M.A.; Paulovich, A.; Pomeroy, S.L.; Golub, T.R.; Lander, E.S.; et al. Gene set enrichment analysis: A knowledge-based approach for interpreting genome-wide expression profiles. Proc. Natl. Acad. Sci. USA 2005, 102, 15545–15550. [Google Scholar] [CrossRef] [Green Version]
- Mootha, V.K.; Lindgren, C.M.; Eriksson, K.F.; Subramanian, A.; Sihag, S.; Lehar, J.; Puigserver, P.; Carlsson, E.; Ridderstrale, M.; Laurila, E.; et al. PGC-1alpha-responsive genes involved in oxidative phosphorylation are coordinately downregulated in human diabetes. Nat. Genet. 2003, 34, 267–273. [Google Scholar] [CrossRef]
- Liberzon, A.; Birger, C.; Thorvaldsdottir, H.; Ghandi, M.; Mesirov, J.P.; Tamayo, P. The Molecular Signatures Database (MSigDB) hallmark gene set collection. Cell Syst. 2015, 1, 417–425. [Google Scholar] [CrossRef] [Green Version]
- Oshi, M.; Huyser, M.R.; Le, L.; Tokumaru, Y.; Yan, L.; Matsuyama, R.; Endo, I.; Takabe, K. Abundance of Microvascular Endothelial Cells Is Associated with Response to Chemotherapy and Prognosis in Colorectal Cancer. Cancers 2021, 13, 1477. [Google Scholar] [CrossRef] [PubMed]
- Oshi, M.; Tokumaru, Y.; Asaoka, M.; Yan, L.; Satyananda, V.; Matsuyama, R.; Matsuhashi, N.; Futamura, M.; Ishikawa, T.; Yoshida, K.; et al. M1 Macrophage and M1/M2 ratio defined by transcriptomic signatures resemble only part of their conventional clinical characteristics in breast cancer. Sci. Rep. 2020, 10, 16554. [Google Scholar] [CrossRef] [PubMed]
- Aran, D.; Hu, Z.; Butte, A.J. xCell: Digitally portraying the tissue cellular heterogeneity landscape. Genome Biol. 2017, 18, 220. [Google Scholar] [CrossRef] [Green Version]
- Wu, R.; Oshi, M.; Asaoka, M.; Huyser, M.R.; Tokumaru, Y.; Yamada, A.; Yan, L.; Endo, I.; Ishikawa, T.; Takabe, K. APOBEC3F expression in triple-negative breast cancer is associated with tumor microenvironment infiltration and activation of cancer immunity and improved survival. Am. J. Cancer Res. 2022, 12, 744–762. [Google Scholar]
- Narayanan, S.; Kawaguchi, T.; Yan, L.; Peng, X.; Qi, Q.; Takabe, K. Cytolytic Activity Score to Assess Anticancer Immunity in Colorectal Cancer. Ann. Surg. Oncol. 2018, 25, 2323–2331. [Google Scholar] [CrossRef]
- Takahashi, H.; Kawaguchi, T.; Yan, L.; Peng, X.; Qi, Q.; Morris, L.G.T.; Chan, T.A.; Tsung, A.; Otsuji, E.; Takabe, K. Immune Cytolytic Activity for Comprehensive Understanding of Immune Landscape in Hepatocellular Carcinoma. Cancers 2020, 12, 1221. [Google Scholar] [CrossRef]
- Thorsson, V.; Gibbs, D.L.; Brown, S.D.; Wolf, D.; Bortone, D.S.; Ou Yang, T.H.; Porta-Pardo, E.; Gao, G.F.; Plaisier, C.L.; Eddy, J.A.; et al. The Immune Landscape of Cancer. Immunity 2019, 51, 411–412. [Google Scholar] [CrossRef] [Green Version]
- Qiu, Y.; Cooney, A.J.; Kuratani, S.; DeMayo, F.J.; Tsai, S.Y.; Tsai, M.J. Spatiotemporal expression patterns of chicken ovalbumin upstream promoter-transcription factors in the developing mouse central nervous system: Evidence for a role in segmental patterning of the diencephalon. Proc. Natl. Acad. Sci. USA 1994, 91, 4451–4455. [Google Scholar] [CrossRef] [Green Version]
- Rada-Iglesias, A.; Bajpai, R.; Prescott, S.; Brugmann, S.A.; Swigut, T.; Wysocka, J. Epigenomic annotation of enhancers predicts transcriptional regulators of human neural crest. Cell Stem. Cell 2012, 11, 633–648. [Google Scholar] [CrossRef] [Green Version]
- Bertacchi, M.; Parisot, J.; Studer, M. The pleiotropic transcriptional regulator COUP-TFI plays multiple roles in neural development and disease. Brain Res. 2019, 1705, 75–94. [Google Scholar] [CrossRef]
- Harper, K.L.; Sosa, M.S.; Entenberg, D.; Hosseini, H.; Cheung, J.F.; Nobre, R.; Avivar-Valderas, A.; Nagi, C.; Girnius, N.; Davis, R.J.; et al. Mechanism of early dissemination and metastasis in Her2+ mammary cancer. Nature 2016, 540, 588–592. [Google Scholar] [CrossRef] [PubMed]
- van ‘t Veer, L.J.; Dai, H.; van de Vijver, M.J.; He, Y.D.; Hart, A.A.; Mao, M.; Peterse, H.L.; van der Kooy, K.; Marton, M.J.; Witteveen, A.T.; et al. Gene expression profiling predicts clinical outcome of breast cancer. Nature 2002, 415, 530–536. [Google Scholar] [CrossRef] [Green Version]
- Mirzayans, R.; Murray, D. Intratumor Heterogeneity and Therapy Resistance: Contributions of Dormancy, Apoptosis Reversal (Anastasis) and Cell Fusion to Disease Recurrence. Int. J. Mol. Sci. 2020, 21, 1308. [Google Scholar] [CrossRef] [Green Version]
- Chen, Y.; McAndrews, K.M.; Kalluri, R. Clinical and therapeutic relevance of cancer-associated fibroblasts. Nat. Rev. Clin. Oncol. 2021, 18, 792–804. [Google Scholar] [CrossRef]
- McAndrews, K.M.; Kalluri, R. A map of human breast cancer: New players in stromal-immune crosstalk. EMBO J. 2020, 39, e106368. [Google Scholar] [CrossRef]
- Kalluri, R. The biology and function of fibroblasts in cancer. Nat. Rev. Cancer 2016, 16, 582–598. [Google Scholar] [CrossRef]
- Fluegen, G.; Avivar-Valderas, A.; Wang, Y.; Padgen, M.R.; Williams, J.K.; Nobre, A.R.; Calvo, V.; Cheung, J.; Bravo-Cordero, J.J.; Entenberg, D.; et al. Phenotypic heterogeneity of disseminated tumour cells is preset by primary tumour hypoxic microenvironments. Nat. Cell Biol. 2017, 19, 120–132. [Google Scholar] [CrossRef] [Green Version]
Publisher’s Note: MDPI stays neutral with regard to jurisdictional claims in published maps and institutional affiliations. |
© 2022 by the authors. Licensee MDPI, Basel, Switzerland. This article is an open access article distributed under the terms and conditions of the Creative Commons Attribution (CC BY) license (https://creativecommons.org/licenses/by/4.0/).