
Prognostic Significance of Pseudotime from Texture Parameters of FDG PET/CT in Locally Advanced Non-Small-Cell Lung Cancer with Tri-Modality Therapy

Abstract
:Simple Summary
Abstract
1. Introduction
2. Methods
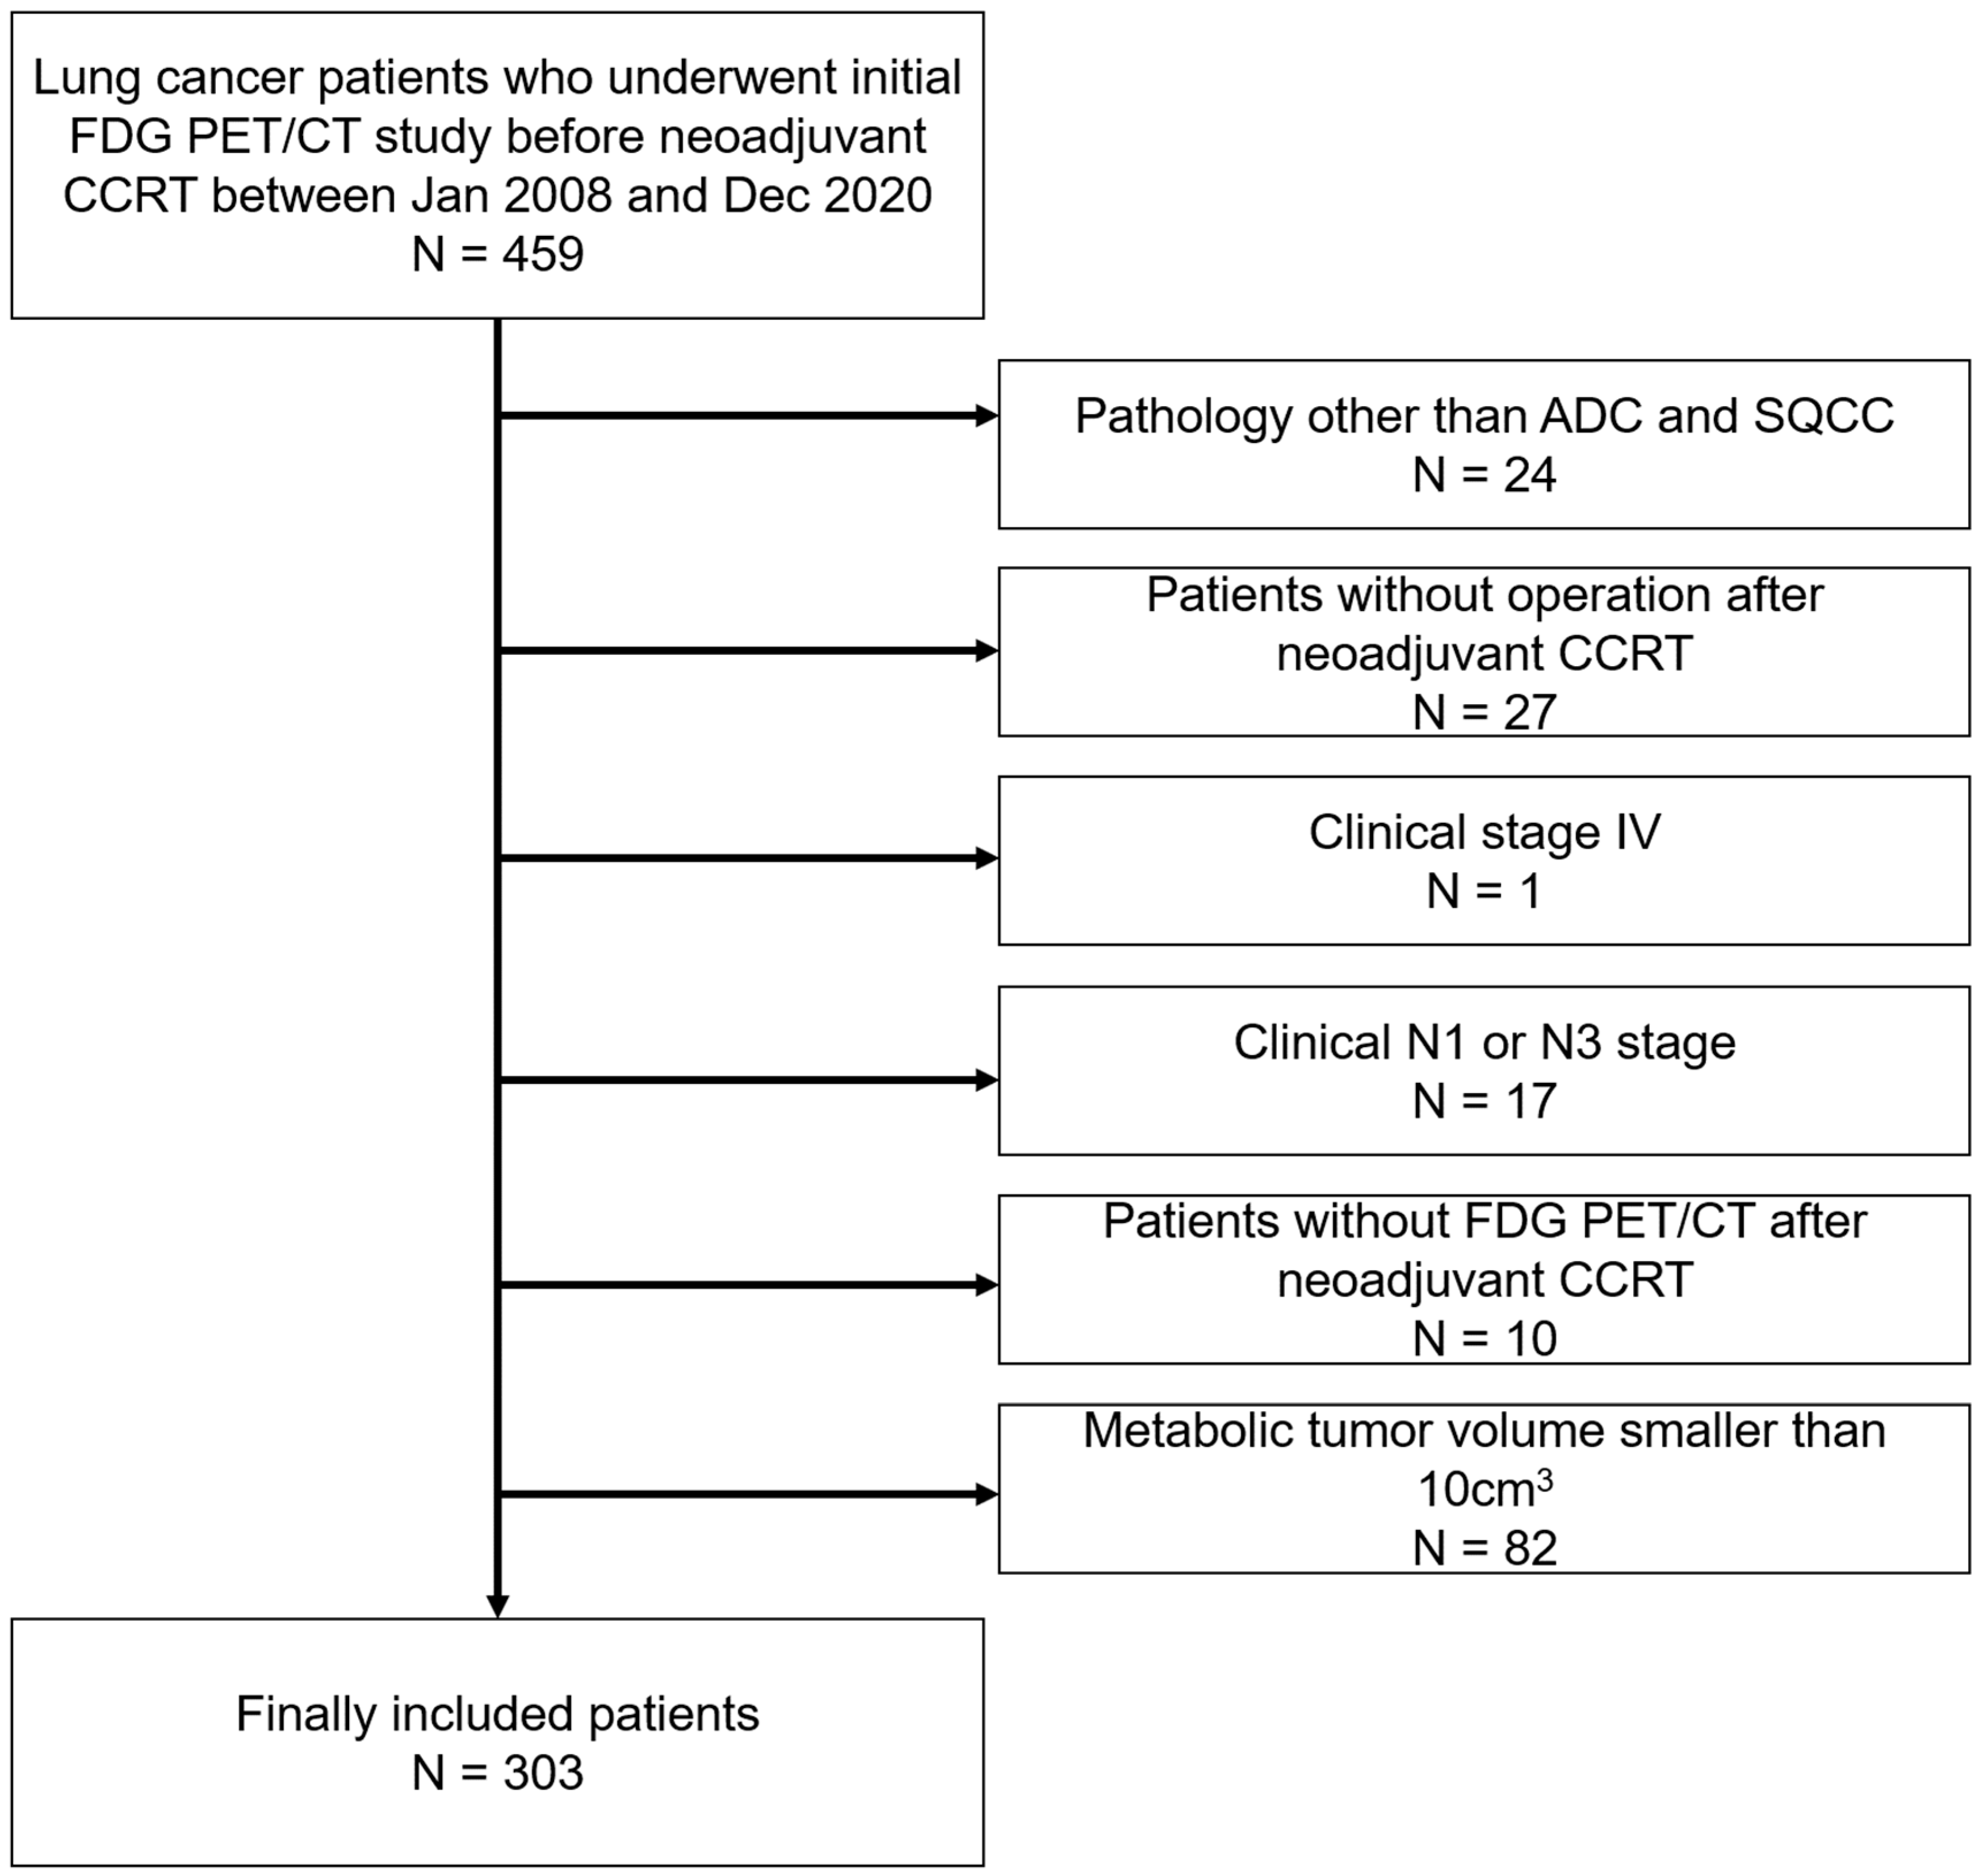
2.1. Subjects
2.2. FDG PET/CT Acquisition
2.3. FDG PET/CT Image Analysis
2.4. Pseudotime Estimation
2.5. Clinical Variables and Follow-Up
2.6. Statistical Analysis
3. Results
3.1. Demographic Data
3.2. Pseudotime Estimation
3.3. Survival Analysis
4. Discussion
Supplementary Materials
Author Contributions
Funding
Institutional Review Board Statement
Informed Consent Statement
Data Availability Statement
Conflicts of Interest
References
- Subedi, N.; Scarsbrook, A.; Darby, M.; Korde, K.; Mc Shane, P.; Muers, M. The clinical impact of integrated FDG PET–CT on management decisions in patients with lung cancer. Lung Cancer 2009, 64, 301–307. [Google Scholar] [CrossRef] [PubMed]
- Bryant, A.S.; Cerfolio, R.J. The maximum standardized uptake values on integrated FDG-PET/CT is useful in differentiating benign from malignant pulmonary nodules. Ann. Thorac. Surg. 2006, 82, 1016–1020. [Google Scholar] [CrossRef] [PubMed]
- Borst, G.R.; Belderbos, J.S.; Boellaard, R.; Comans, E.F.; De Jaeger, K.; Lammertsma, A.A.; Lebesque, J.V. Standardised FDG uptake: A prognostic factor for inoperable non-small cell lung cancer. Eur. J. Cancer 2005, 41, 1533–1541. [Google Scholar] [CrossRef] [PubMed]
- Hyun, S.H.; Ahn, H.K.; Kim, H.; Ahn, M.J.; Park, K.; Ahn, Y.C.; Kim, J.; Shim, Y.M.; Choi, J.Y. Volume-based assessment by 18F-FDG PET/CT predicts survival in patients with stage III non-small-cell lung cancer. Eur. J. Nucl. Med. Mol. Imaging 2014, 41, 50–58. [Google Scholar] [CrossRef] [PubMed]
- Hyun, S.H.; Ahn, H.K.; Kim, H.; Ahn, M.J.; Park, K.; Ahn, Y.C.; Kim, J.; Shim, Y.M.; Choi, J.Y. Volume-based parameters of 18F-fluorodeoxyglucose positron emission tomography/computed tomography improve outcome prediction in early-stage non–small cell lung cancer after surgical resection. Ann. Surg. 2013, 257, 364–370. [Google Scholar] [CrossRef]
- Ha, S.; Choi, H.; Paeng, J.C.; Cheon, G.J. Radiomics in oncological PET/CT: A methodological overview. Nucl. Med. Mol. Imaging 2019, 53, 14–29. [Google Scholar] [CrossRef]
- Park, S.; Ha, S.; Lee, S.-H.; Paeng, J.C.; Keam, B.; Kim, T.M.; Kim, D.-W.; Heo, D.S. Intratumoral heterogeneity characterized by pretreatment PET in non-small cell lung cancer patients predicts progression-free survival on EGFR tyrosine kinase inhibitor. PLoS ONE 2018, 13, e0189766. [Google Scholar] [CrossRef]
- Trapnell, C. Defining cell types and states with single-cell genomics. Genome Res. 2015, 25, 1491–1498. [Google Scholar] [CrossRef]
- Kim, N.; Kim, H.K.; Lee, K.; Hong, Y.; Cho, J.H.; Choi, J.W.; Lee, J.-I.; Suh, Y.-L.; Ku, B.M.; Eum, H.H. Single-cell RNA sequencing demonstrates the molecular and cellular reprogramming of metastatic lung adenocarcinoma. Nat. Commun. 2020, 11, 2285. [Google Scholar] [CrossRef]
- Lee, H.; Choi, H. Investigating the Clinico-Molecular and Immunological Evolution of Lung Adenocarcinoma Using Pseudotime Analysis. Front. Oncol. 2022, 12, 828505. [Google Scholar] [CrossRef]
- Moon, S.H.; Kim, J.; Joung, J.-G.; Cha, H.; Park, W.-Y.; Ahn, J.S.; Ahn, M.-J.; Park, K.; Choi, J.Y.; Lee, K.-H. Correlations between metabolic texture features, genetic heterogeneity, and mutation burden in patients with lung cancer. Eur. J. Nucl. Med. Mol. Imaging 2019, 46, 446–454. [Google Scholar] [CrossRef] [PubMed]
- Galavis, P.E.; Hollensen, C.; Jallow, N.; Paliwal, B.; Jeraj, R. Variability of textural features in FDG PET images due to different acquisition modes and reconstruction parameters. Acta Oncol. 2010, 49, 1012–1016. [Google Scholar] [CrossRef] [PubMed]
- Fang, Y.-H.D.; Lin, C.-Y.; Shih, M.-J.; Wang, H.-M.; Ho, T.-Y.; Liao, C.-T.; Yen, T.-C. Development and evaluation of an open-source software package “CGITA” for quantifying tumor heterogeneity with molecular images. BioMed Res. Int. 2014, 2014, 248505. [Google Scholar] [CrossRef] [PubMed]
- Campbell, K.R.; Yau, C. Uncovering pseudotemporal trajectories with covariates from single cell and bulk expression data. Nat. Commun. 2018, 9, 2442. [Google Scholar] [CrossRef] [PubMed]
- Blei, D.M.; Kucukelbir, A.; McAuliffe, J.D. Variational inference: A review for statisticians. J. Am. Stat. Assoc. 2017, 112, 859–877. [Google Scholar] [CrossRef]
- Lovinfosse, P.; Janvary, Z.L.; Coucke, P.; Jodogne, S.; Bernard, C.; Hatt, M.; Visvikis, D.; Jansen, N.; Duysinx, B.; Hustinx, R. FDG PET/CT texture analysis for predicting the outcome of lung cancer treated by stereotactic body radiation therapy. Eur. J. Nucl. Med. Mol. Imaging 2016, 43, 1453–1460. [Google Scholar] [CrossRef]
- Cannoodt, R.; Saelens, W.; Saeys, Y. Computational methods for trajectory inference from single-cell transcriptomics. Eur. J. Immunol. 2016, 46, 2496–2506. [Google Scholar] [CrossRef]
- Pang, B.; Xu, J.; Hu, J.; Guo, F.; Wan, L.; Cheng, M.; Pang, L. Single-cell RNA-seq reveals the invasive trajectory and molecular cascades underlying glioblastoma progression. Mol. Oncol. 2019, 13, 2588–2603. [Google Scholar] [CrossRef]
- Saelens, W.; Cannoodt, R.; Todorov, H.; Saeys, Y. A comparison of single-cell trajectory inference methods. Nat. Biotechnol. 2019, 37, 547–554. [Google Scholar] [CrossRef]
- Cook, G.J.; Yip, C.; Siddique, M.; Goh, V.; Chicklore, S.; Roy, A.; Marsden, P.; Ahmad, S.; Landau, D. Are pretreatment 18F-FDG PET tumor textural features in non–small cell lung cancer associated with response and survival after chemoradiotherapy? J. Nucl. Med. 2013, 54, 19–26. [Google Scholar] [CrossRef]
- Dong, X.; Sun, X.; Sun, L.; Maxim, P.G.; Xing, L.; Huang, Y.; Li, W.; Wan, H.; Zhao, X.; Xing, L. Early change in metabolic tumor heterogeneity during chemoradiotherapy and its prognostic value for patients with locally advanced non-small cell lung cancer. PLoS ONE 2016, 11, e0157836. [Google Scholar] [CrossRef] [PubMed]
- Bianconi, F.; Palumbo, I.; Fravolini, M.L.; Chiari, R.; Minestrini, M.; Brunese, L.; Palumbo, B. Texture analysis on [18F] FDG PET/CT in non-small-cell lung cancer: Correlations between PET features, CT features, and histological types. Mol. Imaging Biol. 2019, 21, 1200–1209. [Google Scholar] [CrossRef] [PubMed]
- Lyng, H.; Haraldseth, O.; Rofstad, E.K. Measurement of cell density and necrotic fraction in human melanoma xenografts by diffusion weighted magnetic resonance imaging. Magn. Reson. Med. 2000, 43, 828–836. [Google Scholar] [CrossRef]
- Yu, Y.Y.; Zhang, R.; Dong, R.T.; Hu, Q.Y.; Yu, T.; Liu, F.; Luo, Y.H.; Dong, Y. Feasibility of an ADC-based radiomics model for predicting pelvic lymph node metastases in patients with stage IB–IIA cervical squamous cell carcinoma. Br. J. Radiol. 2019, 92, 20180986. [Google Scholar] [CrossRef]
- Ren, J.; Qi, M.; Yuan, Y.; Tao, X. Radiomics of apparent diffusion coefficient maps to predict histologic grade in squamous cell carcinoma of the oral tongue and floor of mouth: A preliminary study. Acta Radiol. 2021, 62, 453–461. [Google Scholar] [CrossRef]


| Characteristics | Patients, n (%) |
|---|---|
| Sex | |
| Female | 83 (27.4) |
| Male | 220 (72.6) |
| Age, median (range), years | 62.3 (31.8–79.0) |
| <59 | 105 (34.7) |
| 59~66 | 100 (33.0) |
| 66≤ | 98 (32.3) |
| Histological type | |
| Adenocarcinoma | 192 (63.4) |
| Squamous cell carcinoma | 111 (36.6) |
| Location | |
| Right lung | 200 (66.0) |
| Left lung | 103 (34.0) |
| Adjuvant therapy | |
| No | 200 (66.0) |
| Chemotherapy | 103 (34.0) |
| Clinical T stage | |
| T1 | 44 (14.5) |
| T2 | 148 (48.8) |
| T3 | 81 (26.7) |
| T4 | 30 (9.9) |
| Clinical stage | |
| IIIA | 191 (63.0) |
| IIIB | 112 (37.0) |
| Histological grade | |
| 1 | 83 (11.5) |
| 2 | 533 (73.9) |
| 3 | 105 (14.6) |
| Unknown | |
| Post-operative pathological T stage | |
| 0 | 34 (11.2) |
| T1 | 118 (38.9) |
| T2 | 103 (34.0) |
| T3 | 39 (12.9) |
| T4 | 9 (3.0) |
| Post-operative pathological N stage | |
| N0 | 120 (39.6) |
| N1 | 24 (7.9) |
| N2 | 158 (52.1) |
| N3 | 1 (0.3) |
| Post-operative pathological TNM stage | |
| 0 | 29 (9.6) |
| I | 64 (21.1) |
| II | 43 (14.2) |
| III | 165 (54.5) |
| IV | 2 (0.7) |
| SUVmax, median (range) | 13.2 (4.4–32.8) |
| <14.7 | 194 (64.0) |
| 14.7≤ | 109 (36.0) |
| SUVmean, median (range) | 4.9 (2.6–11.5) |
| <3.9 | 62 (20.5) |
| 3.9≤ | 241 (79.5) |
| MTV, median (range), cm3 | 40.5 (10.1–468.8) |
| <60.2 | 202 (66.7) |
| 60.2≤ | 101 (33.3) |
| TLG, median (range) | 192.7 (28.7–2554.4) |
| <272.4 | 189 (62.4) |
| 272.4≤ | 114 (37.6) |
| Pseudotime, median (range) | 0.38 (0–1) |
| <0.38 | 268 (88.4) |
| 0.38≤ | 35 (11.6) |
| Instrument | |
| Discovery LS | 67 (22.1) |
| Discovery STE | 216 (71.3) |
| Discovery MI DR | 20 (6.6) |
| Variable | Categories | Disease-Free Survival | Overall Survival | ||||||
|---|---|---|---|---|---|---|---|---|---|
| Hazard Ratio | 95% Confidence Interval | p | p of Log-Rank Test | Hazard Ratio | 95% Confidence Interval | p | p of Log-Rank Test | ||
| Sex | Male vs. female | 1.519 | 1.084–2.128 | 0.015 | 0.01 | 0.549 | 0.343–0.878 | 0.012 | 0.01 |
| Age | <59 | 0.01 | 0.001 | ||||||
| 59~66 | 0.667 | 0.458–0.972 | 0.035 | 0.987 | 0.613–1.675 | 0.960 | |||
| 66≤ | 0.556 | 0.366–0.843 | 0.006 | 2.023 | 1.284–3.186 | 0.002 | |||
| Age (1-yr increase) | 0.976 | 0.959–0.993 | 0.007 | 0.007 | 1.036 | 1.012–1.061 | 0.003 | 0.003 | |
| Location | Right | 0.7 | 0.9 | ||||||
| Left | 1.080 | 0.769–1.516 | 0.659 | 1.018 | 0.683–1.517 | 0.930 | |||
| Histological type | Adenocarcinoma | <0.001 | 0.8 | ||||||
| Squamous cell carcinoma | 0.379 | 0.254–0.567 | <0.001 | 1.044 | 0.702–1.551 | 0.833 | |||
| Clinical T stage | T1 | 0.07 | 0.4 | ||||||
| T2 | 0.817 | 0.517–1.290 | 0.386 | 0.874 | 0.495–1.545 | 0.644 | |||
| T3 | 1.053 | 0.642–1.728 | 0.839 | 1.203 | 0.659–2.194 | 0.548 | |||
| T4 | 0.408 | 0.184–0.905 | 0.027 | 1.400 | 0.672–2.918 | 0.369 | |||
| Clinical stage | IIIA | 1 | 0.07 | ||||||
| IIIB | 0.990 | 0.704–1.392 | 0.952 | 1.415 | 0.964–2.077 | 0.076 | |||
| Adjuvant therapy | No | 0.6 | 0.2 | ||||||
| Chemotherapy | 1.106 | 0.792–1.545 | 0.555 | 1.330 | 0.899–1.967 | 0.153 | |||
| Histological grade | Well differentiated | 0.8 | 0.8 | ||||||
| Moderately differentiated | 1.762 | 0.245–12.670 | 0.573 | 0.654 | 0.159–2.693 | 0.556 | |||
| Poorly differentiated | 1.786 | 0.247–12.910 | 0.565 | 0.673 | 0.162–2.801 | 0.586 | |||
| Post-operative pathological T stage | 0 | <0.001 | 0.005 | ||||||
| T1 | 3.470 | 1.591–7.567 | 0.002 | 1.653 | 0.739–3.698 | 0.221 | |||
| T2 | 2.616 | 1.185–5.777 | 0.017 | 1.629 | 0.725–3.663 | 0.238 | |||
| T3 | 2.576 | 1.059–6.264 | 0.037 | 2.347 | 0.980–5.623 | 0.056 | |||
| T4 | 7.714 | 2.702–22.022 | <0.001 | 5.696 | 1.993–16.282 | 0.001 | |||
| Post-operative pathological N stage | N0 | <0.001 | 0.7 | ||||||
| N1 | 1.500 | 0.785–2.865 | 0.219 | 1.151 | 0.587–2.257 | 0.682 | |||
| N2 | 2.200 | 1.512–3.200 | <0.001 | 1.138 | 0.754–1.715 | 0.538 | |||
| N3 | 2.293 | 0.315–16.715 | 0.413 | 2.957 | 0.405–21.618 | 0.285 | |||
| Post-operative pathological stage | 0 | <0.001 | 0.6 | ||||||
| I | 2.398 | 0.915–6.286 | 0.075 | 1.694 | 0.683–4.203 | 0.255 | |||
| II | 2.840 | 1.054–7.653 | 0.039 | 2.117 | 0.840–5.337 | 0.112 | |||
| III | 4.598 | 1.871–11.304 | 0.001 | 1.931 | 0.834–4.472 | 0.125 | |||
| IV | 2.168 | 0.253–18.563 | 0.480 | 2.400 | 0.288–20.015 | 0.418 | |||
| SUVmax | <14.7 | 0.4 | 0.2 | ||||||
| 14.7≤ | 0.858 | 0.607–1.213 | 0.386 | 1.260 | 0.855–1.856 | 0.243 | |||
| SUVmax (continuous) | 0.959 | 0.924–0.994 | 0.024 | 0.02 | 1.013 | 0.973–1.055 | 0.535 | 0.5 | |
| SUVmean | <3.9 | 0.03 | |||||||
| 3.9≤ | 0.662 | 0.454–0.965 | 0.032 | 0.678 | 0.440–1.044 | 0.077 | 0.08 | ||
| SUVmean (continuous) | 0.854 | 0.748–0.976 | 0.020 | 0.02 | 0.986 | 0.850–1.144 | 0.855 | 0.9 | |
| MTV | <60.2 | 0.9 | |||||||
| 60.2≤ | 0.985 | 0.693–1.400 | 0.931 | 1.663 | 1.133–2.439 | 0.009 | 0.009 | ||
| MTV (continuous) | 0.997 | 0.994–1.000 | 0.093 | 0.09 | 1.004 | 1.001–1.007 | 0.004 | 0.003 | |
| TLG | <272.4 | 0.8 | |||||||
| 272.4 ≤ | 0.953 | 0.676–1.342 | 0.782 | 1.619 | 1.107–2.368 | 0.013 | 0.01 | ||
| TLG (continuous) | 1.000 | 0.999–1.000 | 0.094 | 0.09 | 1.001 | 1.000–1.001 | 0.016 | 0.01 | |
| Pseudotime | <0.59 | 0.4 | 0.003 | ||||||
| 0.59≤ | 1.196 | 0.787–1.816 | 0.402 | 1.894 | 1.236–2.901 | 0.003 | |||
| Pseudotime (continuous) | 0.694 | 0.277–1.739 | 0.436 | 0.4 | 3.085 | 1.108–8.588 | 0.031 | 0.03 | |
| MTV | TLG | Pseudotime | ||||||||
|---|---|---|---|---|---|---|---|---|---|---|
| Variable | Categories | Hazard Ratio | 95% Confidence Interval | p | Hazard Ratio | 95% Confidence Interval | p | Hazard Ratio | 95% Confidence Interval | p |
| Sex | Female vs. male | 0.626 | 0.387–1.011 | 0.056 | 0.611 | 0.380–0.985 | 0.043 | 0.605 | 0.376–0.974 | 0.038 |
| Age | <59 | |||||||||
| 59~66 | 0.929 | 0.560–1.541 | 0.774 | 0.952 | 0.575–1.577 | 0.848 | 1.014 | 0.612–1.680 | 0.957 | |
| 66≤ | 1.775 | 1.118–2.819 | 0.015 | 1.807 | 1.141–2.863 | 0.012 | 2.060 | 1.298–3.269 | 0.002 | |
| MTV | <60.2 | |||||||||
| 60.2≤ | 1.448 | 0.975–2.149 | 0.066 | |||||||
| TLG | <272.4 | |||||||||
| 272.4≤ | 1.459 | 0.992–2.144 | 0.055 | |||||||
| Pseudotime | <0.59 | |||||||||
| 0.59≤ | 2.245 | 1.397–3.609 | <0.001 | |||||||
| Study | Subject Cancer Type | Subject Data Type | Analysis Method |
|---|---|---|---|
| Kim et al. [9] | Lung cancer (adenocarcinoma) | Single-cell RNA sequencing | Monocle |
| Pang et al. [18] | Glioblastoma | Single-cell RNA sequencing | Monocle |
| Campbell and Yau [14] | Colorectal cancer and breast cancer | Tissue-scale RNA sequencing | Phenopath |
| Lee et al. [10] | Lung cancer (adenocarcinoma) | Tissue-scale RNA sequencing | Phenopath |
| The present study | Lung cancer (both adenocarcinoma and squamous cell carcinoma) | Radiomics data from FDG PET/CT images | Phenopath |
Publisher’s Note: MDPI stays neutral with regard to jurisdictional claims in published maps and institutional affiliations. |
© 2022 by the authors. Licensee MDPI, Basel, Switzerland. This article is an open access article distributed under the terms and conditions of the Creative Commons Attribution (CC BY) license (https://creativecommons.org/licenses/by/4.0/).
Share and Cite
Lee, H.; Kim, H.; Choi, Y.S.; Pyo, H.R.; Ahn, M.-J.; Choi, J.Y. Prognostic Significance of Pseudotime from Texture Parameters of FDG PET/CT in Locally Advanced Non-Small-Cell Lung Cancer with Tri-Modality Therapy. Cancers 2022, 14, 3809. https://doi.org/10.3390/cancers14153809
Lee H, Kim H, Choi YS, Pyo HR, Ahn M-J, Choi JY. Prognostic Significance of Pseudotime from Texture Parameters of FDG PET/CT in Locally Advanced Non-Small-Cell Lung Cancer with Tri-Modality Therapy. Cancers. 2022; 14(15):3809. https://doi.org/10.3390/cancers14153809
Chicago/Turabian StyleLee, Hyunjong, Hojoong Kim, Yong Soo Choi, Hong Ryul Pyo, Myung-Ju Ahn, and Joon Young Choi. 2022. "Prognostic Significance of Pseudotime from Texture Parameters of FDG PET/CT in Locally Advanced Non-Small-Cell Lung Cancer with Tri-Modality Therapy" Cancers 14, no. 15: 3809. https://doi.org/10.3390/cancers14153809
APA StyleLee, H., Kim, H., Choi, Y. S., Pyo, H. R., Ahn, M.-J., & Choi, J. Y. (2022). Prognostic Significance of Pseudotime from Texture Parameters of FDG PET/CT in Locally Advanced Non-Small-Cell Lung Cancer with Tri-Modality Therapy. Cancers, 14(15), 3809. https://doi.org/10.3390/cancers14153809