
Ultra Deep Sequencing of Circulating Cell-Free DNA as a Potential Tool for Hepatocellular Carcinoma Management

 , ,
, ,  , , and
Abstract
:Simple Summary
Abstract
1. Introduction
2. Materials and Methods
2.1. Study Design and Participants
2.2. Sample Collection
2.3. DNA Extraction and Quantification
2.4. Primer Design and PCR
2.5. Library Preparation and Next-Generation Sequencing
2.6. Data Analysis
2.7. Statistical Analysis
3. Results
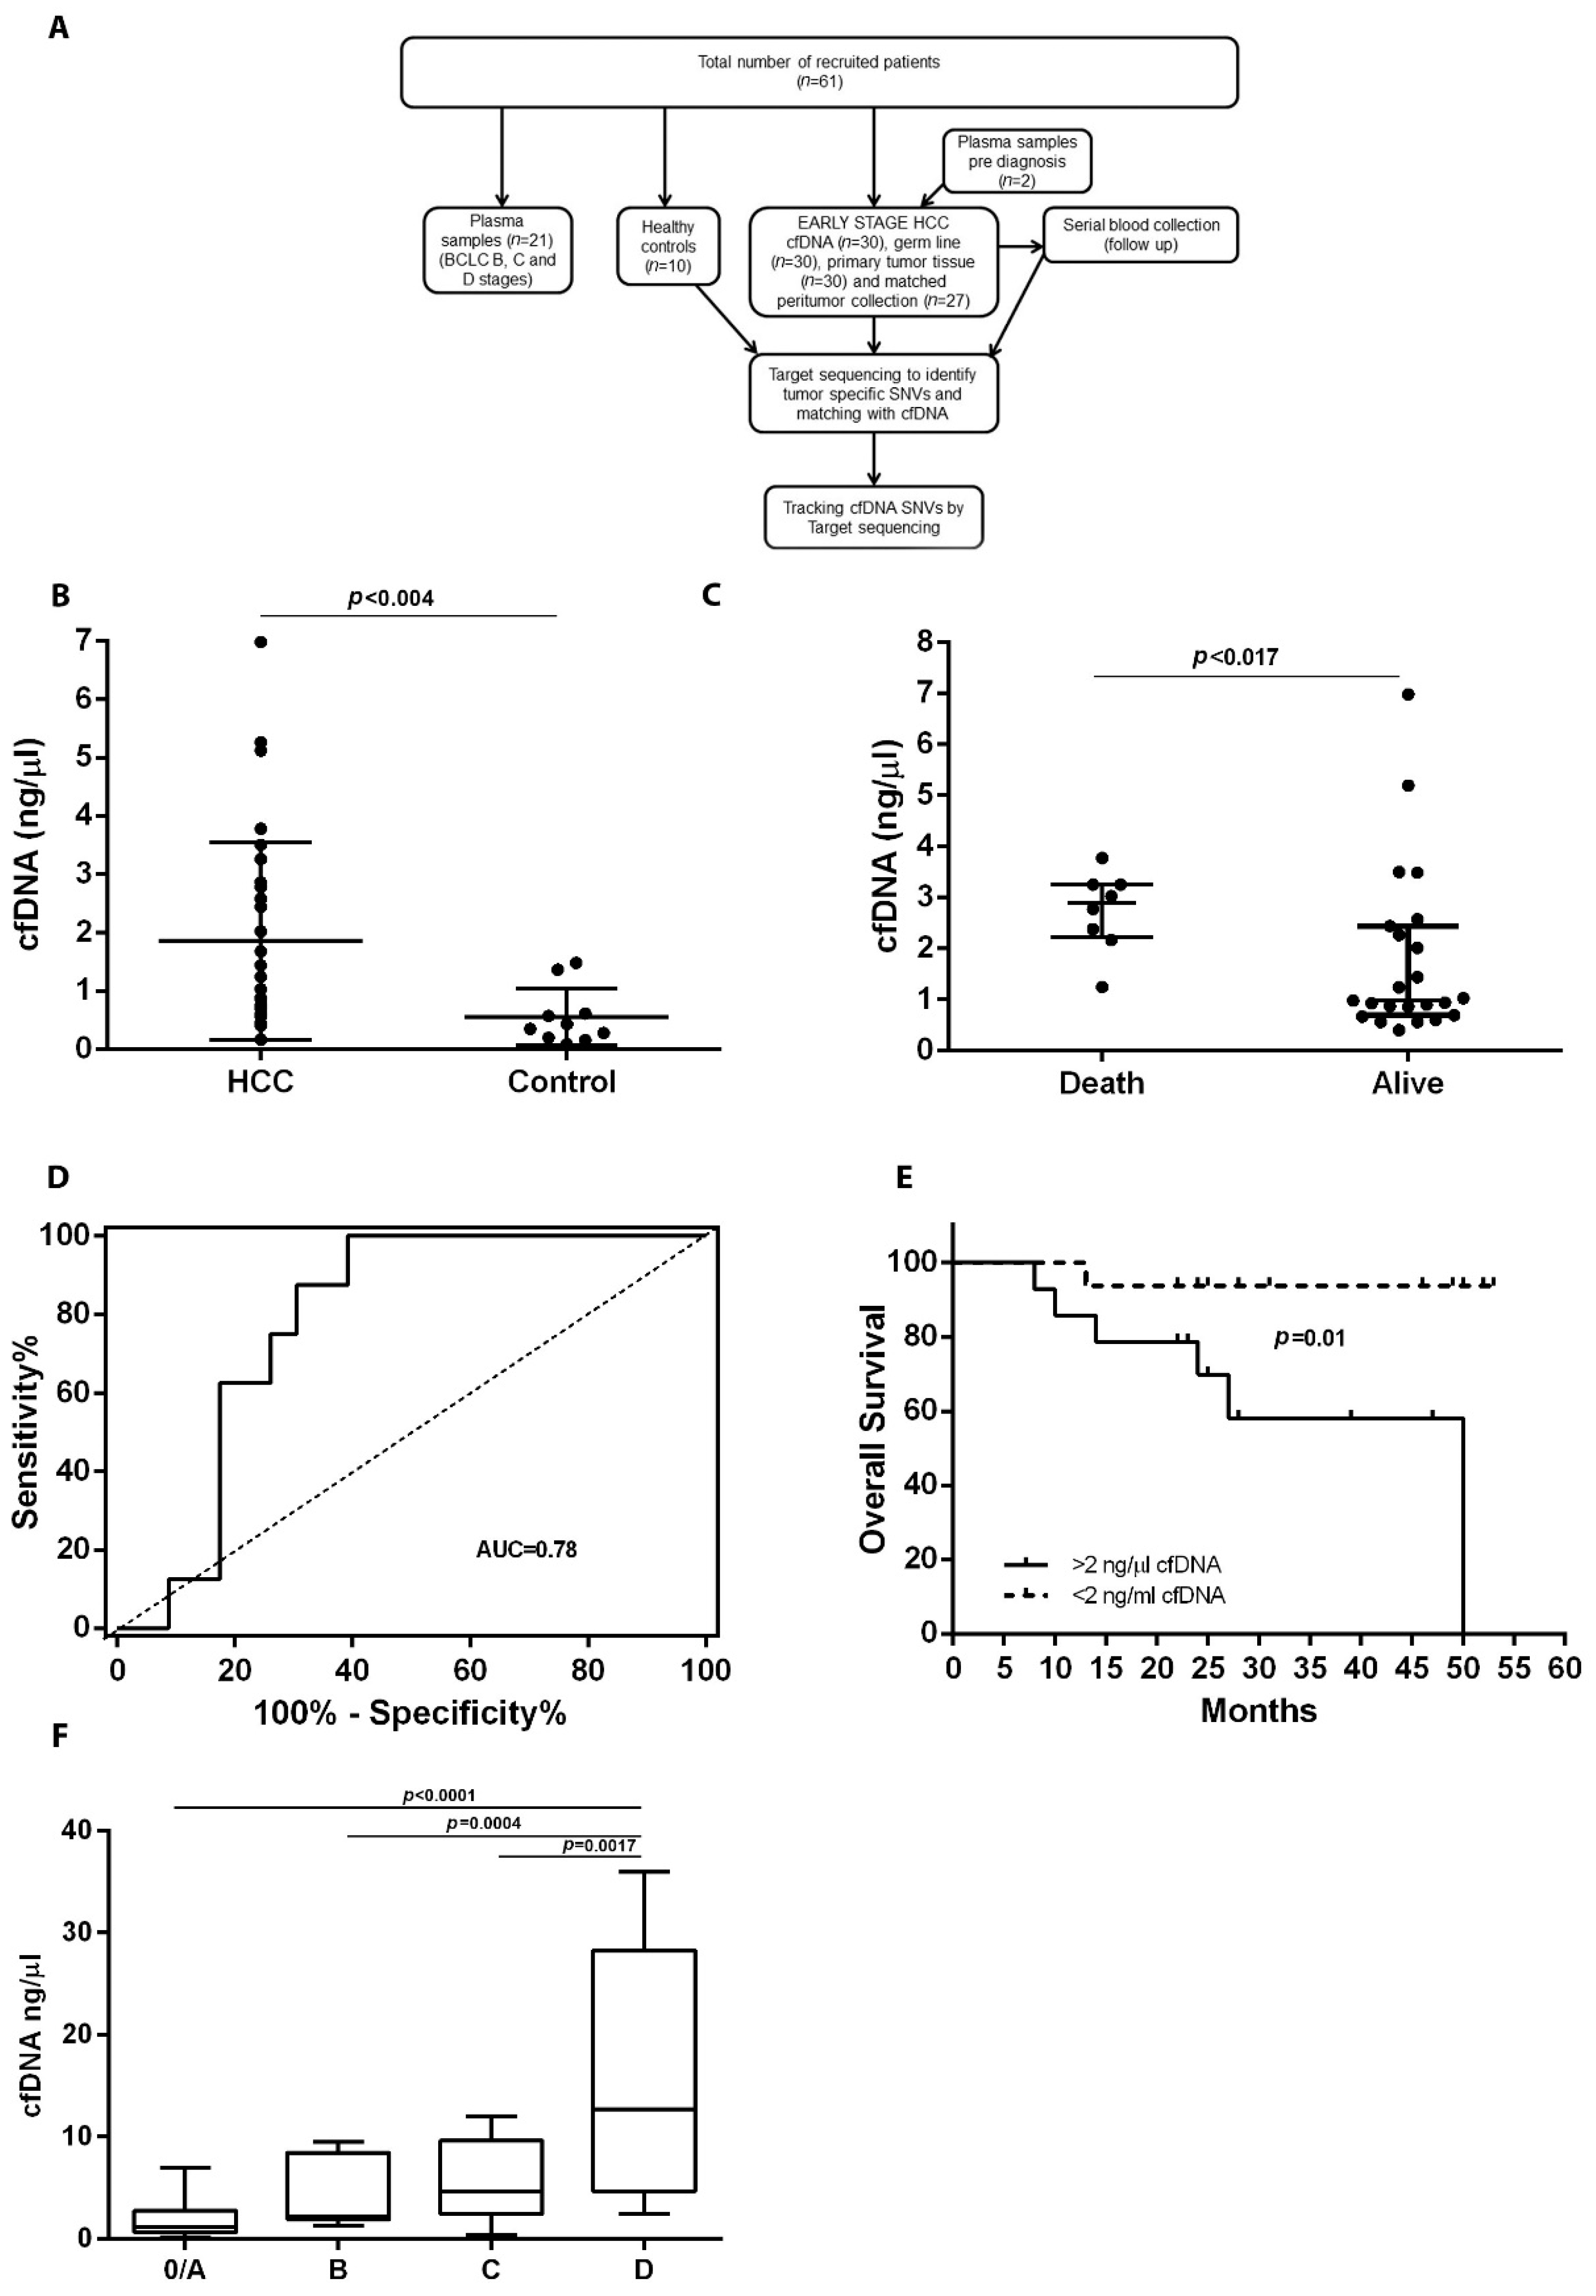
3.1. Study Design and Patient Characteristics
3.2. Quantification of cfDNA in HCC Patients
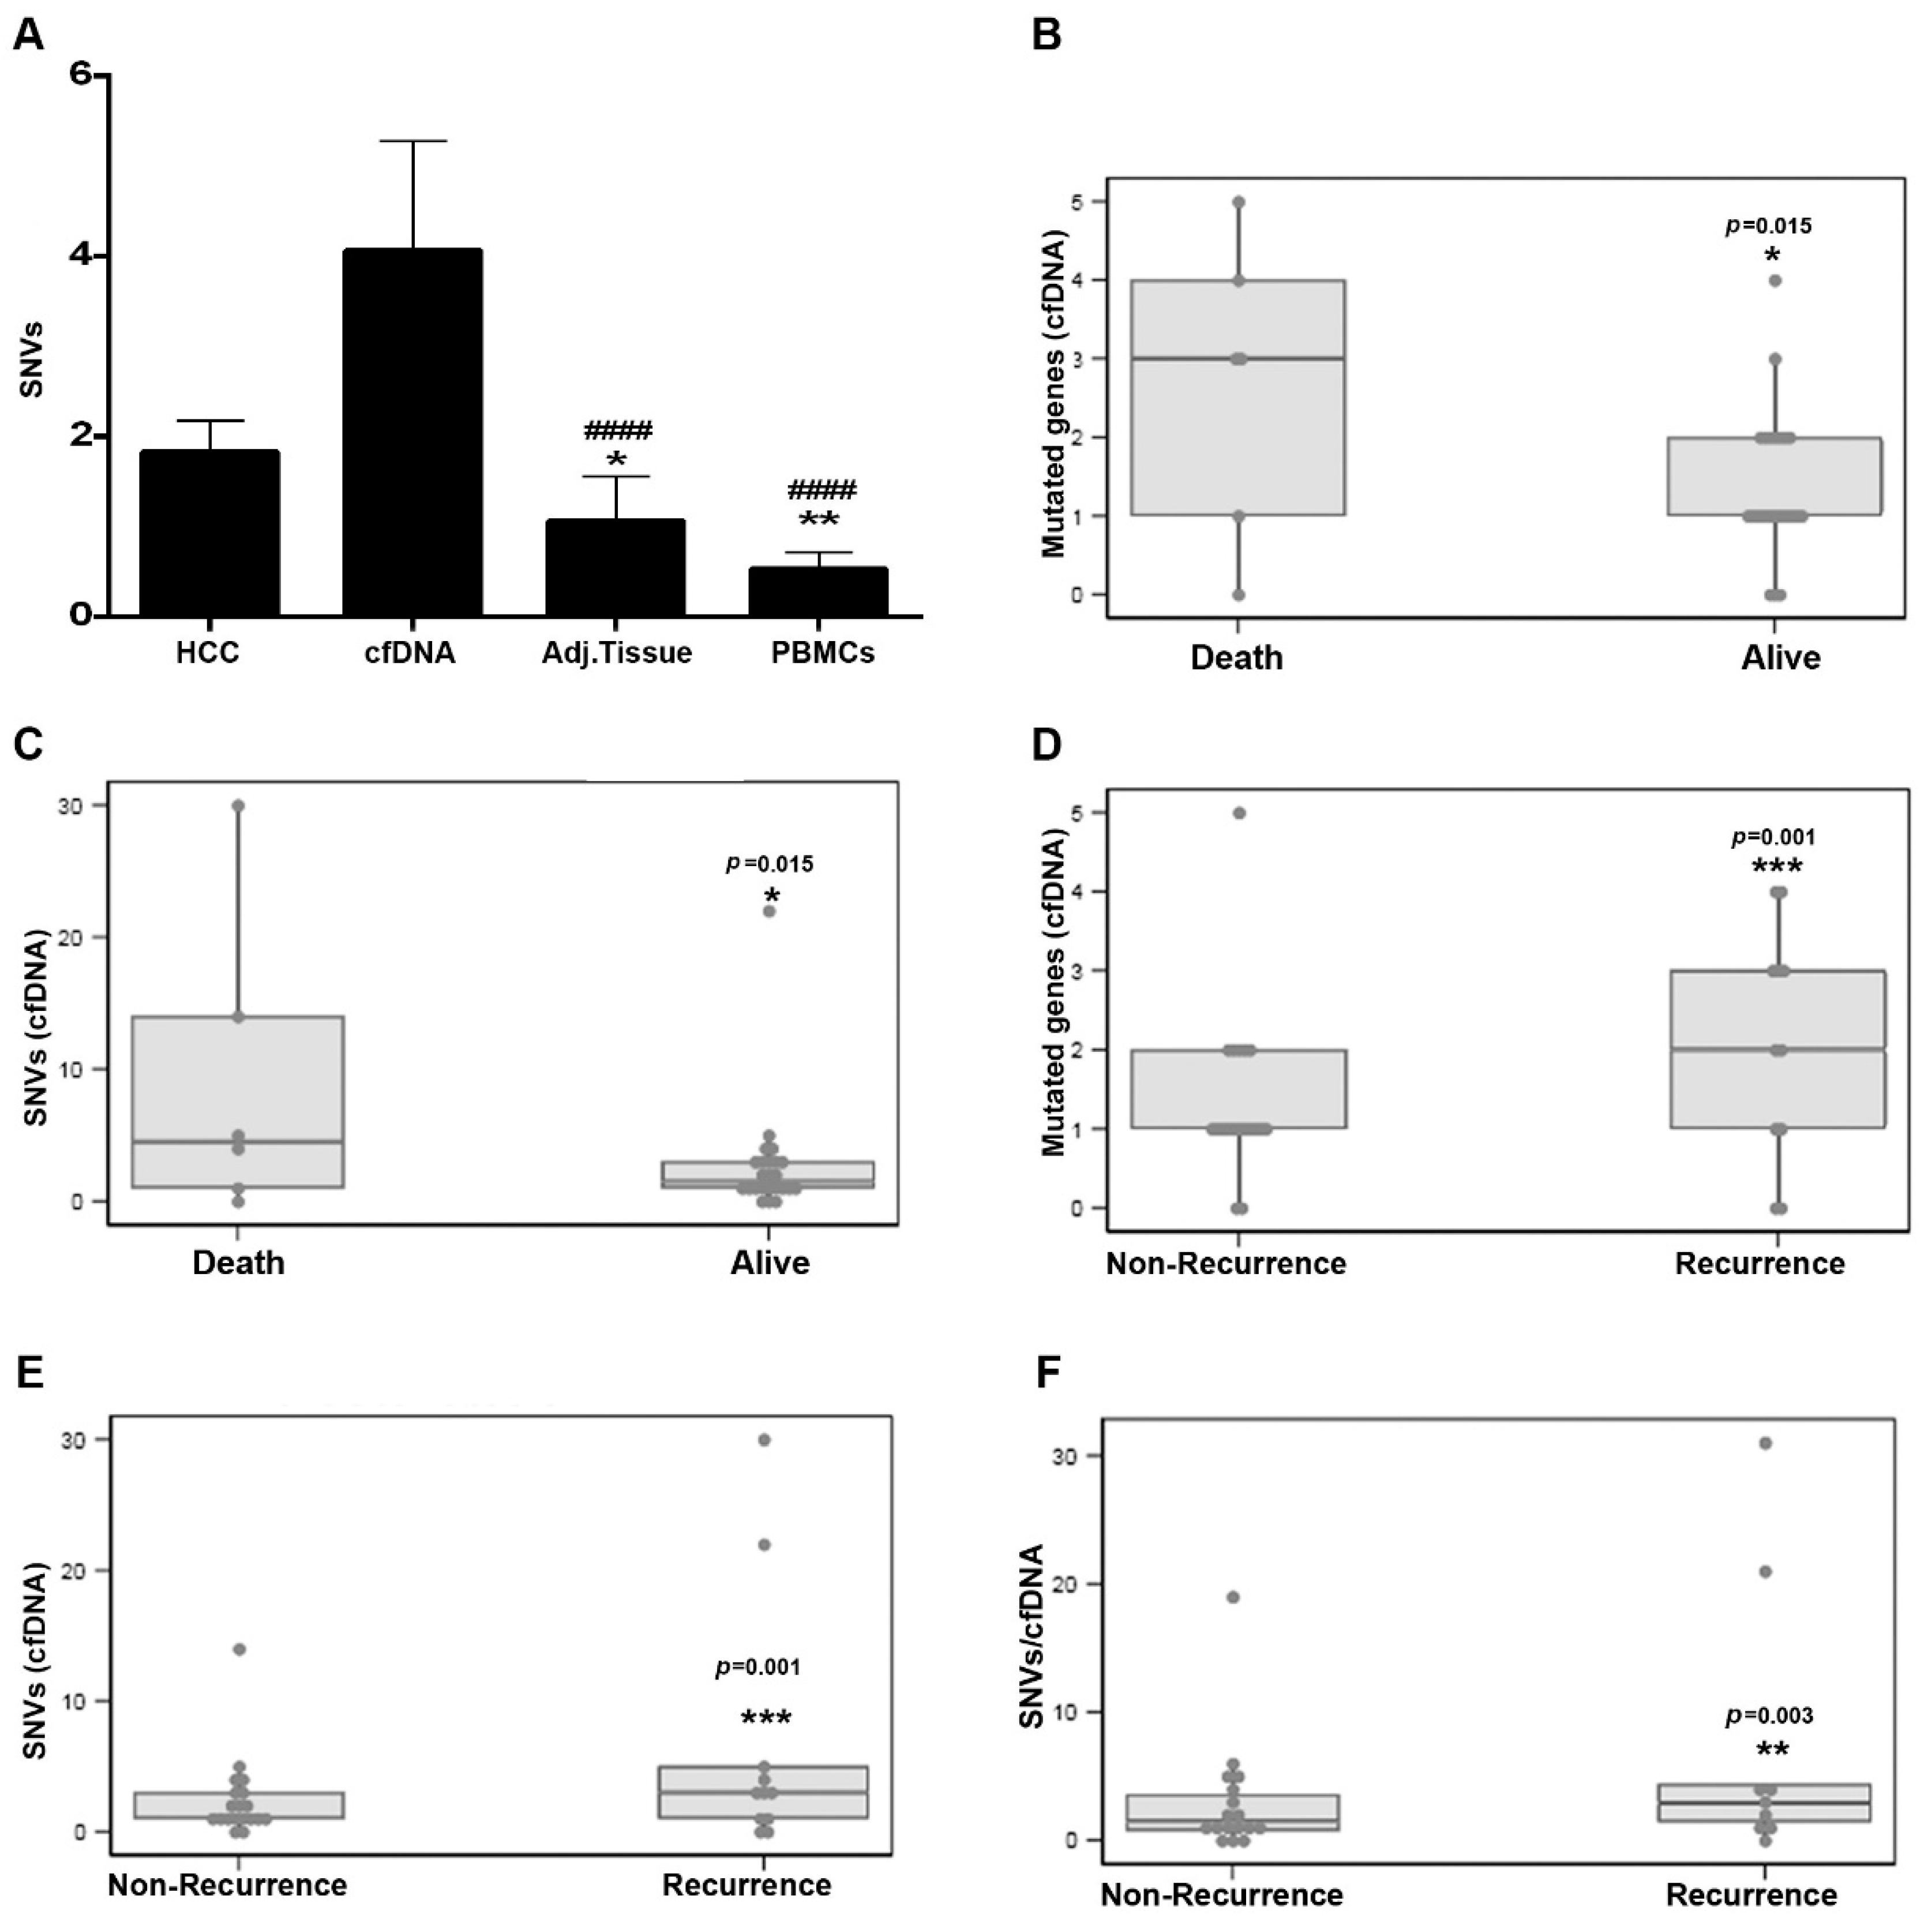
3.3. Mutations Identified in Plasma cfDNA and Matched HCC Tissue DNA
3.4. Variant Characteristics in Plasma and HCC Tissue
3.5. Early Detection of Mutations in Driver Genes Prior to HCC Diagnosis
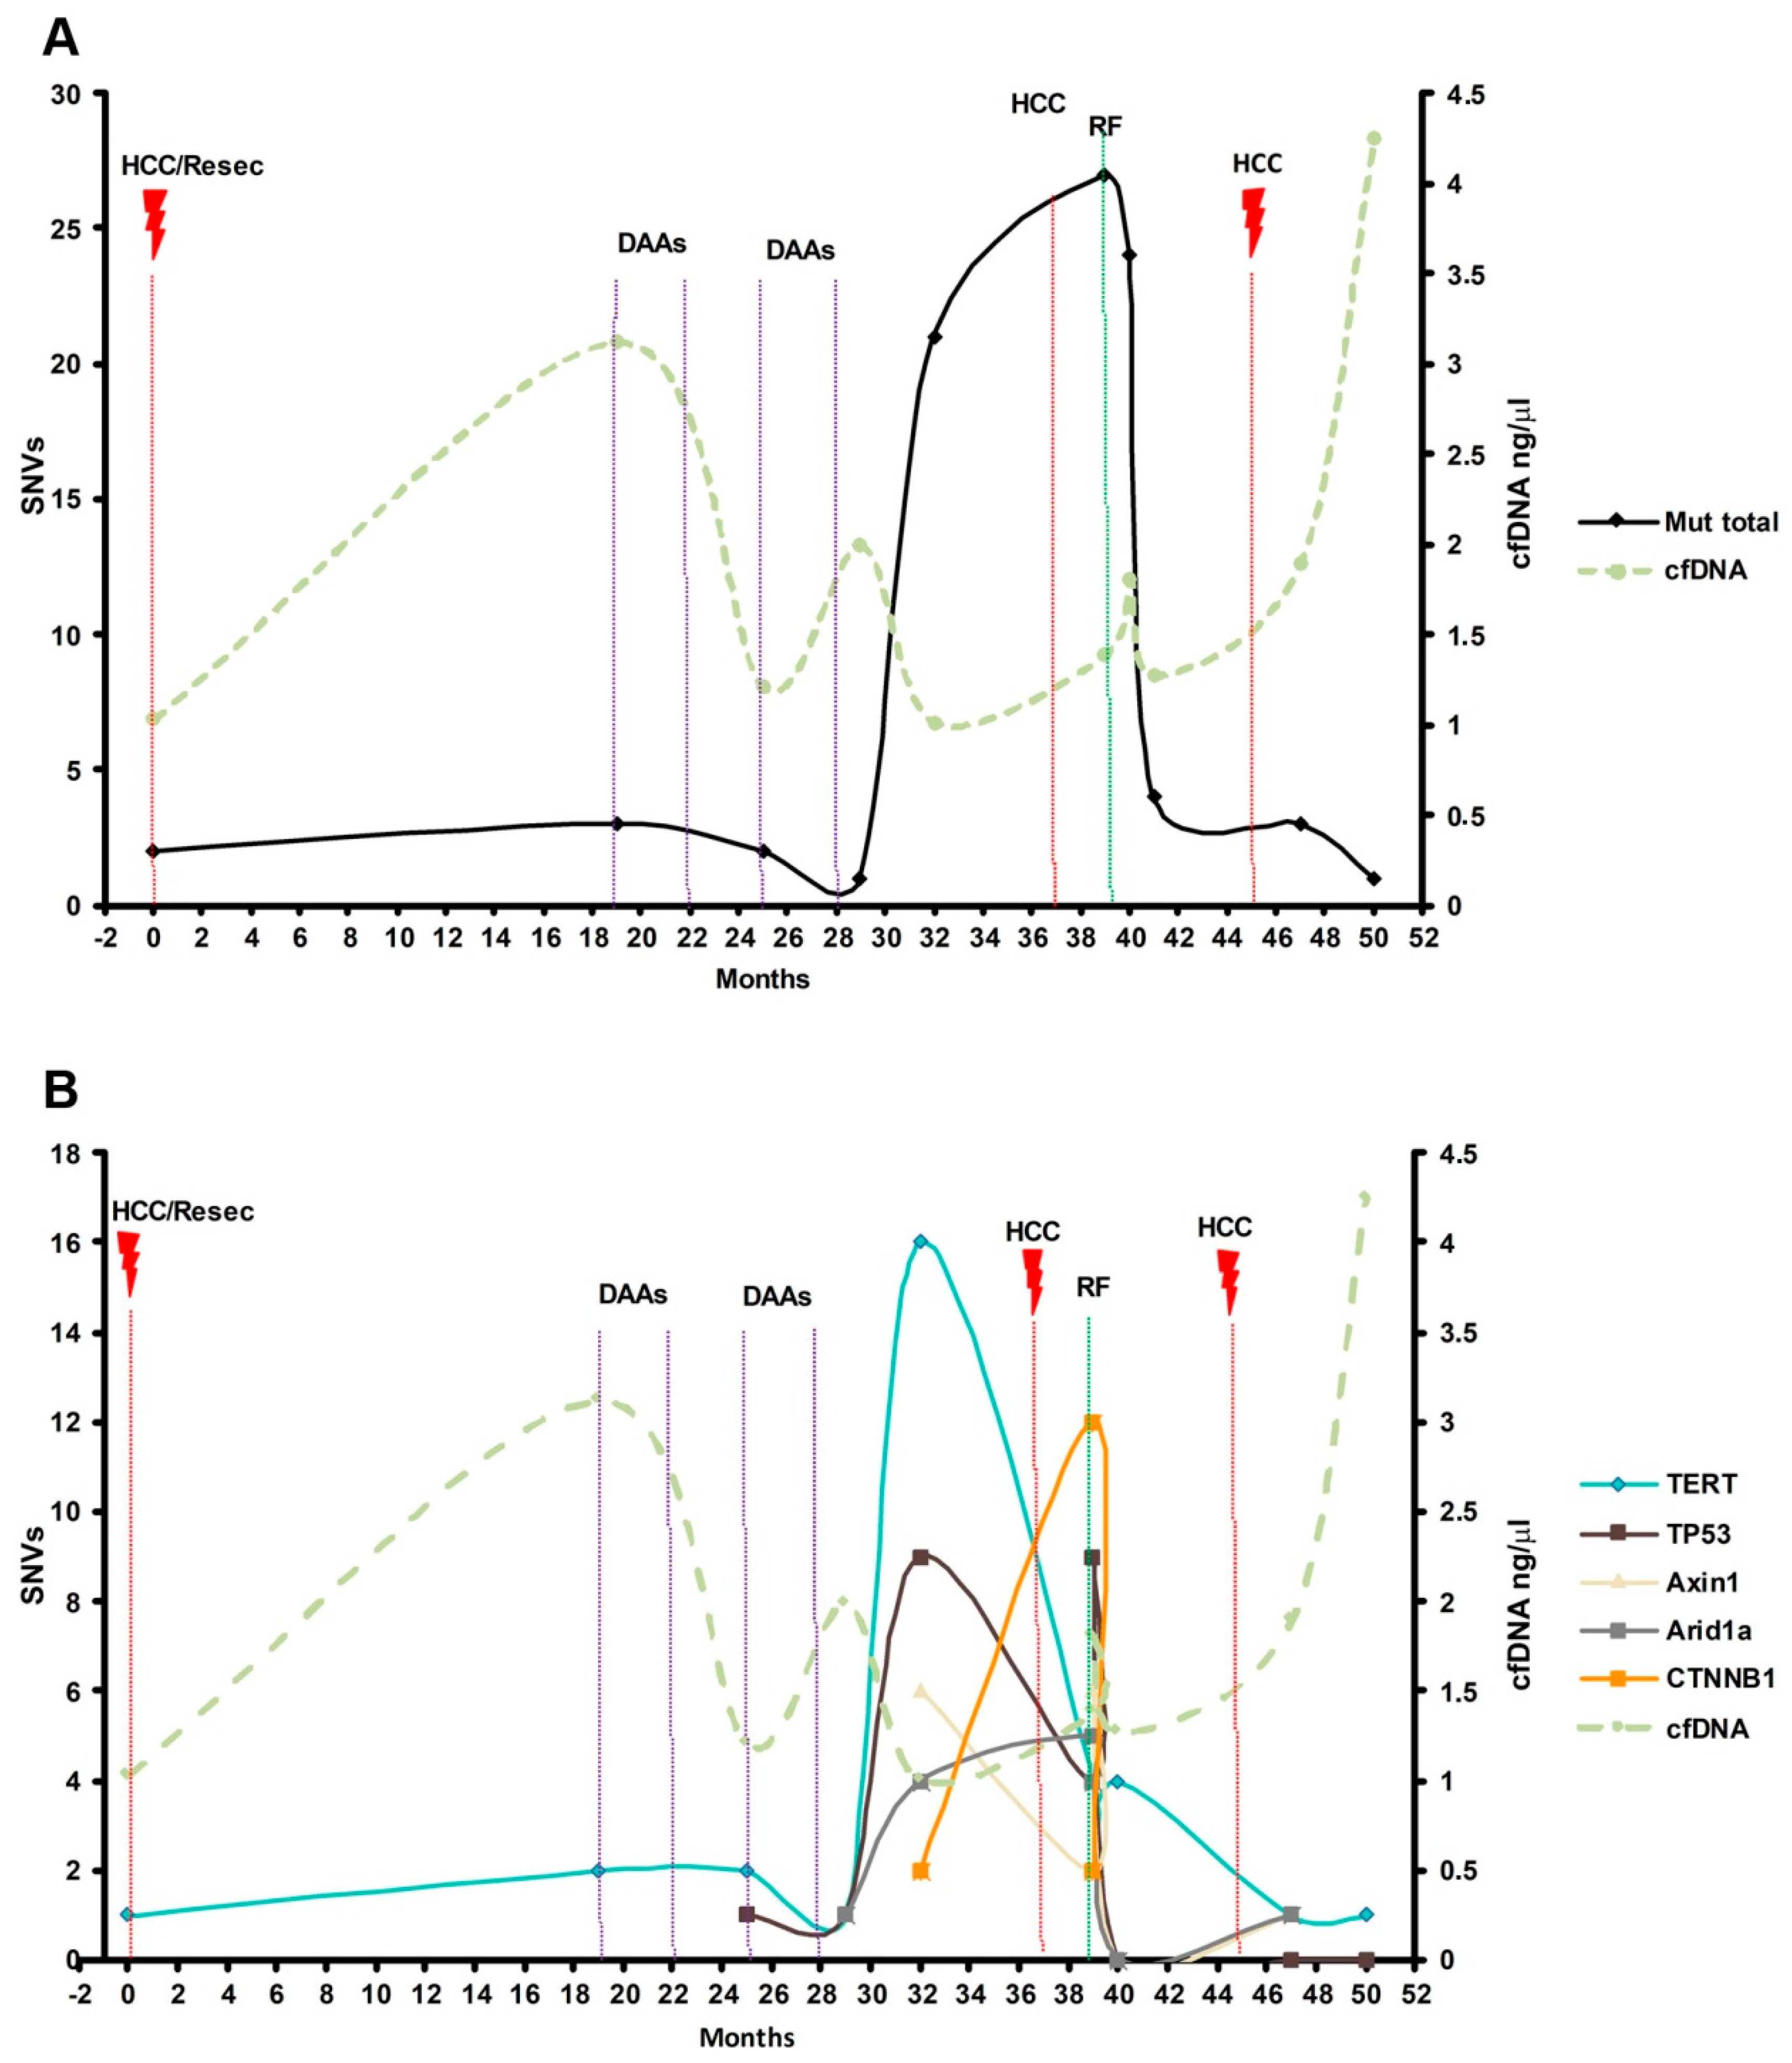
3.6. Dynamics of cfDNA and Mutations during HCC Progression
4. Discussion
5. Conclusions
Supplementary Materials
Author Contributions
Funding
Institutional Review Board Statement
Informed Consent Statement
Data Availability Statement
Acknowledgments
Conflicts of Interest
Abbreviations
References
- IARC. Fact Sheets by Population-Globocan-IARC. Available online: http://globocan.iarc.fr/pages/fact_sheets_population.aspx (accessed on 27 April 2022).
- Galle, P.R.; Forner, A.; Llovet, J.M.; Mazzaferro, V.; Piscaglia, F.; Raoul, J.L.; Schirmacher, P.; Vilgrain, V. EASL Clinical Practice Guidelines: Management of hepatocellular carcinoma. J. Hepatol. 2018, 69, 182–236. [Google Scholar] [CrossRef] [PubMed] [Green Version]
- Losic, B.; Craig, A.J.; Villacorta-Martin, C.; Martins-Filho, S.N.; Akers, N.; Chen, X.; Ahsen, M.E.; von Felden, J.; Labgaa, I.; DʹAvola, D.; et al. Intratumoral heterogeneity and clonal evolution in liver cancer. Nat. Commun. 2020, 11, 291. [Google Scholar] [CrossRef] [PubMed]
- Bruix, J.; Reig, M.; Sherman, M. Evidence-Based Diagnosis, Staging, and Treatment of Patients With Hepatocellular Carcinoma. Gastroenterology 2016, 150, 835–853. [Google Scholar] [CrossRef] [PubMed] [Green Version]
- Crowley, E.; Di Nicolantonio, F.; Loupakis, F.; Bardelli, A. Liquid biopsy: Monitoring cancer-genetics in the blood. Nat. Rev. Clin. Oncol. 2013, 10, 472–484. [Google Scholar] [CrossRef] [PubMed]
- Kaseb, A.O.; Sánchez, N.S.; Sen, S.; Kelley, R.K.; Tan, B.; Bocobo, A.G.; Lim, K.H.; Abdel-Wahab, R.; Uemura, M.; Pestana, R.C.; et al. Molecular Profiling of Hepatocellular Carcinoma Using Circulating Cell-Free DNA. Clin. Cancer Res. Off. J. Am. Assoc. Cancer Res. 2019, 25, 6107–6118. [Google Scholar] [CrossRef] [PubMed] [Green Version]
- Labgaa, I.; Villacorta-Martin, C.; D’avola, D.; Craig, A.J.; Von Felden, J.; Martins-Filho, S.N.; Sia, D.; Stueck, A.; Ward, S.C.; Fiel, M.I.; et al. A pilot study of ultra-deep targeted sequencing of plasma DNA identifies driver mutations in hepatocellular carcinoma. Oncogene 2018, 37, 3740–3752. [Google Scholar] [CrossRef]
- Phallen, J.; Sausen, M.; Adleff, V.; Leal, A.; Hruban, C.; White, J.; Anagnostou, V.; Fiksel, J.; Cristiano, S.; Papp, E.; et al. Direct detection of early-stage cancers using circulating tumor DNA. Sci. Transl. Med. 2017, 9, 403. [Google Scholar] [CrossRef] [Green Version]
- Cai, Z.; Chen, G.; Zeng, Y.; Dong, X.; Li, Z.; Huang, Y.; Xin, F.; Qiu, L.; Xu, H.; Zhang, W.; et al. Comprehensive Liquid Profiling of Circulating Tumor DNA and Protein Biomarkers in Long-Term Follow-Up Patients with Hepatocellular Carcinoma. Clin. Cancer Res. Off. J. Am. Assoc. Cancer Res. 2019, 25, 5284–5294. [Google Scholar] [CrossRef] [PubMed]
- Amirouchene-Angelozzi, N.; Swanton, C.; Bardelli, A. Tumor evolution as a therapeutic target. Cancer Discov. 2017, 7, 805–817. [Google Scholar] [CrossRef] [PubMed] [Green Version]
- Huang, Z.; Hua, D.; Hu, Y.; Cheng, Z.; Zhou, X.; Xie, Q.; Wang, Q.; Wang, F.; Du, X.; Zeng, Y. Quantitation of plasma circulating DNA using quantitative PCR for the detection of hepatocellular carcinoma. Pathol. Oncol. Res. 2012, 18, 271–276. [Google Scholar] [CrossRef]
- Ren, N.; Qin, L.X.; Tu, H.; Liu, Y.K.; Zhang, B.H.; Tang, Z.Y. The prognostic value of circulating plasma DNA level and its allelic imbalance on chromosome 8p in patients with hepatocellular carcinoma. J. Cancer Res. Clin. Oncol. 2006, 132, 399–407. [Google Scholar] [CrossRef] [PubMed]
- Tokuhisa, Y.; Iizuka, N.; Sakaida, I.; Moribe, T.; Fujita, N.; Miura, T.; Tamatsukuri, S.; Ishitsuka, H.; Uchida, K.; Terai, S.; et al. Circulating cell-free DNA as a predictive marker for distant metastasis of hepatitis C virus-related hepatocellular carcinoma. Br. J. Cancer 2007, 97, 1399–1403. [Google Scholar] [CrossRef] [PubMed]
- Parikh, A.R.; Leshchiner, I.; Elagina, L.; Goyal, L.; Levovitz, C.; Siravegna, G.; Livitz, D.; Rhrissorrakrai, K.; Martin, E.E.; Van Seventer, E.E.; et al. Liquid versus tissue biopsy for detecting acquired resistance and tumor heterogeneity in gastrointestinal cancers. Nat. Med. 2019, 25, 1415–1421. [Google Scholar] [CrossRef] [PubMed]
- Leal, A.; van Grieken, N.C.T.; Palsgrove, D.N.; Phallen, J.; Medina, J.E.; Hruban, C.; Broeckaert, M.A.M.; Anagnostou, V.; Adleff, V.; Bruhm, D.C.; et al. White blood cell and cell-free DNA analyses for detection of residual disease in gastric cancer. Nat. Commun. 2020, 11, 525. [Google Scholar] [CrossRef] [Green Version]
- Liao, W.; Yang, H.; Xu, H.; Wang, Y.; Ge, P.; Ren, J.; Xu, W.; Lu, X.; Sang, X.; Zhong, S.; et al. Noninvasive detection of tumor-associated mutations from circulating cell-free DNA in hepatocellular carcinoma patients by targeted deep sequencing. Oncotarget 2016, 7, 40481–40490. [Google Scholar] [CrossRef] [PubMed] [Green Version]
- Huang, A.; Zhao, X.; Yang, X.-R.; Li, F.-Q.; Zhou, X.-L.; Wu, K.; Zhang, X.; Sun, Q.-M.; Cao, Y.; Zhu, H.-M.; et al. Circumventing intratumoral heterogeneity to identify potential therapeutic targets in hepatocellular carcinoma. J. Hepatol. 2017, 67, 293–301. [Google Scholar] [CrossRef] [PubMed]
- Cai, Z.X.; Chen, G.; Zeng, Y.Y.; Dong, X.Q.; Lin, M.J.; Huang, X.H.; Zhang, D.; Liu, X.L.; Liu, J.F. Circulating tumor DNA profiling reveals clonal evolution and real-time disease progression in advanced hepatocellular carcinoma. Int. J. Cancer 2017, 141, 977–985. [Google Scholar] [CrossRef] [PubMed] [Green Version]
- Howell, J.; Atkinson, S.R.; Pinato, D.J.; Knapp, S.; Ward, C.; Minisini, R.; Burlone, M.E.; Leutner, M.; Pirisi, M.; Büttner, R.; et al. Identification of mutations in circulating cell-free tumour DNA as a biomarker in hepatocellular carcinoma. Eur. J. Cancer 2019, 116, 56–66. [Google Scholar] [CrossRef] [PubMed]
- Ng, C.K.Y.; Di Costanzo, G.G.; Tosti, N.; Paradiso, V.; Coto-Llerena, M.; Roscigno, G.; Perrina, V.; Quintavalle, C.; Boldanova, T.; Wieland, S.; et al. Genetic profiling using plasma-derived cell-free DNA in therapy-naive hepatocellular carcinoma patients: A pilot study. Ann. Oncol. 2018, 29, 1286–1291. [Google Scholar] [CrossRef] [PubMed] [Green Version]
- Soria, M.E.; Gregori, J.; Chen, Q.; García-Cehic, D.; Llorens, M.; de Ávila, A.I.; Beach, N.M.; Domingo, E.; Rodríguez-Frías, F.; Buti, M.; et al. Pipeline for specific subtype amplification and drug resistance detection in hepatitis C virus. BMC Infect. Dis. 2018, 18, 446. [Google Scholar] [CrossRef]
- Magoč, T.; Salzberg, S.L. FLASH: Fast length adjustment of short reads to improve genome assemblies. Bioinformatics 2011, 27, 2957–2963. [Google Scholar] [CrossRef] [PubMed]
- Gregori, J.; Esteban, J.I.; Cubero, M.; Garcia-Cehic, D.; Perales, C.; Casillas, R.; Alvarez-Tejado, M.; Rodríguez-Frías, F.; Guardia, J.; Domingo, E.; et al. Ultra-deep pyrosequencing (UDPS) data treatment to study amplicon HCV minor variants. PLoS ONE 2013, 8, e83361. [Google Scholar] [CrossRef]
- Ramírez, C.; Gregori, J.; Buti, M.; Tabernero, D.; Camós, S.; Casillas, R.; Quer, J.; Esteban, R.; Homs, M.; Rodriguez-Frías, F. A comparative study of ultra-deep pyrosequencing and cloning to quantitatively analyze the viral quasispecies using hepatitis B virus infection as a model. Antivir. Res. 2013, 98, 273–283. [Google Scholar] [CrossRef] [PubMed]
- COSMIC Database. Available online: https://cancer.sanger.ac.uk/cosmic (accessed on 27 April 2022).
- Ikeda, S.; Tsigelny, I.F.; Skjevik, Å.A.; Kono, Y.; Mendler, M.; Kuo, A.; Sicklick, J.K.; Heestand, G.; Banks, K.C.; Talasaz, A.; et al. Next-Generation Sequencing of Circulating Tumor DNA Reveals Frequent Alterations in Advanced Hepatocellular Carcinoma. Oncologist 2018, 23, 586–593. [Google Scholar] [CrossRef] [PubMed] [Green Version]
- Lu, C.-Y.; Chen, S.-Y.; Peng, H.-L.; Kan, P.-Y.; Chang, W.-C.; Yen, C.-J. Cell-free methylation markers with diagnostic and prognostic potential in hepatocellular carcinoma. Oncotarget 2017, 8, 6406–6418. [Google Scholar] [CrossRef] [PubMed] [Green Version]
- Schulze, K.; Imbeaud, S.; Letouzé, E.; Alexandrov, L.B.; Calderaro, J.; Rebouissou, S.; Couchy, G.; Meiller, C.; Shinde, J.; Soysouvanh, F.; et al. Exome sequencing of hepatocellular carcinomas identifies new mutational signatures and potential therapeutic targets. Nat. Genet. 2015, 47, 505–511. [Google Scholar] [CrossRef] [PubMed]
- Temraz, S.; Nasr, R.; Mukherji, D.; Kreidieh, F.; Shamseddine, A. Liquid biopsy derived circulating tumor cells and circulating tumor DNA as novel biomarkers in hepatocellular carcinoma. Expert Rev. Mol. Diagn. 2022, 22, 507–518. [Google Scholar] [CrossRef] [PubMed]
- Maley, C.C.; Galipeau, P.C.; Finley, J.C.; Wongsurawat, V.J.; Li, X.; Sanchez, C.A.; Paulson, T.G.; Blount, P.L.; Risques, R.A.; Rabinovitch, P.S.; et al. Genetic clonal diversity predicts progression to esophageal adenocarcinoma. Nat. Genet. 2006, 38, 468–473. [Google Scholar] [CrossRef]
- Clark, J.; Attard, G.; Jhavar, S.; Flohr, P.; Reid, A.; De-Bono, J.; Eeles, R.; Scardino, P.; Cuzick, J.; Fisher, G.; et al. Complex patterns of ETS gene alteration arise during cancer development in the human prostate. Oncogene 2008, 27, 1993–2003. [Google Scholar] [CrossRef] [PubMed] [Green Version]
- Navin, N.; Krasnitz, A.; Rodgers, L.; Cook, K.; Meth, J.; Kendall, J.; Riggs, M.; Eberling, Y.; Troge, J.; Grubor, V.; et al. Inferring tumor progression from genomic heterogeneity. Genome Res. 2010, 20, 68–80. [Google Scholar] [CrossRef] [Green Version]
- Ikeda, S.; Lim, J.S.; Kurzrock, R. Analysis of Tissue and Circulating Tumor DNA by Next-Generation Sequencing of Hepatocellular Carcinoma: Implications for Targeted Therapeutics. Mol. Cancer Ther. 2018, 17, 1114–1122. [Google Scholar] [CrossRef] [PubMed] [Green Version]
- Zhu, G.Q.; Liu, W.R.; Tang, Z.; Qu, W.F.; Fang, Y.; Jiang, X.F.; Song, S.S.; Wang, H.; Tao, C.Y.; Zhou, P.Y.; et al. Serial circulating tumor DNA to predict early recurrence in patients with hepatocellular carcinoma: A prospective study. Mol. Oncol. 2022, 16, 549–561. [Google Scholar] [CrossRef] [PubMed]
- Alunni-Fabbroni, M.; Weber, S.; Öcal, O.; Seidensticker, M.; Mayerle, J.; Malfertheiner, P.; Ricke, J. Circulating Cell-Free DNA Combined to Magnetic Resonance Imaging for Early Detection of HCC in Patients with Liver Cirrhosis. Cancers 2021, 13, 521. [Google Scholar] [CrossRef] [PubMed]
- Nault, J.C.; Mallet, M.; Pilati, C.; Calderaro, J.; Bioulac-Sage, P.; Laurent, C.; Laurent, A.; Cherqui, D.; Balabaud, C.; Zucman-Rossi, J.; et al. High frequency of telomerase reverse-transcriptase promoter somatic mutations in hepatocellular carcinoma and preneoplastic lesions. Nat. Commun. 2013, 4, 2218. [Google Scholar] [CrossRef] [PubMed] [Green Version]
- Nault, J.C.; Calderaro, J.; Di Tommaso, L.; Balabaud, C.; Zafrani, E.S.; Bioulac-Sage, P.; Roncalli, M.; Zucman-Rossi, J. Telomerase reverse transcriptase promoter mutation is an early somatic genetic alteration in the transformation of premalignant nodules in hepatocellular carcinoma on cirrhosis. Hepatology 2014, 60, 1983–1992. [Google Scholar] [CrossRef] [PubMed]
- Brunner, S.F.; Roberts, N.D.; Wylie, L.A.; Moore, L.; Aitken, S.J.; Davies, S.E.; Sanders, M.A.; Ellis, P.; Alder, C.; Hooks, Y.; et al. Somatic mutations and clonal dynamics in healthy and cirrhotic human liver. Nature 2019, 574, 538–542. [Google Scholar] [CrossRef] [PubMed]
- Reinert, T.; Schøler, L.V.; Thomsen, R.; Tobiasen, H.; Vang, S.; Nordentoft, I.; Lamy, P.; Kannerup, A.-S.; Mortensen, F.V.; Stribolt, K.; et al. Analysis of circulating tumour DNA to monitor disease burden following colorectal cancer surgery. Gut 2016, 65, 625–634. [Google Scholar] [CrossRef] [Green Version]
- Lecomte, T.; Berger, A.; Zinzindohoué, F.; Micard, S.; Landi, B.; Blons, H.; Beaune, P.; Cugnenc, P.-H.; Laurent-Puig, P. Detection of free-circulating tumor-associated DNA in plasma of colorectal cancer patients and its association with prognosis. Int. J. Cancer 2002, 100, 542–548. [Google Scholar] [CrossRef]
- Tie, J.; Cohen, J.D.; Wang, Y.; Li, L.; Christie, M.; Simons, K.; Elsaleh, H.; Kosmider, S.; Wong, R.; Yip, D.; et al. Serial circulating tumour DNA analysis during multimodality treatment of locally advanced rectal cancer: A prospective biomarker study. Gut 2019, 68, 663–671. [Google Scholar] [CrossRef] [PubMed]
- Tie, J.; Wang, Y.; Cohen, J.; Li, L.; Hong, W.; Christie, M.; Wong, H.L.; Kosmider, S.; Wong, R.; Thomson, B.; et al. Circulating tumor DNA dynamics and recurrence risk in patients undergoing curative intent resection of colorectal cancer liver metastases: A prospective cohort study. PLoS Med. 2021, 18, e1003620. [Google Scholar] [CrossRef]
- Wan, J.C.M.; Massie, C.; Garcia-Corbacho, J.; Mouliere, F.; Brenton, J.D.; Caldas, C.; Pacey, S.; Baird, R.; Rosenfeld, N. Liquid biopsies come of age: Towards implementation of circulating tumour DNA. Nat. Rev. Cancer 2017, 17, 223–238. [Google Scholar] [CrossRef] [PubMed]
- Goldberg, S.B.; Narayan, A.; Kole, A.J.; Decker, R.H.; Teysir, J.; Carriero, N.J.; Lee, A.; Nemati, R.; Nath, S.K.; Mane, S.M.; et al. Early Assessment of Lung Cancer Immunotherapy Response via Circulating Tumor DNA. Clin. Cancer Res. Off. J. Am. Assoc. Cancer Res. 2018, 24, 1872–1880. [Google Scholar] [CrossRef] [PubMed] [Green Version]
- Diehl, F.; Schmidt, K.; Choti, M.A.; Romans, K.; Goodman, S.; Li, M.; Thornton, K.; Agrawal, N.; Sokoll, L.; Szabo, S.A.; et al. Circulating mutant DNA to assess tumor dynamics. Nat. Med. 2008, 14, 985–990. [Google Scholar] [CrossRef] [PubMed]


| Death | Recurrence | ||||||
|---|---|---|---|---|---|---|---|
| Variable | HR | (95% CI) | p-Value | HR | (95% CI) | p-Value | |
| Presence of mutations in HCC Tissue | No | 1 | 0.939 | 1 | 0.802 | ||
| Yes | 0.92 | (0.11; 7.91) | 0.82 | (0.18; 3.82) | |||
| Number of mutations in HCC Tissue | 0.99 | (0.82; 1.19) | 0.886 | 1.03 | (0.93; 1.14) | 0.592 | |
| Number of mutated genes in HCC tissue | 0.76 | (0.36; 1.59) | 0.465 | 1.11 | (0.71; 1.73) | 0.643 | |
| Presence of mutations in cfDNA | No | 1 | 0.589 | 1 | 0.484 | ||
| Yes | 0.55 | (0.06; 4.91) | 0.57 | (0.12; 2.72) | |||
| Number of mutations in cfDNA | 1.11 | (1.02; 1.20) | 0.015 * | 1.16 | (1.06; 1.27) | 0.001 * | |
| Number of mutated genes in cfDNA | 2.37 | (1.18; 4.74) | 0.015 * | 2.88 | (1.52; 5.47) | 0.001 * | |
| Number of Mutations/cfDNA(1) | 1.07 | (0.99; 1.16) | 0.089 | 1.2 | (1.06; 1.35) | 0.003 * | |
| Presence of mutations in Adj Tissue | No | 1 | 0.158 | 1 | 0.9280 | ||
| Yes | 0.21 | (0.02; 1.85) | 0.95 | (0.30; 3.04) | |||
| Number of mutations in Adj Tissue | 0.97 | (0.80; 1.17) | 0.754 | 1.06 | (0.98; 1.15) | 0.1359 | |
| Number of mutated genes in HCC tissue | 0.25 | (0.03; 2.02) | 0.193 | 1.17 | (0.79; 1.72) | 0.4285 | |
| Death | Recurrence | ||||||
|---|---|---|---|---|---|---|---|
| Cut-Off Values | HR | (95% CI) | p-Value | HR | (95% CI) | p-Value | |
| Number of mutations in HCC Tissue | No (<6) | 1 | 0.4796 | 1 | 0.346 | ||
| Yes (>6) | 2.23 | (0.24; 20.4) | 2.09 | (0.45; 9.74) | |||
| Number of mutations in cfDNA | No (<4) | 1 | 0.0078 * | 1 | 0.06 | ||
| Yes (>4) | 11.66 | (1.91; 71.2) | 3.54 | (0.94;13.35) | |||
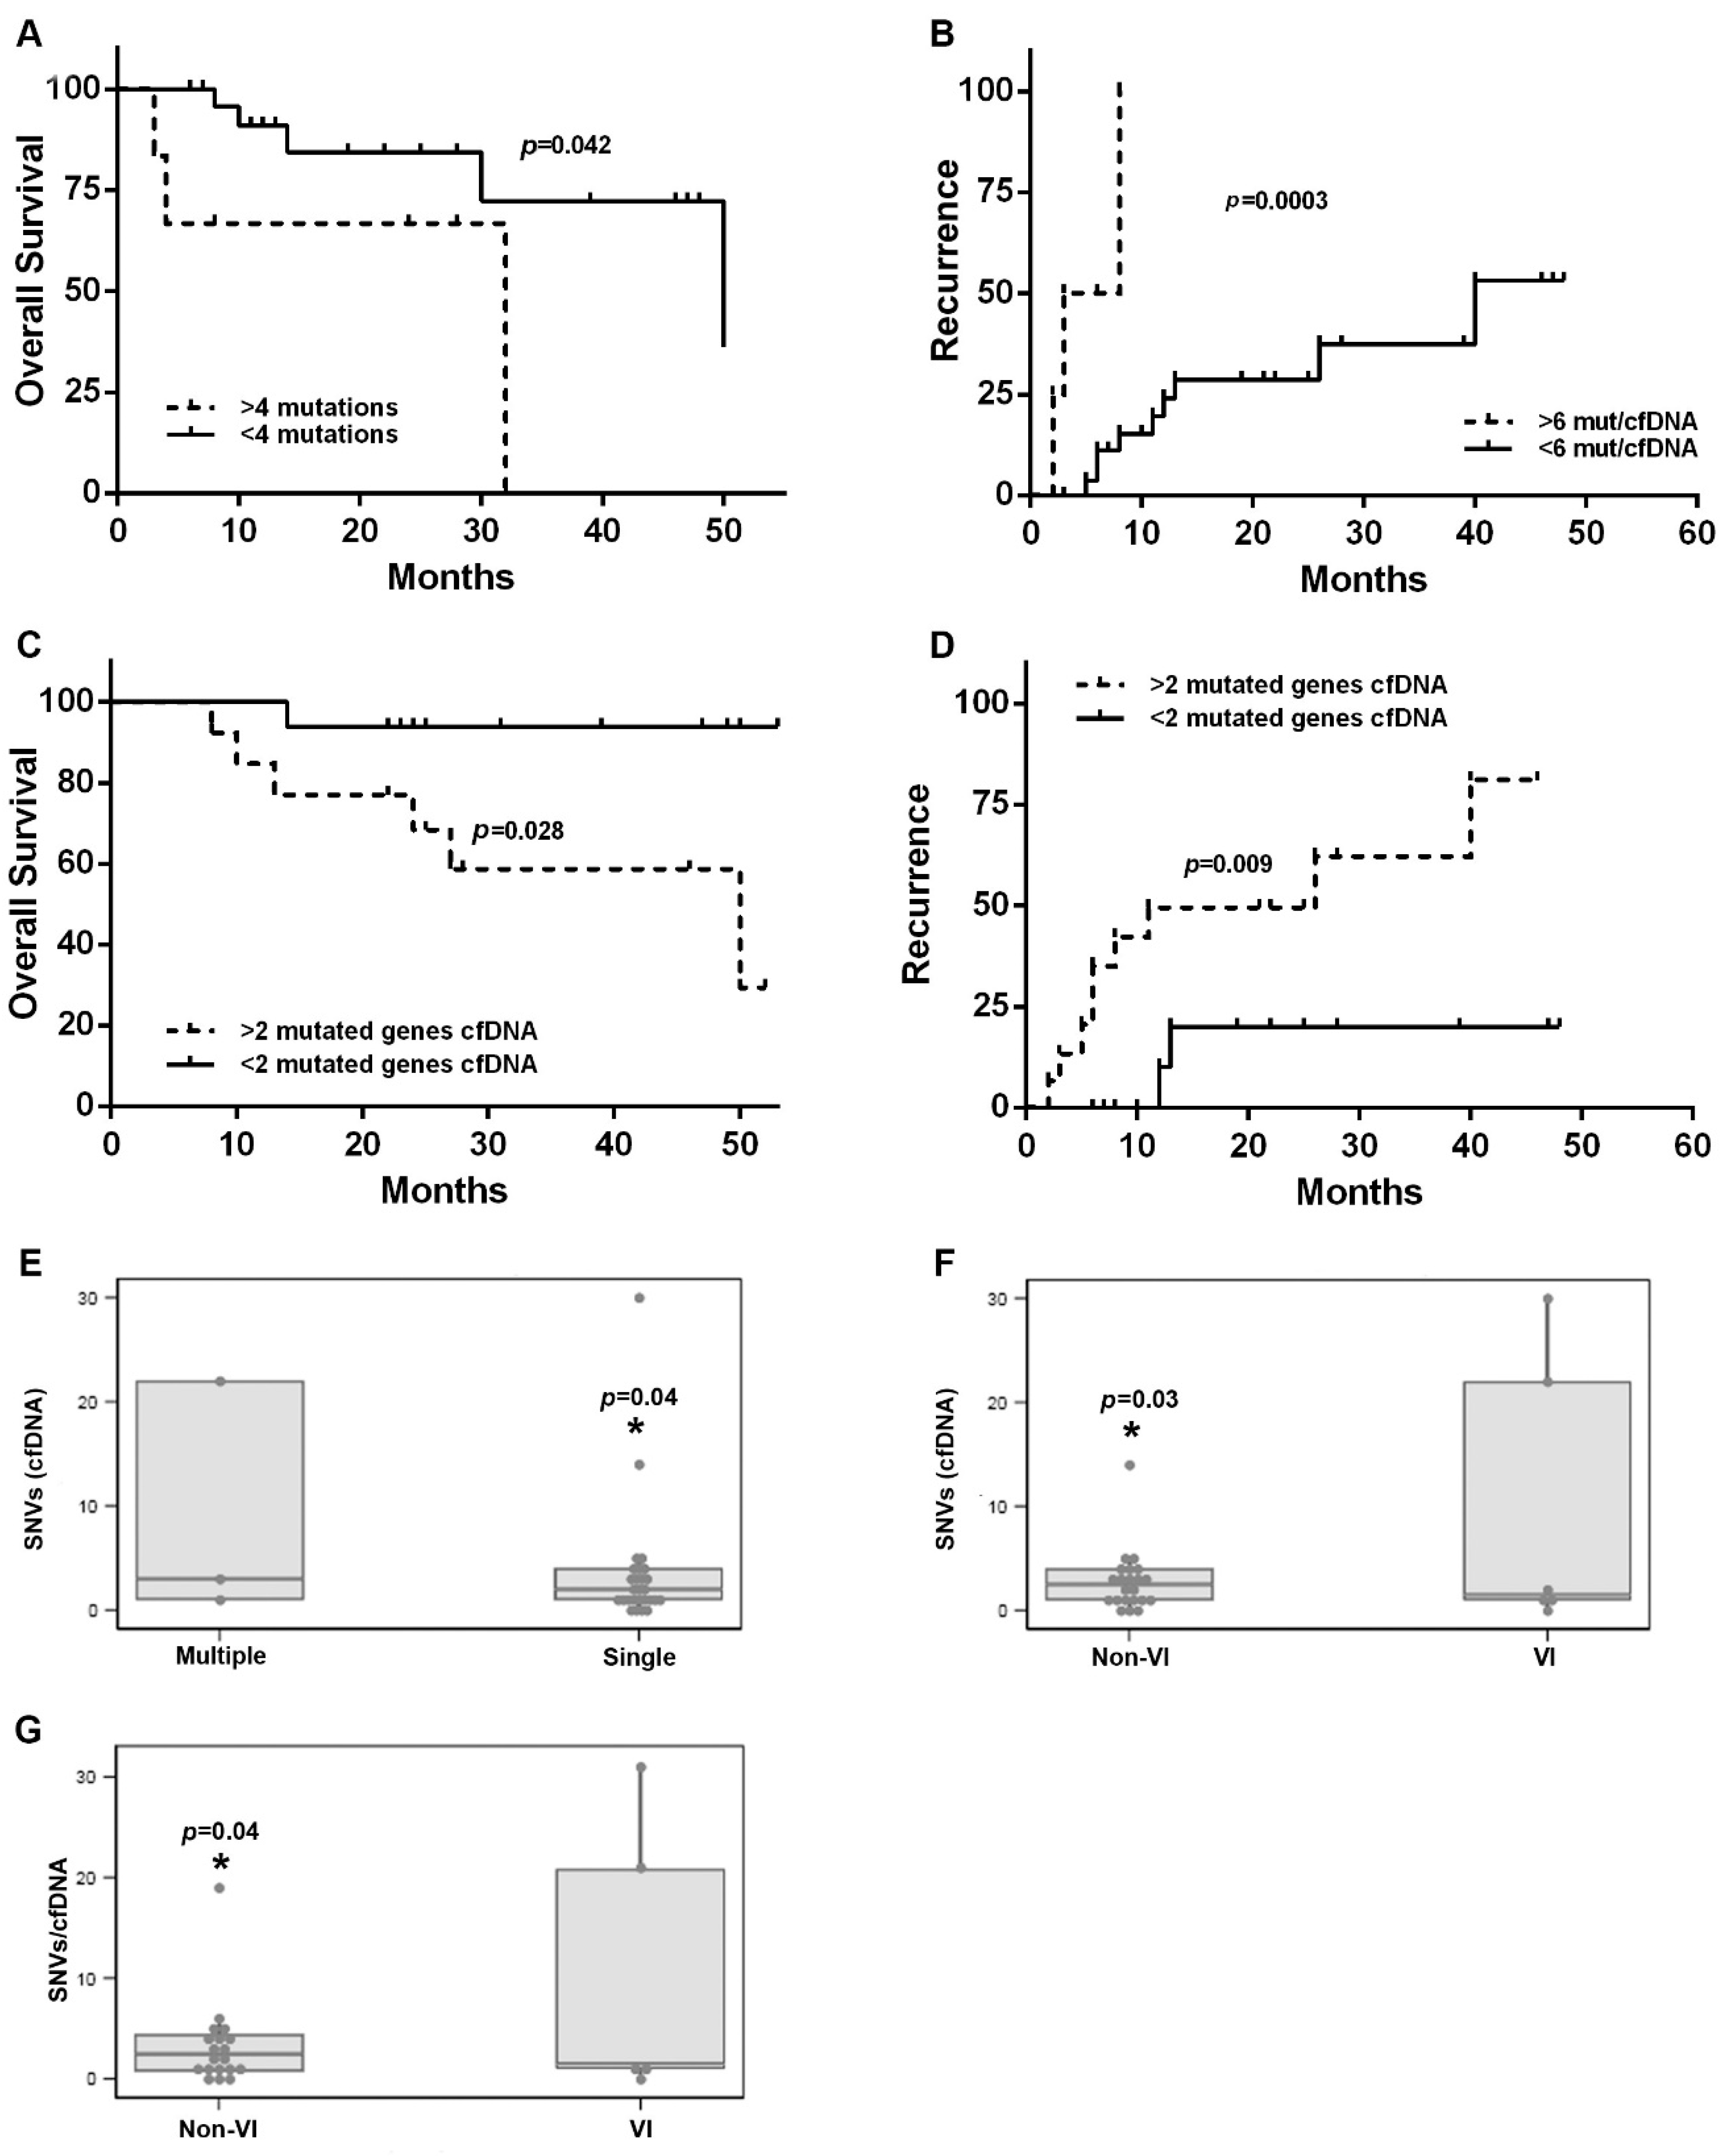
| Number of mutated genes in cfDNA | No (<2) | 1 | 0.0287 * | 1 | 0.009 * | ||
| Yes (>2) | 5.31 | (1.19; 23.77) | 9.61 | (1.75; 52.7) | |||
| N Mutations/cfDNA | No (<6) | 1 | 0.051 | 1 | 0.007 * | ||
| Yes (>6) | 7.07 | (0.99; 50.5) | 7.44 | (1.71; 32.3) | |||
Publisher’s Note: MDPI stays neutral with regard to jurisdictional claims in published maps and institutional affiliations. |
© 2022 by the authors. Licensee MDPI, Basel, Switzerland. This article is an open access article distributed under the terms and conditions of the Creative Commons Attribution (CC BY) license (https://creativecommons.org/licenses/by/4.0/).
Share and Cite
Higuera, M.; Vargas-Accarino, E.; Torrens, M.; Gregori, J.; Salcedo, M.T.; Martínez-Campreciós, J.; Torres, G.; Bermúdez-Ramos, M.; Bilbao, I.; Guerrero-Murillo, M.; et al. Ultra Deep Sequencing of Circulating Cell-Free DNA as a Potential Tool for Hepatocellular Carcinoma Management. Cancers 2022, 14, 3875. https://doi.org/10.3390/cancers14163875
Higuera M, Vargas-Accarino E, Torrens M, Gregori J, Salcedo MT, Martínez-Campreciós J, Torres G, Bermúdez-Ramos M, Bilbao I, Guerrero-Murillo M, et al. Ultra Deep Sequencing of Circulating Cell-Free DNA as a Potential Tool for Hepatocellular Carcinoma Management. Cancers. 2022; 14(16):3875. https://doi.org/10.3390/cancers14163875
Chicago/Turabian StyleHiguera, Mónica, Elena Vargas-Accarino, María Torrens, Josep Gregori, María Teresa Salcedo, Joan Martínez-Campreciós, Gloria Torres, María Bermúdez-Ramos, Itxarone Bilbao, Mercedes Guerrero-Murillo, and et al. 2022. "Ultra Deep Sequencing of Circulating Cell-Free DNA as a Potential Tool for Hepatocellular Carcinoma Management" Cancers 14, no. 16: 3875. https://doi.org/10.3390/cancers14163875
APA StyleHiguera, M., Vargas-Accarino, E., Torrens, M., Gregori, J., Salcedo, M. T., Martínez-Campreciós, J., Torres, G., Bermúdez-Ramos, M., Bilbao, I., Guerrero-Murillo, M., Serres-Créixams, X., Merino, X., Rodríguez-Frías, F., Quer, J., & Mínguez, B. (2022). Ultra Deep Sequencing of Circulating Cell-Free DNA as a Potential Tool for Hepatocellular Carcinoma Management. Cancers, 14(16), 3875. https://doi.org/10.3390/cancers14163875