
Prostate-Specific Antigen Doubling Time Kinetics following Radical Prostatectomy to Guide Need for Treatment Intervention: Validation of Low-Risk Recurrences


Abstract
:Simple Summary
Abstract
1. Introduction
2. Methods
2.1. Patients
2.2. Statistical Methods and Analysis
3. Results
4. Discussion
5. Conclusions
Supplementary Materials
Author Contributions
Funding
Institutional Review Board Statement
Informed Consent Statement
Data Availability Statement
Conflicts of Interest
References
- Tourinho-Barbosa, R.; Srougi, V.; Nunes-Silva, I.; Baghdadi, M.; Rembeyo, G.; Eiffel, S.S.; Barret, E.; Rozet, F.; Galiano, M.; Cathelineau, X.; et al. Biochemical Recurrence after Radical Prostatectomy: What Does It Mean? Int. Braz. J. Urol. 2018, 44, 14–21. [Google Scholar] [CrossRef] [PubMed] [Green Version]
- Ahlering, T.E.; Skarecky, D.W. Long-Term Outcome of Detectable PSA Levels after Radical Prostatectomy. Prostate Cancer Prostatic Dis. 2005, 8, 163–166. [Google Scholar] [CrossRef] [PubMed]
- Cary, K.C.; Johnson, C.S.; Cheng, L.; Koch, M.O. A Critical Assessment of Post-Prostatectomy Prostate Specific Antigen Doubling Time Acceleration—Is It Stable? J. Urol. 2012, 187, 1614–1619. [Google Scholar] [CrossRef] [PubMed]
- Matsumoto, K.; Niwa, N.; Hagiwara, M.; Kosaka, T.; Tanaka, N.; Takeda, T.; Morita, S.; Mizuno, R.; Shinojima, T.; Hara, S.; et al. Type of Patients in Whom Biochemical Recurrence after Radical Prostatectomy Can Be Observed without Salvage Therapy. World J. Urol. 2020, 38, 1749–1756. [Google Scholar] [CrossRef] [PubMed]
- Mottet, N.; van den Bergh, R.C.N.; Briers, E.; Van den Broeck, T.; Cumberbatch, M.G.; De Santis, M.; Fanti, S.; Fossati, N.; Gandaglia, G.; Gillessen, S.; et al. EAU-EANM-ESTRO-ESUR-SIOG Guidelines on Prostate Cancer-2020 Update. Part 1: Screening, Diagnosis, and Local Treatment with Curative Intent. Eur. Urol. 2021, 79, 243–262. [Google Scholar] [CrossRef] [PubMed]
- Huang, E.; Huynh, L.M.; Gordon, A.; Chandhoke, R.; Morales, B.; Skarecky, D.; Tran, J.; Ahlering, T. Active Observation of Biochemical Recurrence without Treatment Following Radical Prostatectomy: Long Term Analysis of Outcomes. J. Urol. 2022, 207 (Suppl. S5), e917. [Google Scholar] [CrossRef]
- Brockman, J.A.; Alanee, S.; Vickers, A.J.; Scardino, P.T.; Wood, D.P.; Kibel, A.S.; Lin, D.W.; Bianco, F.J., Jr.; Rabah, D.M.; Klein, E.A.; et al. Nomogram Predicting Prostate Cancer–Specific Mortality for Men with Biochemical Recurrence after Radical Prostatectomy. Eur. Urol. 2015, 67, 1160–1167. [Google Scholar] [CrossRef] [PubMed] [Green Version]
- Pound, C.R.; Partin, A.W.; Eisenberger, M.A.; Chan, D.W.; Pearson, J.D.; Walsh, P.C. Natural History of Progression After PSA Elevation Following Radical Prostatectomy. JAMA 1999, 281, 1591–1597. [Google Scholar] [CrossRef] [PubMed] [Green Version]
- Cooperberg, M.R.; Vickers, A.J.; Broering, J.M.; Carroll, P.R. Comparative Risk-Adjusted Mortality Outcomes after Primary Surgery, Radiotherapy, or Androgen-Deprivation Therapy for Localized Prostate Cancer. Cancer 2010, 116, 5226–5234. [Google Scholar] [CrossRef] [PubMed] [Green Version]
- D’Amico, A.V.; Moul, J.W.; Carroll, P.R.; Sun, L.; Lubeck, D.; Chen, M.-H. Surrogate End Point for Prostate Cancer-Specific Mortality after Radical Prostatectomy or Radiation Therapy. J. Natl. Cancer Inst. 2003, 95, 1376–1383. [Google Scholar] [CrossRef] [PubMed]
- Freedland, S.J.; Humphreys, E.B.; Mangold, L.A.; Eisenberger, M.; Dorey, F.J.; Walsh, P.C.; Partin, A.W. Risk of Prostate Cancer-Specific Mortality Following Biochemical Recurrence after Radical Prostatectomy. JAMA 2005, 294, 433–439. [Google Scholar] [CrossRef] [Green Version]
- Van den Broeck, T.; van den Bergh, R.C.N.; Arfi, N.; Gross, T.; Moris, L.; Briers, E.; Cumberbatch, M.; De Santis, M.; Tilki, D.; Fanti, S.; et al. Prognostic Value of Biochemical Recurrence Following Treatment with Curative Intent for Prostate Cancer: A Systematic Review. Eur. Urol. 2019, 75, 967–987. [Google Scholar] [CrossRef] [PubMed] [Green Version]
- Parker, C.C.; Clarke, N.W.; Cook, A.D.; Kynaston, H.G.; Petersen, P.M.; Catton, C.; Cross, W.; Logue, J.; Parulekar, W.; Payne, H.; et al. Timing of Radiotherapy after Radical Prostatectomy (RADICALS-RT): A Randomised, Controlled Phase 3 Trial. Lancet 2020, 396, 1413–1421. [Google Scholar] [CrossRef]
- Vale, C.L.; Fisher, D.; Kneebone, A.; Parker, C.; Pearse, M.; Richaud, P.; Sargos, P.; Sydes, M.R.; Brawley, C.; Brihoum, M.; et al. Adjuvant or Early Salvage Radiotherapy for the Treatment of Localised and Locally Advanced Prostate Cancer: A Prospectively Planned Systematic Review and Meta-Analysis of Aggregate Data. Lancet 2020, 396, 1422–1431. [Google Scholar] [CrossRef]
- Eggener, S.E.; Scardino, P.T.; Walsh, P.C.; Han, M.; Partin, A.W.; Trock, B.J.; Feng, Z.; Wood, D.P.; Eastham, J.A.; Yossepowitch, O.; et al. Predicting 15-Year Prostate Cancer Specific Mortality after Radical Prostatectomy. J. Urol. 2011, 185, 869–875. [Google Scholar] [CrossRef] [PubMed] [Green Version]
- Abdollah, F.; Karnes, R.J.; Suardi, N.; Cozzarini, C.; Gandaglia, G.; Fossati, N.; Bianchi, M.; Boorjian, S.A.; Sun, M.; Karakiewicz, P.I.; et al. Predicting Survival of Patients with Node-Positive Prostate Cancer Following Multimodal Treatment. Eur. Urol. 2014, 65, 554–562. [Google Scholar] [CrossRef] [PubMed]
- Bianchi, L.; Schiavina, R.; Borghesi, M.; Bianchi, F.M.; Briganti, A.; Carini, M.; Terrone, C.; Mottrie, A.; Gacci, M.; Gontero, P.; et al. Evaluating the Predictive Accuracy and the Clinical Benefit of a Nomogram Aimed to Predict Survival in Node-Positive Prostate Cancer Patients: External Validation on a Multi-Institutional Database. Int. J. Urol. 2018, 25, 574–581. [Google Scholar] [CrossRef] [PubMed]

| Treatment | No Trmt | Trmt | Total | |
|---|---|---|---|---|
| Count (%) | Count (%) | Count (%) | ||
| N, all patients | 136 (33.4%) | 271 (66.6%) | 407 (100%) | |
| Mean (SD) | Mean (SD) | Mean (SD) | p value | |
| Age, years | 63.5 (7.3) | 63.8 (7.2) | 63.7 (7.3) | 0.677 |
| Adj pre-PSA, ng/mL | 8.4 (5.7) | 12.6 (16.9) | 11.2 (14.3) | 0.005 |
| SHIM | 19.8 (7.1) | 17.9 (7.5) | 18.6 (7.4) | 0.023 |
| EBL | 102.2 (48.4) | 96.2 (37.7) | 98.2 (41.7) | 0.171 |
| BMI | 27.0 (3.8) | 27.3 (3.8) | 27.2 (3.8) | 0.467 |
| Prostate weight | 51.4 (21.3) | 53.5 (19.4) | 52.8 (20.1) | 0.337 |
| Follow-up, years | 7.5 (4.0) | 7.7 (4.4) | 7.6 (4.3) | 0.688 |
| Time to death, years | 6.9 (2.7) | 7.8 (4.0) | 7.6 (3.8) | 0.426 |
| Time to earliest treatment | NA | 3.0 (7.7) | 3.0 (7.7) | |
| Current PSADT, months | 26.0 (19.9) | 8.5 (9.1) | 15.6 (16.9) | <0.001 |
| PSADT after 0.2, months | 39.4 (294.9) | 12.6 (48.4) | 23.6 (192.6) | 0.272 |
| Count (%) | Count (%) | Count (%) | p value | |
| Margins | 36 (26.5%) | 109 (40.2%) | 145 (35.6%) | 0.006 |
| p-stage | <0.001 | |||
| pT2 | 67 (49.3%) | 70 (25.8%) | 137 (33.7%) | |
| pT3/T4 | 69 (50.7%) | 201 (74.2%) | 270 (66.3%) | |
| Gleason grade group (GGG) | <0.001 | |||
| 1 | 17 (12.5%) | 4 (1.5%) | 21 (5.2%) | |
| 2 | 48 (35.3%) | 52 (19.2%) | 100 (24.6%) | |
| 3 | 43 (31.6%) | 79 (29.2%) | 122 (30.0%) | |
| 4 | 17 (12.5%) | 22 (8.1%) | 39 (9.6%) | |
| 5 | 11 (8.1%) | 114 (42.1%) | 125 (30.7%) | |
| PSADT > 0.2 group, months | <0.001 | |||
| >12 | 90 (73.8%) | 37 (22.6%) | 127 (44.4%) | |
| 6 to 12 | 19 (15.6%) | 48 (29.3%) | 67 (23.4%) | |
| <6 | 13 (10.7%) | 79 (48.2%) | 92 (32.2%) | |
| NA | 14 * | 107 ** | 121 | |
| DT pattern | <0.001 | |||
| Increasing | 96 (72.7%) | 49 (32.7%) | 142 (50.7%) | |
| Decreasing | 36 (27.3%) | 101 (67.3%) | 138 (49.3%) | |
| NA | 4 *** | 121 ** | 127 | |
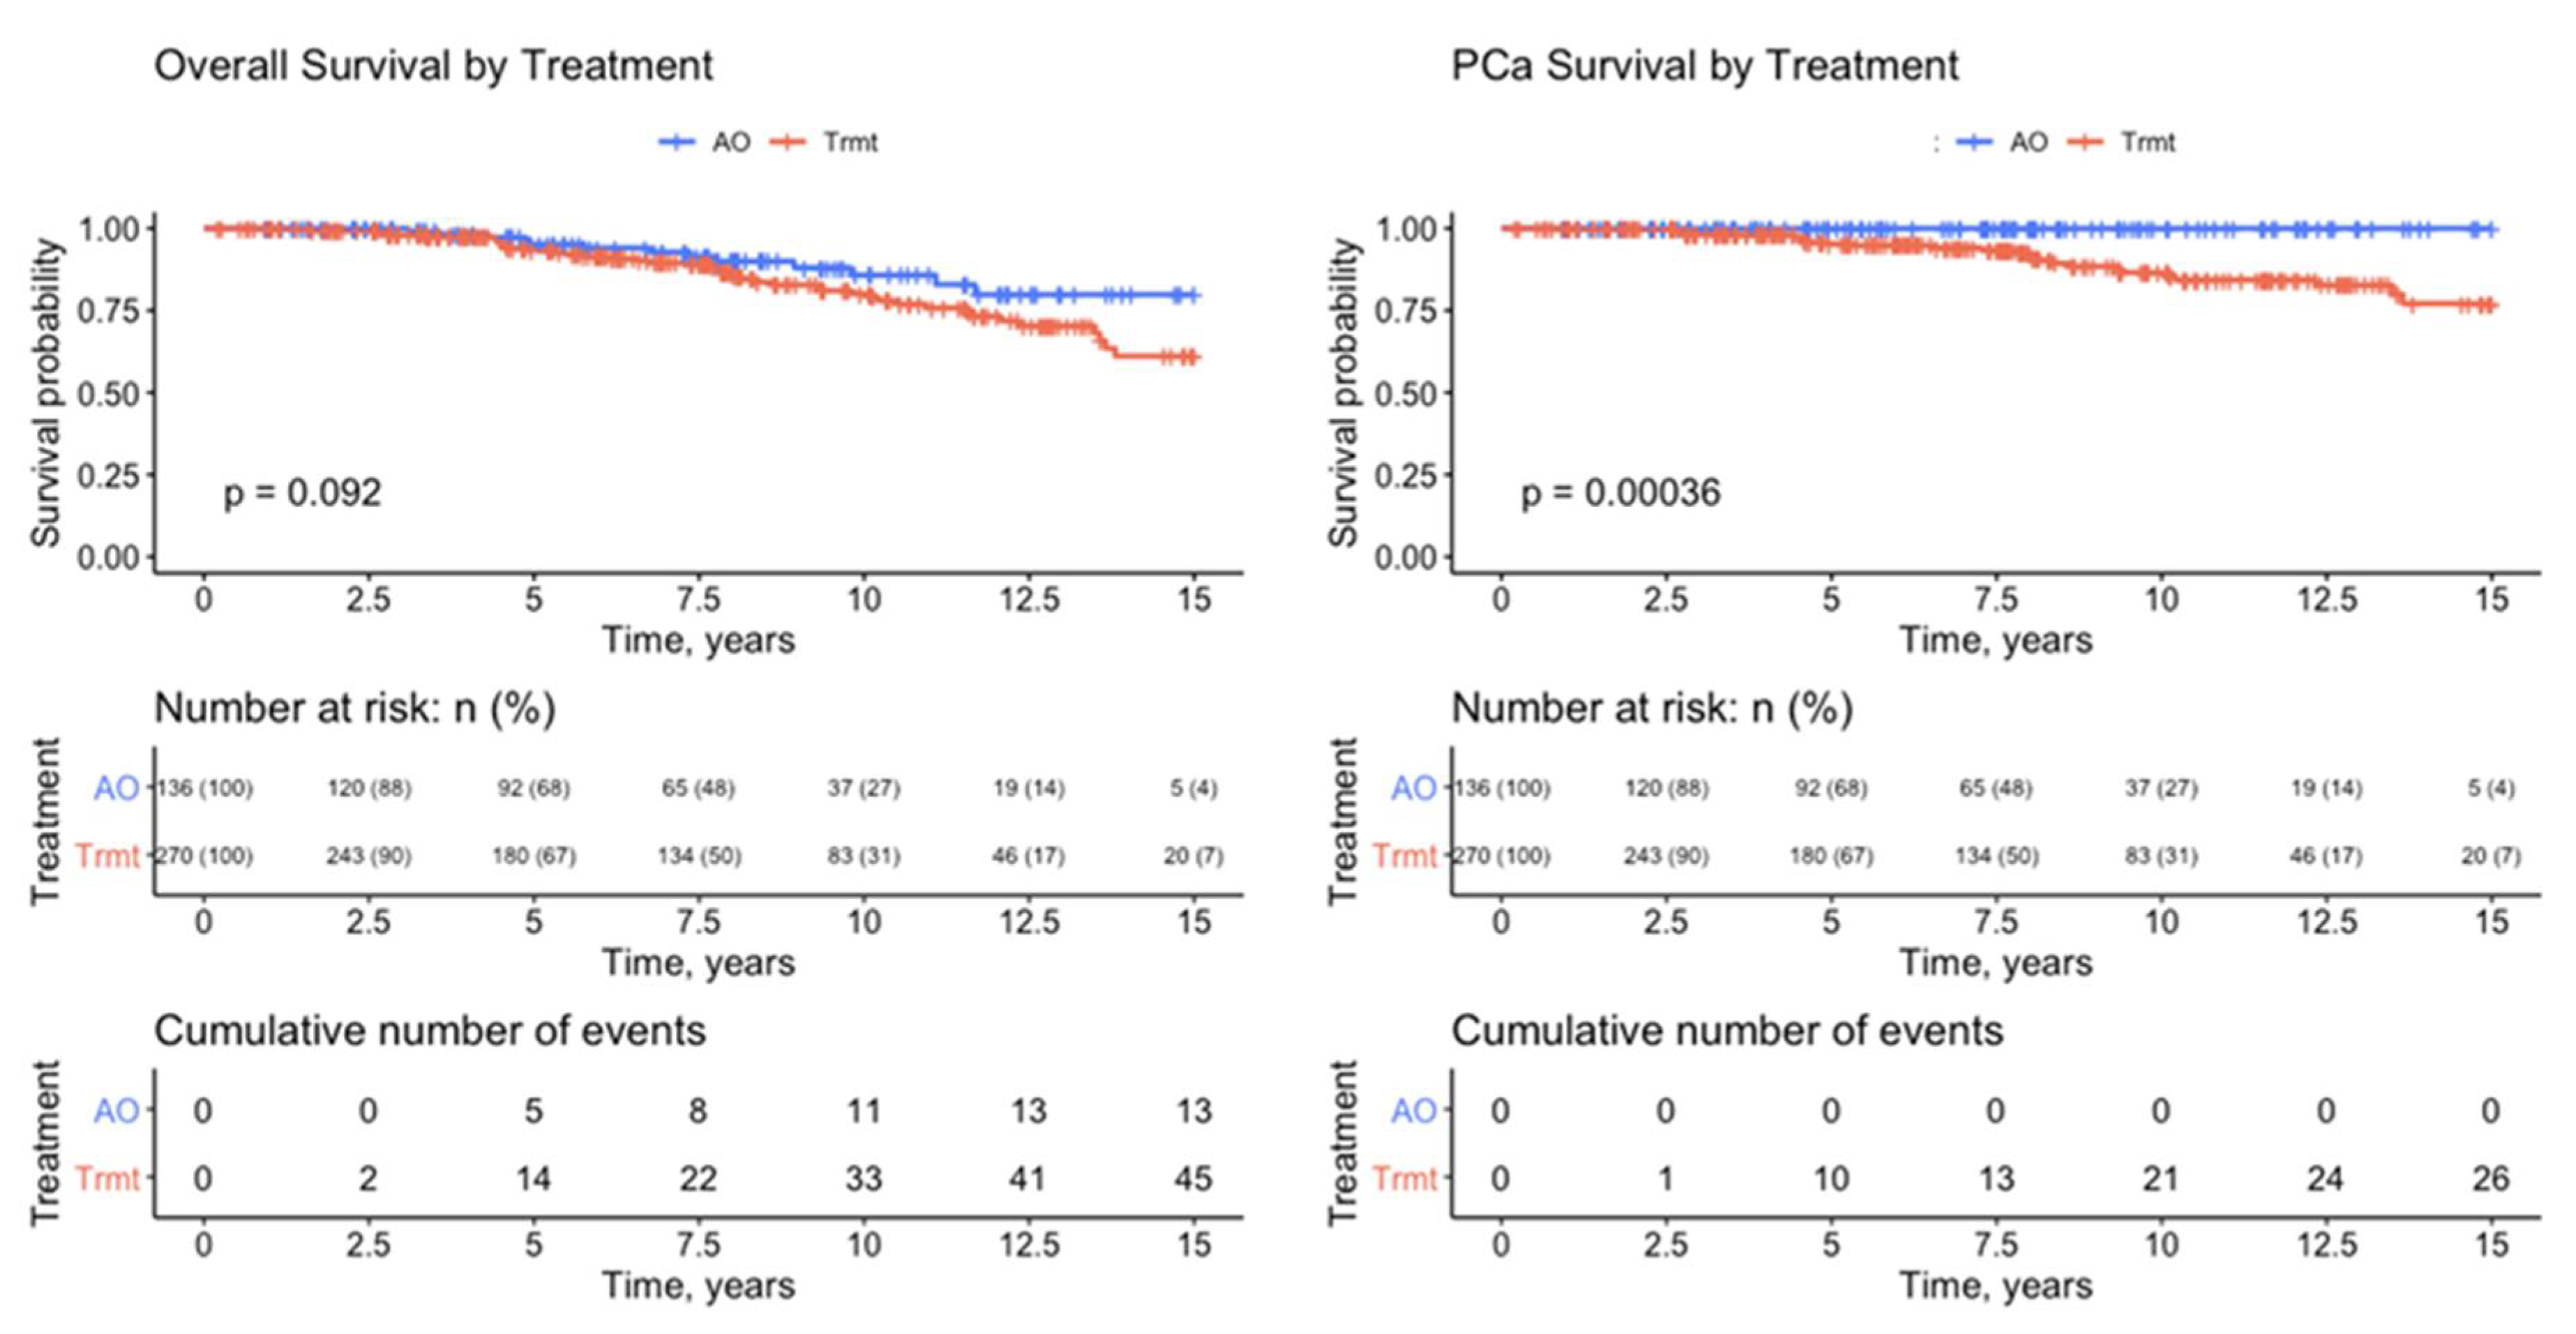
| PCSM | 0 (0.0%) | 29 (10.7%) | 29 (7.1%) | <0.001 |
| Dead | 13 (9.6%) | 50 (18.5%) | 63 (15.5%) | 0.019 |
| Outcome: No Treatment | |||
|---|---|---|---|
| A. Univariate Model | References | Estimated OR (95% CI) | p-value |
| PSADT binary | >12 months vs. <12 months [ref] | 8.79 (4.92, 15.71) | <0.001 |
| DT pattern | Increasing vs. decreasing [ref] | 6.08 (3.48, 10.62) | <0.001 |
| GGG | 4–5 vs. 1–3 [ref] | 0.29 (0.17, 0.52) | 0.04 |
| Preoperative PSA (continuous) | 0.95 (0.91, 0.99) | 0.204 | |
| P-stage | pT3/4 vs. pT2 [ref] | 0.63 (0.38, 1.05) | 0.639 |
| Age (continuous) | 0.9873 (0.9518, 1.0242) | 0.985 | |
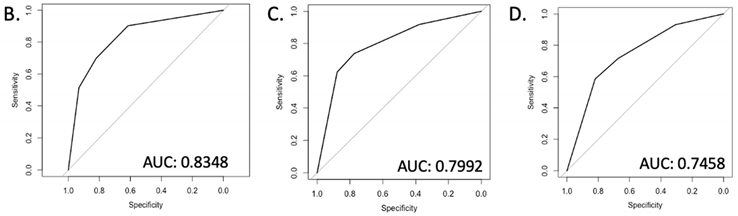
| B. Full Multivariate Final Model | Estimated OR (95% CI) | p-value | |
| PSADT binary | >12 months vs. <12 months [ref] | 8.93 (4.53, 17.6) | <0.001 |
| DT Pattern | Increasing vs. decreasing [ref] | 5.49 (2.81, 10.71) | <0.001 |
| C. PSADT Binary-Only Model | Estimated OR (95% CI) | p-value | |
| PSADT binary | >12 months vs. <12 months [ref] | 8.74 (5, 15.28) | <0.001 |
| D. DT Pattern-Only Model | Estimated OR (95% CI) | p-value | |
| DT pattern | Increasing vs. decreasing [ref] | 5 (2.95, 8.48) | <0.001 |
 | |||
Publisher’s Note: MDPI stays neutral with regard to jurisdictional claims in published maps and institutional affiliations. |
© 2022 by the authors. Licensee MDPI, Basel, Switzerland. This article is an open access article distributed under the terms and conditions of the Creative Commons Attribution (CC BY) license (https://creativecommons.org/licenses/by/4.0/).
Share and Cite
Huang, E.; Tran, J.; Huynh, L.M.; Skarecky, D.; Wilson, R.H.; Ahlering, T. Prostate-Specific Antigen Doubling Time Kinetics following Radical Prostatectomy to Guide Need for Treatment Intervention: Validation of Low-Risk Recurrences. Cancers 2022, 14, 4087. https://doi.org/10.3390/cancers14174087
Huang E, Tran J, Huynh LM, Skarecky D, Wilson RH, Ahlering T. Prostate-Specific Antigen Doubling Time Kinetics following Radical Prostatectomy to Guide Need for Treatment Intervention: Validation of Low-Risk Recurrences. Cancers. 2022; 14(17):4087. https://doi.org/10.3390/cancers14174087
Chicago/Turabian StyleHuang, Erica, Joshua Tran, Linda My Huynh, Douglas Skarecky, Robert H. Wilson, and Thomas Ahlering. 2022. "Prostate-Specific Antigen Doubling Time Kinetics following Radical Prostatectomy to Guide Need for Treatment Intervention: Validation of Low-Risk Recurrences" Cancers 14, no. 17: 4087. https://doi.org/10.3390/cancers14174087