
The Impact of the Hippo Pathway and Cell Metabolism on Pathological Complete Response in Locally Advanced Her2+ Breast Cancer: The TRISKELE Multicenter Prospective Study
 , , , , , and add
Show full author list
, , , , , and add
Show full author list
Abstract
:Simple Summary
Abstract
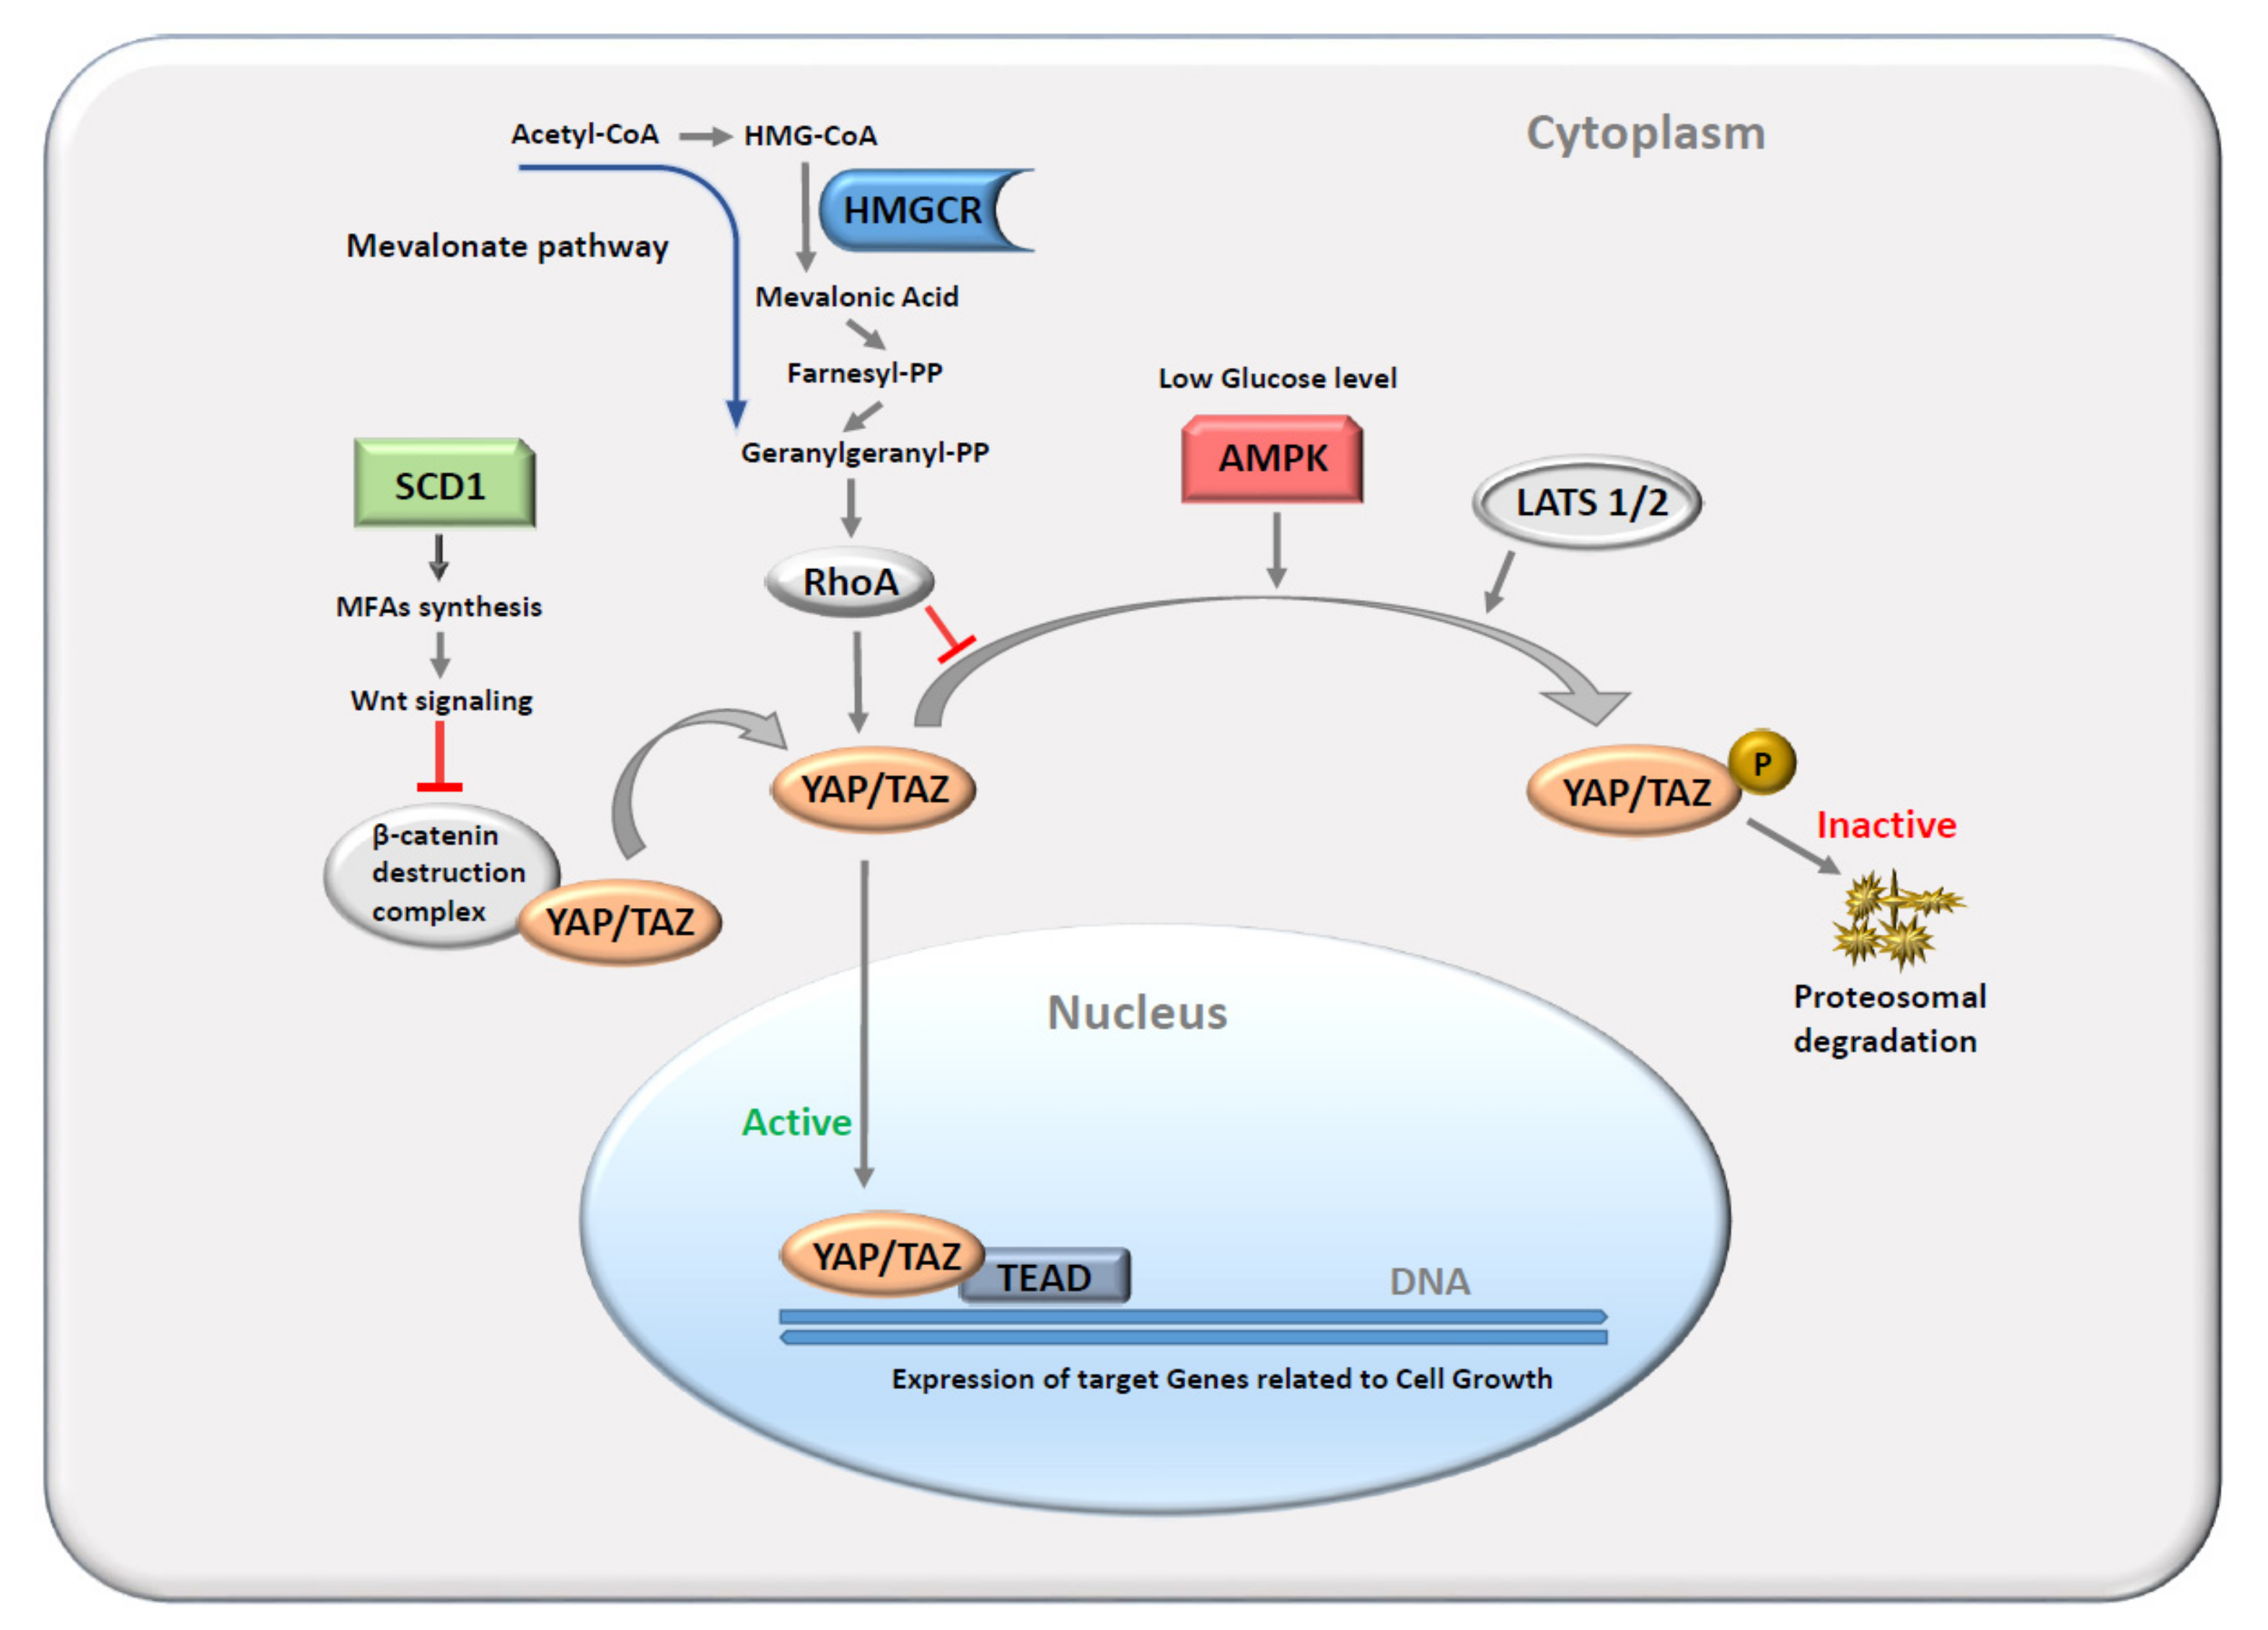
1. Introduction
2. Methods
2.1. Study Participants and Procedures
2.2. Statistical Analysis and Data Visualization
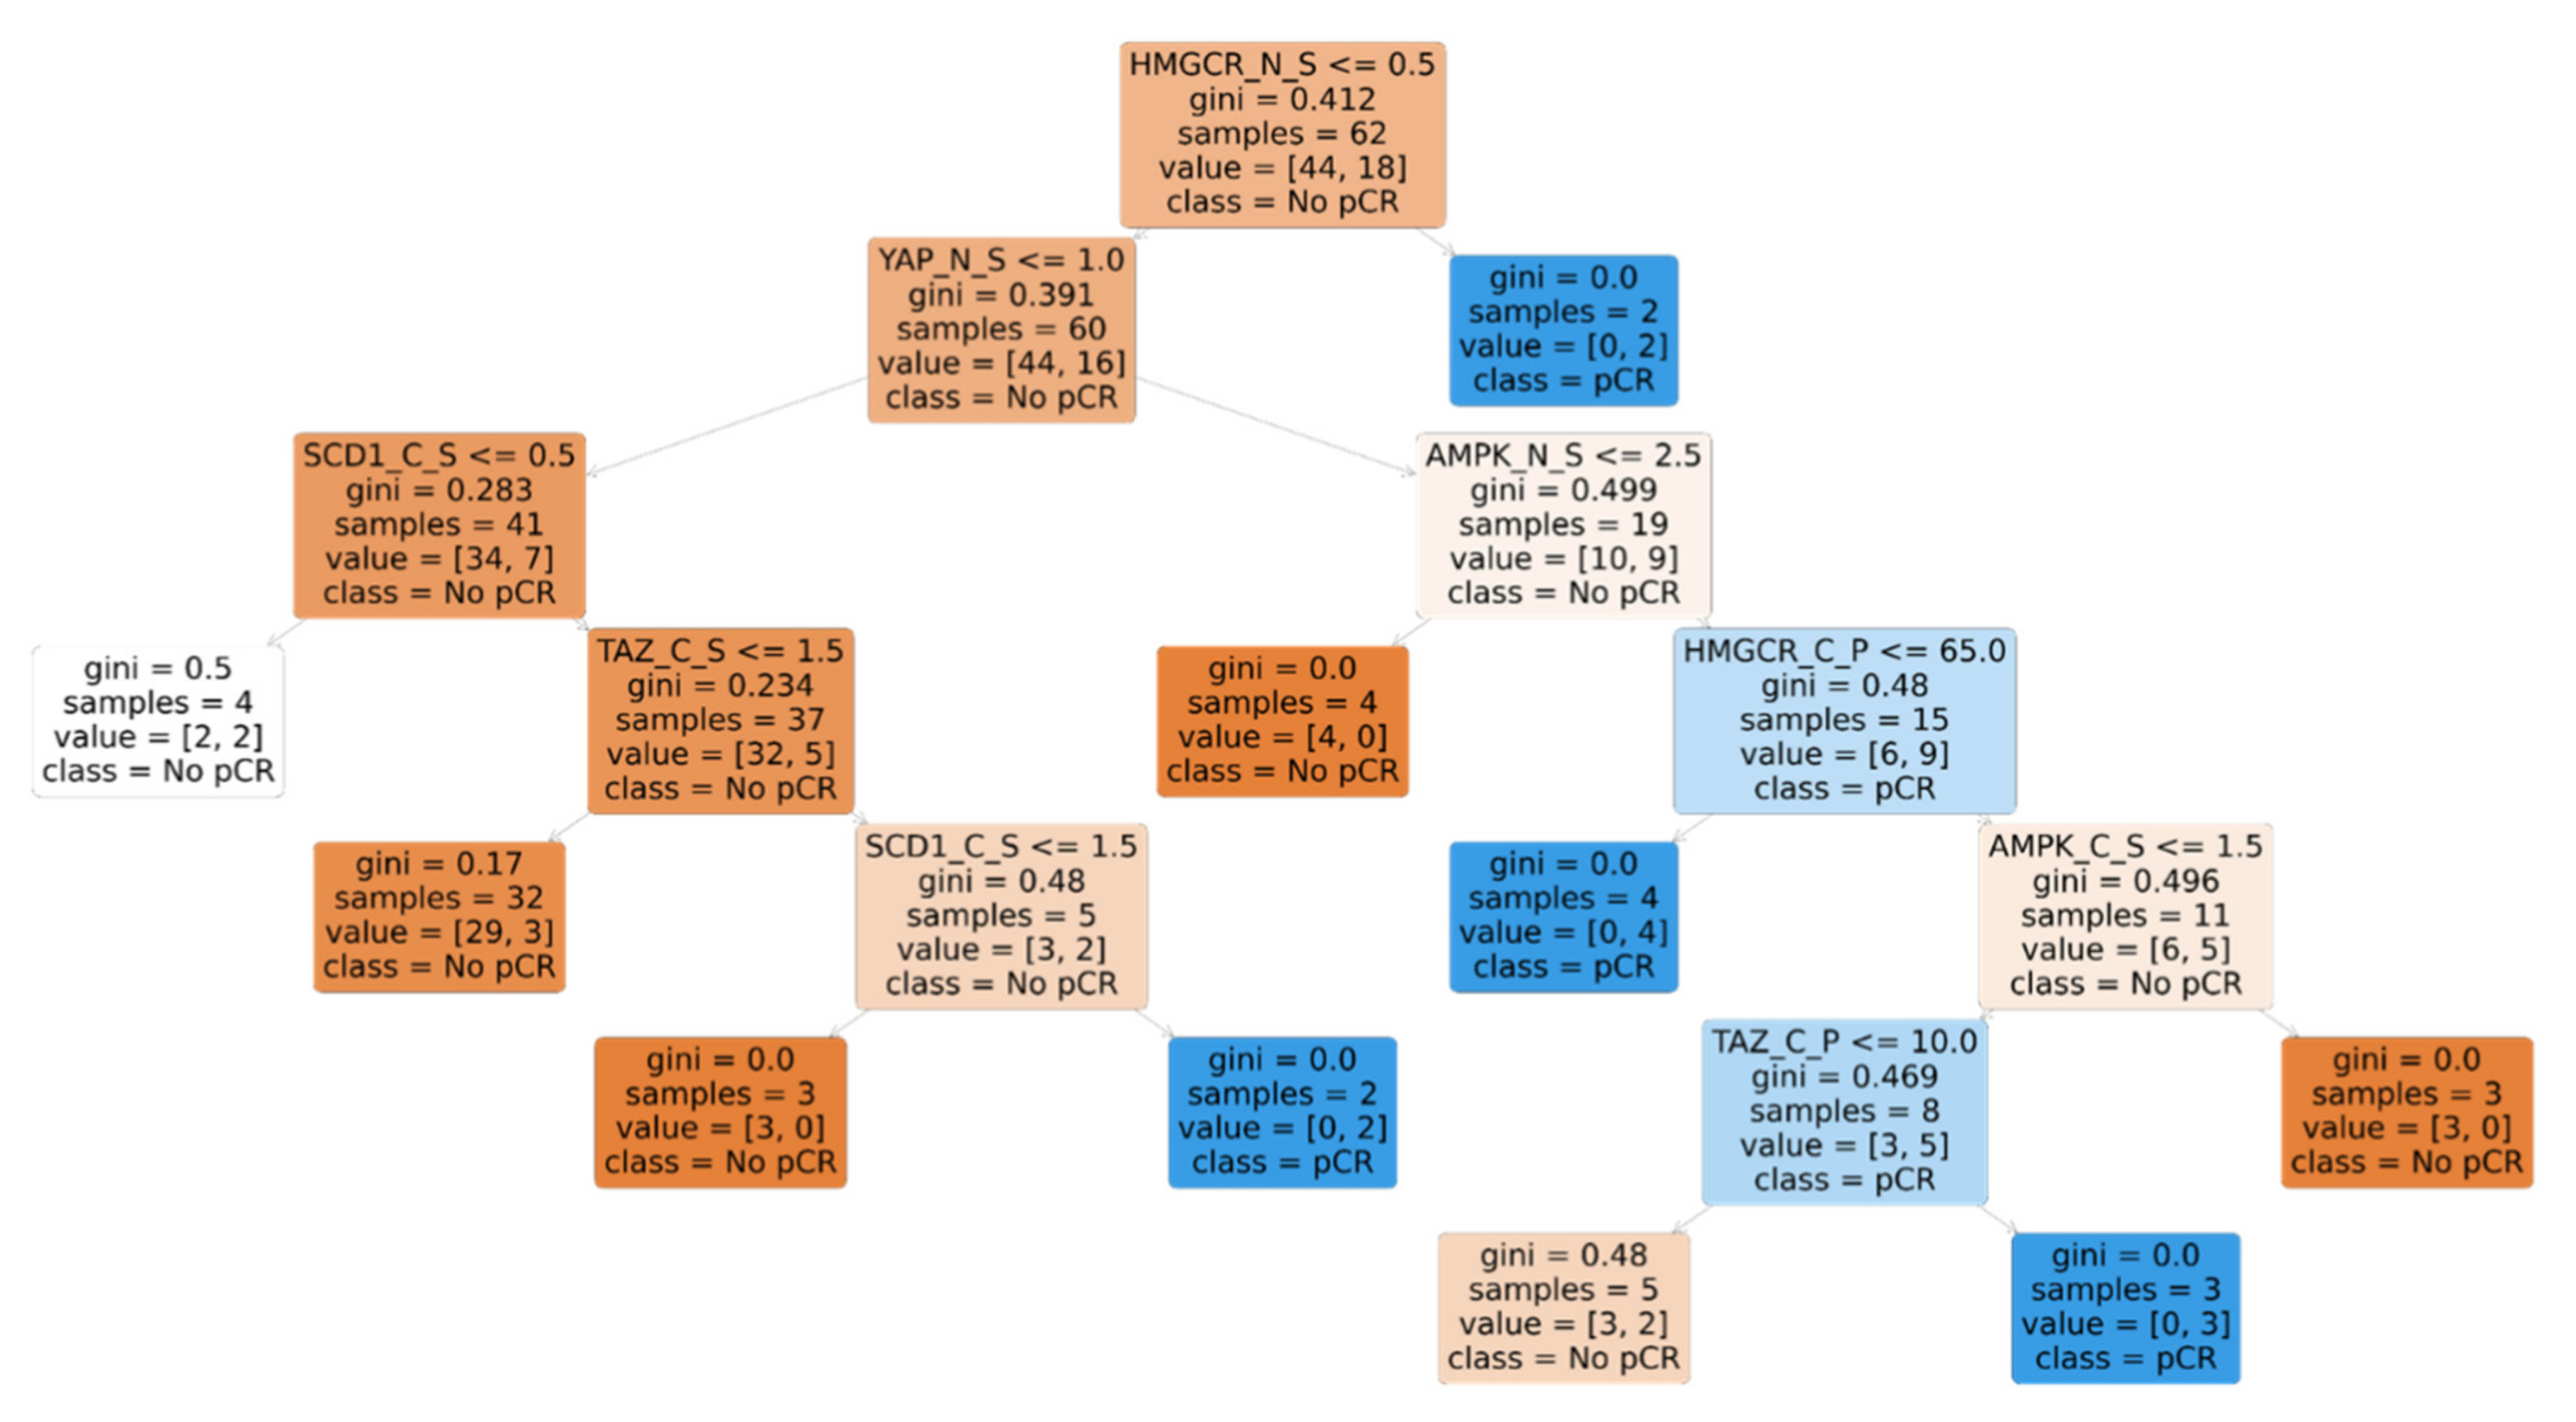
2.3. Machine Learning Algorithm
2.4. TCGA Validation Using Survival Outcomes of Breast Cancer Patients
3. Results
3.1. Clinical Characteristics and Outcomes
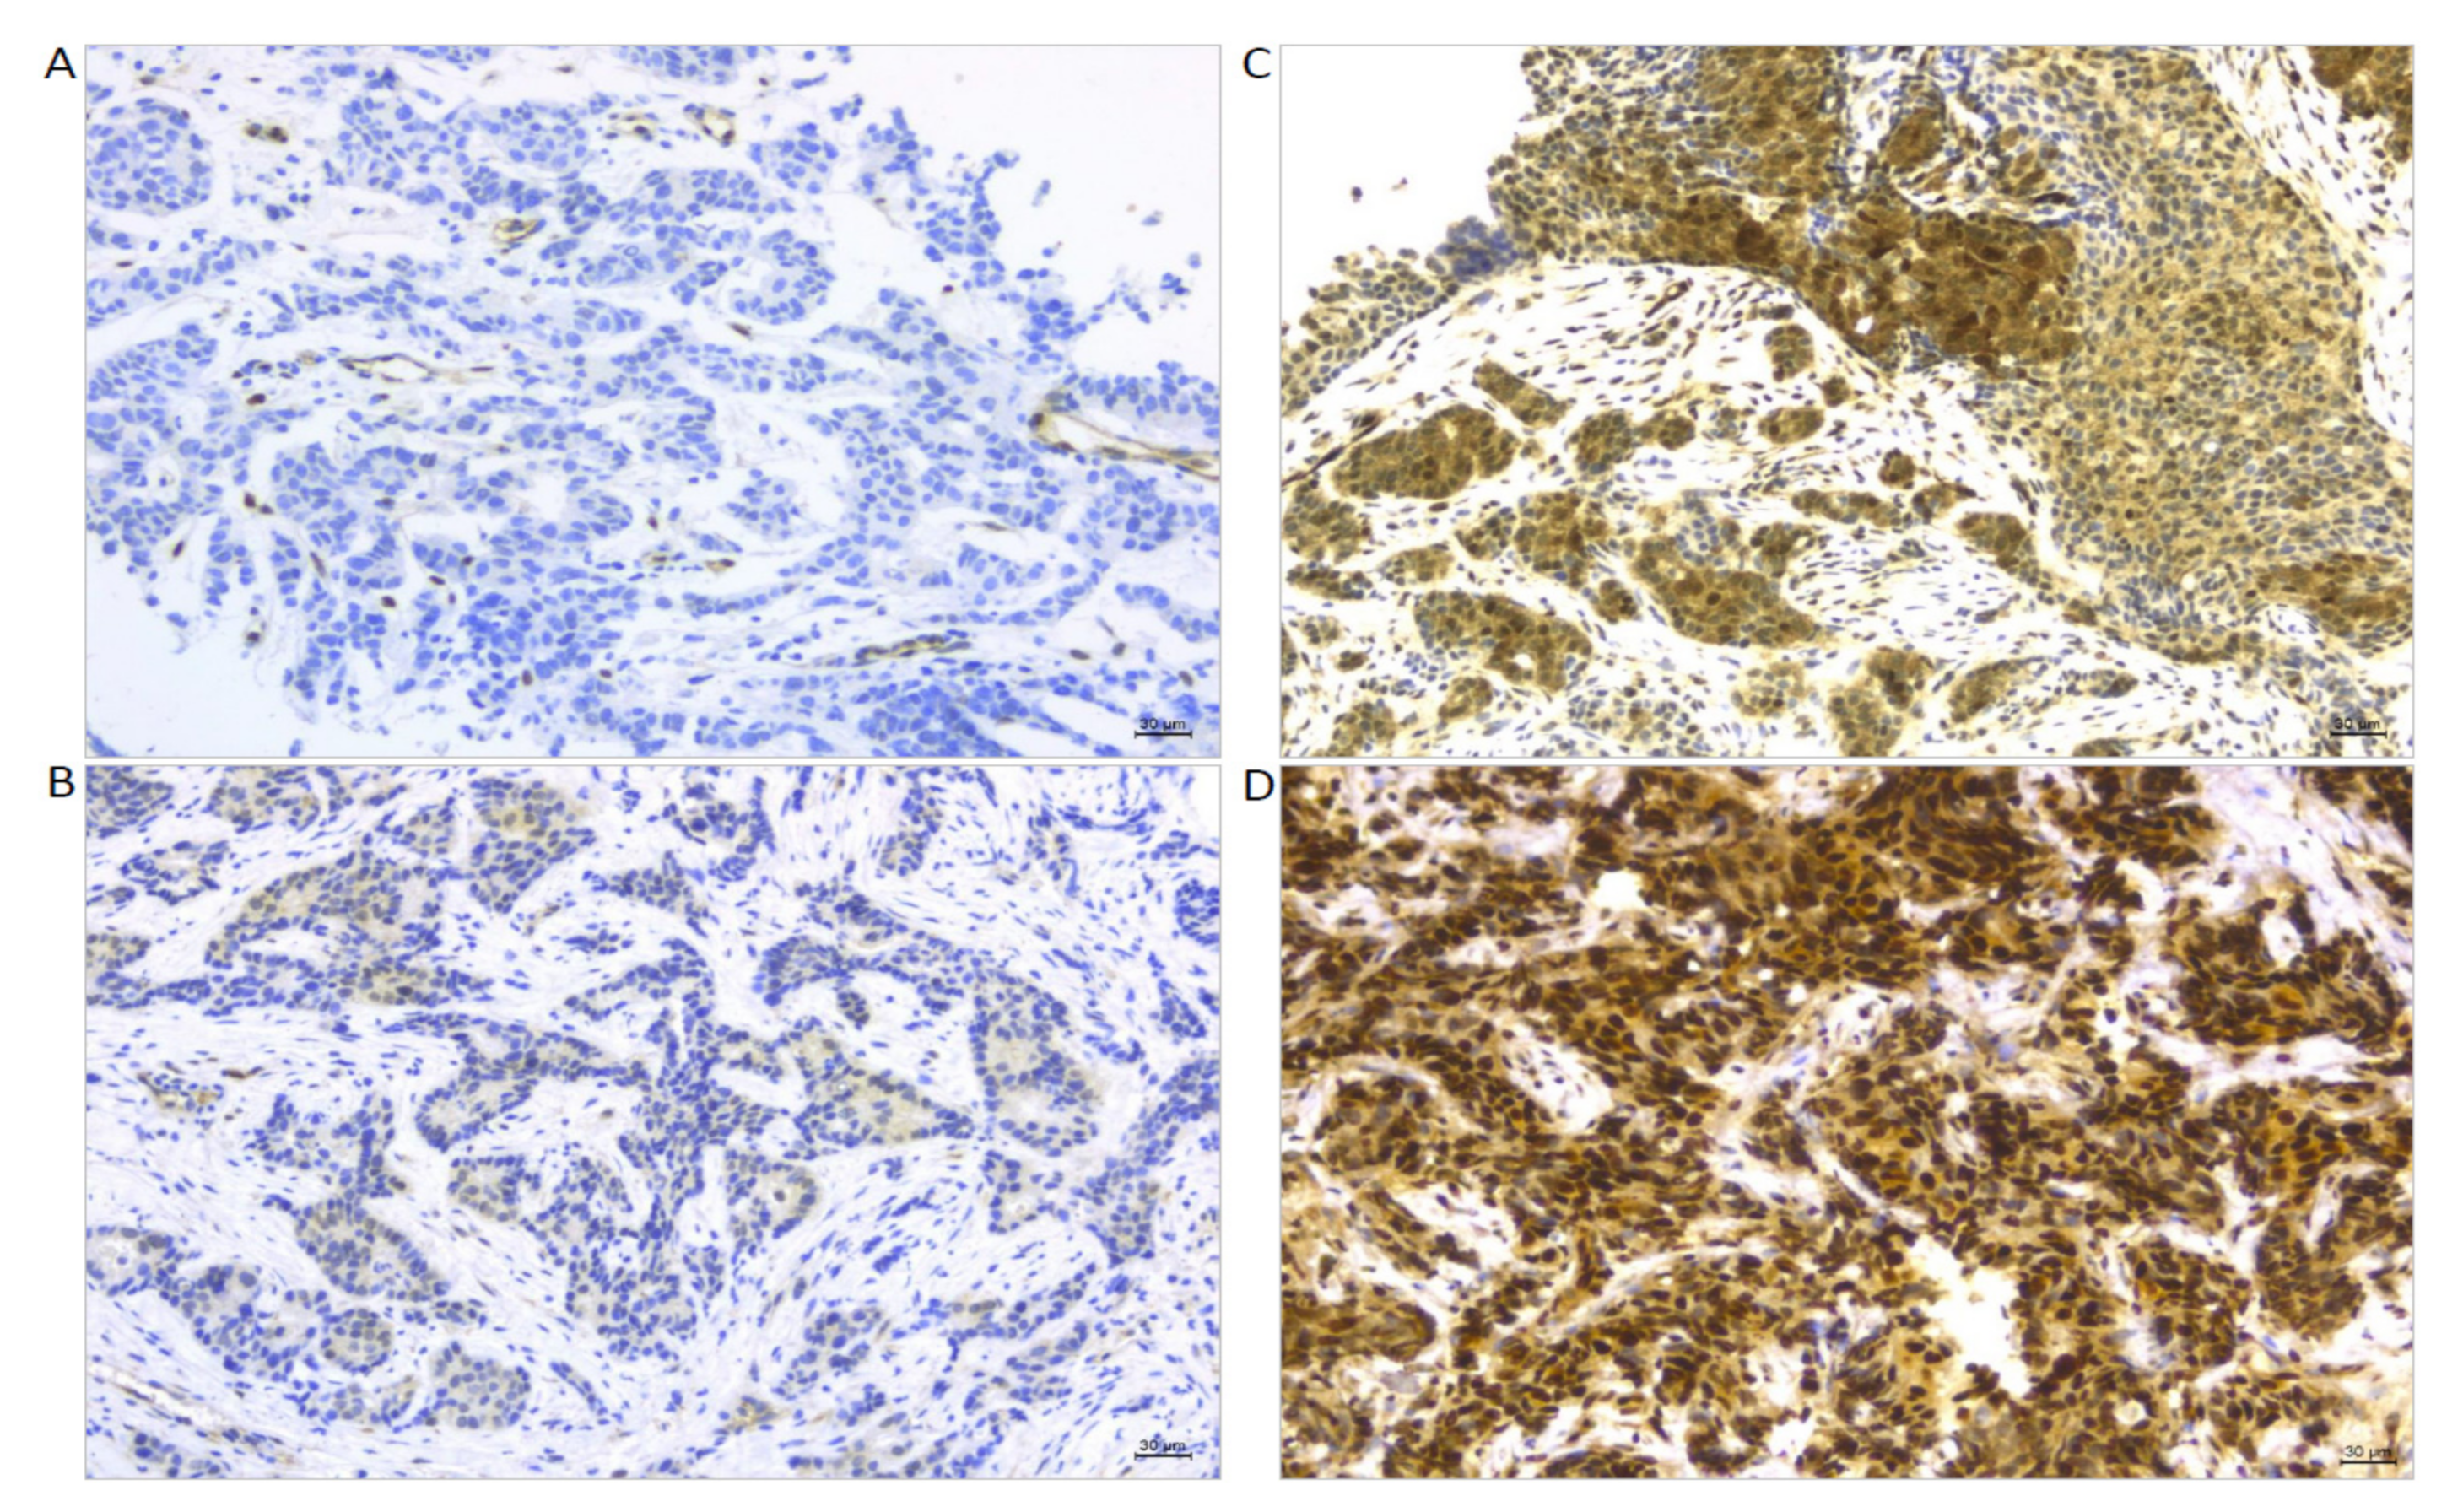
3.2. Expression and Associations between Target Protein Biomarkers (TAZ, YAP, AMPK, HMGCR, and SCD1)
3.3. Associations between Clinical–Pathological Features and Target Protein Biomarkers (TAZ, YAP, AMPK, HMGCR, and SCD1)
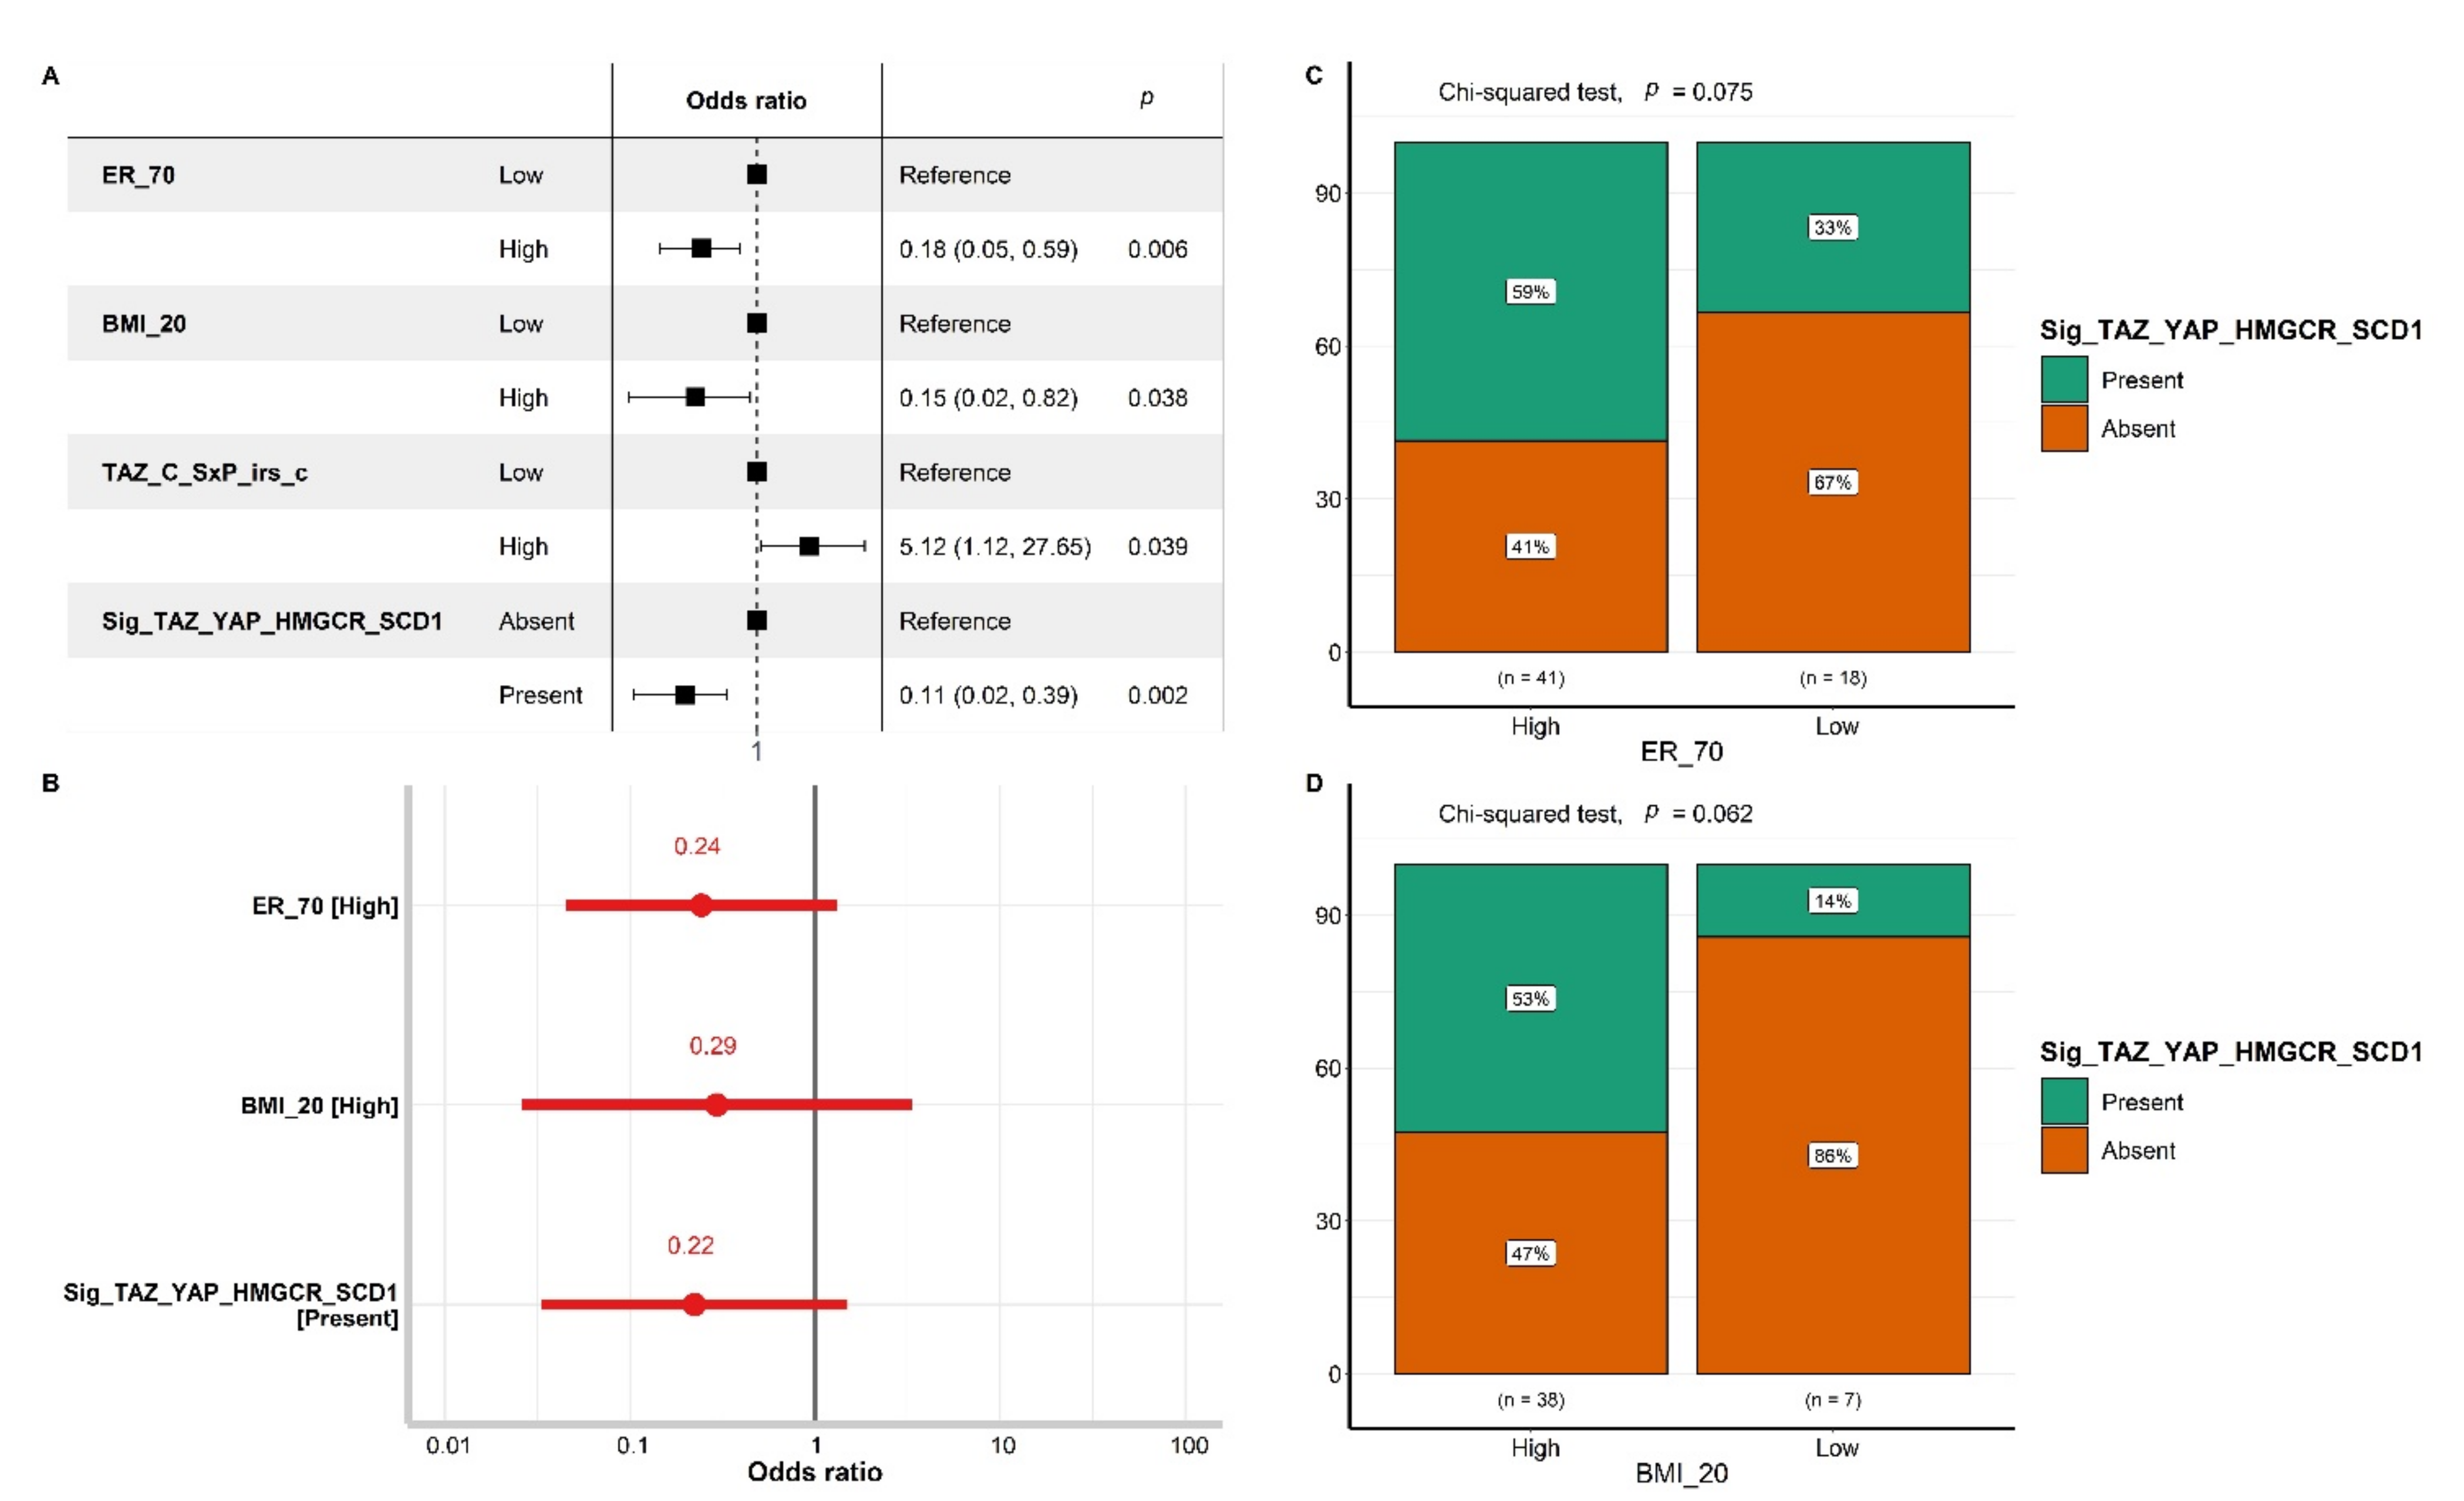
3.4. The Impact of Biomarker Expression on pCR
3.5. Machine Learning-Based Discovery of Biomarker Signatures Predictive of pCR
3.6. Testing Our Signature in the TCGA Cohort for Validation in Terms of Survival Outcomes
4. Discussion
5. Conclusions
Supplementary Materials
Author Contributions
Funding
Institutional Review Board Statement
Informed Consent Statement
Data Availability Statement
Acknowledgments
Conflicts of Interest
Appendix A
| _N | Nuclear |
| _C | Cytoplasmic |
| _S | Immunoreaction intensity score |
| _P | Percentage of cells stained |
| _SxP | Multiplication of immunoreaction intensity score with percentage of cells stained |
| _SxP_irs | International immunoreactive score |
| _SxP_irs_c | Categorized international immunoreactive score |
References
- Zhao, B.; Tumaneng, K.; Guan, K.L. The Hippo pathway in organ size control, tissue regeneration and stem cell self-renewal. Nat. Cell Biol. 2011, 13, 877–883. [Google Scholar] [CrossRef] [PubMed] [Green Version]
- Dey, A.; Varelas, X.; Guan, K.L. Targeting the Hippo pathway in cancer, fibrosis, wound healing and regenerative medicine. Nat. Rev. Drug Discov. 2020, 19, 480–494. [Google Scholar] [CrossRef] [PubMed]
- Qiao, Y.; Li, T.; Zheng, S.; Wang, H. The Hippo pathway as a drug target in gastric cancer. Cancer Lett. 2018, 420, 14–25. [Google Scholar] [CrossRef] [PubMed]
- Zanconato, F.; Cordenonsi, M.; Piccolo, S. YAP/TAZ at the Roots of Cancer. Cancer Cell 2016, 29, 783–803. [Google Scholar] [CrossRef] [PubMed] [Green Version]
- Cheung, P.; Xiol, J.; Dill, M.T.; Yuan, W.C.; Panero, R.; Roper, J.; Osorio, F.G.; Maglic, D.; Li, Q.; Gurung, B.; et al. Regenerative Reprogramming of the Intestinal Stem Cell State via Hippo Signaling Suppresses Metastatic Colorectal Cancer. Cell Stem Cell 2020, 27, 590–604. [Google Scholar] [CrossRef] [PubMed]
- Pearson, J.D.; Huang, K.; Pacal, M.; McCurdy, S.R.; Lu, S.; Aubry, A.; Yu, T.; Wadosky, K.M.; Zhang, L.; Wang, T.; et al. Binary pan-cancer classes with distinct vulnerabilities defined by pro- or anti-cancer YAP/TEAD activity. Cancer Cell 2021, 39, 1115–1134. [Google Scholar] [CrossRef] [PubMed]
- Hyun, K.J.; Kun-Liang, G. Interplay between YAP/TAZ and Metabolism. Cell Metab. 2018, 28, 196–206. [Google Scholar] [CrossRef] [Green Version]
- Harvey, K.F.; Pfleger, C.M.; Hariharan, I.K. The Drosophila Mstortholog, hippo, restricts growth and cell proliferation and promotes apoptosis. Cell 2003, 114, 457–467. [Google Scholar] [CrossRef] [Green Version]
- Jia, J.; Zhang, W.; Wang, B.; Trinko, R.; Jiang, J. The Drosophila Ste20 family kinase dMST functions as a tumor suppressor by restricting cell proliferation and promoting apoptosis. Genes Dev. 2003, 17, 2514–2519. [Google Scholar] [CrossRef] [Green Version]
- Justice, R.W.; Zilian, O.; Woods, D.F.; Noll, M.; Bryant, P.J. The Drosophila tumor suppressor gene warts encodes a homolog of human myotonic dystrophy kinase and is required for the control of cell shape and proliferation. Genes Dev. 1995, 9, 534–546. [Google Scholar] [CrossRef]
- Kango-Singh, M.; Nolo, R.; Tao, C.; Verstreken, P.; Hiesinger, P.R.; Bellen, H.J.; Halder, G. Shar-pei mediates cell proliferation arrest during imaginal disc growth in Drosophila. Development 2002, 129, 5719–5730. [Google Scholar] [CrossRef] [Green Version]
- Pantalacci, S.; Tapon, N.; Léopold, P. The Salvador partner Hippo promotes apoptosis and cell-cycle exit in Drosophila. Nat. Cell Biol. 2003, 5, 921–927. [Google Scholar] [CrossRef]
- Tapon, N.; Harvey, K.F.; Bell, D.W.; Wahrer, D.C.R.; Schiripo, T.A.; Haber, D.; Hariharan, I.K. Salvador Promotes both cell cycle exit and apoptosis in Drosophila and is mutated in human cancer cell lines. Cell 2002, 110, 467–478. [Google Scholar] [CrossRef] [Green Version]
- Udan, R.S.; Kango-Singh, M.; Nolo, R.; Tao, C.; Halder, G. Hippo promotes proliferation arrest and apoptosis in the Salvador/Warts pathway. Nat. Cell Biol. 2003, 5, 914–920. [Google Scholar] [CrossRef]
- Wu, S.; Huang, J.; Dong, J.; Pan, D. Hippo encodes a Ste-20 family protein kinase that restricts cell proliferation and promotes apoptosis in conjunction with salvador and warts. Cell 2003, 114, 445–456. [Google Scholar] [CrossRef] [Green Version]
- Xu, T.; Wang, W.; Zhang, S.; Stewart, R.A.; Yu, W. Identifying tumor suppressors in genetic mosaics: The Drosophila lats gene encodes a putative protein kinase. Development 1995, 121, 1053–1063. [Google Scholar] [CrossRef]
- Dong, J.; Feldmann, G.; Huang, J.; Wu, S.; Zhang, N.; Comerford, S.A.; Gayyed, M.F.; Anders, R.A.; Maitra, A.; Pan, D. Elucidation of a universal size-control mechanism in Drosophila and mammals. Cell 2007, 130, 1120–1133. [Google Scholar] [CrossRef] [Green Version]
- Zhao, B.; Wei, X.; Li, W.; Udan, R.S.; Yang, Q.; Kim, J.; Xie, J.; Ikenoue, T.; Yu, J.; Li, L.; et al. Inactivation of YAP oncoprotein by the Hippo pathway is involved in cell contact inhibition and tissue growth control. Genes Dev. 2007, 21, 2747–2761. [Google Scholar] [CrossRef] [Green Version]
- Liu, C.Y.; Lv, X.; Li, T.; Xu, Y.; Zhou, X.; Zhao, S.; Xiong, Y.; Lei, Q.Y.; Guan, K.L. PP1 cooperates with ASPP2 to dephosphorylate and activate TAZ. J. Biol. Chem. 2011, 286, 5558–5566. [Google Scholar] [CrossRef] [Green Version]
- Wang, P.; Bai, Y.; Song, B.; Wang, Y.; Liu, D.; Lai, Y.; Bi, X.; Yuan, Z. PP1A-mediated dephosphorylation positively regulates YAP2 activity. PLoS ONE 2011, 6, 24288. [Google Scholar] [CrossRef]
- Liu, C.Y.; Zha, Z.Y.; Zhou, X.; Zhang, H.; Huang, W.; Zhao, D.; Li, T.; Chan, S.W.; Lim, C.J.; Hong, W.; et al. The hippo tumor pathway promotes TAZ degradation by phosphorylating a phosphodegron and recruiting the SCFβ-TrCP E3 ligase. J. Biol. Chem. 2010, 285, 37159–37169. [Google Scholar] [CrossRef] [Green Version]
- Zhao, B.; Li, L.; Tumaneng, K.; Wang, C.Y.; Guan, K.L. A coordinated phosphorylation by Lats and CK1 regulates YAP stability through SCF(β-TRCP). Genes Dev. 2010, 24, 72–85. [Google Scholar] [CrossRef] [Green Version]
- Johnson, R.; Halder, G. The two faces of Hippo: Targeting the Hippo pathway for regenerative medicine and cancer treatment. Nat. Rev. Drug. Discov. 2014, 13, 63–79. [Google Scholar] [CrossRef] [Green Version]
- Yu, F.X.; Zhao, B.; Guan, K.L. Hippo pathway in organ size control, tissue homeostasis, and cancer. Cell 2015, 163, 811–828. [Google Scholar] [CrossRef] [Green Version]
- Zhang, X.; Milton, C.C.; Humbert, P.O.; Harvey, K.F. Transcriptional output of the Salvador/warts/hippo pathway is controlled in distinct fashions in Drosophila melanogaster and mammalian cell lines. Cancer Res. 2009, 69, 6033–6041. [Google Scholar] [CrossRef] [Green Version]
- Van Rensburg, H.J.J.; Yang, X. The roles of the Hippo pathway in cancer metastasis. Cell. Signal. 2016, 28, 1761–1772. [Google Scholar] [CrossRef]
- Pei, T.; Li, Y.; Wang, J.; Wang, H.; Liang, Y.; Shi, H.; Sun, B.; Yin, D.; Sun, J.; Song, R.; et al. YAP is a critical oncogene in human cholangiocarcinoma. Oncotarget 2015, 6, 17206–17220. [Google Scholar] [CrossRef] [Green Version]
- Liang, N.; Zhang, C.; Dill, P.; Panasyuk, G.; Pion, D.; Koka, V.; Gallazzini, M.; Olson, E.N.; Lam, H.; Henske, E.P.; et al. Regulation of YAP by mTOR and autophagy reveals a therapeutic target of tuberous sclerosis complex. J. Exp. Med. 2014, 211, 2249–2263. [Google Scholar] [CrossRef]
- Mo, J.S.; Meng, Z.; Kim, Y.C.; Park, H.W.; Hansen, C.G.; Kim, S.; Lim, D.S.; Guan, K.L. Cellular energy stress induces AMPK-mediated regulation of YAP and the Hippo pathway. Nat. Cell Biol. 2015, 17, 500–510. [Google Scholar] [CrossRef]
- Wang, W.; Xiao, Z.D.; Li, X.; Aziz, K.E.; Gan, B.; Johnson, R.L.; Chen, J. AMPK modulates Hippo pathway activity to regulate energy homeostasis. Nat. Cell Biol. 2015, 17, 490–499. [Google Scholar] [CrossRef]
- Noto, A.; De Vitis, C.; Pisanu, M.E.; Roscilli, G.; Ricci, G.; Catizone, A.; Sorrentino, G.; Chianese, G.; Taglialatela-Scafati, O.; Trisciuoglio, D.; et al. Stearoyl-CoA-desaturase 1 regulates lung cancer stemness via stabilization and nuclear localization of YAP/TAZ. Oncogene 2017, 36, 4573–4584. [Google Scholar] [CrossRef] [PubMed]
- Sorrentino, G.; Ruggeri, N.; Specchia, V.; Cordenonsi, M.; Mano, M.; Dupont, S.; Manfrin, A.; Ingallina, E.; Sommaggio, R.; Piazza, S.; et al. Metabolic control of YAP and TAZ by the mevalonate pathway. Nat. Cell Biol. 2014, 16, 357–366. [Google Scholar] [CrossRef] [PubMed]
- Wang, Z.; Wu, Y.; Wang, H.; Zhang, Y.; Mei, L.; Fang, X.; Zhang, X.; Zhang, F.; Chen, H.; Liu, Y.; et al. Interplay of mevalonate and Hippo pathways regulates RHAMM transcription via YAP to modulate breast cancer cell motility. Proc. Natl. Acad. Sci. USA 2014, 111, E89–E98. [Google Scholar] [CrossRef] [PubMed] [Green Version]
- Mi, W.; Lin, Q.; Childress, C.; Sudol, M.; Robishaw, J.; Berlot, C.H.; Shabahang, M.; Yang, W. Geranylgeranylation signals to the Hippo pathway for breast cancer cell proliferation and migration. Oncogene 2015, 34, 3095–3106. [Google Scholar] [CrossRef] [PubMed]
- Plouffe, S.W.; Meng, Z.; Lin, K.C.; Lin, B.; Hong, A.W.; Chun, J.V.; Guan, K.L. Characterization of Hippo Pathway Components by Gene Inactivation. Mol. Cell 2016, 64, 993–1008. [Google Scholar] [CrossRef] [PubMed] [Green Version]
- He, Z.; Li, R.; Jiang, H. Mutations and Copy Number Abnormalities of Hippo Pathway Components in Human Cancers. Front. Cell Dev. Biol. 2021, 9, 661718. [Google Scholar] [CrossRef]
- Cordenonsi, M.; Zanconato, F.; Azzolin, L.; Forcato, M.; Rosato, A.; Frasson, C.; Inui, M.; Montagner, M.; Parenti, A.R.; Poletti, A.; et al. The Hippo transducer TAZ confers cancer stem. cell-related traits on breast cancer cells. Cell 2011, 147, 759–772. [Google Scholar] [CrossRef]
- Bartucci, M.; Dattilo, R.; Moriconi, M.; Pagliuca, A.; Mottolese, M.; Federici, G.; Di Benedetto, A.; Todaro, M.; Stassi, G.; Sperati, F.; et al. TAZ is required for metastatic activity and chemoresistance of breast cancer stem cells. Oncogene 2015, 34, 681–690. [Google Scholar] [CrossRef]
- Maugeri-Saccà, M.; Vigneri, P.; De Maria, R. Cancer stem cells and chemosensitivity. Clin. Cancer Res. 2011, 17, 4942–4947. [Google Scholar] [CrossRef] [Green Version]
- Di Benedetto, A.; Mottolese, M.; Sperati, F.; Ercolani, C.; Di Lauro, L.; Pizzuti, L.; Vici, P.; Terrenato, I.; Shaaban, A.M.; Sundara-Rajan, S.; et al. HMG-CoAR expression in male breast cancer: Relationship with hormone receptors, Hippo transducers and survival outcomes. Sci. Rep. 2016, 6, 35121. [Google Scholar] [CrossRef]
- Buglioni, S.; Vici, P.; Sergi, D.; Pizzuti, L.; Di Lauro, L.; Antoniani, B.; Sperati, F.; Terrenato, I.; Carosi, M.; Gamucci, T.; et al. Analysis of the hippo transducers TAZ and YAP in cervical cancer and its microenvironment. Oncoimmunology 2016, 5, e1160187. [Google Scholar] [CrossRef] [Green Version]
- Ercolani, C.; Di Benedetto, A.; Terrenato, I.; Pizzuti, L.; Di Lauro, L.; Sergi, D.; Sperati, F.; Buglioni, S.; Ramieri, M.T.; Mentuccia, L.; et al. Expression of phosphorylated Hippo pathway kinases (MST1/2 and LATS1/2) in HER2-positive and triple-negative breast cancer patients treated with neoadjuvant therapy. Cancer Biol. Ther. 2017, 18, 339–346. [Google Scholar] [CrossRef]
- Melucci, E.; Casini, B.; Ronchetti, L.; Pizzuti, L.; Sperati, F.; Pallocca, M.; De Nicola, F.; Goeman, F.; Gallo, E.; Amoreo, C.A.; et al. Expression of the Hippo transducer TAZ in association with WNT pathway mutations impacts survival outcomes in advanced gastric cancer patients treated with first-line chemotherapy. J. Transl. Med. 2018, 16, 22. [Google Scholar] [CrossRef] [Green Version]
- Di Benedetto, A.; Mottolese, M.; Sperati, F.; Ercolani, C.; Di Lauro, L.; Pizzuti, L.; Vici, P.; Terrenato, I.; Sperduti, I.; Shaaban, A.M.; et al. The Hippo transducers TAZ/YAP and their target CTGF in male breast cancer. Oncotarget 2016, 7, 43188–43198. [Google Scholar] [CrossRef] [Green Version]
- Goeman, F.; De Nicola, F.; Amoreo, C.A.; Scalera, S.; Marinelli, D.; Sperati, F.; Mazzotta, M.; Terrenato, I.; Pallocca, M.; Ciuffreda, L.; et al. Multicohort and cross-platform validation of a prognostic Wnt signature in colorectal cancer. Clin. Transl. Med. 2020, 10, e199. [Google Scholar] [CrossRef]
- Vici, P.; Mottolese, M.; Pizzuti, L.; Barba, M.; Sperati, F.; Terrenato, I.; Di Benedetto, A.; Natoli, C.; Gamucci, T.; Angelucci, D.; et al. The Hippo transducer TAZ as a biomarker of pathological complete response in HER2-positive breast cancer patients treated with trastuzumab-based neoadjuvant therapy. Oncotarget 2014, 5, 9619–9625. [Google Scholar] [CrossRef] [Green Version]
- Wolff, A.C.; Hammond, M.E.H.; Hicks, D.G.; Dowsett, M.; McShane, L.M.; Allison, K.H.; Allred, D.C.; Bartlett, J.M.S.; Bilous, M.; Fitzgibbons, P.; et al. Recommendations for Human Epidermal Growth Factor Receptor 2 Testing in Breast Cancer: American Society of Clinical Oncology/College of American Pathologists Clinical Practice Guideline Update. J. Clin. Oncol. 2013, 31, 3997–4013. [Google Scholar] [CrossRef]
- Fedchenko, N.; Reifenrath, J. Different approaches for interpretation and reporting of immunohistochemistry analysis results in the bone tissue—A review. Diagn. Pathol. 2014, 9, 221. [Google Scholar] [CrossRef] [Green Version]
- Remmele, W.; Stegner, H.E. Recommendation for uniform definition of an immunoreactive score (IRS) for immunohistochemical estrogen receptor detection (ER-ICA) in breast cancer tissue. Pathologe 1987, 8, 138–140. [Google Scholar]
- Overweight & Obesity|CDC. Available online: https://www.cdc.gov/obesity/basics/adult-defining.html (accessed on 16 June 2022).
- Arpino, G.; Wiechmann, L.; Osborne, C.K.; Schiff, R. Crosstalk between the estrogen receptor and the HER tyrosine kinase receptor family: Molecular mechanism and clinical implications for endocrine therapy resi stance. Endocr. Rev. 2008, 29, 217–233. [Google Scholar] [CrossRef] [Green Version]
- Baselga, J.; Bradbury, I.; Eidtmann, H.; Di Cosimo, S.; de Azambuja, E.; Aura, C.; Gómez, H.; Dinh, P.; Fauria, K.; Van Dooren, V.; et al. NeoALTTO Study Team. Lapatinib with trastuzumab for HER2-positive early breast cancer (NeoALTTO): A randomised, open-label, multicentre, phase 3 trial. Lancet 2012, 379, 633–640. [Google Scholar] [CrossRef]
- Untch, M.; Loibl, S.; Bischoff, J.; Eidtmann, H.; Kaufmann, M.; Blohmer, J.U.; Hilfrich, J.; Strumberg, D.; Fasching, P.A.; Kreienberg, R.; et al. Lapatinib versus trastuzumab in combination with neoadjuvant anthracycline-taxane-based chemotherapy (GeparQuinto, GBG 44): A randomised phase 3 trial. Lancet Oncol. 2012, 13, 135–144. [Google Scholar] [CrossRef]
- Gianni, L.; Pienkowski, T.; Im, Y.H.; Roman, L.; Tseng, L.M.; Liu, M.C.; Lluch, A.; Staroslawska, E.; de la Haba-Rodriguez, J.; Im, S.A.; et al. Efficacy and safety of neoadjuvant pertuzumab and trastuzumab in women with locally advanced, inflammatory, or early HER2-positive breast cancer (NeoSphere): A randomised multicentre, open-label, phase 2 trial. Lancet Oncol. 2012, 13, 25–32. [Google Scholar] [CrossRef]
- Cao, L.; Yao, M.; Sasano, H.; Sun, P.L.; Gao, H. YAP increases response to Trastuzumab in HER2-positive Breast Cancer by enhancing P73-induced apoptosis. J. Cancer 2020, 11, 6748–6759. [Google Scholar] [CrossRef]
- Yuan, J.Q.; Ding, N.H.; Xiao, Z. The Hippo Transducer YAP/TAZ as a Biomarker of Therapeutic Response and Prognosis in Trastuzumab-Based Neoadjuvant Therapy Treated HER2-Positive Breast Cancer Patients. Front. Pharmacol. 2020, 11, 537265. [Google Scholar] [CrossRef]
- Mohamed, M.; Nafi, S.N.M.; Jaafar, H.; Paiman, N.M. A Retrospective Hospital-Based Study of HMGCR Expression in HER2 IHC 2+ and 3+ Breast Cancer. Asian Pac. J. Cancer Prev. 2021, 22, 2043–2047. [Google Scholar] [CrossRef]
- Zanconato, F.; Forcato, M.; Battilana, G.; Azzolin, L.; Quaranta, E.; Bodega, B.; Rosato, A.; Bicciato, S.; Cordenonsi, M.; Piccolo, S. Genome-wide association between YAP/TAZ/TEAD and AP-1 at enhancers drives oncogenic growth. Nat. Cell Biol. 2015, 17, 1218–1227. [Google Scholar] [CrossRef]
- Pinto, C.A.; Widodo, E.; Waltham, M.; Thompson, E.W. Breast cancer stem cells and epithelial mesenchymal plasticity—Implications for chemoresistance. Cancer Lett. 2013, 341, 56–62. [Google Scholar] [CrossRef]
- Grieve, S.; Wajnberg, G.; Lees, M.; Chacko, S.; Weir, J.; Crapoulet, N.; Reiman, T. TAZ functions as a tumor suppressor in multiple myeloma by downregulating MYC. Blood Adv. 2019, 3, 3613–3625. [Google Scholar] [CrossRef] [Green Version]
- Yang, W.H.; Lin, C.C.; Wu, J.; Chao, P.Y.; Chen, K.; Chen, P.H.; Chi, J.T. The Hippo Pathway Effector YAP Promotes Ferroptosis via the E3 Ligase SKP2. Mol. Cancer Res. 2021, 19, 1005–1014. [Google Scholar] [CrossRef]
- Yang, W.H.; Chi, J.T. Hippo pathway effectors YAP/TAZ as novel determinants of ferroptosis. Mol. Cell Oncol. 2019, 7, 1699375. [Google Scholar] [CrossRef]
- Kim, M.K.; Jang, J.W.; Bae, S.C. DNA binding partners of YAP/TAZ. BMB Rep. 2018, 51, 126–133. [Google Scholar] [CrossRef] [Green Version]
- Jones, R.J.; Plas, D.R.; Kubek, S.; Buzzai, M.; Mu, J.; Xu, Y.; Birnbaum, M.J.; Thompson, C.B. AMP-activated protein kinase induces a p53-dependent metabolic checkpoint. Mol. Cell 2005, 18, 283–293. [Google Scholar] [CrossRef]


| Characteristics | N (%) |
|---|---|
| 65(100) | |
| Age in years (median, range) | 49 (34–78) |
| Menopausal status Premenopausal Postmenopausal | 27 (41.5) 38 (58.5) |
| 1BMI Underweight (<18.5) Normal (18.5–25) Overweight (25.1–30) Obese (>30.1) Missing | 3 (4.6) 21 (32.3) 16 (24.6) 7 (10.8) 18 (27.7) |
| Stage I II III Missing | 3 (4.6) 39 (60.0) 22 (33.8) 1 (1.5) |
| Grading G1 G2 G3 Missing | 2 (3.1) 25 (38.5) 30 (46.2) 8 (12.3) |
| Estrogen Receptor Positive Negative Missing | 59 (90.7) 2 (3.1) 4 (6.2) |
| Progesterone Receptor Positive Negative Missing | 44 (90.7) 17 (26.2) 4 (6.2) |
| Her2 IHC score Score 2+ Score 3+ Missing | 15 (23.1) 46 (70.8) 4 (6.2) |
| Ki67 continuous (median, range) | 30 (1–80) |
| Ki67 >20 ≤20 Missing | 49 (75.4) 13 (20) 3 (4.6) |
| Neoadjuvant Treatment Schedule AC → P (or D) + T AC + T → P (or D) + T P (or D) + T → AC + T | 47 (72.3) 14 (21.5) 4 (6.2) |
| A | |||||
|---|---|---|---|---|---|
| Biomarker | 1 P (% of Cells) | 1 SxP * (% of Cells * Intensity (0–3)) | 1 Irs % of Cells (in 0–4 Scale) * Intensity (0–3)) | ||
| TAZ_C TAZ_N | 27 22 | 38 40 | 1.6 2.1 | ||
| YAP_C YAP_N | 76 9 | 185 23 | 7.0 1.3 | ||
| AMPK_C AMPK_N | 43 71 | 75 205 | 2.8 8.1 | ||
| HMGCR_C HMGCR_N | 48 2 | 60 2 | 2.3 0.1 | ||
| SCD1_C SCD1_N | 65 3 | 110 8 | 4.4 0.4 | ||
| B | |||||
| Biomarker | 0–3 Score | ||||
| 0 Nr (%) | 1 Nr (%) | 2 Nr (%) | 3 Nr (%) | Missing Nr (%) | |
| TAZ_C TAZ_N | 39 (60) 29 (44.6) | 17 (26.2) 14 (21.5) | 6 (9.2) 16 (24.6) | 3 (4.6) 6 (9.2) | 0 (0) 0 (0) |
| YAP_C YAP_N | 2 (3.1) 44 (67.7) | 5 (7.7) 0 (0) | 27 (41.5) 12 (18.5) | 29 (44.6) 7 (10.8) | 2 (3.1) 2 (3.1) |
| AMPK_C AMPK_N | 29 (44.6) 2 (3.1) | 14 (21.5) 0 (0) | 16 (24.6) 9 (13.8) | 5 (7.7) 53 (81.5) | 1 (1.5) 1 (1.5) |
| HMGCR_C HMGCR_N | 24 (36.9) 62 (95.4) | 31 (47.7) 2 (3.1) | 8 (12.3) 0 (0) | 1 (1.5) 0 (0) | 1 (1.5) 1 (1.5) |
| SCD1_C SCD1_N | 6 (9.2) 57 (87.7) | 28 (43.1) 0 (0) | 15 (23.1) 6 (9.2) | 15 (23.1) 1 (1.5) | 1 (1.5) 1 (1.5) |
| C | |||||
| Biomarker | Irs Classification | ||||
| Negative Nr (%) | Positive, Weak Nr (%) | Positive, Intermediate Nr (%) | Positive, Strong Nr (%) | Missing Nr (%) | |
| TAZ_C TAZ_N | 40 (61.5) 31 (47.7) | 17 (26.2) 15 (23.1) | 7 (10.8) 17 (26.2) | 1 (1.5) 2 (3.1) | 0 (0) 0 (0) |
| YAP_C YAP_N | 2 (3.1) 44 (67.7) | 5 (7.7) 5 (7.7) | 27 (41.5) 13 (20) | 29 (44.6) 1 (1.5) | 2 (3.1) 2 (3.1) |
| AMPK_C AMPK_N | 29 (44.6) 2 (3.1) | 14 (21.5) 0 (0) | 16 (24.6) 12 (18.5) | 5 (7.7) 50 (76.9) | 1 (1.5) 1 (1.5) |
| HMGCR_C HMGCR_N | 24 (36.9) 62 (95.4) | 31 (47.7) 2 (3.1) | 8 (12.3) 0 (0) | 1 (1.5) 0 (0) | 1 (1.5) 1 (1.5) |
| SCD1_C SCD1_N | 6 (9.2) 57 (87.7) | 30 (46.2) 3 (4.6) | 18 (27.7) 3 (4.6) | 10 (15.4) 1 (1.5) | 1 (1.5) 1 (1.5) |
Publisher’s Note: MDPI stays neutral with regard to jurisdictional claims in published maps and institutional affiliations. |
© 2022 by the authors. Licensee MDPI, Basel, Switzerland. This article is an open access article distributed under the terms and conditions of the Creative Commons Attribution (CC BY) license (https://creativecommons.org/licenses/by/4.0/).
Share and Cite
Krasniqi, E.; Di Lisa, F.S.; Di Benedetto, A.; Barba, M.; Pizzuti, L.; Filomeno, L.; Ercolani, C.; Tinari, N.; Grassadonia, A.; Santini, D.; et al. The Impact of the Hippo Pathway and Cell Metabolism on Pathological Complete Response in Locally Advanced Her2+ Breast Cancer: The TRISKELE Multicenter Prospective Study. Cancers 2022, 14, 4835. https://doi.org/10.3390/cancers14194835
Krasniqi E, Di Lisa FS, Di Benedetto A, Barba M, Pizzuti L, Filomeno L, Ercolani C, Tinari N, Grassadonia A, Santini D, et al. The Impact of the Hippo Pathway and Cell Metabolism on Pathological Complete Response in Locally Advanced Her2+ Breast Cancer: The TRISKELE Multicenter Prospective Study. Cancers. 2022; 14(19):4835. https://doi.org/10.3390/cancers14194835
Chicago/Turabian StyleKrasniqi, Eriseld, Francesca Sofia Di Lisa, Anna Di Benedetto, Maddalena Barba, Laura Pizzuti, Lorena Filomeno, Cristiana Ercolani, Nicola Tinari, Antonino Grassadonia, Daniele Santini, and et al. 2022. "The Impact of the Hippo Pathway and Cell Metabolism on Pathological Complete Response in Locally Advanced Her2+ Breast Cancer: The TRISKELE Multicenter Prospective Study" Cancers 14, no. 19: 4835. https://doi.org/10.3390/cancers14194835