

Predicting the Early Response to Neoadjuvant Therapy with Breast MR Morphological, Functional and Relaxometry Features—A Pilot Study
 , , , ,
Abstract
:Simple Summary
Abstract
1. Introduction
2. Methods
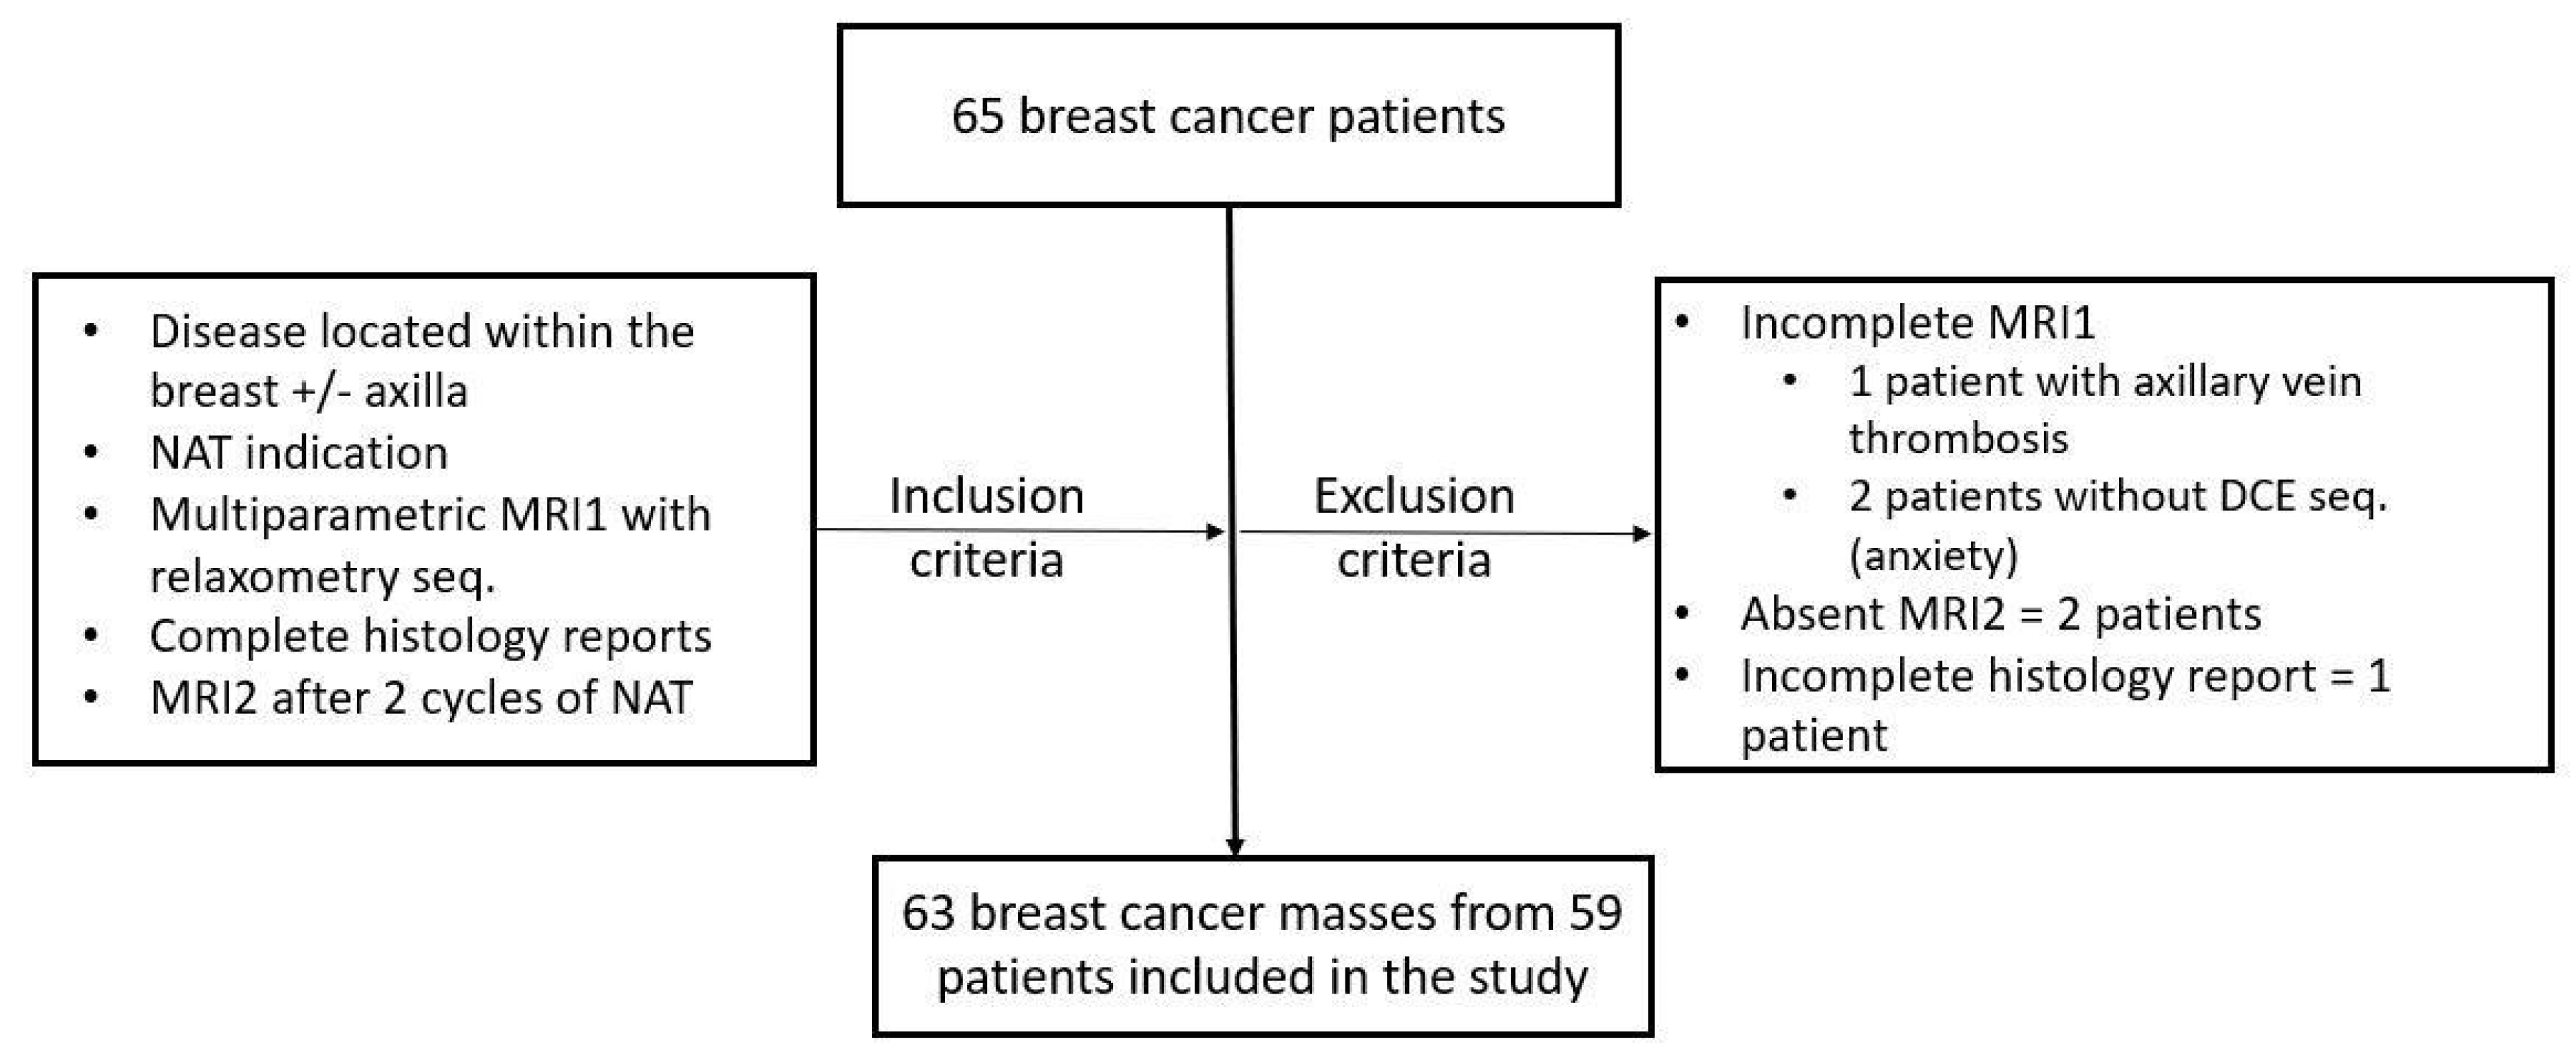
2.1. Patients
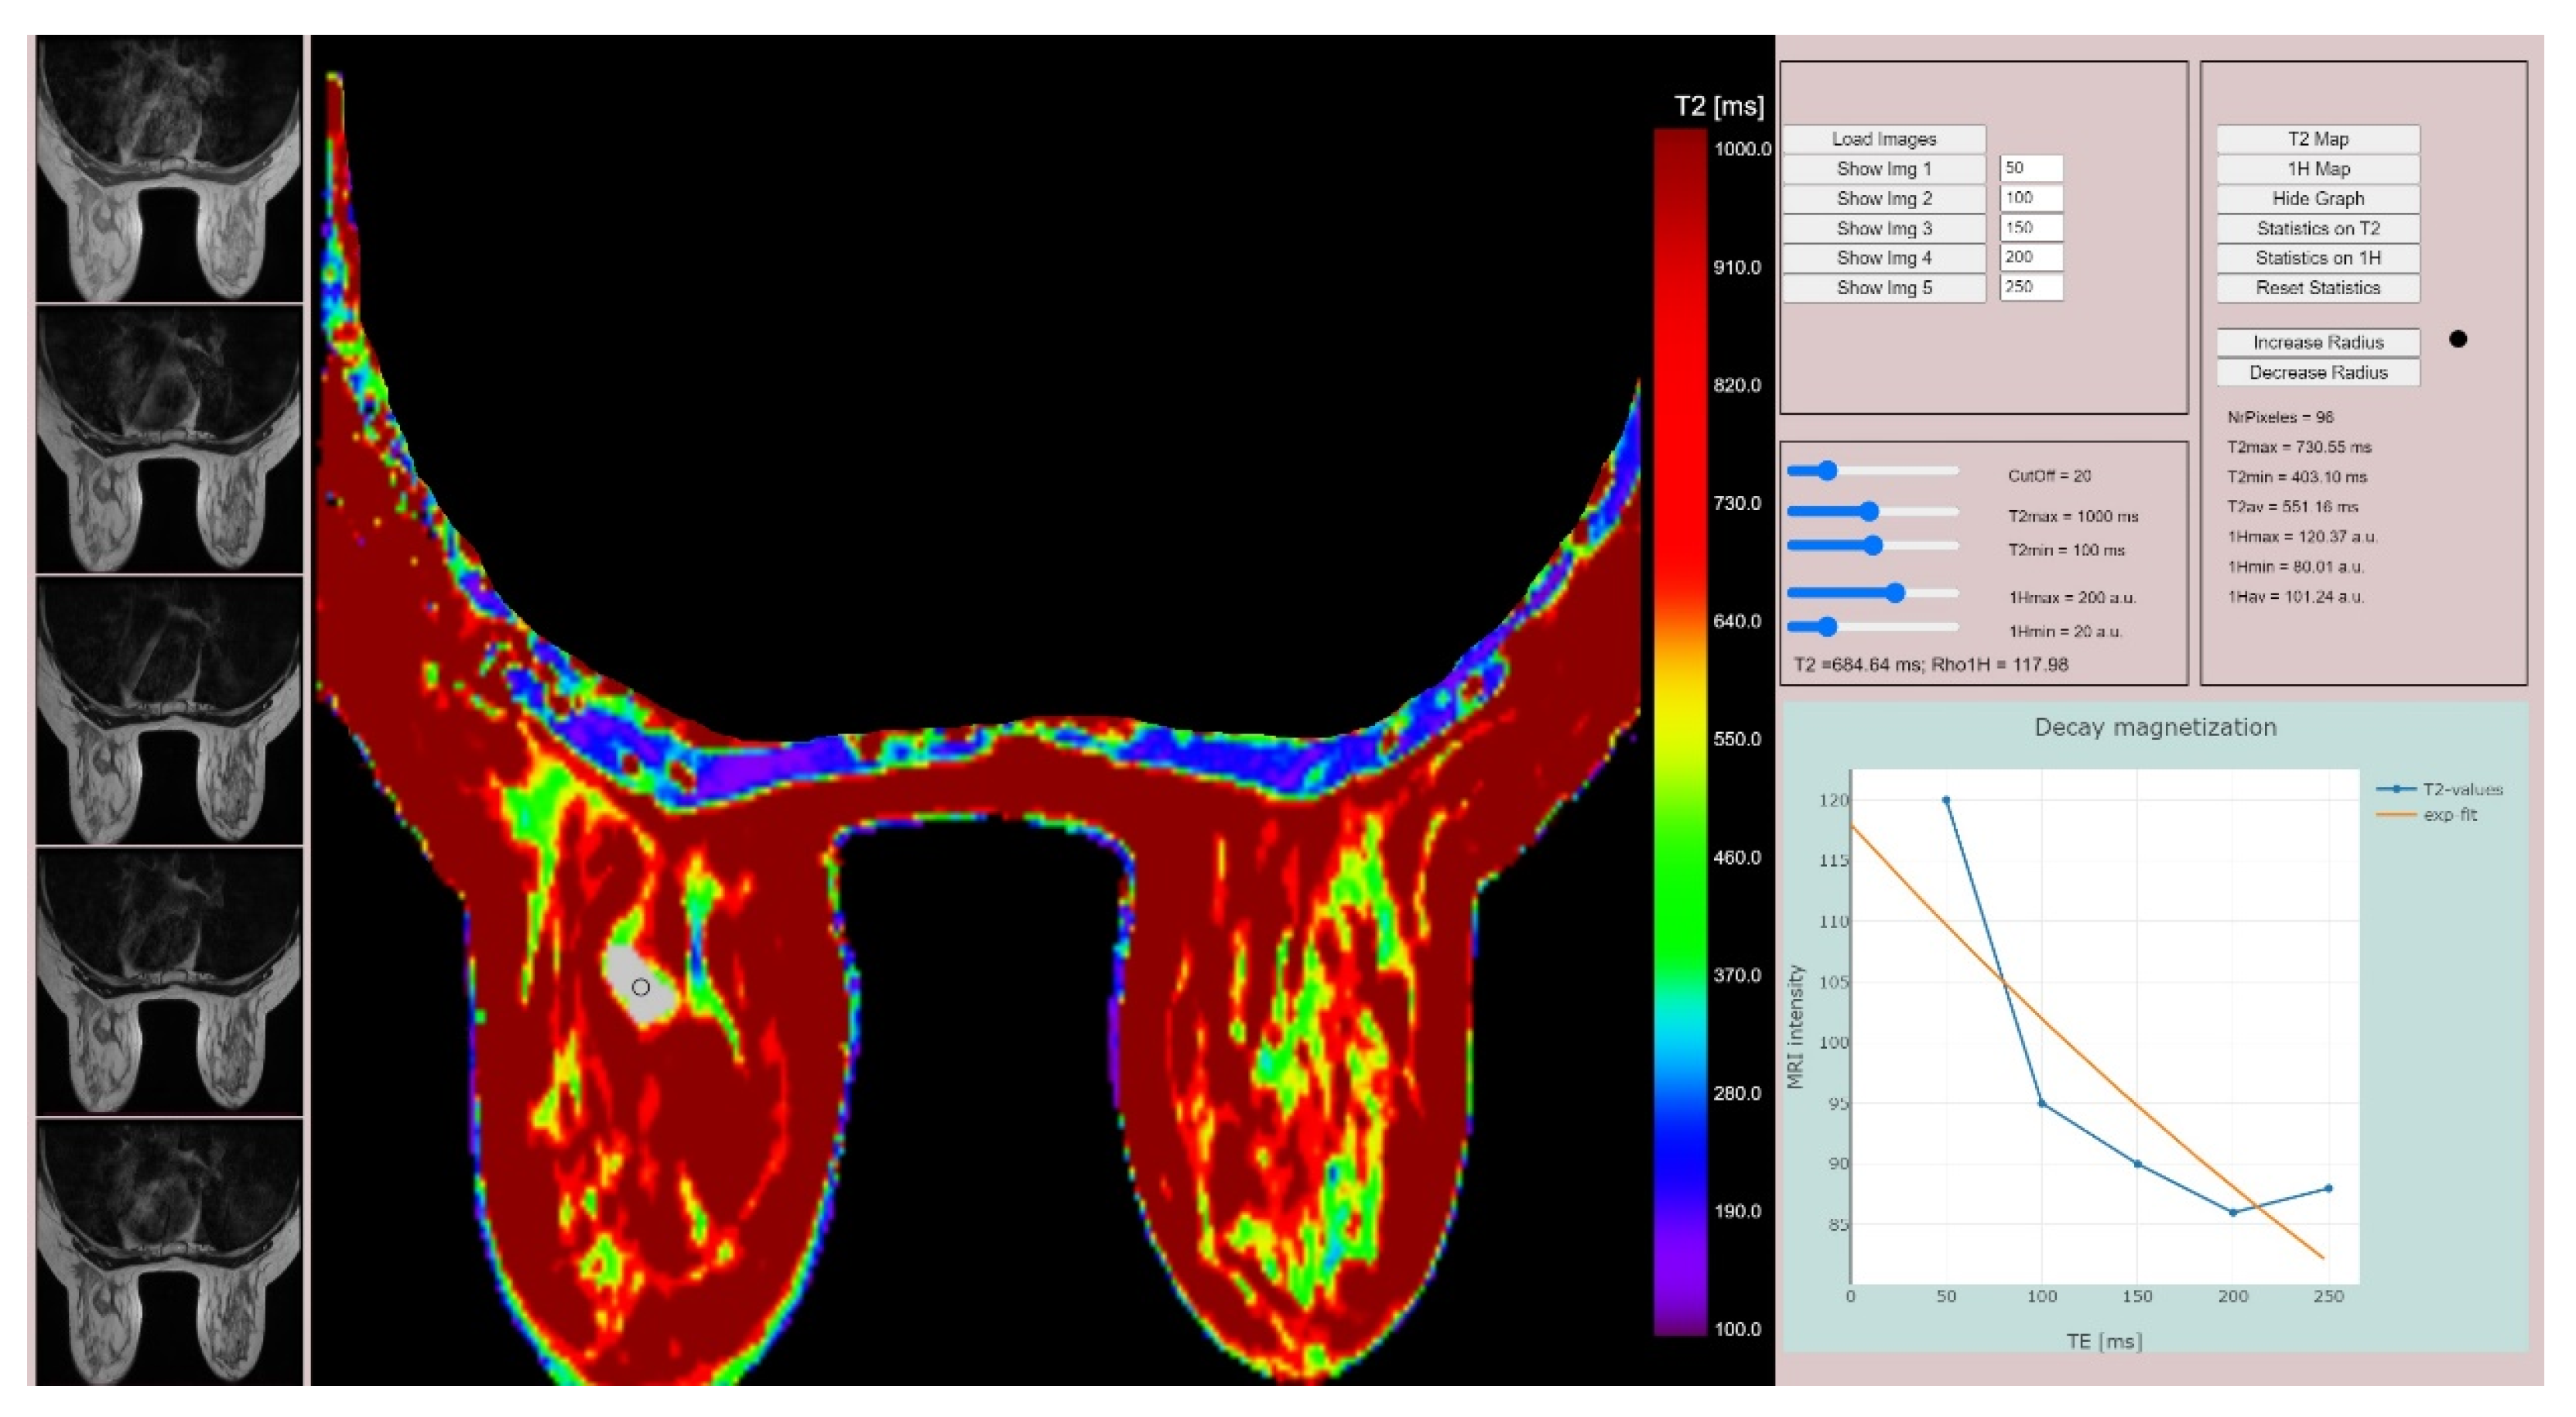
2.2. MRI Relaxometry Sequences and Processing
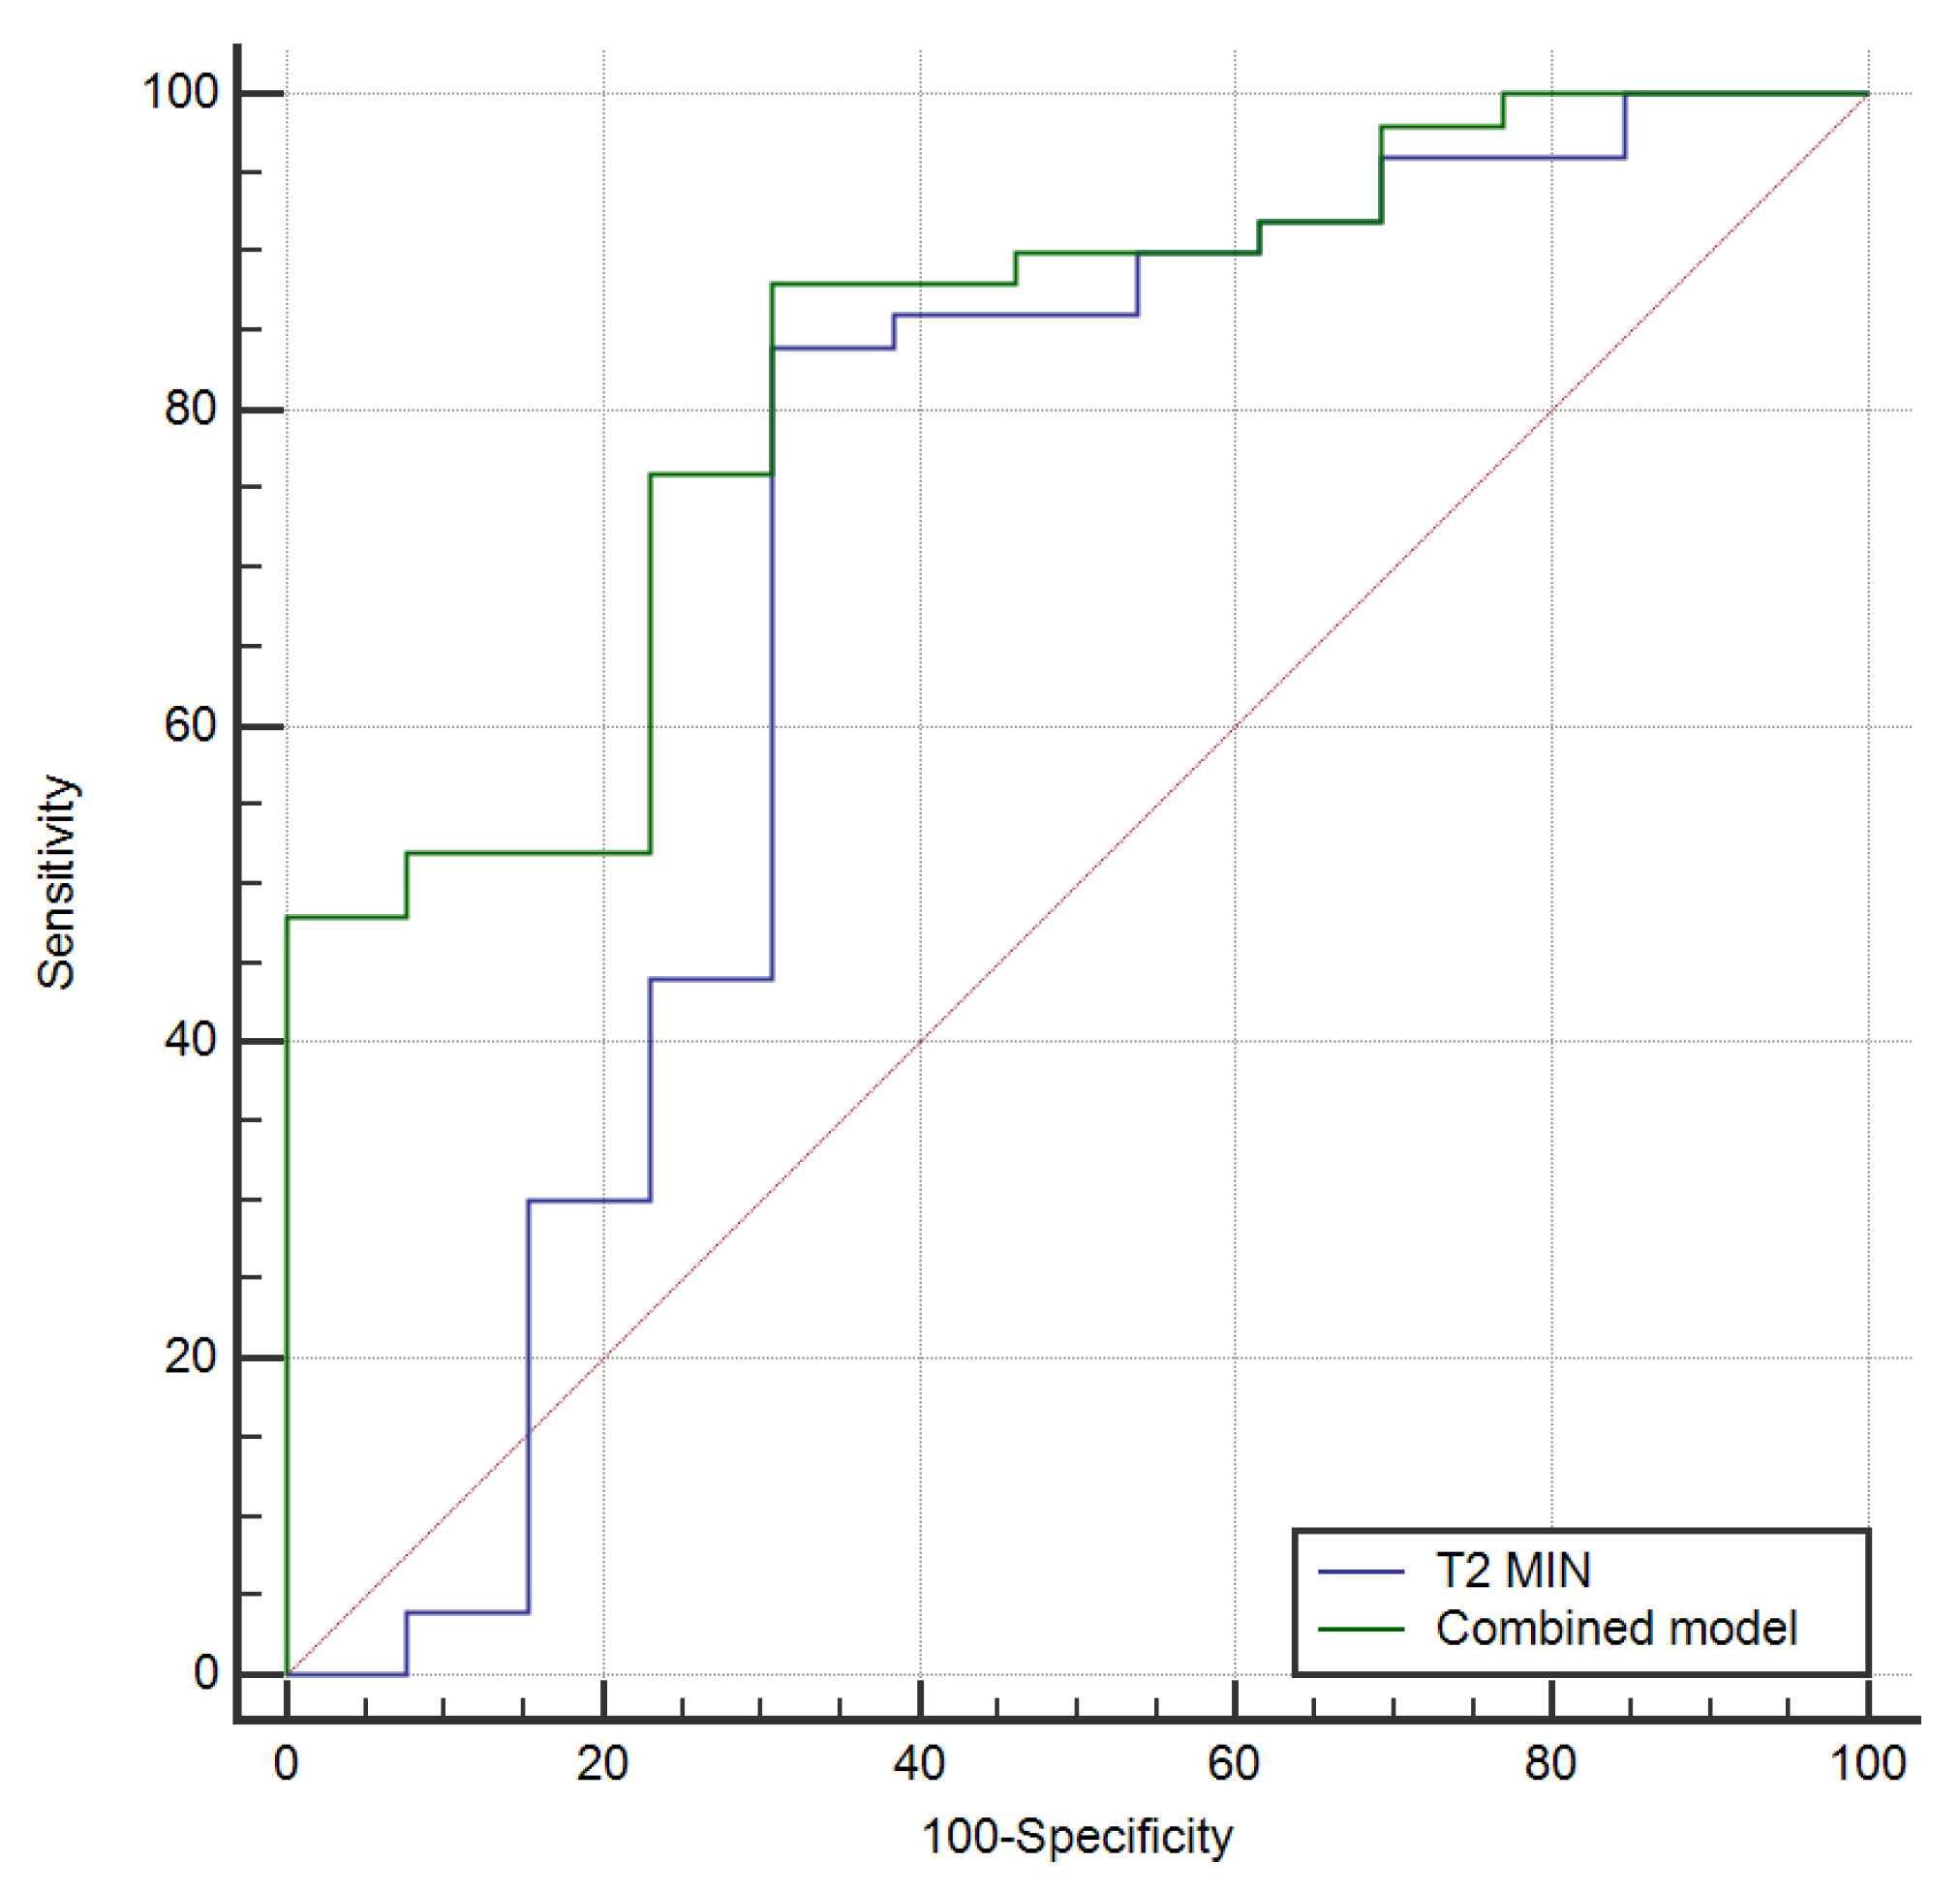
2.3. Statistics
3. Results
4. Discussion
5. Conclusions
Author Contributions
Funding
Institutional Review Board Statement
Informed Consent Statement
Data Availability Statement
Conflicts of Interest
References
- Trayes, K.P.; Cokenakes, S.E.H. Breast Cancer Treatment. Am. Fam. Physician 2021, 104, 171–178. [Google Scholar] [PubMed]
- Curigliano, G.; Burstein, H.J.; Winer, E.P.; Gnant, M.; Dubsky, P.; Loibl, S.; Colleoni, M.; Regan, M.M.; Piccart-Gebhart, M.; Senn, H.J.; et al. De-escalating and escalating treatments for early-stage breast cancer: The St. Gallen International Expert Consensus Conference on the Primary Therapy of Early Breast Cancer 2017. Ann. Oncol. 2018, 28, 1700–1712. [Google Scholar] [CrossRef] [PubMed]
- Reig, B.; Lewin, A.A.; Du, L.; Heacock, L.; Toth, H.K.; Heller, S.L.; Gao, Y.; Moy, L. Breast MRI for Evaluation of Response to Neoadjuvant Therapy. Radiographics 2021, 41, 665–679. [Google Scholar] [CrossRef] [PubMed]
- Cortazar, P.; Zhang, L.; Untch, M.; Mehta, K.; Costantino, J.P.; Wolmark, N.; Bonnefoi, H.; Cameron, D.; Gianni, L.; Valagussa, P.; et al. Pathological complete response and long-term clinical benefit in breast cancer: The CTNeoBC pooled analysis. Lancet 2014, 384, 164–172. [Google Scholar] [CrossRef] [PubMed] [Green Version]
- Scheel, J.R.; Kim, E.; Partridge, S.C.; Lehman, C.D.; Rosen, M.A.; Bernreuter, W.K.; Pisano, E.D.; Marques, H.S.; Morris, E.A.; Weatherall, P.T.; et al. MRI, Clinical Examination, and Mammography for Preoperative Assessment of Residual Disease and Pathologic Complete Response After Neoadjuvant Chemotherapy for Breast Cancer: ACRIN 6657 Trial. AJR Am. J. Roentgenol. 2018, 210, 1376–1385. [Google Scholar] [CrossRef]
- Marinovich, M.L.; Houssami, N.; Macaskill, P.; Sardanelli, F.; Irwig, L.; Mamounas, E.P.; Von Minckwitz, G.; Brennan, M.E.; Ciatto, S. Meta-analysis of magnetic resonance imaging in detecting residual breastcancer after neoadjuvant therapy. J. Natl. Cancer Inst. 2013, 105, 321–333. [Google Scholar] [CrossRef] [PubMed] [Green Version]
- Minarikova, L.; Bogner, W.; Pinker, K.; Valkovič, L.; Zaric, O.; Bago-Horvath, Z.; Bartsch, R.; Helbich, T.H.; Trattnig, S.; Gruber, S. Investigating the prediction value of multiparametric magnetic resonance imaging at 3 T in response to neoadjuvant chemotherapy in breast cancer. Eur. Radiol. 2017, 27, 1901–1911. [Google Scholar] [CrossRef] [Green Version]
- Li, X.; Abramson, R.G.; Arlinghaus, L.R.; Kang, H.; Chakravarthy, A.B.; Abramson, V.G.; Farley, J.; Mayer, I.A.; Kelley, M.C.; Meszoely, I.M.; et al. Multiparametric magnetic resonance imaging for predicting pathological response after the first cycle of neoadjuvant chemotherapy in breast cancer. Investig. Radiol. 2015, 50, 195–204. [Google Scholar] [CrossRef] [Green Version]
- Liu, S.; Ren, R.; Chen, Z.; Wang, Y.; Fan, T.; Li, C.; Zhang, P. Diffusion-weighted imaging in assessing pathological response of tumor in breast cancer subtype to neoadjuvant chemotherapy. J. Magn. Reason. Imaging 2015, 42, 779–787. [Google Scholar] [CrossRef]
- Hahn, S.Y.; Ko, E.Y.; Han, B.-K.; Shin, J.H. Role of diffusion-weighted imaging as an adjunct to contrast-enhanced breast MRI in evaluating residual breast cancer following neoadjuvant chemotherapy. Eur. J. Radiol. 2014, 83, 283–288. [Google Scholar] [CrossRef]
- Woodhams, R.; Kakita, S.; Hata, H.; Iwabuchi, K.; Kuranami, M.; Gautam, S.; Hatabu, H.; Kan, S.; Mountford, C. Identification of residual breast carcinoma following neoadjuvant chemotherapy: Diffusion-weighted imaging-comparison with contrast-enhanced MR imaging and pathologic findings. Radiology 2010, 254, 357–366. [Google Scholar] [CrossRef] [PubMed]
- O’Flynn, E.A.; Collins, D.; D’Arcy, J.; Schmidt, M.; de Souza, N.M. Multi-parametric MRI in the early prediction of response to neo-adjuvant chemo therapy in breast cancer: Value of non-modelled parameters. Eur. J. Radiol. 2016, 85, 837–842. [Google Scholar] [CrossRef] [PubMed] [Green Version]
- Tahmassebi, A.; Wengert, G.J.; Helbich, T.H.; Bago-Horvath, Z.; Alaei, S.; Bartsch, R.; Dubsky, P.; Baltzer, P.; Clauser, P.; Kapetas, P.; et al. Impact of Machine Learning With Multiparametric Magnetic Resonance Imaging of the Breast for Early Prediction of Response to Neoadjuvant Chemotherapy and Survival Outcomes in Breast Cancer Patients. Investig. Radiol. 2019, 54, 110–117. [Google Scholar] [CrossRef]
- Liu, Z.; Li, Z.; Qu, J.; Zhang, R.; Zhou, X.; Li, L.; Sun, K.; Tang, Z.; Jiang, H.; Li, H.; et al. Radiomics of Multiparametric MRI for Pretreatment Prediction of Pathologic Complete Response to Neoadjuvant Chemotherapy in Breast Cancer: A Multicenter Study. Clin. Cancer Res. 2019, 25, 3538–3547. [Google Scholar] [CrossRef] [Green Version]
- Magbanua, M.; Swigart, L.; Wu, H.-T.; Hirst, G.; Yau, C.; Wolf, D.; Tin, A.; Salari, R.; Shchegrova, S.; Pawar, H.; et al. Circulating tumor DNA in neoadjuvant-treated breast cancer reflects response and survival. Ann. Oncol. 2021, 32, 229–239. [Google Scholar] [CrossRef]
- Panda, A.; Chen, Y.; Ropella-Panagis, K.; Ghodasara, S.; Stopchinski, M.; Seyfried, N.; Wright, K.; Seiberlich, N.; Griswold, M.; Gulani, V. Repeatability and reproducibility of 3D MR fingerprinting relaxometry measurements in normal breast tissue. J. Magn. Reason. Imaging 2019, 50, 1133–1143. [Google Scholar] [CrossRef]
- Gao, W.; Zhang, S.; Guo, J.; Wei, X.; Li, X.; Diao, Y.; Huang, W.; Yao, Y.; Shang, A.; Zhang, Y.; et al. Investigation of Synthetic Relaxometry and Diffusion Measures in the Differentiation of Benign and Malignant Breast Lesions as Compared to BIRADS. J. Magn. Reason. Imaging 2021, 53, 1118–1127. [Google Scholar] [CrossRef]
- Early Breast Cancer Trialists; Collaborative Group (EBCTCG). Long-term outcomes for neoadjuvant versus adjuvant chem-otherapy in early breast cancer: Meta-analysis of individual patient data from ten randomised trials. Lancet Oncol. 2018, 19, 27–39. [Google Scholar] [CrossRef] [Green Version]
- Rastogi, P.; Anderson, S.J.; Bear, H.D.; Geyer, C.E.; Kahlenberg, M.S.; Robidoux, A.; Margolese, R.G.; Hoehn, J.L.; Vogel, V.G.; Dakhil, S.R.; et al. Preoperative chemotherapy: Updates of National Surgical Adjuvant Breast and Bowel Project Protocols B-18 and B-27. J. Clin. Oncol. 2008, 26, 778–785. [Google Scholar] [CrossRef] [Green Version]
- Wang-Lopez, Q.; Chalabi, N.; Abrial, C.; Radosevic-Robin, N.; Durando, X.; Mouret-Reynier, M.-A.; Benmammar, K.E.; Kullab, S.; Bahadoor, M.; Chollet, P.; et al. Can pathologic complete response (pCR) be used as a surrogate marker of survival after neoadjuvant therapy for breast cancer? Crit. Rev. Oncol. Hematol. 2015, 95, 88–104. [Google Scholar] [CrossRef]
- Ikeda, T.; Jinno, H.; Matsu, A.; Masamura, S.; Kitajima, M. The role of neoadjuvant chemotherapy for breast cancer treatment. Breast Cancer 2002, 9, 8–14. [Google Scholar] [CrossRef]
- Beresford, M.J.; Stott, D.; Makris, A. Assessment of clinical response after two cycles of primary chemotherapy in breast cancer. Breast Cancer Res. Treat. 2008, 109, 337–342. [Google Scholar] [CrossRef] [PubMed]
- Wang, X.; Huo, L.; He, Y.; Fan, Z.; Wang, T.; Xie, Y.; Li, J.; Ouyang, T. Early prediction of pathological outcomes to neoadjuvant chemotherapy in breast cancer patients using automated breast ultrasound. Chin. J. Cancer Res. 2016, 28, 478. [Google Scholar] [CrossRef] [PubMed] [Green Version]
- Hong, J.; Wu, J.; Huang, O.; He, J.; Zhu, L.; Chen, W.; Li, Y.; Chen, X.; Shen, K. Early response and pathological complete remission in Breast Cancer with different molecular subtypes: A retrospective single center analysis. J Cancer 2020, 11, 6916–6924. [Google Scholar] [CrossRef] [PubMed]
- Tian, F.; Shen, G.; Deng, Y.; Diao, W.; Jia, Z. The accuracy of (18)F-FDG PET/CT in predicting the pathological response to neo-adjuvant chemotherapy in patients with breast cancer: A meta-analysis and systematic review. Eur. Radiol. 2017, 27, 4786–4796. [Google Scholar] [CrossRef]
- Cheng, Q.; Huang, J.; Liang, J.; Ma, M.; Ye, K.; Shi, C.; Luo, L. The Diagnostic Performance of DCE-MRI in Evaluating the Pathological Response to Neoadjuvant Chemotherapy in Breast Cancer: A Meta-Analysis. Front. Oncol. 2020, 10, 93. [Google Scholar] [CrossRef] [Green Version]
- Prevos, R.; Smidt, M.L.; Tjan-Heijnen, V.C.; van Goethem, M.; Beets-Tan, R.G.; Wildberger, J.E.; Lobbes, M.B. Pre-treatment differences and early response monitoring of neoadjuvant chemotherapy in breast cancer patients using magnetic resonance imaging: A systematic review. Eur. Radiol. 2012, 22, 2607–2616. [Google Scholar] [CrossRef]
- Park, S.H.; Moon, W.K.; Cho, N.; Song, I.C.; Chang, J.M.; Park, I.A.; Han, W.; Noh, D.Y. Diffusion-weighted MR imaging: Pretreatment prediction of response to neoadjuvant chemotherapy in patients with breast cancer. Radiology 2010, 257, 56–63. [Google Scholar] [CrossRef] [Green Version]
- Li, X.R.; Cheng, L.Q.; Liu, M.; Zhang, Y.J.; Wang, J.D.; Zhang, A.L.; Song, X.; Li, J.; Zheng, Y.Q.; Liu, L. DW-MRI ADC values can predict treatment response in patients with locally advanced breast cancer undergoing neoadjuvant chemotherapy. Med. Oncol. 2012, 29, 425–431. [Google Scholar] [CrossRef]


| Variable | Responders | Non-Responders | p-Value |
|---|---|---|---|
| Age (y), median (range) | 65 (44–71) | 58 (43–75) | 0.237 |
| Breast cancer type | |||
| IDC–NST | 44 | 11 | 0.52 |
| Other * | 6 | 2 | |
| “In-situ” component | 13 | 2 | 0.34 |
| Number of tumors | 0.13 | ||
| Unifocal | 32 | 2 | |
| Multifocal/Multicentric | 18 | 11 | |
| Bilateral | 3 | 1 | 0.82 |
| Size mean (mm) | 30.32 | 27.69 | 0.56 |
| Histologic grade | 0.54 | ||
| Low–G1 | 11 | 5 | |
| Intermediate–G2 | 27 | 5 | |
| High–G3 | 10 | 3 | |
| Immunohistochemistry | |||
| ER + | 40 | 11 | 0.52 |
| ER – | 10 | 2 | |
| PR+ | 35 | 9 | 0.60 |
| PR- | 15 | 4 | |
| HER2+ | 13 | 1 | 0.148 |
| HER2- | 37 | 12 | |
| Ki-67% status | |||
| >20% | 30 | 6 | 0.278 |
| <20% | 20 | 7 | |
| TNM stage | |||
| T stage | 0.96 | ||
| 1 | 8 | 1 | |
| 2 | 31 | 7 | |
| 3 | 6 | 1 | |
| 4 | 5 | 4 | |
| N stage 0 | 0.005 | ||
| 1 | 25 | 3 | |
| 2 | 19 | 3 | |
| 3 | 5 | 7 | |
| 1 | 0 | ||
| Total | 50 | 13 |
| Variable | Responders | Non-Responders | p-Value |
|---|---|---|---|
| Tumor location * UOQ UIQ LOQ LIQ | 28 | 7 | |
| 12 | 4 | ||
| 10 | 2 | 0.69 | |
| NA | NA | ||
| Mass-Margins | |||
| Circumscribed | 10 | 2 | 0.528 |
| Non-Circumscribed | 40 | 11 | |
| Non-mass | |||
| Present Absent | 13 | 2 | 0.641 |
| 37 | 11 | ||
| ADC mean | 1.02 | 0.89 | 0.872 |
| Relaxometry Pixel NR T2max | 1552.72 | 1456.77 | 0.476 |
| 91,790.9 | 207,447.9 | 0.316 | |
| T2min T2av 1H max 1H min 1H av | 975.4 | 93.66 | 0.017 |
| 452.8 | 400.2 | 0.622 | |
| 392.4 | 513.5 | 0.228 | |
| 946.8 | 3491.1 | 0.865 | |
| 132.9 | 139.5 | 0.445 |
Publisher’s Note: MDPI stays neutral with regard to jurisdictional claims in published maps and institutional affiliations. |
© 2022 by the authors. Licensee MDPI, Basel, Switzerland. This article is an open access article distributed under the terms and conditions of the Creative Commons Attribution (CC BY) license (https://creativecommons.org/licenses/by/4.0/).
Share and Cite
Pintican, R.; Fechete, R.; Boca, B.; Cambrea, M.; Leonte, T.; Camuescu, O.; Gherman, D.; Bene, I.; Ciule, L.D.; Ciortea, C.A.; et al. Predicting the Early Response to Neoadjuvant Therapy with Breast MR Morphological, Functional and Relaxometry Features—A Pilot Study. Cancers 2022, 14, 5866. https://doi.org/10.3390/cancers14235866
Pintican R, Fechete R, Boca B, Cambrea M, Leonte T, Camuescu O, Gherman D, Bene I, Ciule LD, Ciortea CA, et al. Predicting the Early Response to Neoadjuvant Therapy with Breast MR Morphological, Functional and Relaxometry Features—A Pilot Study. Cancers. 2022; 14(23):5866. https://doi.org/10.3390/cancers14235866
Chicago/Turabian StylePintican, Roxana, Radu Fechete, Bianca Boca, Madalina Cambrea, Tiberiu Leonte, Oana Camuescu, Diana Gherman, Ioana Bene, Larisa Dorina Ciule, Cristiana Augusta Ciortea, and et al. 2022. "Predicting the Early Response to Neoadjuvant Therapy with Breast MR Morphological, Functional and Relaxometry Features—A Pilot Study" Cancers 14, no. 23: 5866. https://doi.org/10.3390/cancers14235866