
Lymphocyte Classification from Hoechst Stained Slides with Deep Learning


Abstract
:Simple Summary
Abstract
1. Introduction
2. Materials and Methods
2.1. Immunofluorescence (IF) Protocol
2.2. Image Acquisition and Analysis
2.3. Model Architecture and Training
3. Results
4. Discussion
5. Conclusions
Author Contributions
Funding
Institutional Review Board Statement
Informed Consent Statement
Data Availability Statement
Conflicts of Interest
References
- Bruni, D.; Angell, H.K.; Galon, J. The immune contexture and Immunoscore in cancer prognosis and therapeutic efficacy. Nat. Rev. Cancer 2020, 20, 662–680. [Google Scholar] [CrossRef] [PubMed]
- Mlecnik, B.; Van den Eynde, M.; Bindea, G.; Church, S.E.; Vasaturo, A.; Fredriksen, T.; Lafontaine, L.; Haicheur, N.; Marliot, F.; Debetancourt, D.; et al. Comprehensive Intrametastatic Immune Quantification and Major Impact of Immunoscore on Survival. J. Natl. Cancer Inst. 2018, 110, 97–108. [Google Scholar] [CrossRef] [PubMed] [Green Version]
- Galon, J.; Lanzi, A. Immunoscore and its introduction in clinical practice. Q. J. Nucl. Med. Mol. Imaging 2020, 64, 152–161. [Google Scholar] [CrossRef] [PubMed]
- Van den Eynde, M.; Mlecnik, B.; Bindea, G.; Fredriksen, T.; Church, S.E.; Lafontaine, L.; Haicheur, N.; Marliot, F.; Angelova, M.; Vasaturo, A.; et al. The Link between the Multiverse of Immune Microenvironments in Metastases and the Survival of Colorectal Cancer Patients. Cancer Cell 2018, 34, 1012–1026.e3. [Google Scholar] [CrossRef] [Green Version]
- Tan, W.C.C.; Nerurkar, S.N.; Cai, H.Y.; Ng, H.H.M.; Wu, D.; Wee, Y.T.F.; Lim, J.C.T.; Yeong, J.; Lim, T.K.H. Overview of multiplex immunohistochemistry/immunofluorescence techniques in the era of cancer immunotherapy. Cancer Commun. 2020, 40, 135–153. [Google Scholar] [CrossRef] [Green Version]
- Taube, J.M.; Akturk, G.; Angelo, M.; Engle, E.L.; Gnjatic, S.; Greenbaum, S.; Greenwald, N.F.; Hedvat, C.V.; Hollmann, T.J.; Juco, J.; et al. The Society for Immunotherapy of Cancer statement on best practices for multiplex immunohistochemistry (IHC) and immunofluorescence (IF) staining and validation. J. Immunother. Cancer 2020, 8, e000155. [Google Scholar] [CrossRef]
- Raab, S.S. The Cost-Effectiveness of Immunohistochemistry. Arch. Pathol. Lab. Med. 2000, 124, 1185–1191. [Google Scholar] [CrossRef]
- Parra, E.R.; Uraoka, N.; Jiang, M.; Cook, P.; Gibbons, D.; Forget, M.A.; Bernatchez, C.; Haymaker, C.; Wistuba, I.I.; Rodriguez-Canales, J. Validation of multiplex immunofluorescence panels using multispectral microscopy for immune-profiling of formalin-fixed and paraffin-embedded human tumor tissues. Sci. Rep. 2017, 7, 13380. [Google Scholar] [CrossRef] [Green Version]
- Galon, J.; Mlecnik, B.; Bindea, G.; Angell, H.K.; Berger, A.; Lagorce, C.; Lugli, A.; Zlobec, I.; Hartmann, A.; Bifulco, C.; et al. Towards the introduction of the ’Immunoscore’ in the classification of malignant tumours. J. Pathol. 2014, 232, 199–209. [Google Scholar] [CrossRef] [Green Version]
- Angelova, M.; Mlecnik, B.; Vasaturo, A.; Bindea, G.; Fredriksen, T.; Lafontaine, L.; Buttard, B.; Morgand, E.; Bruni, D.; Jouret-Mourin, A.; et al. Evolution of Metastases in Space and Time under Immune Selection. Cell 2018, 175, 751–765.e16. [Google Scholar] [CrossRef]
- Otto, F.; Tsou, K.C. A comparative study of DAPI, DIPI, and Hoechst 33258 and 33342 as chromosomal DNA stains. Stain Technol. 1985, 60, 7–11. [Google Scholar] [CrossRef] [PubMed]
- Chazotte, B. Labeling nuclear DNA using DAPI. Cold Spring Harb. Protoc. 2011, 2011, db.prot5556. [Google Scholar] [CrossRef] [PubMed] [Green Version]
- Chazotte, B. Labeling nuclear DNA with hoechst 33342. Cold Spring Harb. Protoc. 2011, 2011, db.prot5557. [Google Scholar] [CrossRef] [PubMed] [Green Version]
- Bošnački, D.; van Riel, N.; Veta, M. Deep learning with convolutional neural networks for histopathology image analysis. In Automated Reasoning for Systems Biology and Medicine; Computational Biology; Springer International Publishing: Cham, Switzerland, 2019; pp. 453–469. [Google Scholar]
- Xu, J.; Zhou, C.; Lang, B.; Liu, Q. Deep learning for histopathological image analysis: Towards computerized diagnosis on cancers. In Deep Learning and Convolutional Neural Networks for Medical Image Computing; Advances in Computer Vision and Pattern Recognition; Springer International Publishing: Cham, Switzerland, 2017; pp. 73–95. [Google Scholar]
- Litjens, G.; Sánchez, C.I.; Timofeeva, N.; Hermsen, M.; Nagtegaal, I.; Kovacs, I.; Hulsbergen-van de Kaa, C.; Bult, P.; van Ginneken, B.; van der Laak, J. Deep learning as a tool for increased accuracy and efficiency of histopathological diagnosis. Sci. Rep. 2016, 6, 26286. [Google Scholar] [CrossRef] [Green Version]
- Wölflein, G.; Um, I.H.; Harrison, D.J.; Arandjelović, O. HoechstGAN: Virtual Lymphocyte Staining Using Generative Adversarial Networks. arXiv 2022, arXiv:2210.06909. [Google Scholar]
- Rivenson, Y.; Wang, H.; Wei, Z.; de Haan, K.; Zhang, Y.; Wu, Y.; Günaydın, H.; Zuckerman, J.E.; Chong, T.; Sisk, A.E.; et al. Virtual histological staining of unlabelled tissue-autofluorescence images via deep learning. Nat. Biomed. Eng. 2019, 3, 466–477. [Google Scholar] [CrossRef] [Green Version]
- Sultana, F.; Sufian, A.; Dutta, P. Evolution of Image Segmentation using Deep Convolutional Neural Network: A Survey. Knowl. Based Syst. 2020, 201–202, 106062. [Google Scholar] [CrossRef]
- Rizzardi, A.E.; Johnson, A.T.; Vogel, R.I.; Pambuccian, S.E.; Henriksen, J.; Skubitz, A.P.; Metzger, G.J.; Schmechel, S.C. Quantitative comparison of immunohistochemical staining measured by digital image analysis versus pathologist visual scoring. Diagn. Pathol. 2012, 7, 42. [Google Scholar] [CrossRef] [Green Version]
- Bankhead, P.; Loughrey, M.B.; Fernández, J.A.; Dombrowski, Y.; McArt, D.G.; Dunne, P.D.; McQuaid, S.; Gray, R.T.; Murray, L.J.; Coleman, H.G.; et al. QuPath: Open source software for digital pathology image analysis. Sci. Rep. 2017, 7, 16878. [Google Scholar] [CrossRef] [Green Version]
- Schmidt, U.; Weigert, M.; Broaddus, C.; Myers, G. Cell Detection with Star-convex Polygons. In Proceedings of the MICCAI 2018: International Conference on Medical Image Computing & Computer Assisted Intervention, Granada, Spain, 16–20 September 2018. [Google Scholar]
- Loshchilov, I.; Hutter, F. Decoupled Weight Decay Regularization. arXiv 2017, arXiv:1711.05101. [Google Scholar]
- Cooper, J.; Arandjelović, O.; Harrison, D.J. Believe the HiPe: Hierarchical perturbation for fast, robust, and model-agnostic saliency mapping. Pattern Recognit. 2022, 129, 108743. [Google Scholar] [CrossRef]
- Zeiler, M.D.; Fergus, R. Visualizing and Understanding Convolutional Networks. In Computer Vision—ECCV 2014, Proceedings of the 13th European Conference, Zurich, Switzerland, 6–12 September 2014; Springer International Publishing: Cham, Switzerland, 2014; pp. 818–833. [Google Scholar]


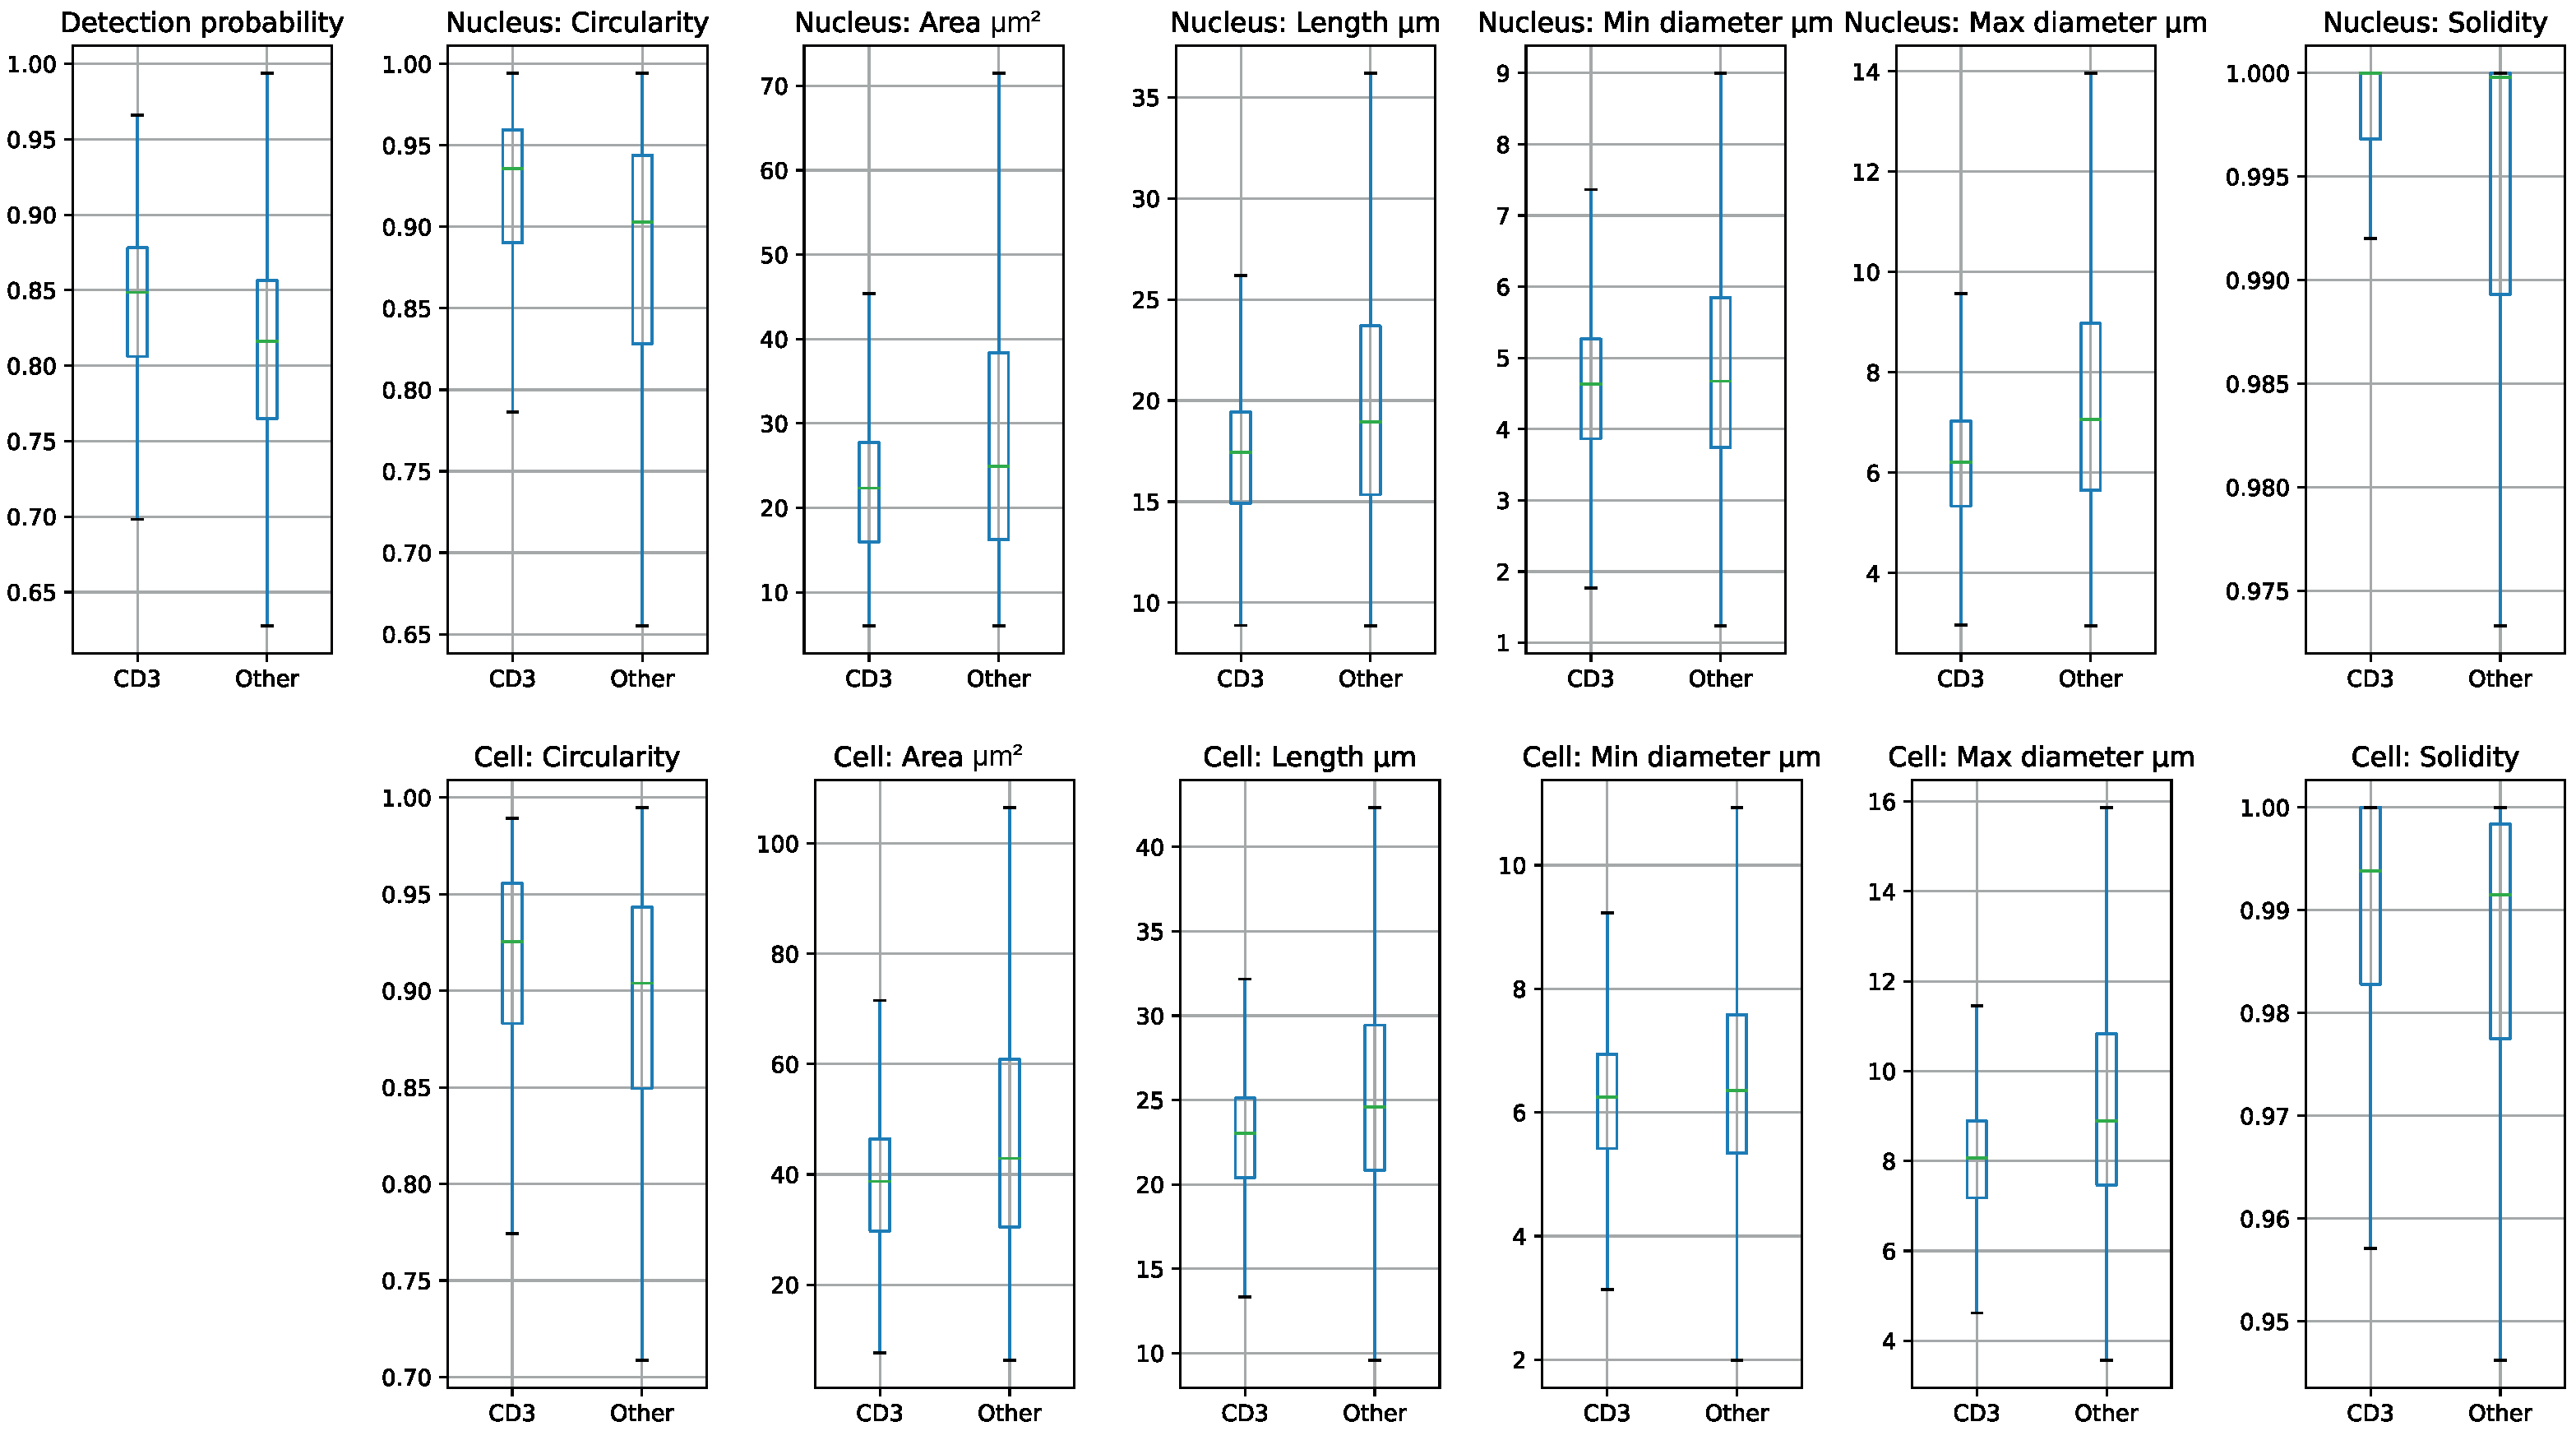
| Mean | Std | Min | 25% | 50% | 75% | Max | |
|---|---|---|---|---|---|---|---|
| Detection probability | 0.81 | 0.07 | 0.60 | 0.77 | 0.82 | 0.86 | 1.00 |
| Nucleus: Area µm | 29.70 | 21.23 | 6.00 | 16.20 | 24.33 | 35.83 | 1084.42 |
| Nucleus: Length µm | 19.74 | 6.40 | 8.84 | 15.28 | 18.58 | 22.84 | 252.07 |
| Nucleus: Circularity | 0.88 | 0.10 | 0.15 | 0.84 | 0.91 | 0.95 | 0.99 |
| Nucleus: Solidity | 0.99 | 0.03 | 0.32 | 0.99 | 1.00 | 1.00 | 1.00 |
| Nucleus: Max diameter µm | 7.39 | 2.57 | 2.95 | 5.59 | 6.86 | 8.65 | 60.04 |
| Nucleus: Min diameter µm | 4.90 | 1.65 | 1.23 | 3.76 | 4.67 | 5.71 | 47.91 |
| Cell: Area µm | 48.21 | 26.95 | 6.28 | 30.36 | 41.97 | 57.66 | 1200.90 |
| Cell: Length µm | 25.35 | 6.52 | 9.56 | 20.76 | 24.23 | 28.58 | 258.87 |
| Cell: Circularity | 0.89 | 0.08 | 0.16 | 0.85 | 0.91 | 0.95 | 0.99 |
| Cell: Solidity | 0.98 | 0.03 | 0.39 | 0.98 | 0.99 | 1.00 | 1.00 |
| Cell: Max diameter µm | 9.22 | 2.58 | 3.56 | 7.42 | 8.70 | 10.50 | 62.15 |
| Cell: Min diameter µm | 6.56 | 1.71 | 1.84 | 5.35 | 6.33 | 7.43 | 48.78 |
| Nucleus/Cell area ratio | 0.58 | 0.09 | 0.27 | 0.52 | 0.58 | 0.64 | 1.00 |
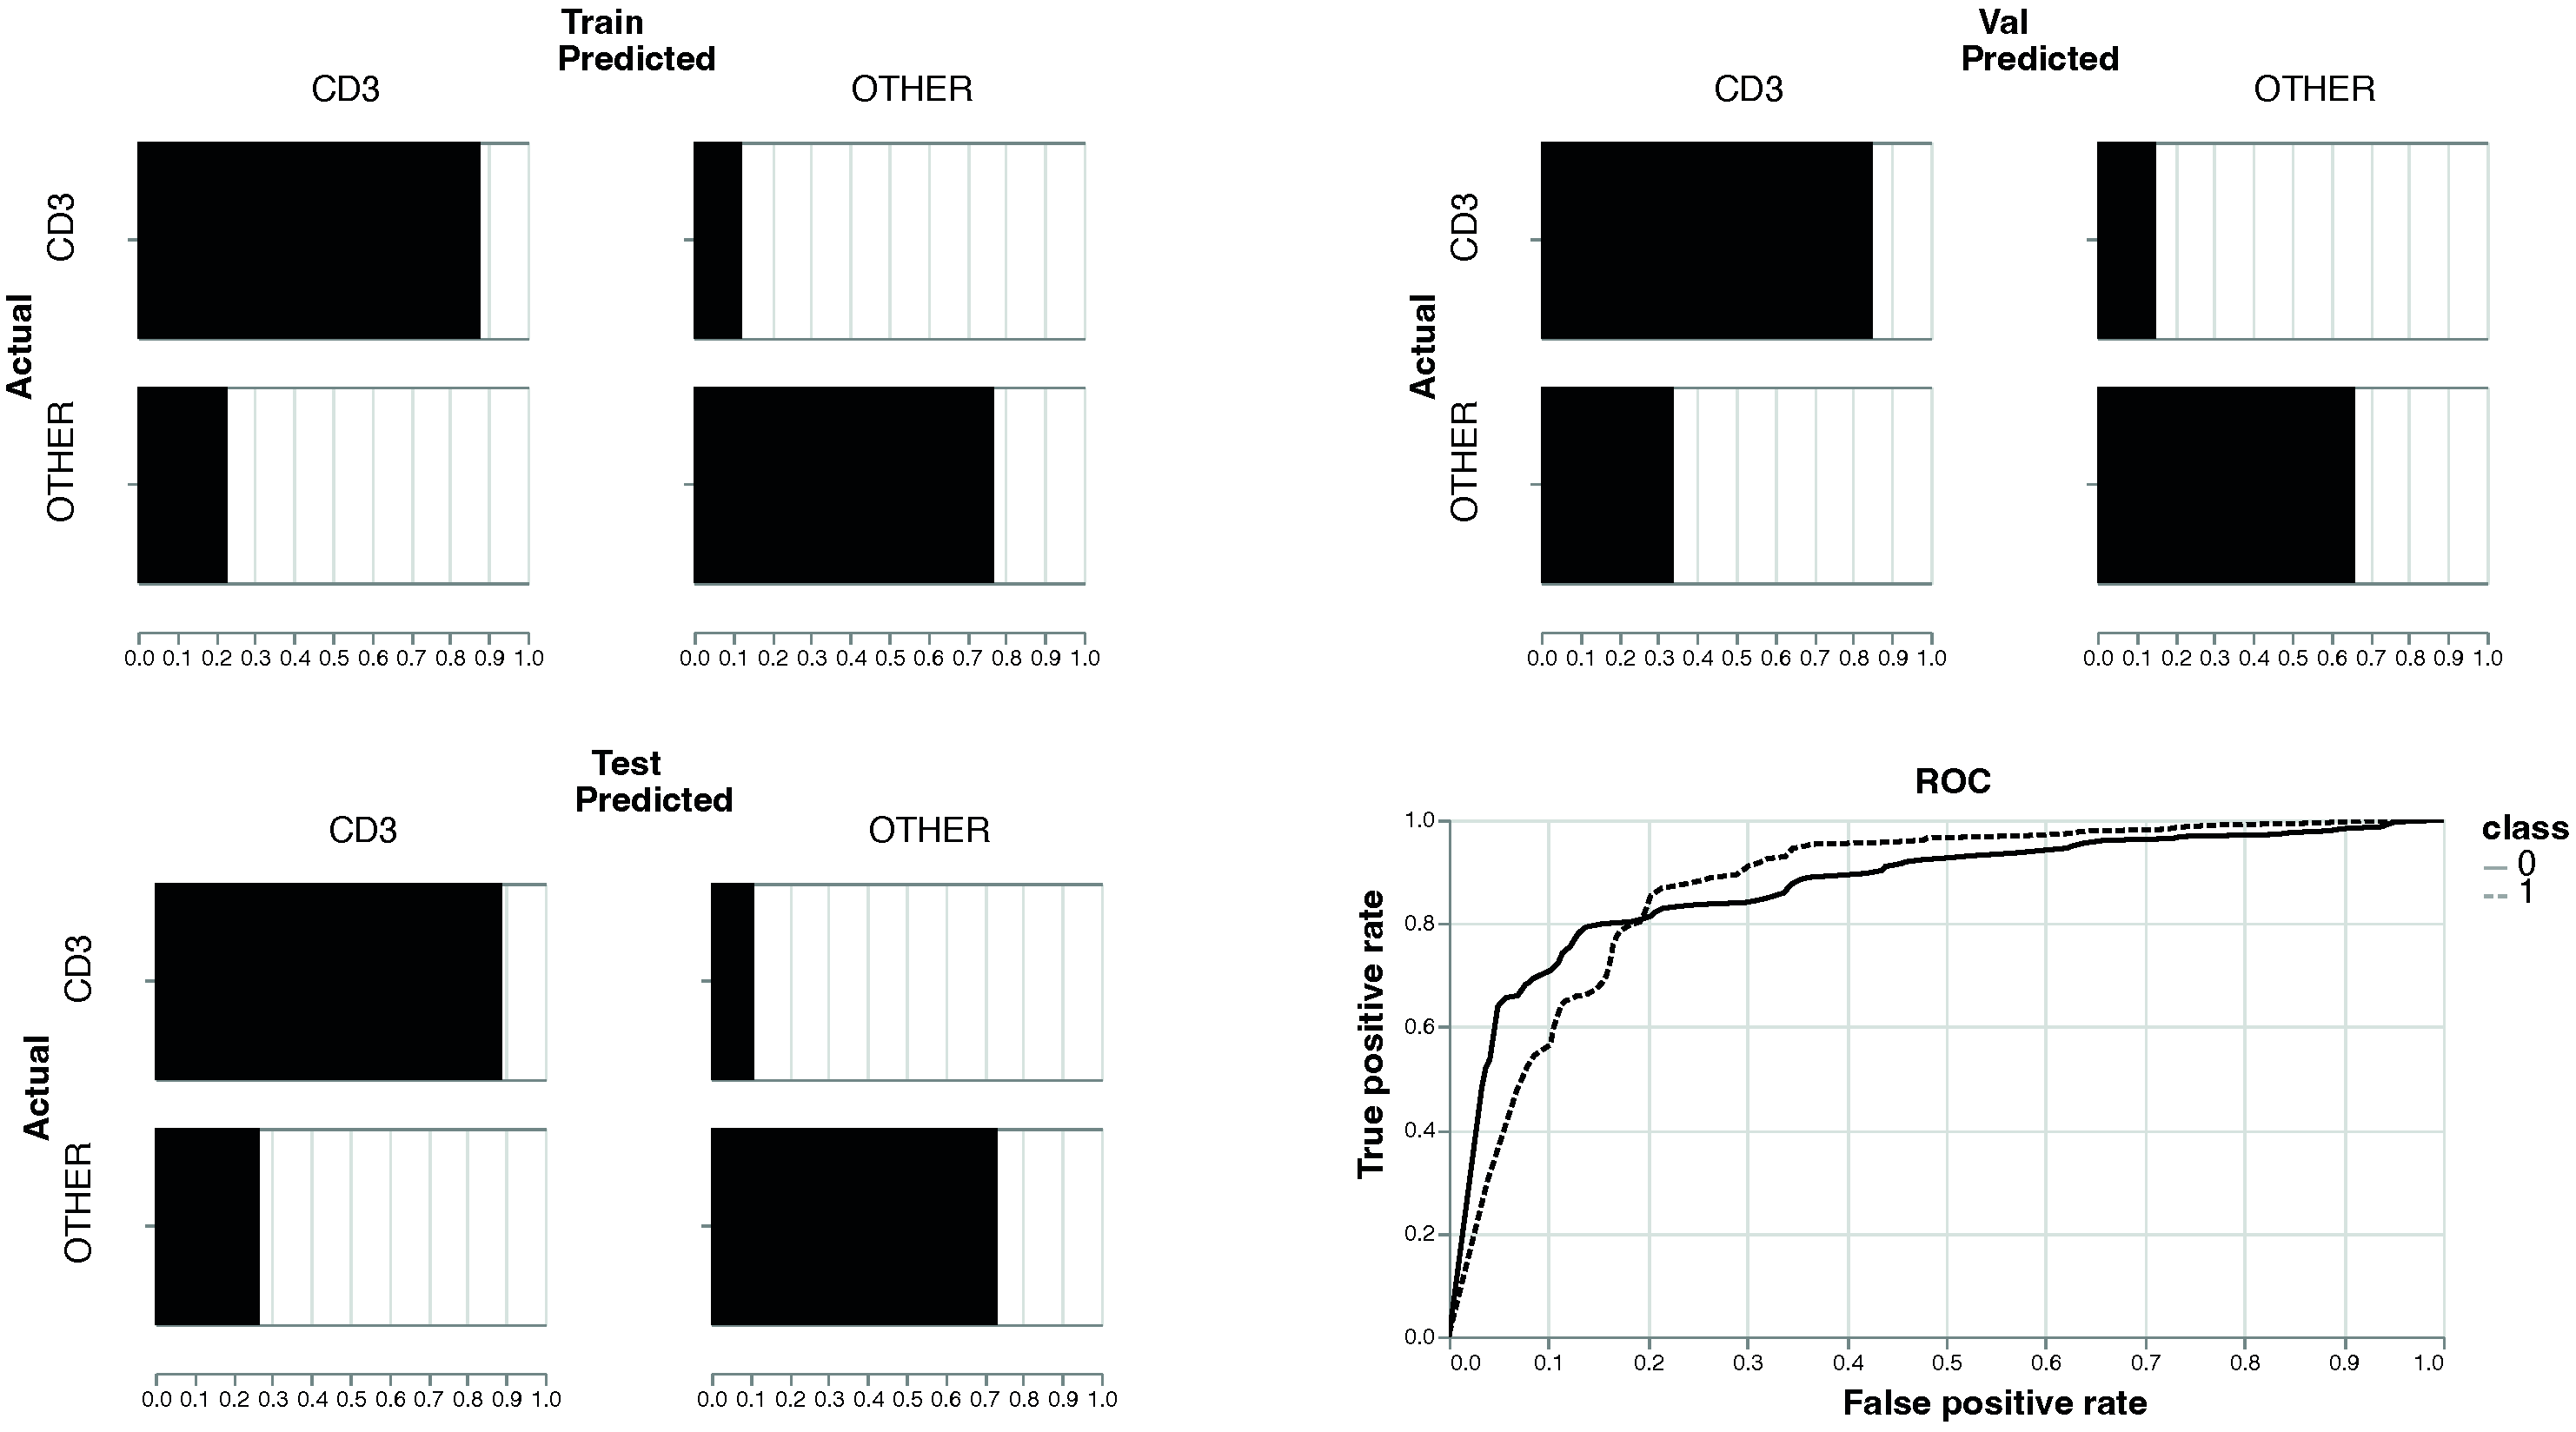
| F1 | Precision | Recall | Accuracy | |
|---|---|---|---|---|
| Training | 0.802 | 0.806 | 0.803 | 0.802 |
| Validation | 0.773 | 0793 | 0.776 | 0.776 |
| Test | 0.805 | 0.807 | 0.805 | 0.805 |
Publisher’s Note: MDPI stays neutral with regard to jurisdictional claims in published maps and institutional affiliations. |
© 2022 by the authors. Licensee MDPI, Basel, Switzerland. This article is an open access article distributed under the terms and conditions of the Creative Commons Attribution (CC BY) license (https://creativecommons.org/licenses/by/4.0/).
Share and Cite
Cooper, J.; Um, I.H.; Arandjelović, O.; Harrison, D.J. Lymphocyte Classification from Hoechst Stained Slides with Deep Learning. Cancers 2022, 14, 5957. https://doi.org/10.3390/cancers14235957
Cooper J, Um IH, Arandjelović O, Harrison DJ. Lymphocyte Classification from Hoechst Stained Slides with Deep Learning. Cancers. 2022; 14(23):5957. https://doi.org/10.3390/cancers14235957
Chicago/Turabian StyleCooper, Jessica, In Hwa Um, Ognjen Arandjelović, and David J. Harrison. 2022. "Lymphocyte Classification from Hoechst Stained Slides with Deep Learning" Cancers 14, no. 23: 5957. https://doi.org/10.3390/cancers14235957